Loading
by BlastRoom
Reading ocean temperature, salinity and density profiles and the dissolved salt composition, and reasoning about what changes seawater's salinity and physical properties.
#earth_space_science
30 questions
One question set, multiple game modes. Tap any game to see it in action. Not sure which to pick?
Answer to place stones and capture territory.
Outrun the snow together.
Earn blasts, then hunt the other team.
Answer to earn energy, then climb.

The class blasts through walls together.
Bid on mystery lots. Most money wins.
Sell tours. Nice, standard, or a total scam.

Answer, restock, and serve the rush.
More correct answers pulls the rope your way.
Answer, then shoot down the alien wave.
Answer, then tap to leap the frozen ridge.
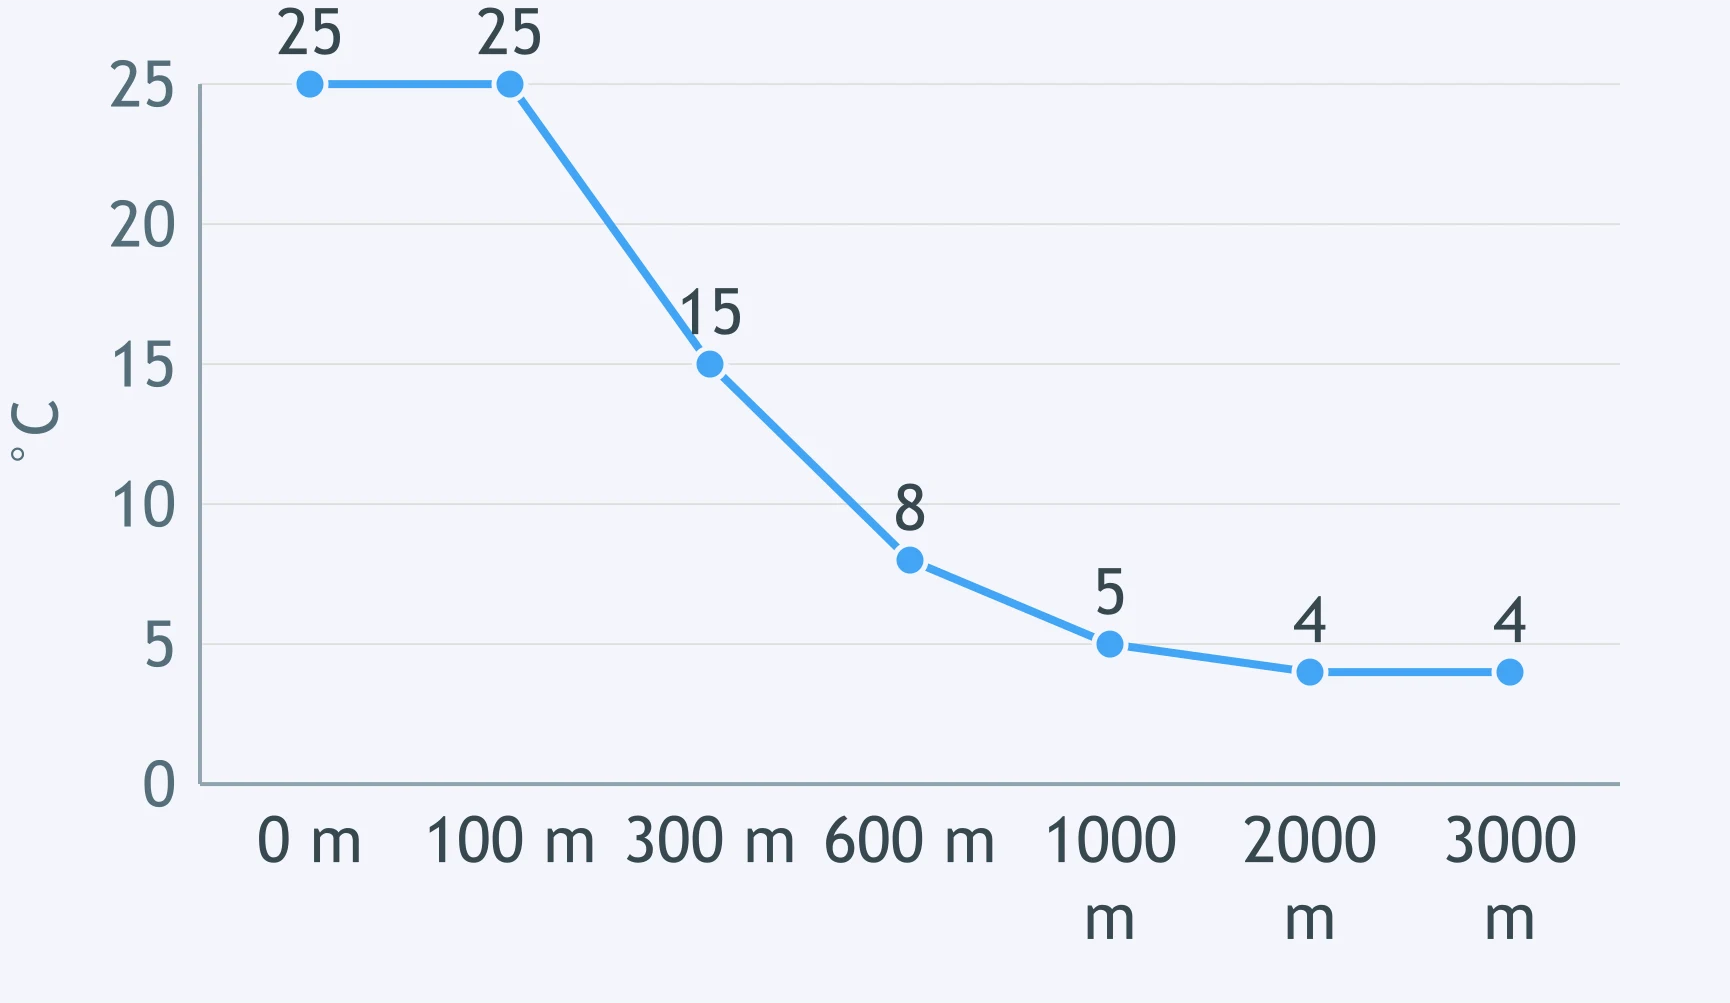
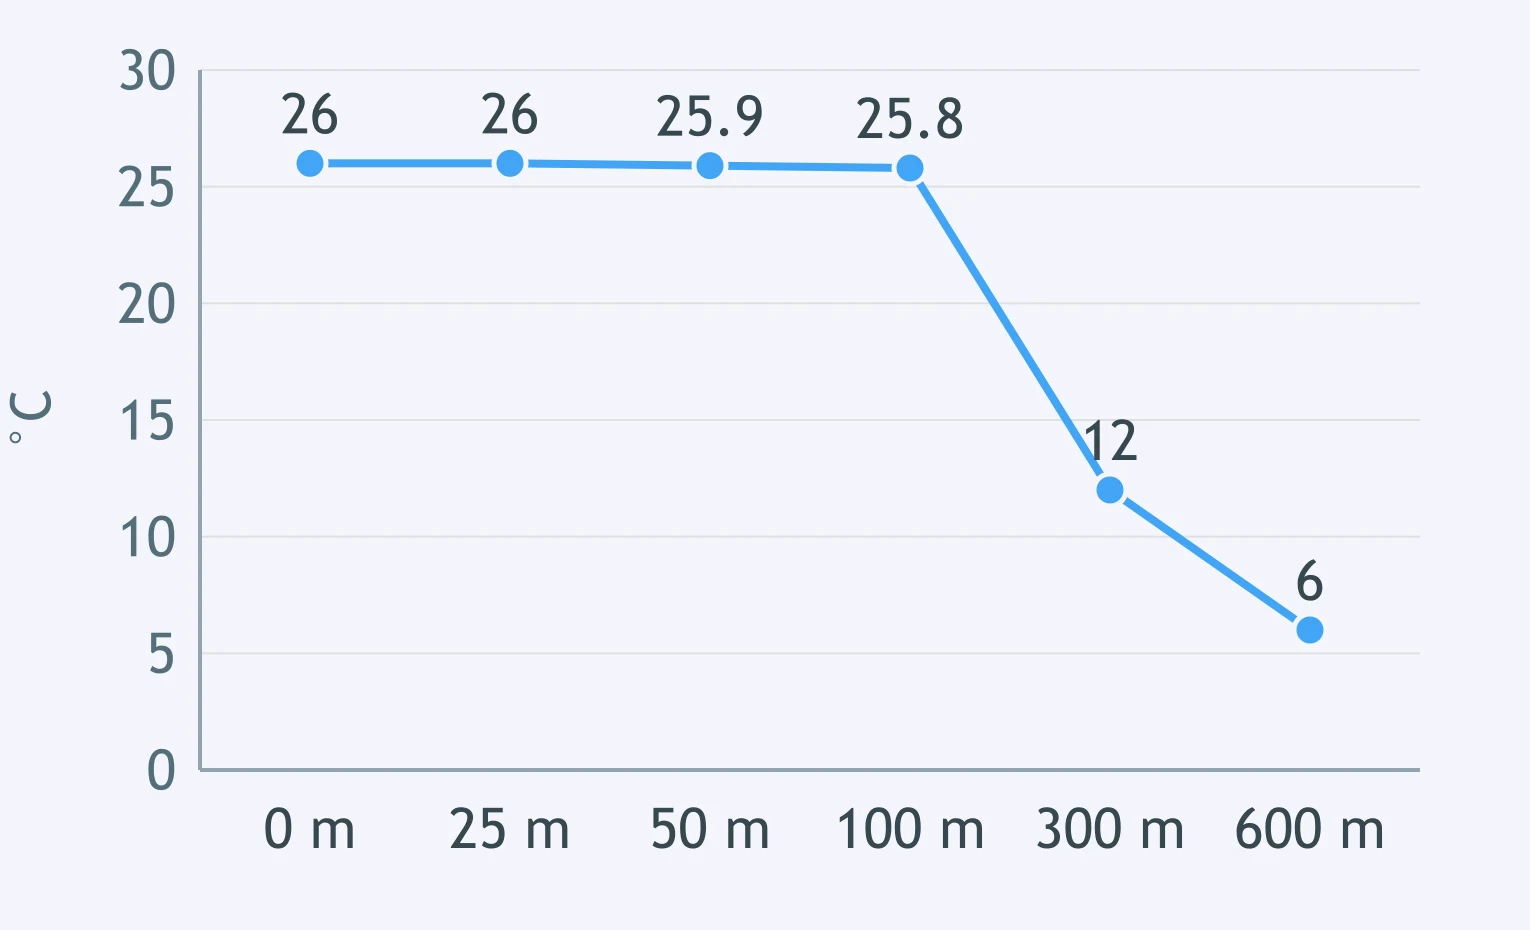
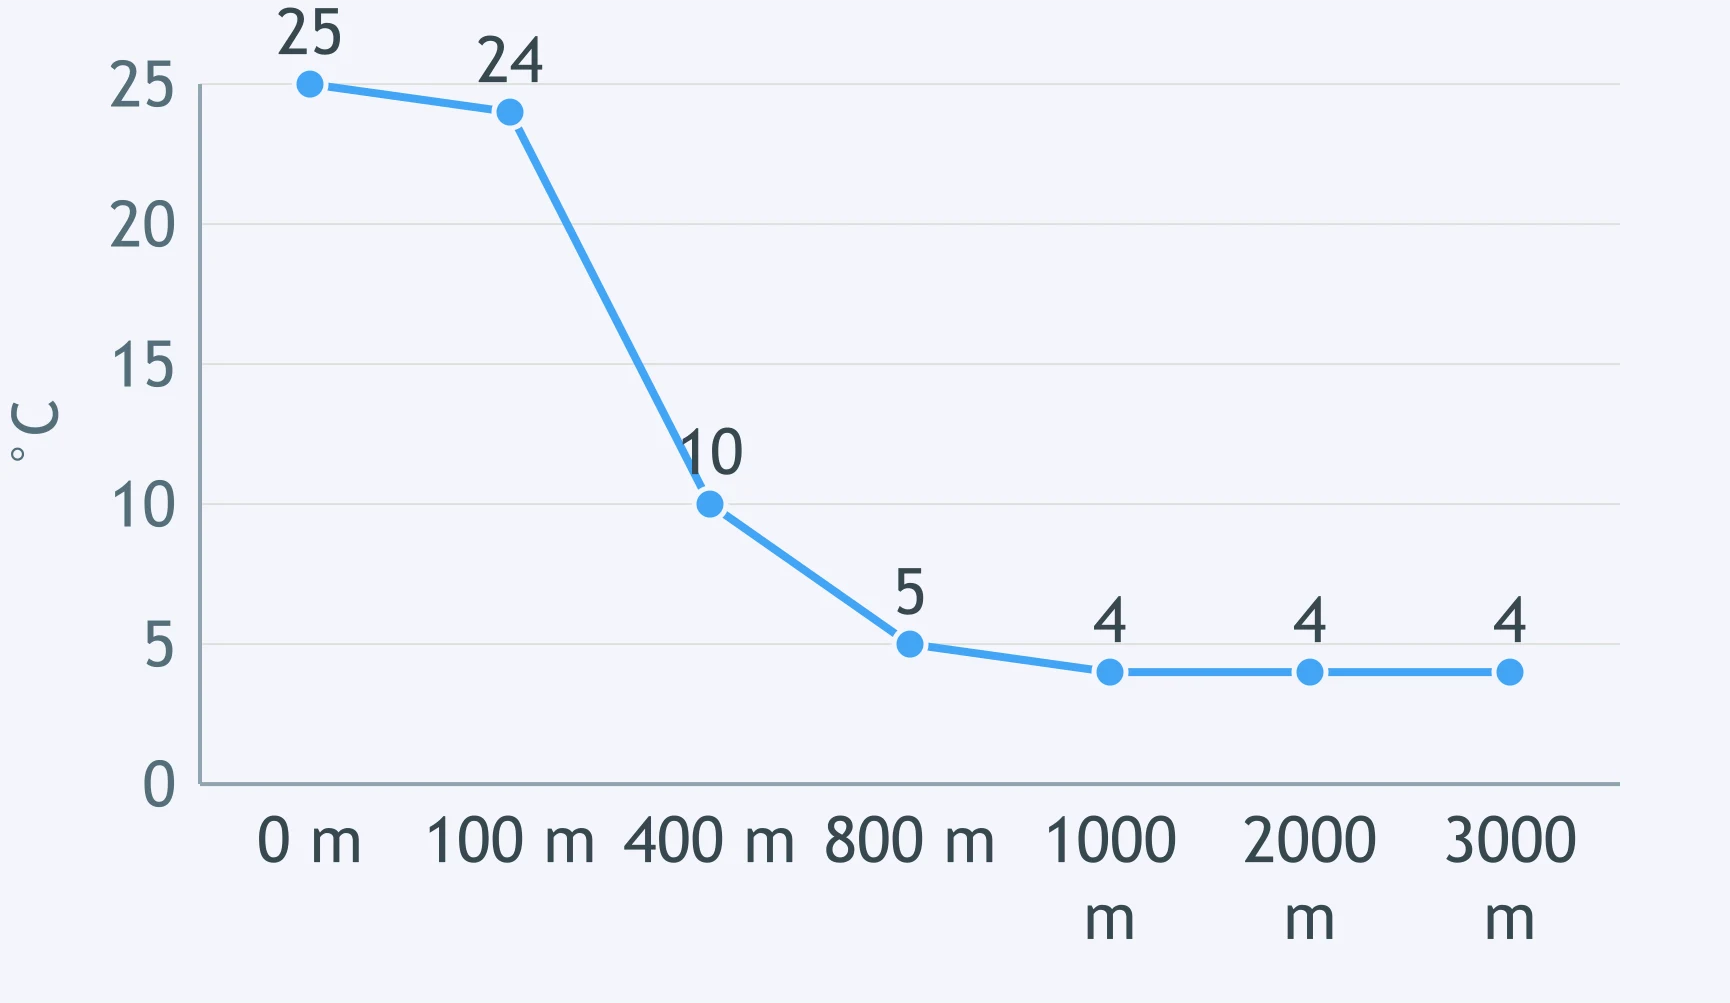
The graph plots ocean temperature against depth. What is the zone between 100 and 1,000 meters called?
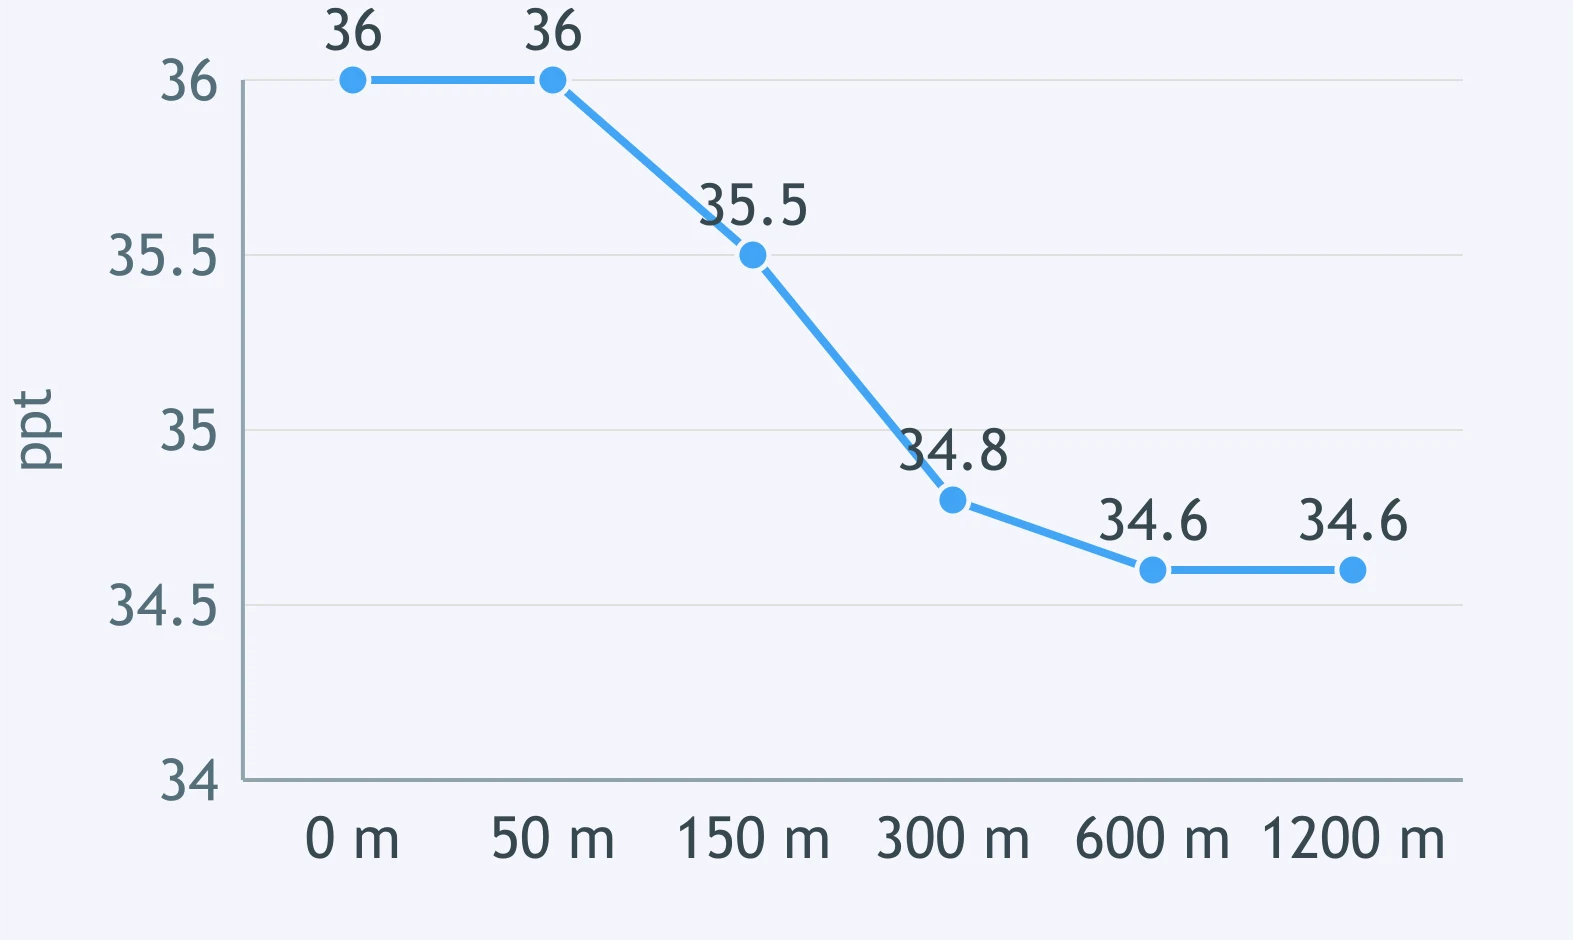
The graph plots seawater salinity against depth. What is the zone between 50 and 600 meters called?
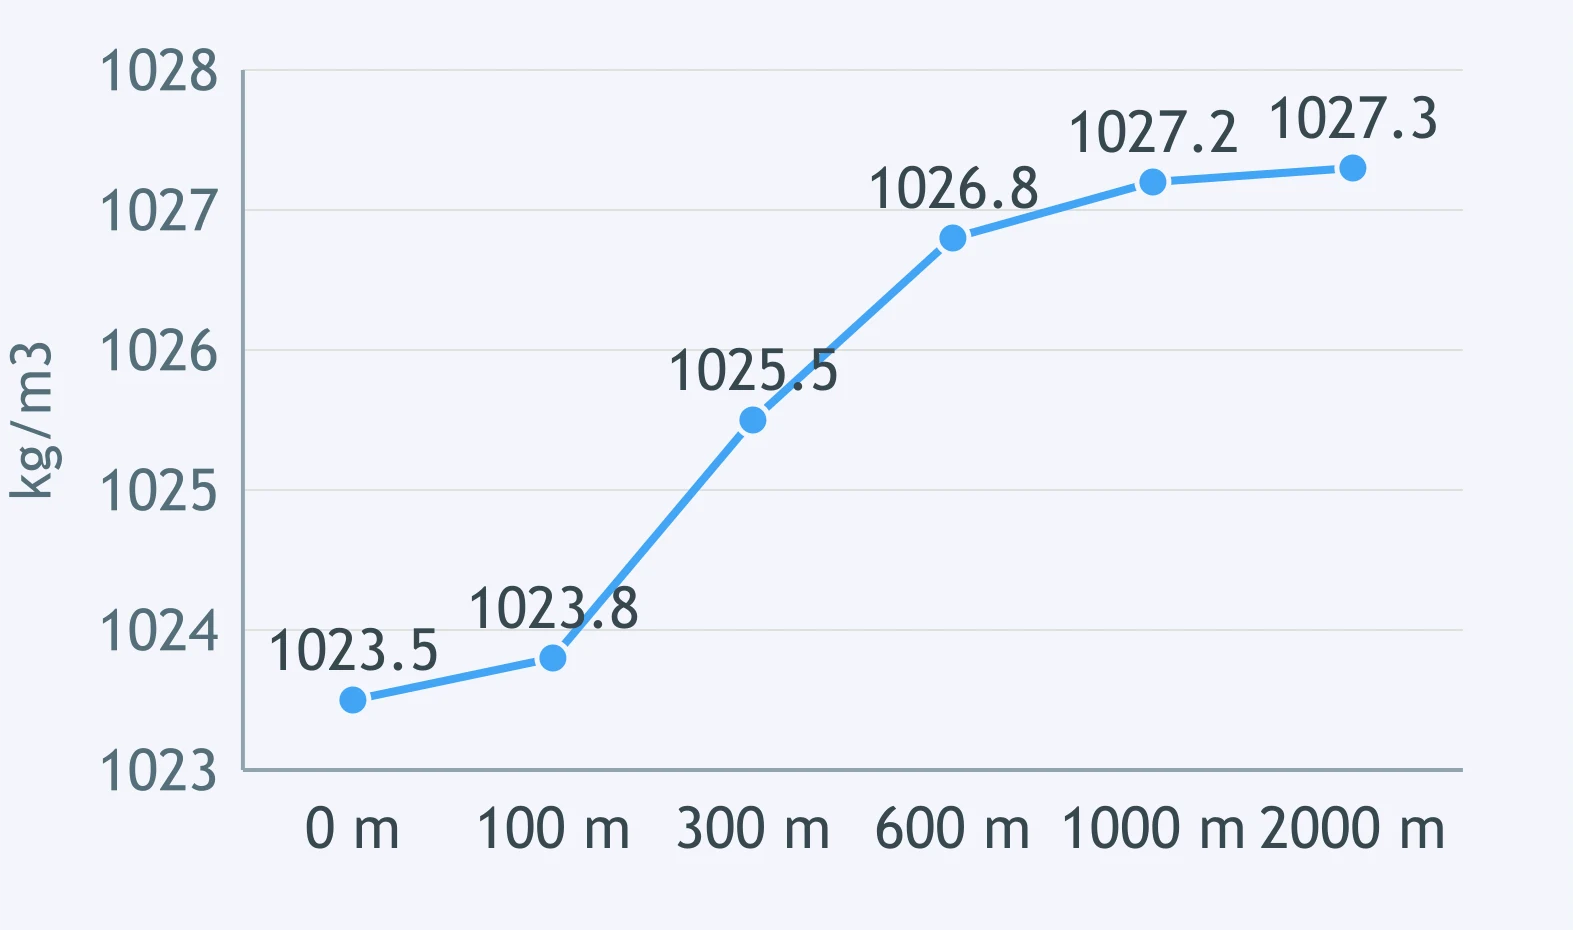
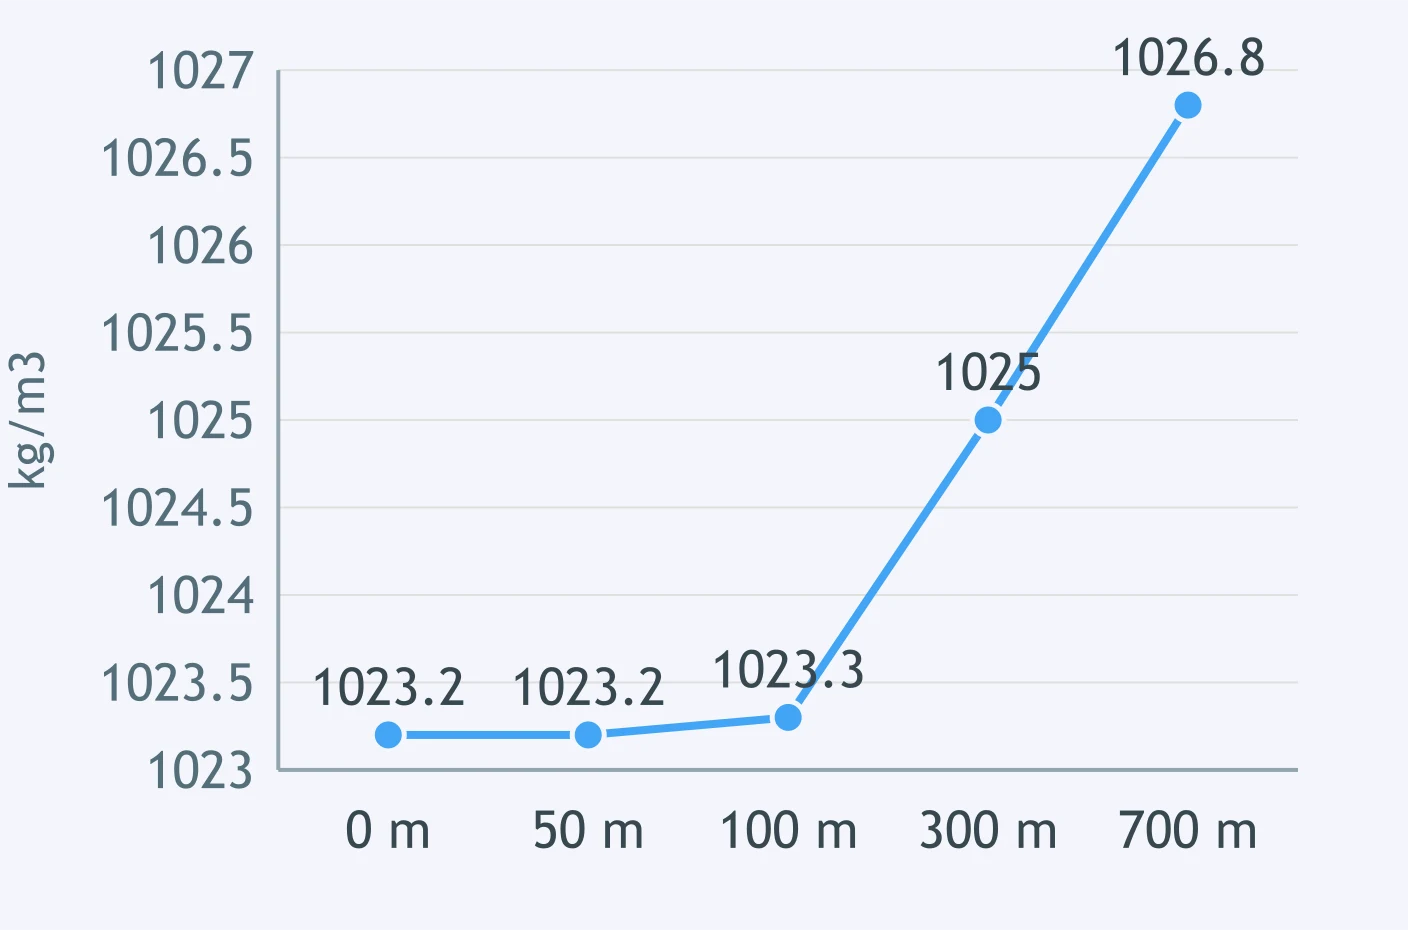
The graph plots seawater density against depth. What is the zone between 100 and 1,000 meters called?
The graph plots ocean temperature against depth. What is the zone from the surface down to 100 meters called?
The graph plots seawater salinity against depth. What is the zone the graph shows below 700 meters called?
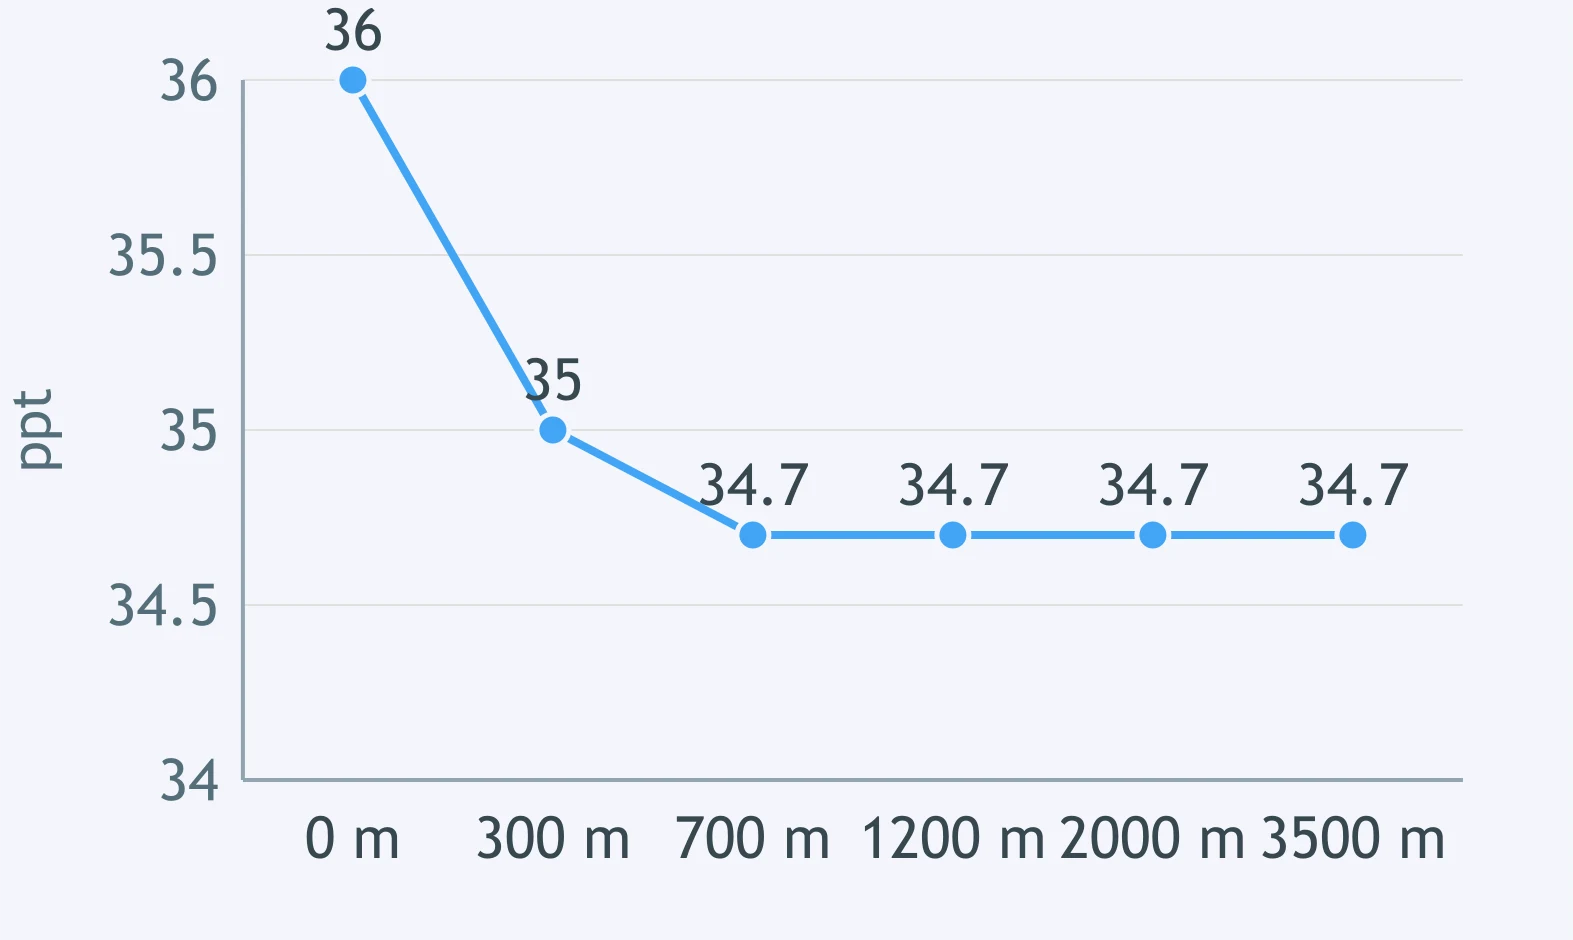
The graph plots ocean temperature against depth. What is the zone the graph shows below 1,000 meters called?
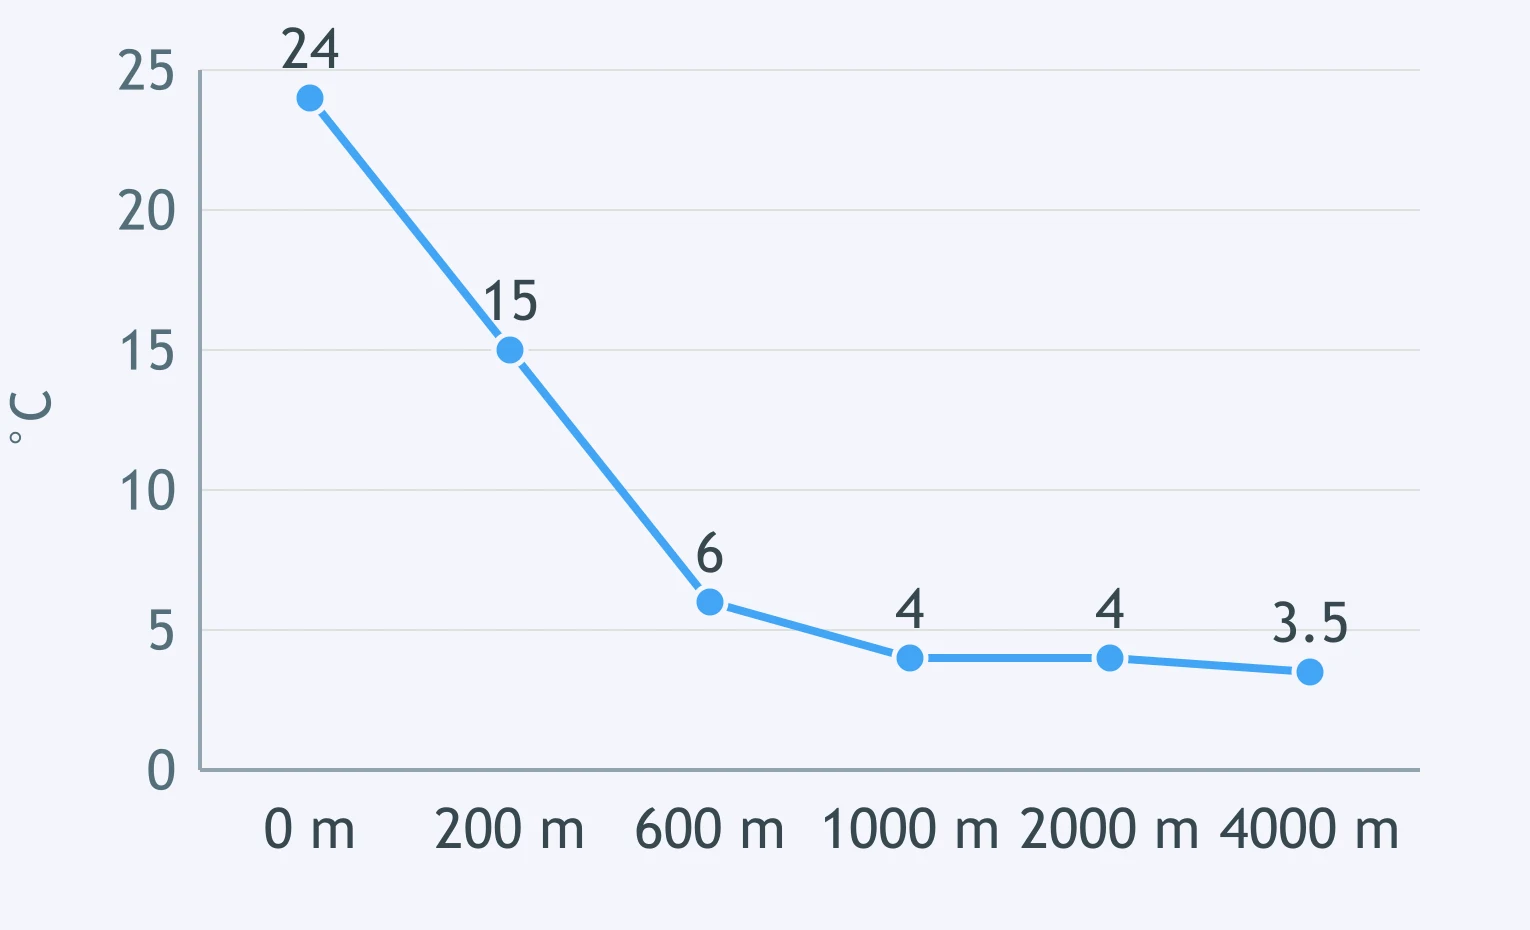
The graph plots seawater density against depth. What is the zone the graph shows from the surface down to 100 meters called?
The graph plots ocean temperature against depth. At about what depth does the curve level off into the cold, nearly constant deep zone?
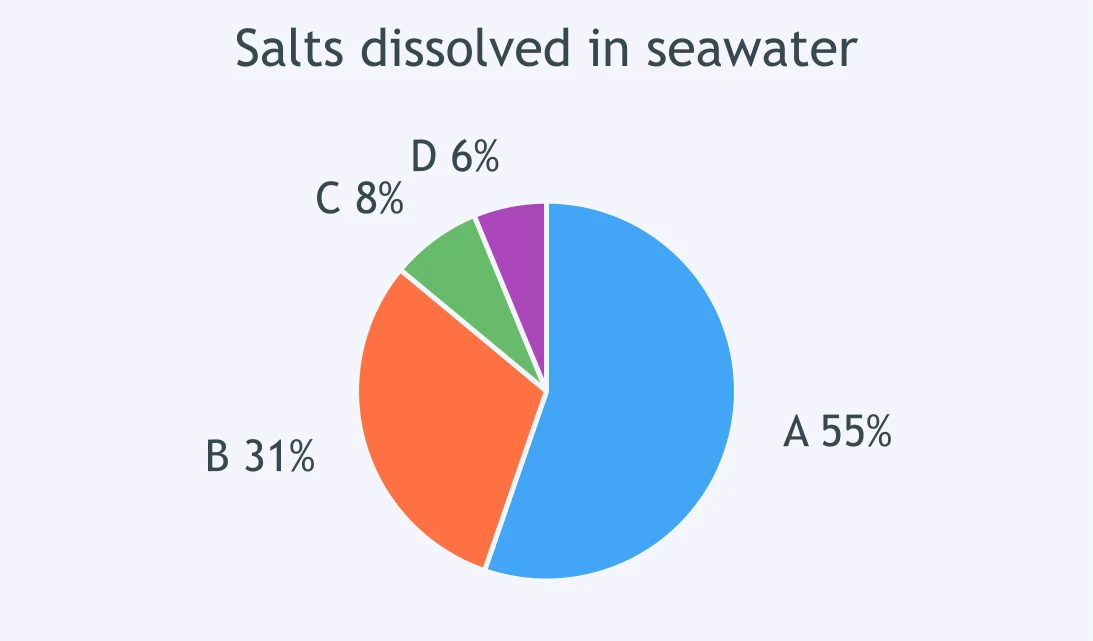
A pie chart shows the salts dissolved in seawater as four lettered slices. Slice A fills about 55 percent of the chart and slice B about 31 percent. Which two ions do slices A and B represent?
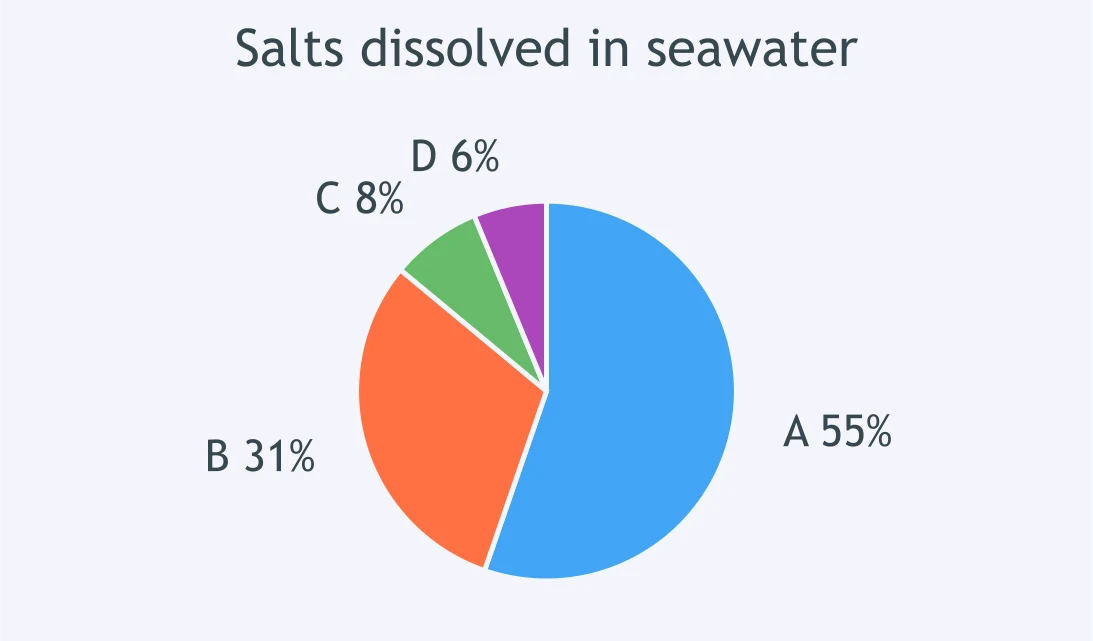
A pie chart shows the salts dissolved in seawater as four lettered slices. After A and B, the next-largest is slice C at about 7.75 percent. Which ion does slice C represent?
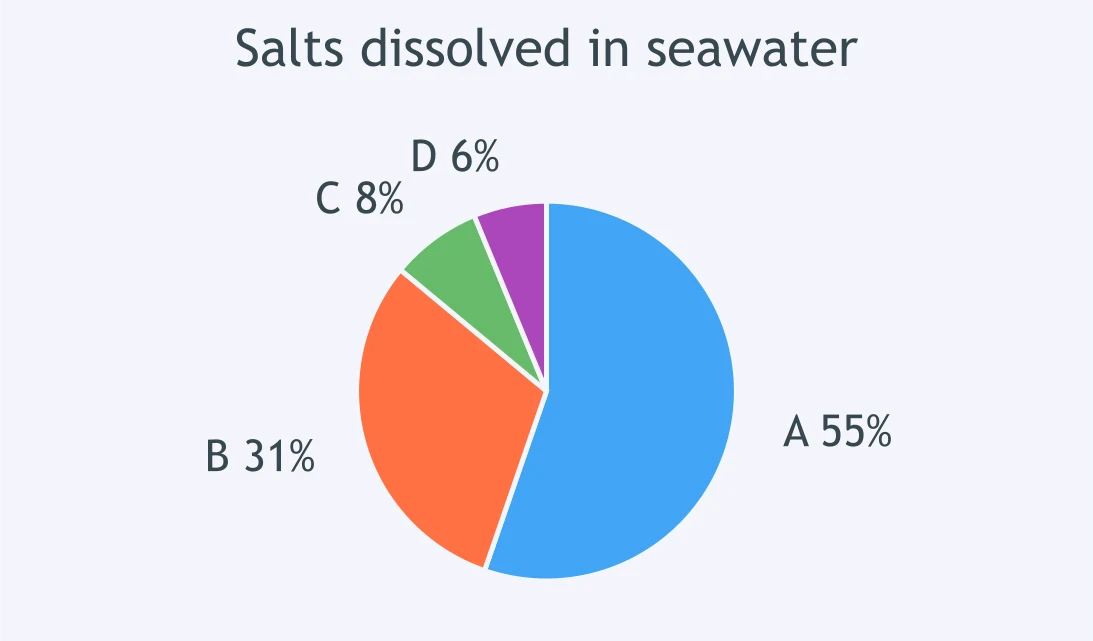
A pie chart shows the salts dissolved in seawater as four lettered slices. Slice D, about 6.22 percent, combines magnesium, calcium, potassium, bicarbonate and bromide. Which of these ions has the largest individual share within slice D?
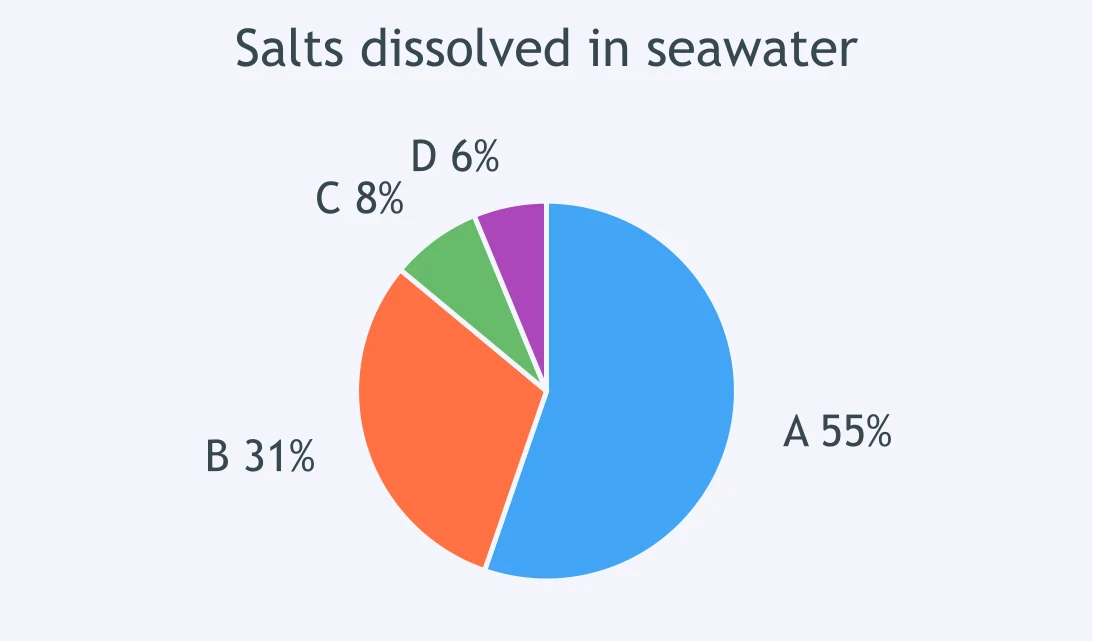
A pie chart shows the salts dissolved in seawater as four lettered slices. Slice C is about 7.75 percent and slice D is about 6.22 percent. About how many percentage points larger is slice C than slice D?
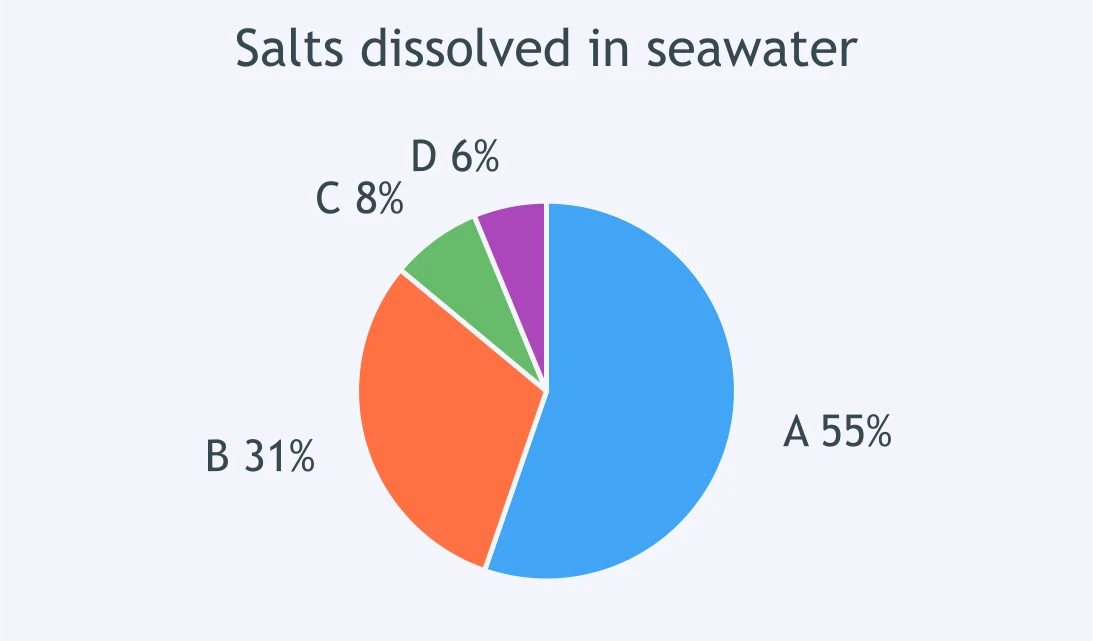
A pie chart shows the salts dissolved in seawater as four lettered slices. About what percent of the total do slices A and B make up together?
The Red Sea has high evaporation and almost no river inflow, so its surface water is very salty. Which change would lower its surface salinity?
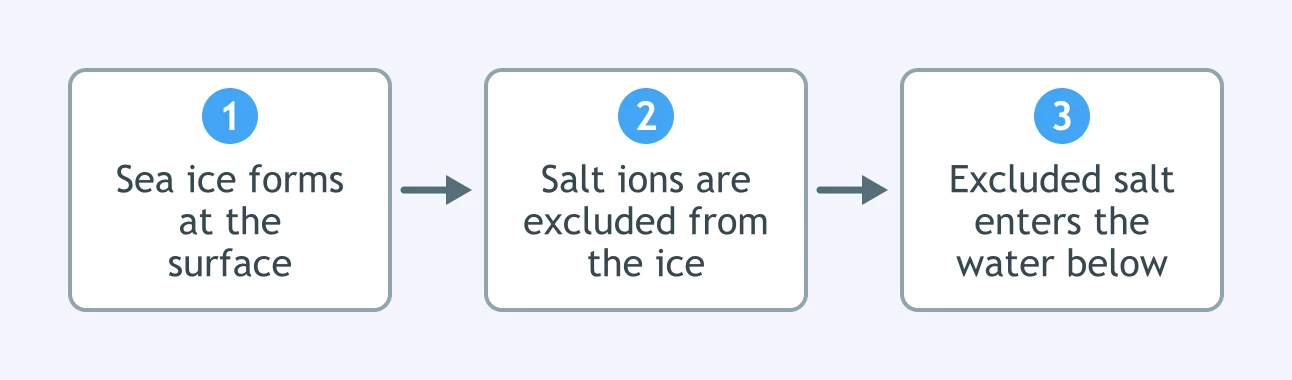
The diagram shows what happens as sea ice forms in a polar region. Based on this process, what happens to the salinity of the water just below the new ice?
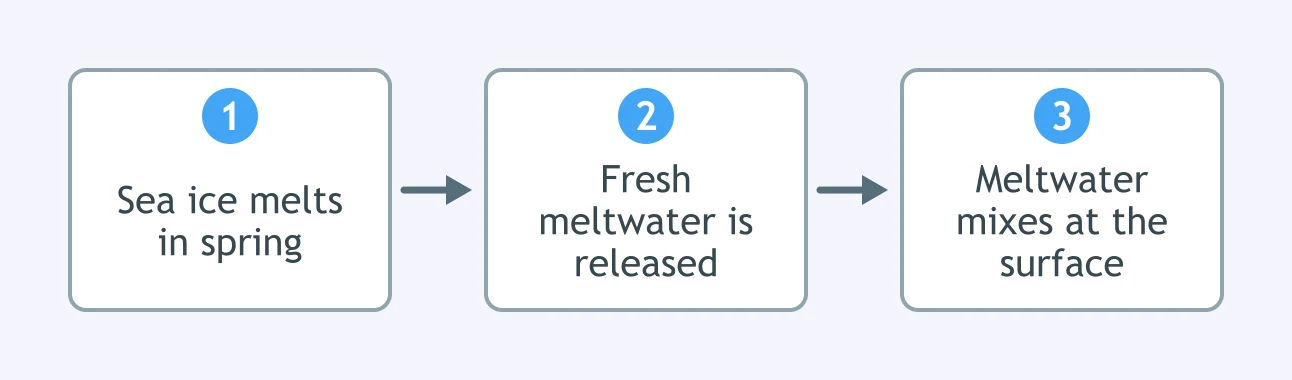
The diagram shows what happens as sea ice melts in spring. Based on this process, what happens to the salinity of the surface water near the melting ice?
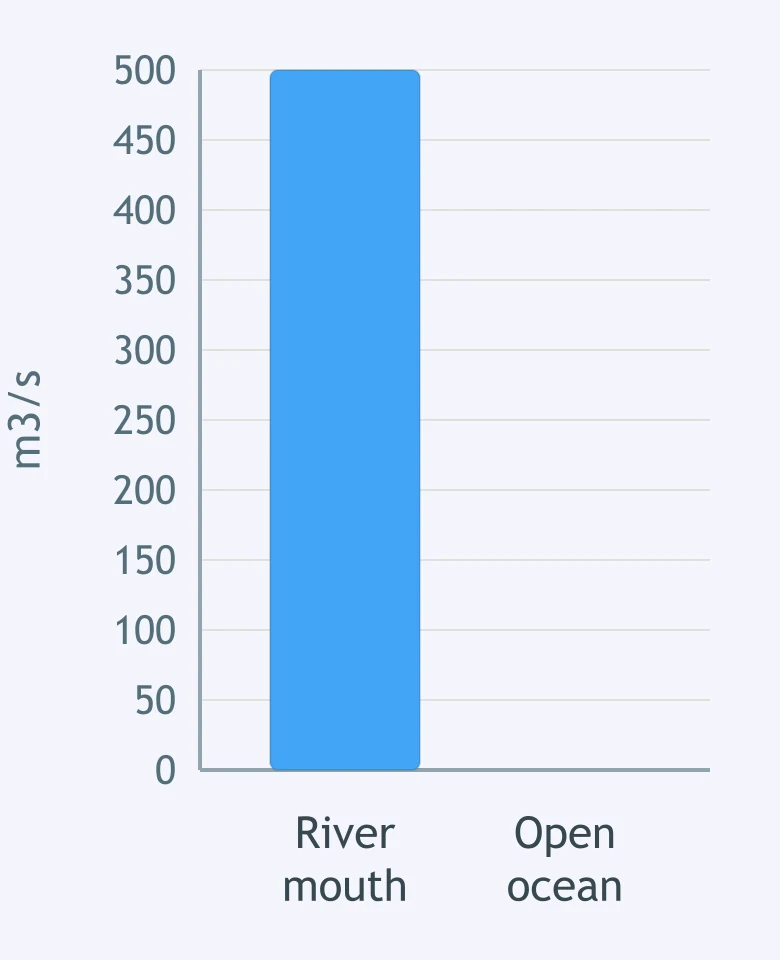
The graph shows the rate of freshwater inflow at two ocean locations, in cubic meters per second. Which location has the lower surface salinity?
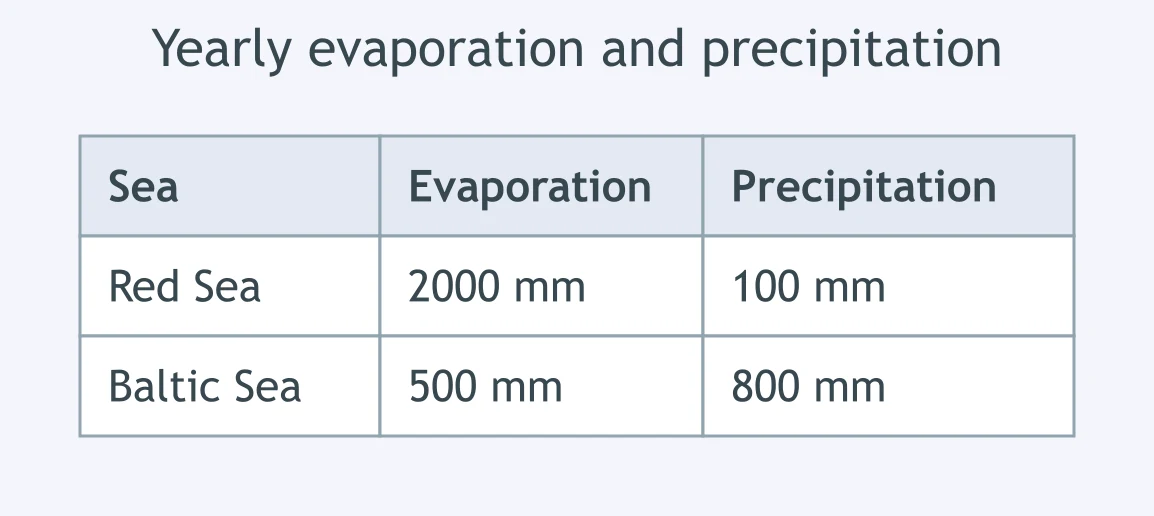
The table shows yearly evaporation and precipitation for the Red Sea and the Baltic Sea, in millimeters per year. Which sea has the higher surface salinity?
One region of open ocean lies under a band of heavy year-round rainfall near the equator, and a second lies within a subtropical gyre where evaporation greatly exceeds rainfall. Which region has the higher surface salinity?
Near Antarctica, seawater becomes very cold and, through brine rejection during sea ice formation, very salty and dense. What does this dense water then do?
A 1,000 gram sample of seawater is evaporated to dryness in a laboratory dish and leaves 36 grams of dissolved salts behind. What is the salinity of this sample?
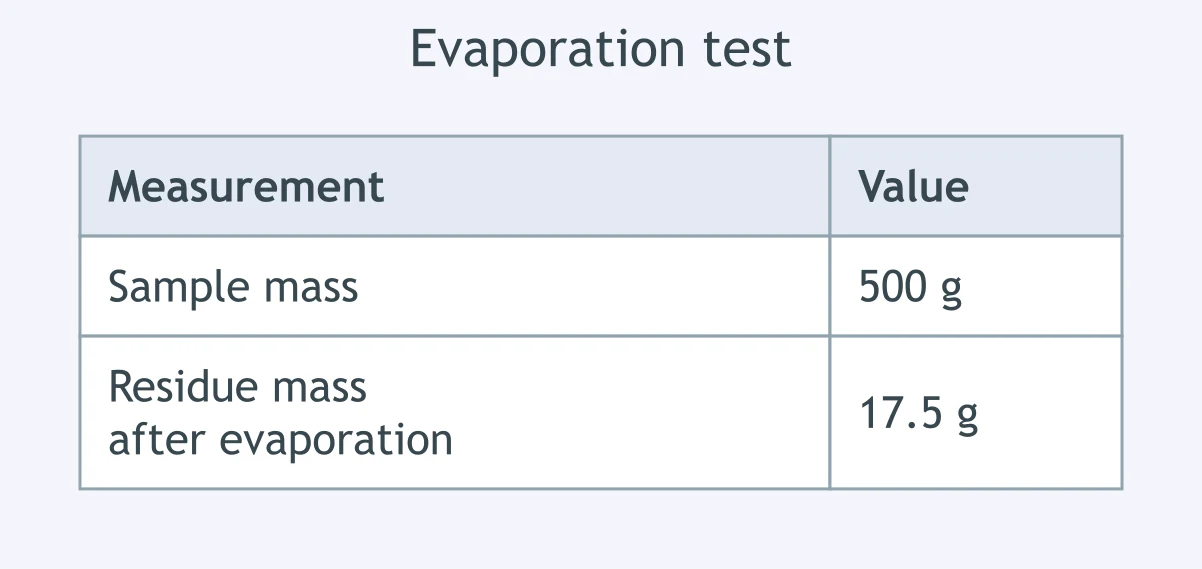
The table shows the results of evaporating a seawater sample to dryness. What is the salinity of this sample, in parts per thousand?
A 2,000 gram sample of seawater has a salinity of 35 parts per thousand. How many grams of dissolved salt does it contain?
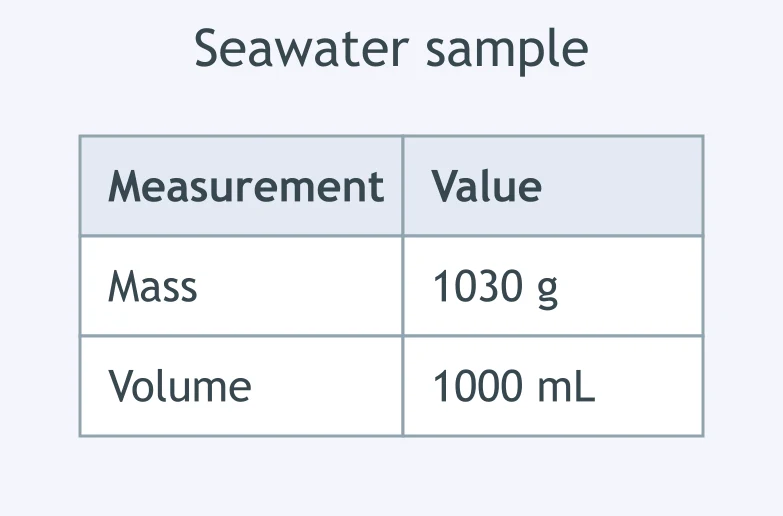
The table shows measurements for a seawater sample. What is its density, in grams per milliliter?
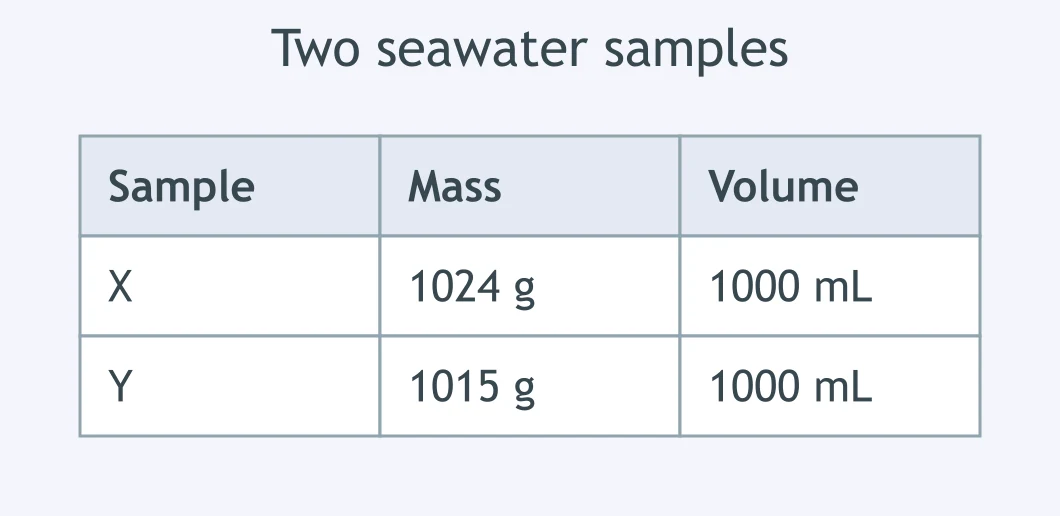
The table shows the mass and volume of two seawater samples. Which sample is denser?
Seawater freezes at a lower temperature than pure water and reaches its greatest density at a lower temperature as well. Which property of seawater accounts for both of these differences?
A block of pure ice does not conduct electricity, but a sample of liquid seawater conducts electricity readily. What property of seawater allows it to conduct?
Two water samples have the same temperature, but one is seawater and one is fresh water. Which sample is denser, and why?
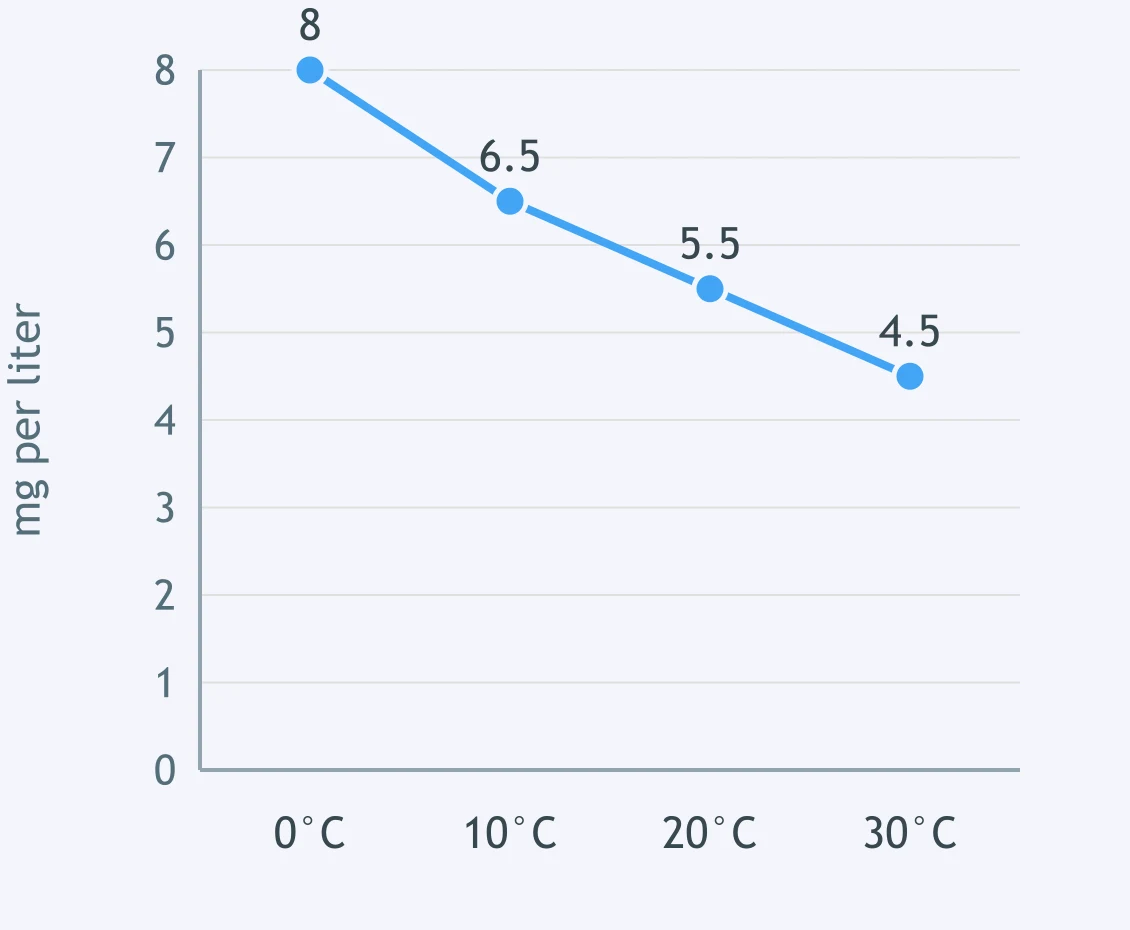
The graph shows how much dissolved oxygen a sample of seawater can hold at different temperatures. Based on the graph, what happens to seawater's ability to hold dissolved gases as temperature rises?
A swimmer floats more easily in ocean water than in a fresh water lake. What property of seawater explains this greater buoyancy?
Crack the passcode before the zombies get in.
Answer, then swat bugs for bonus points.
Race through questions at your own speed.
Same question on every screen. Fastest wins.

Pick a tile, answer, hit bonuses and steals.
Waves and Coasts
40 questions