Loading
by BlastRoom
Students interpret fossil-record patterns, evidence, timing, causes, and consequences of the Big Five mass extinctions.
#earth_space_science
20 questions
One question set, multiple game modes. Tap any game to see it in action. Not sure which to pick?
Answer to place stones and capture territory.
Outrun the snow together.
Earn blasts, then hunt the other team.
Answer to earn energy, then climb.

The class blasts through walls together.
Bid on mystery lots. Most money wins.
Sell tours. Nice, standard, or a total scam.

Answer, restock, and serve the rush.
More correct answers pulls the rope your way.
Answer, then shoot down the alien wave.
Answer, then tap to leap the frozen ridge.
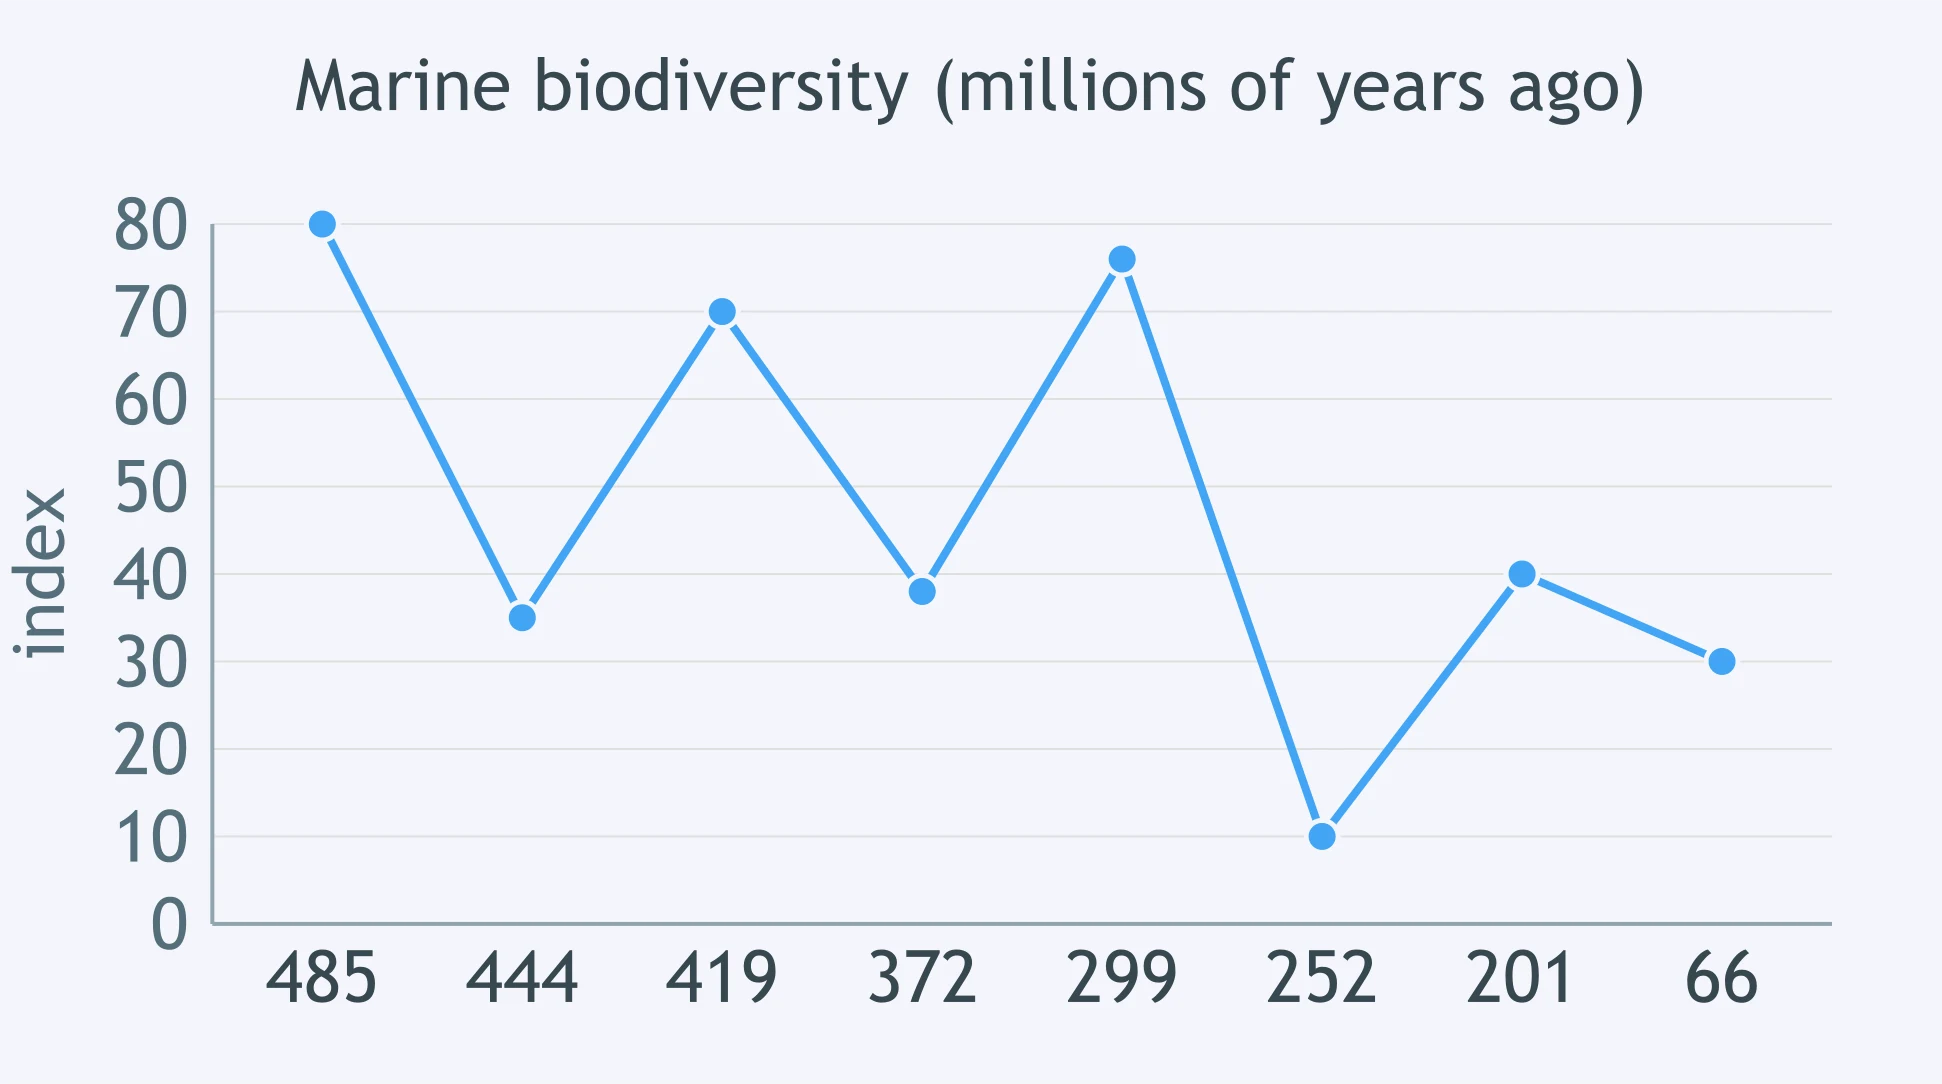
Use the biodiversity curve. Which boundary does its deepest trough mark?
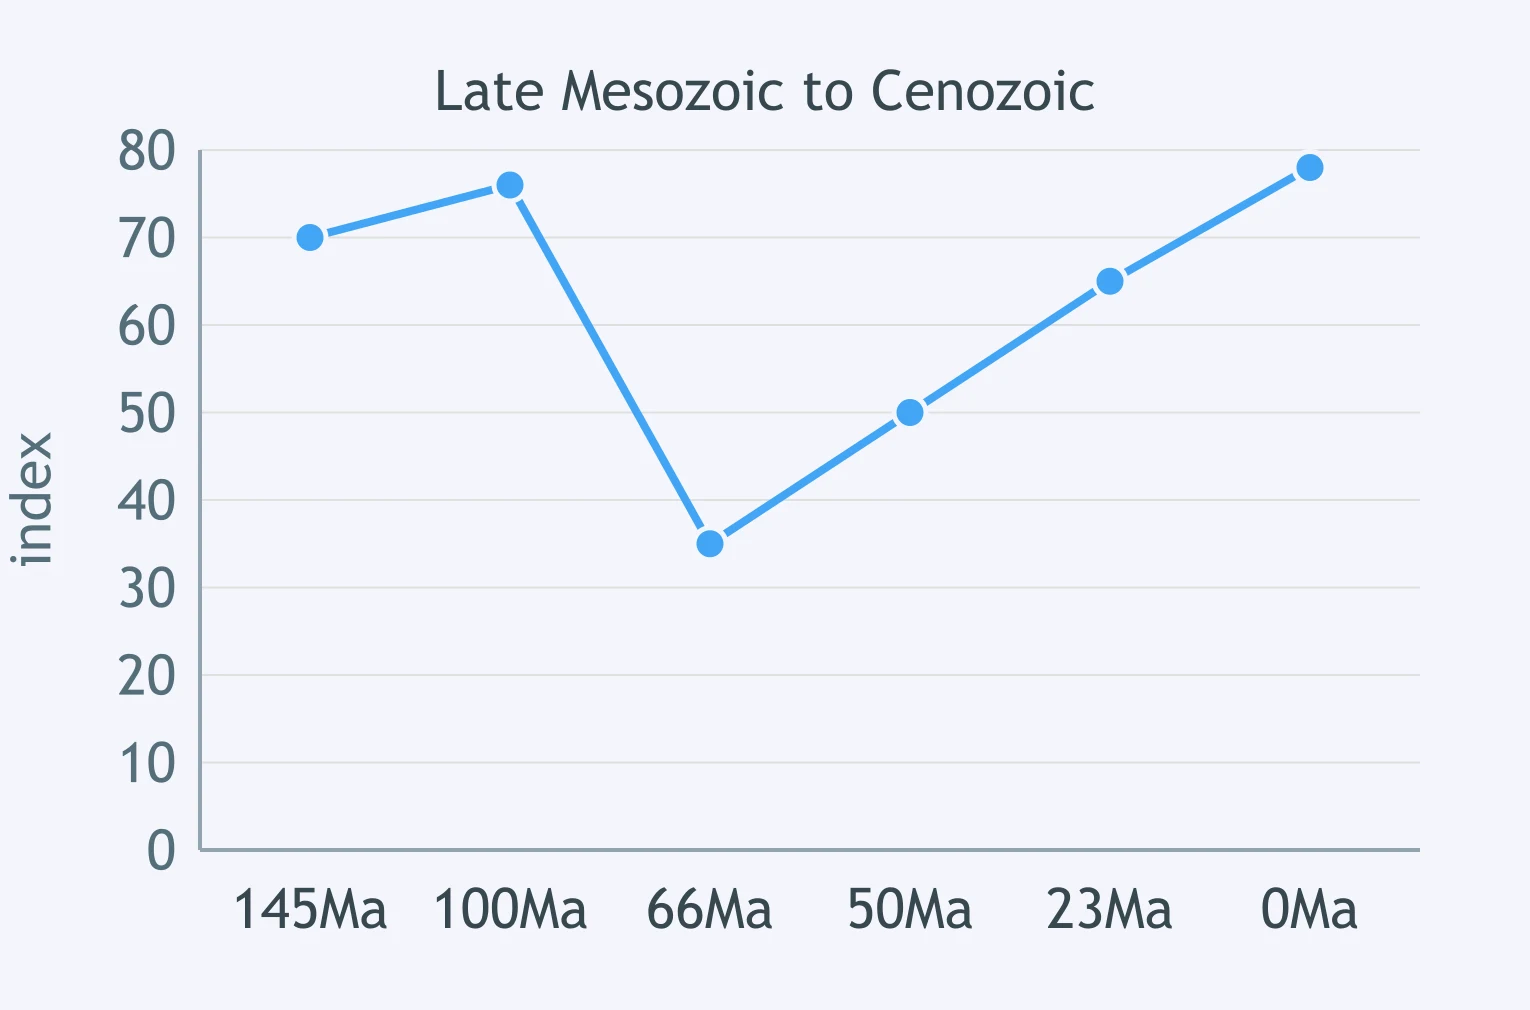
On the late Mesozoic curve, marine biodiversity drops sharply at 66 Ma. Which event is shown by that drop?
The early Paleozoic graph shows the first major biodiversity crash at about 444 Ma. Which mass extinction is represented?
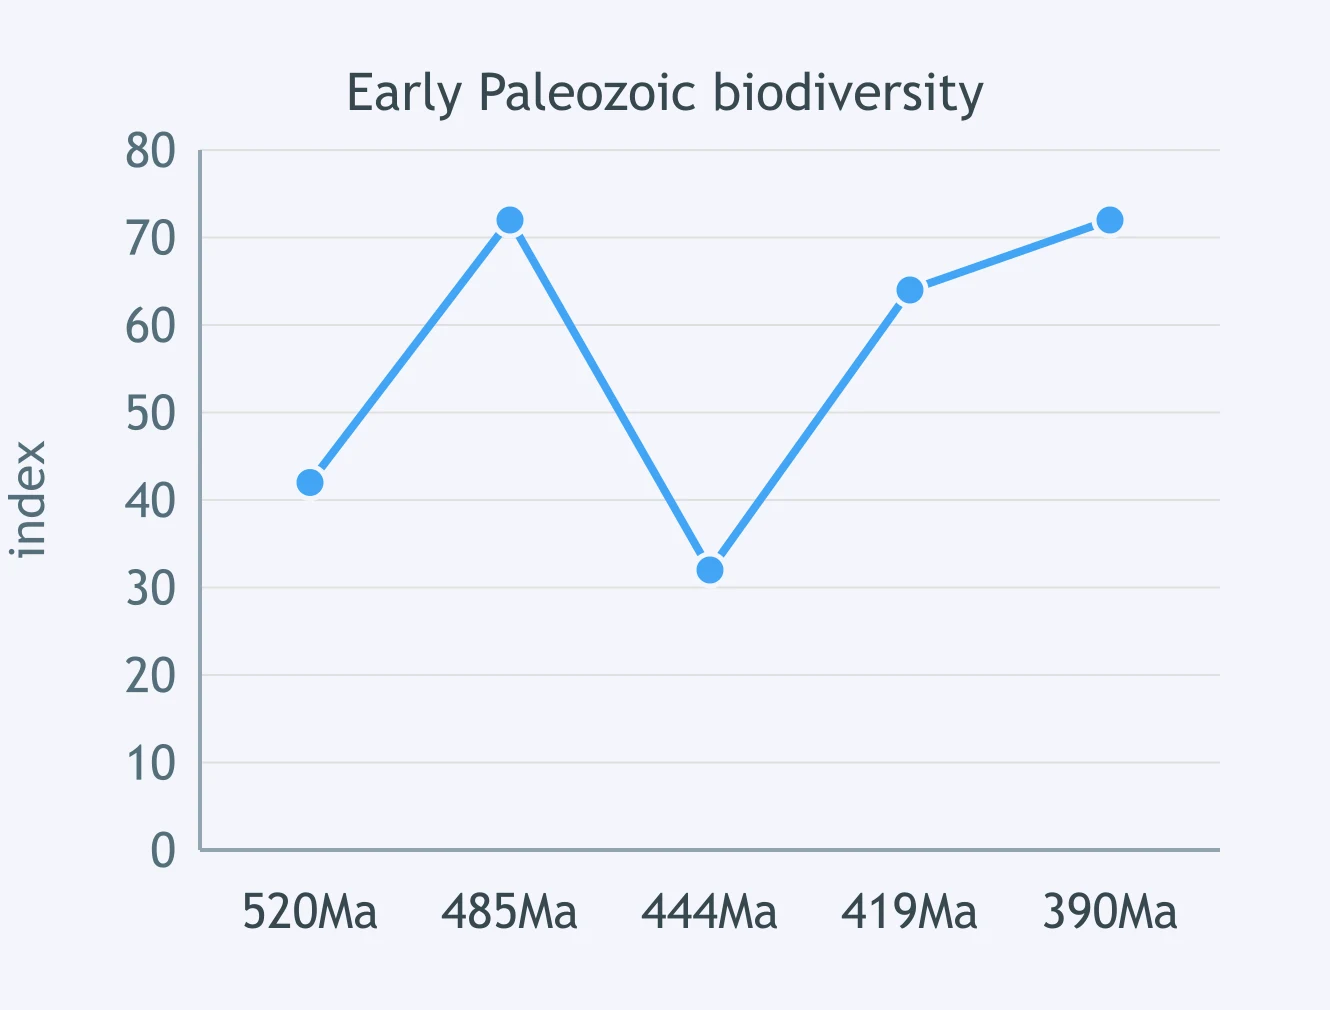
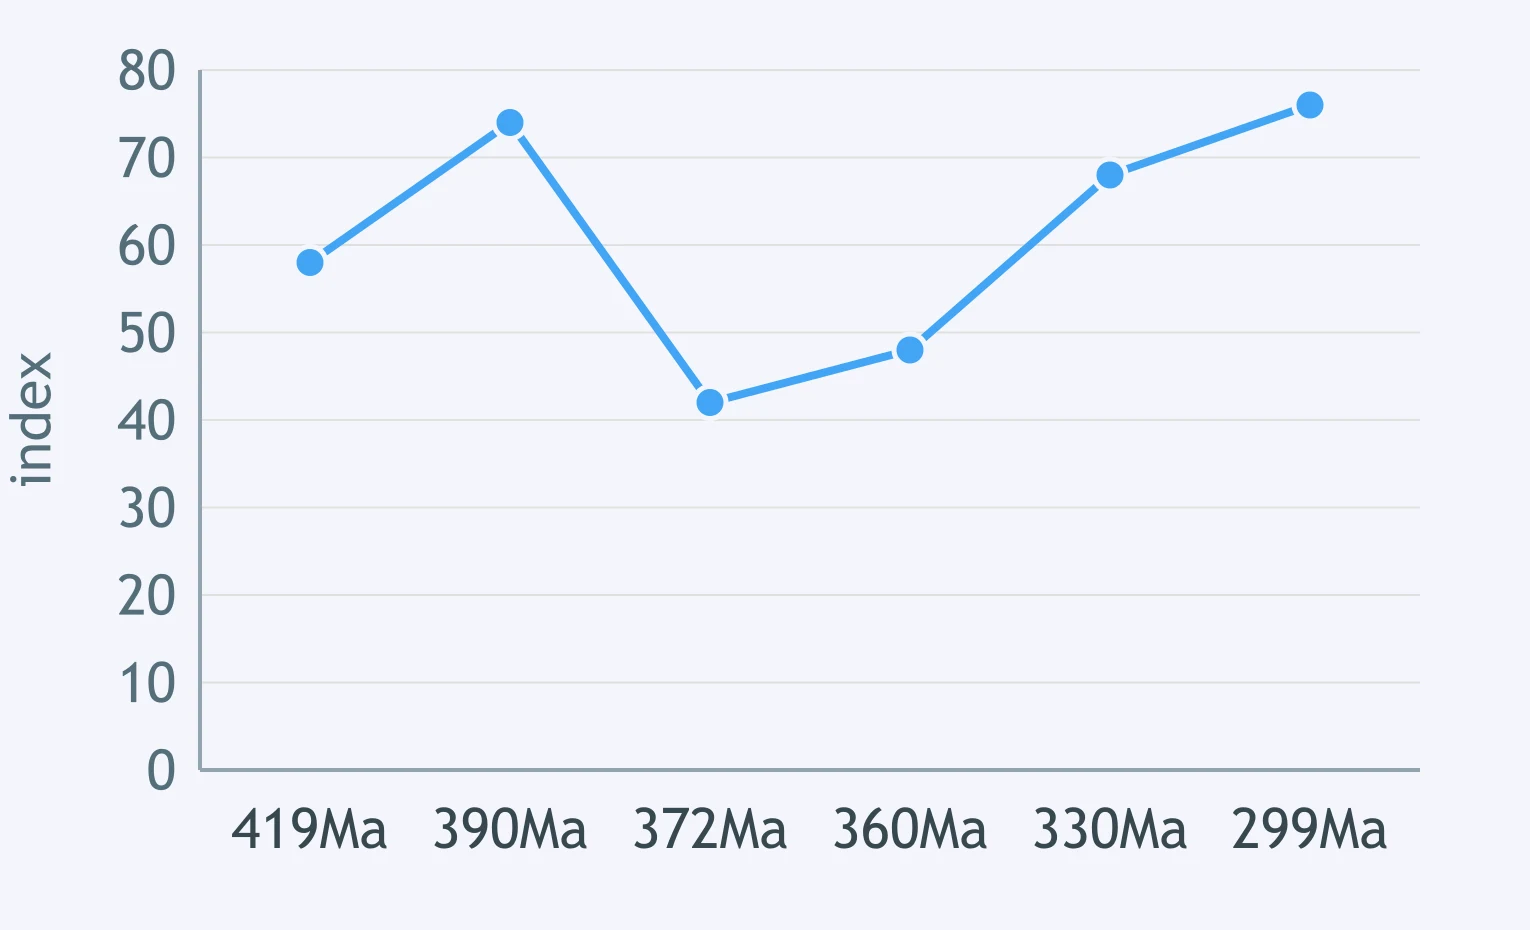
A Paleozoic curve dips strongly around 372 Ma, partway through the Devonian Period. Which Big Five event matches that position?
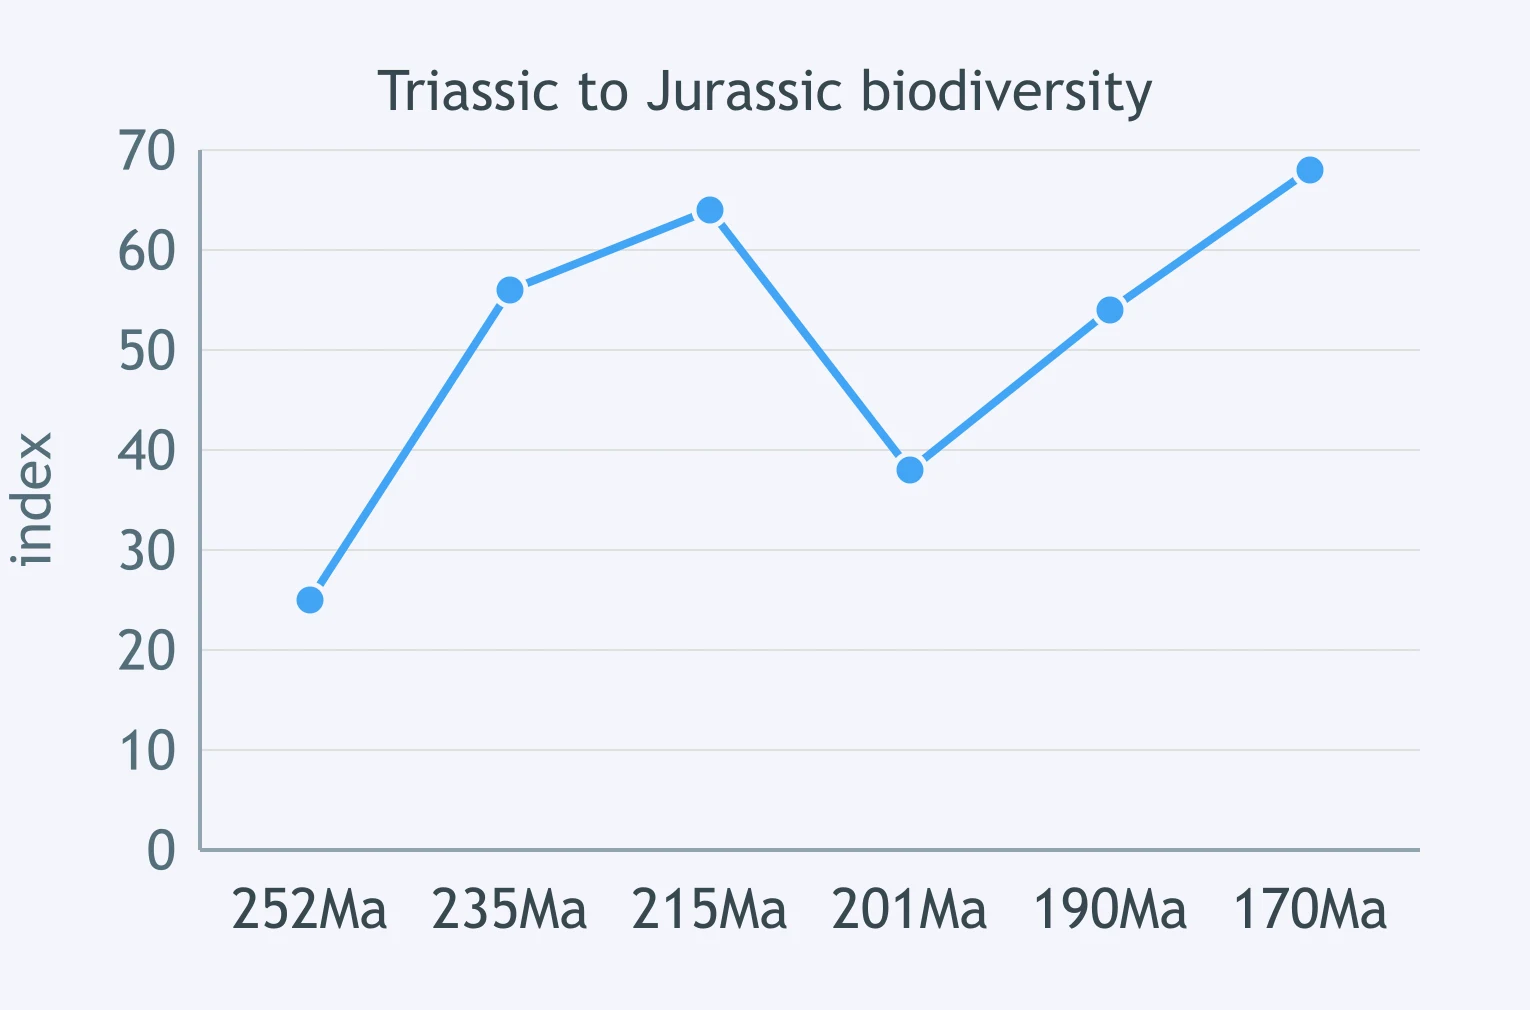
The curve drops near 201 Ma, just before Jurassic biodiversity rises. Which boundary is marked by this drop?
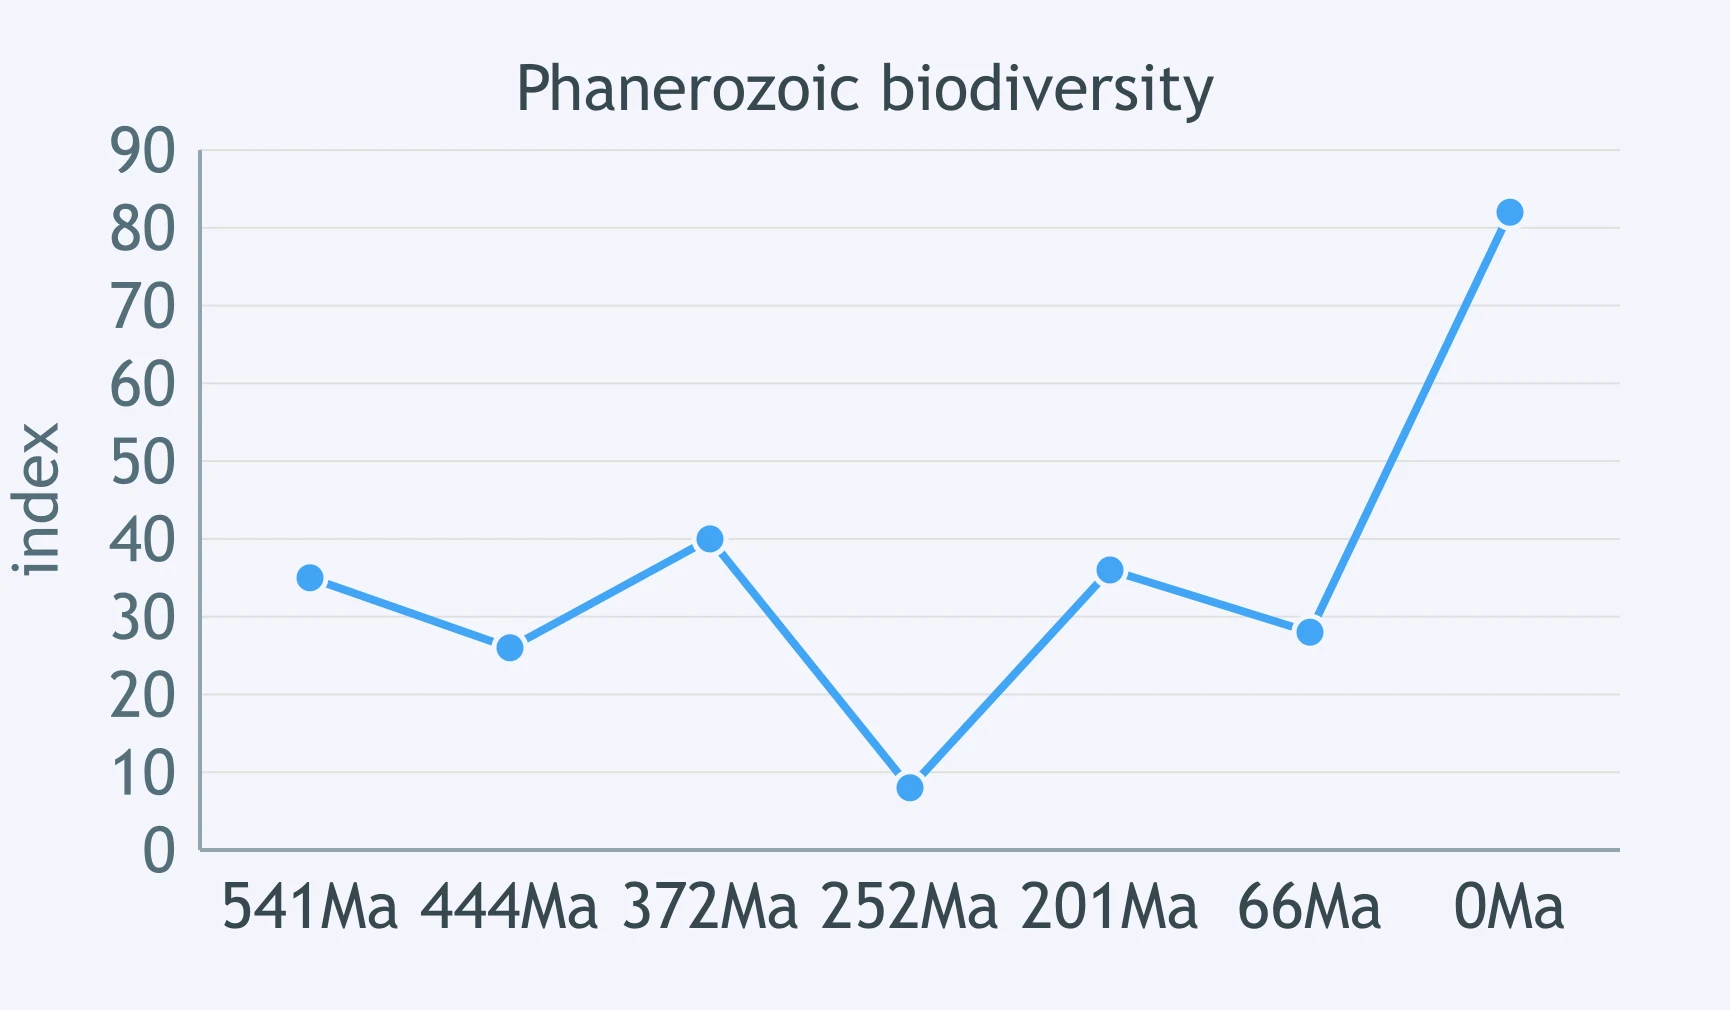
Use the Phanerozoic curve. Which extinction does its largest drop mark?
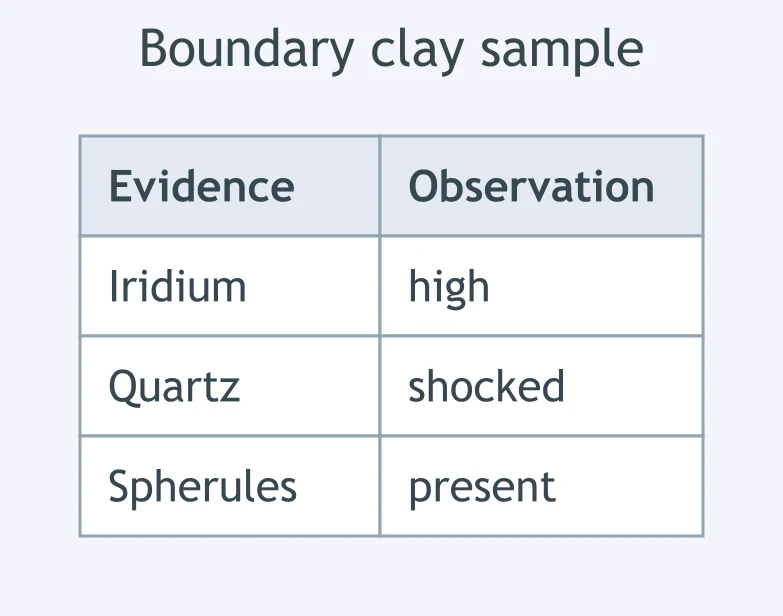
Use the table from a boundary clay sample. What cause does this evidence support?
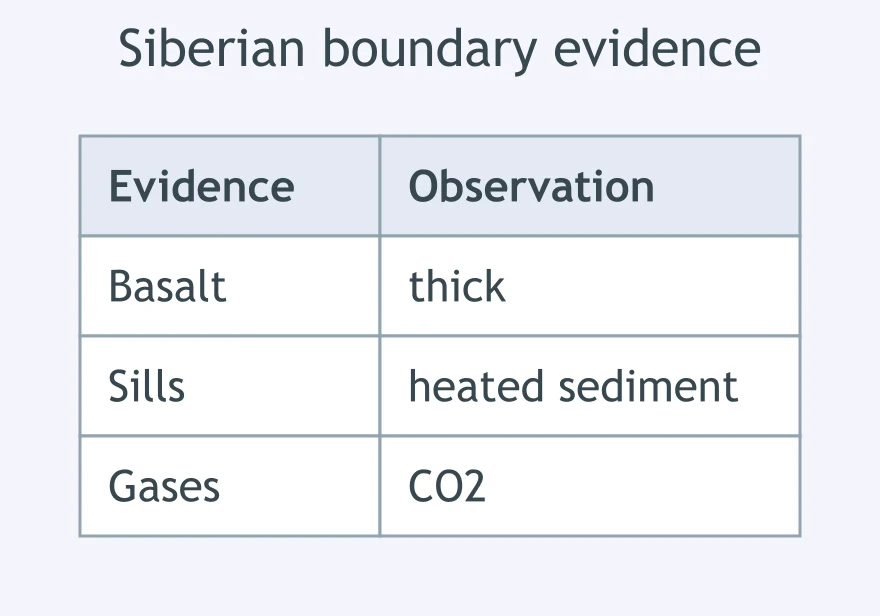
Use the table of evidence from rocks at an extinction boundary. What cause is best supported?
Ordovician-age rocks in North Africa include glacial deposits, and shallow-shelf fossils disappear above them. What cause does this support?
Late Devonian black shales have few burrows and geochemical signs of low oxygen near reef losses. What environmental stress is supported?
Basalts along the future Atlantic margins formed as Pangea began to split, and Triassic fossil groups vanished nearby in time. What cause is supported?
A site preserves Cretaceous marine reptiles below a boundary and Paleogene mammals above it. What broad consequence does this evidence support?
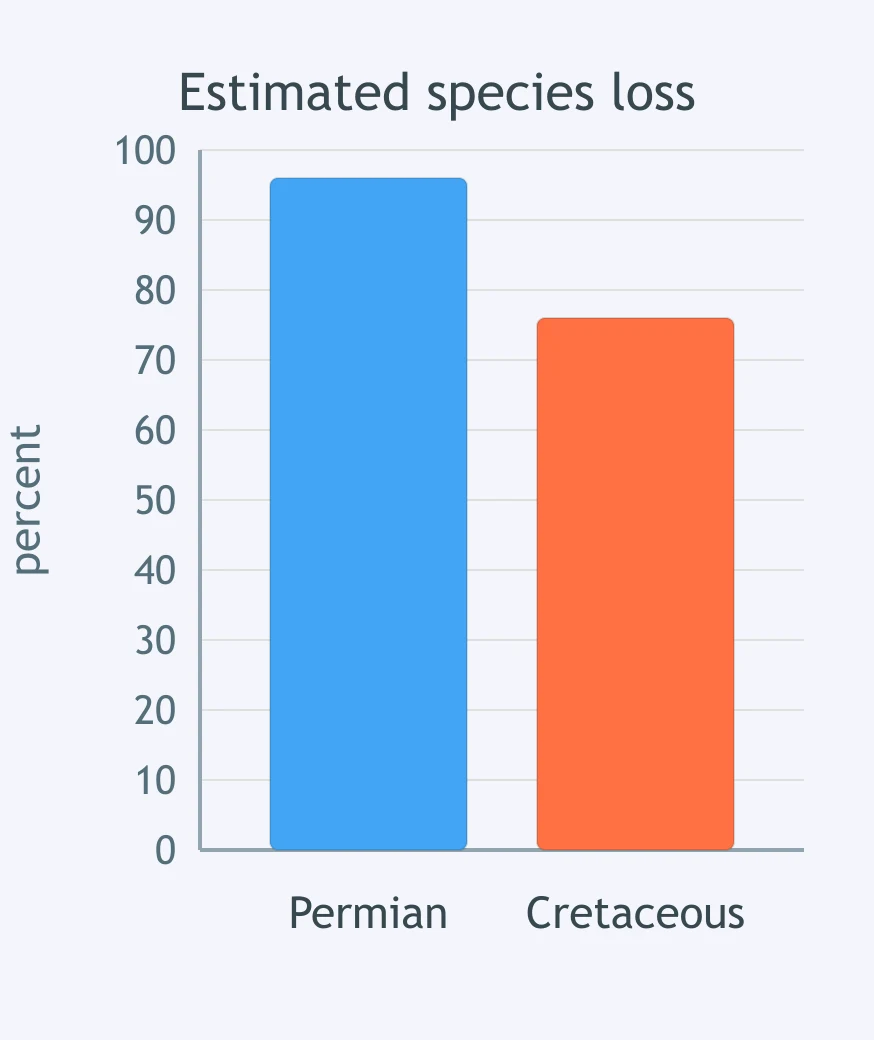
The comparison graph plots estimated species loss for the end-Permian and end-Cretaceous events. Which event shows the greater loss?
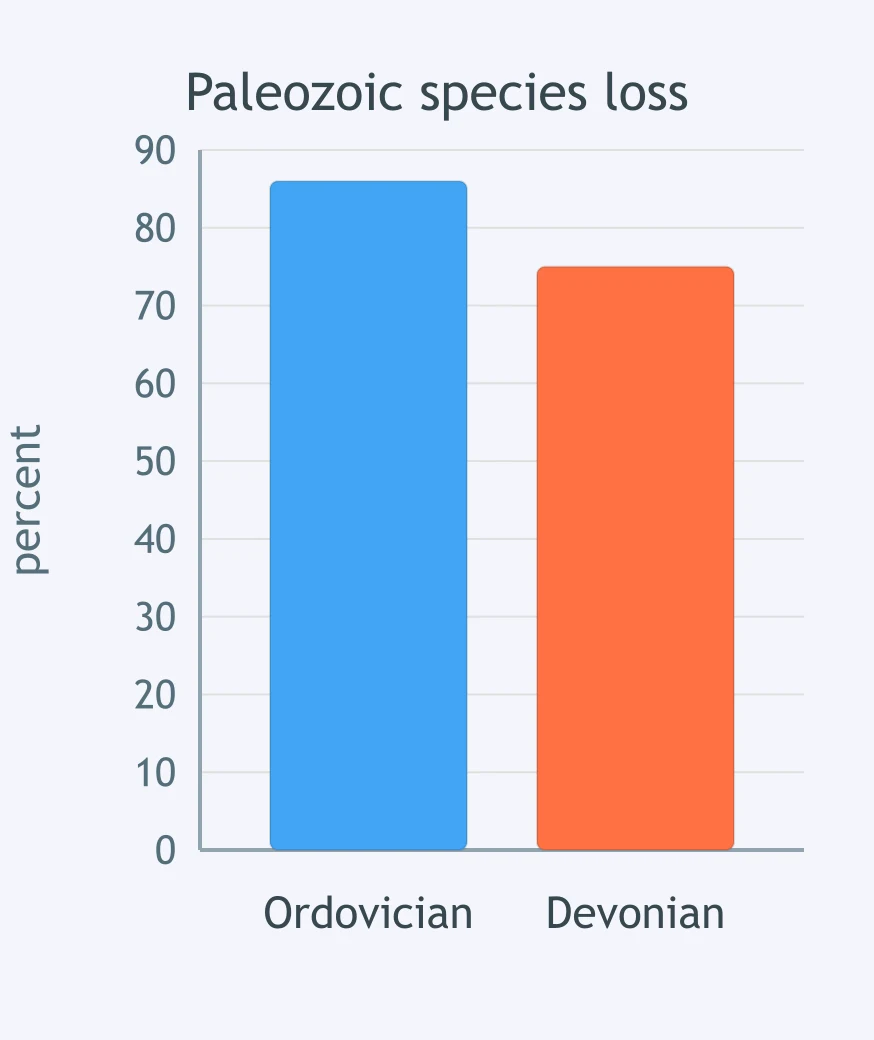
A graph compares species loss for the end-Ordovician and Late Devonian events. Which event was more severe by percent species lost?
A student compares the end-Triassic and end-Cretaceous extinctions. Which consequence is correctly matched?
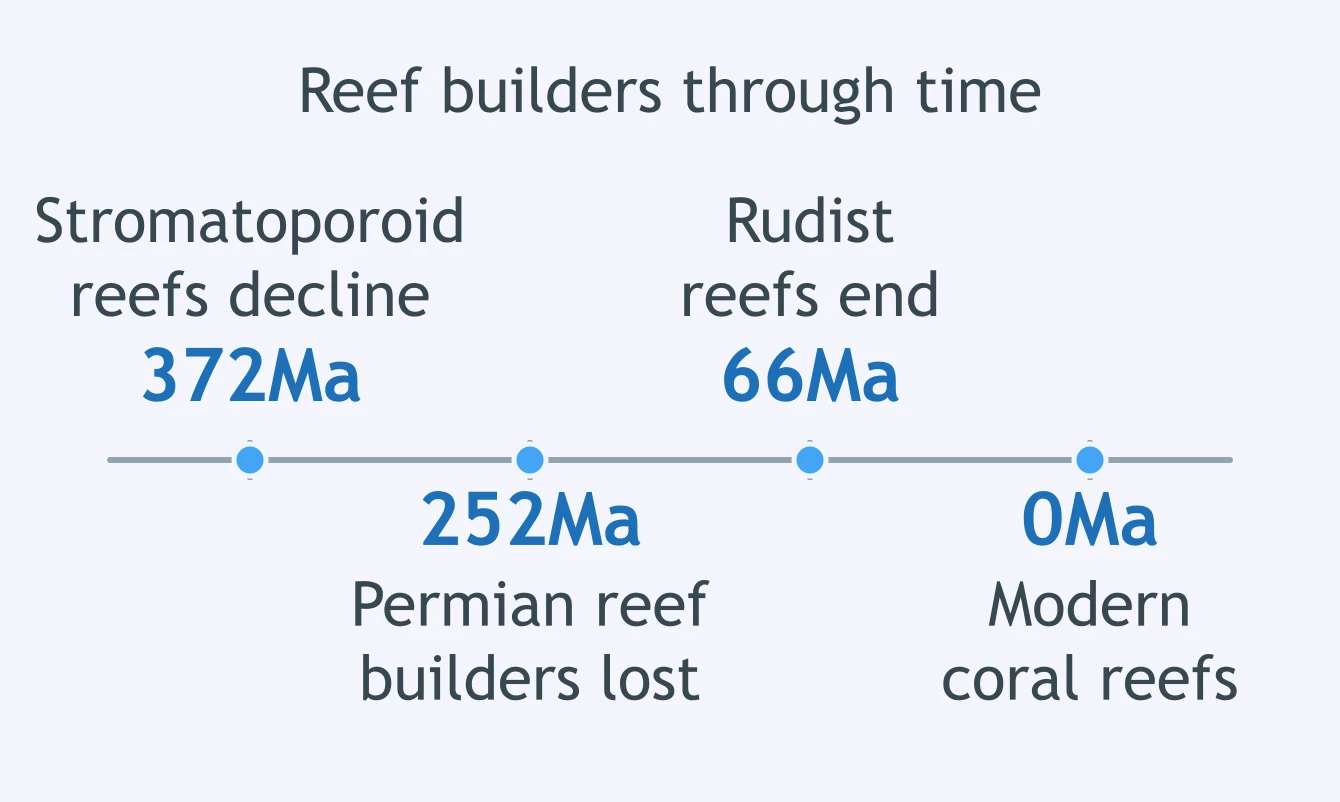
A reef-history comparison shows Devonian stromatoporoid reefs ending and Cretaceous rudist reefs ending later. What consequence is supported?
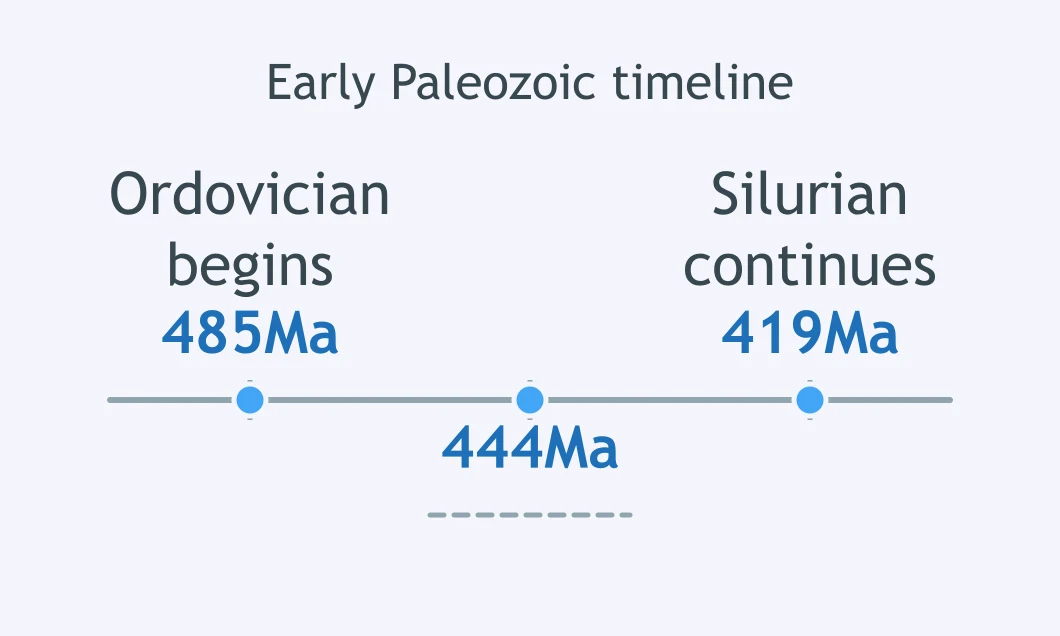
On the geologic timeline, the blank at about 444 Ma sits at the Ordovician-Silurian boundary. Which extinction belongs there?
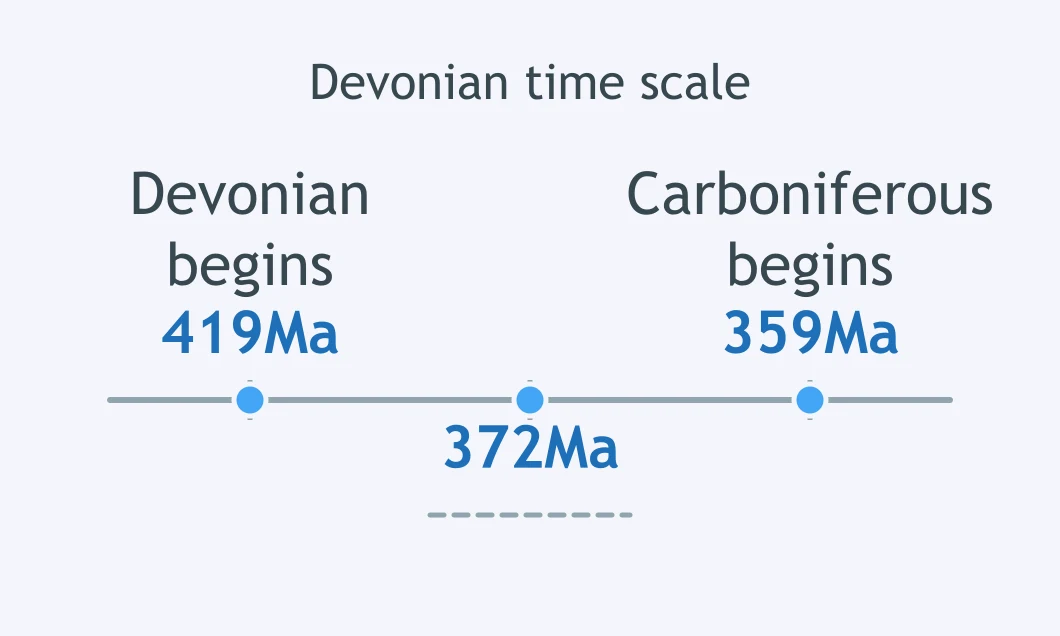
A time scale marks a blank at about 372 Ma within the Devonian, before the Carboniferous begins. Which extinction is being placed?
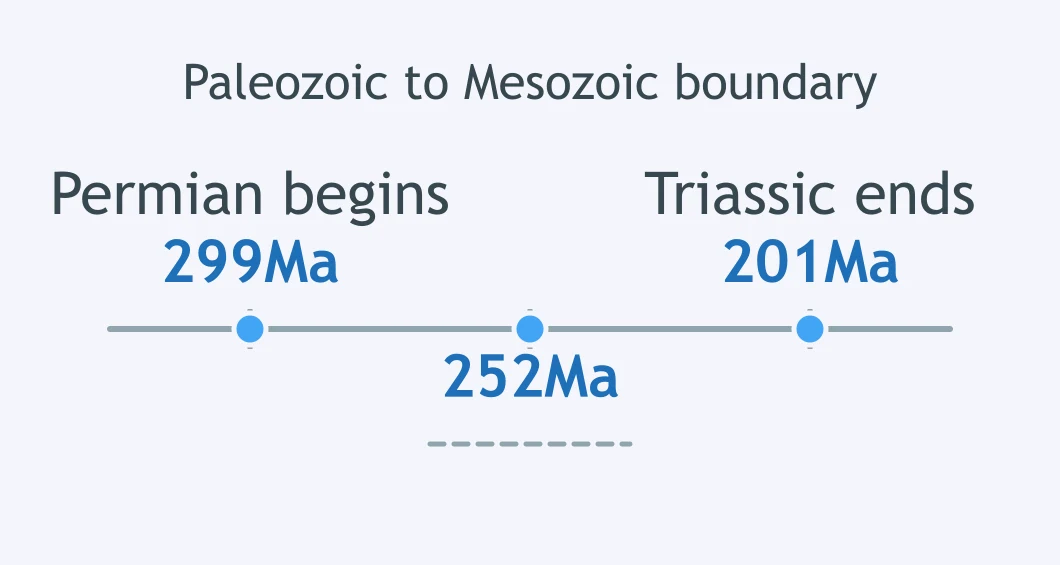
A timeline leaves a blank at 252 Ma, where the Paleozoic Era ends and the Mesozoic Era begins. Which extinction event fits the blank?
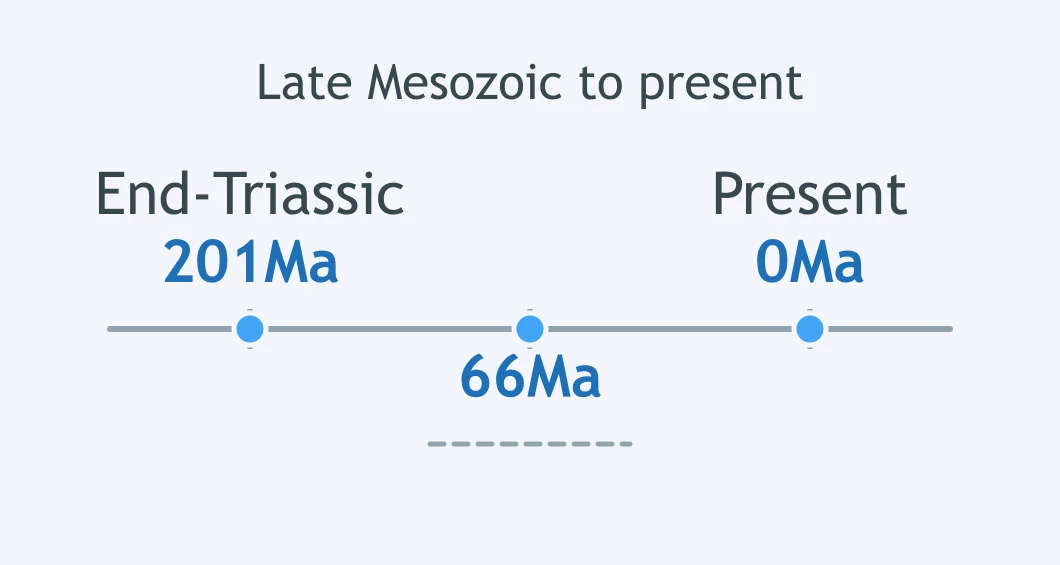
The timeline’s closest Big Five event to the present is a blank at 66 Ma, just before rapid Cenozoic mammal diversification. Which event is marked?
Crack the passcode before the zombies get in.
Answer, then swat bugs for bonus points.
Race through questions at your own speed.
Same question on every screen. Fastest wins.

Pick a tile, answer, hit bonuses and steals.
The Ocean Floor
40 questions