Loading
by BlastRoom
Read the Hertzsprung-Russell diagram to compare and classify stars by surface temperature and light output.
#us_grade_8_science

20 questions
One question set, multiple game modes. Tap any game to see it in action. Not sure which to pick?
Answer to place stones and capture territory.
Outrun the snow together.
Earn blasts, then hunt the other team.
Answer to earn energy, then climb.

The class blasts through walls together.
Bid on mystery lots. Most money wins.
Sell tours. Nice, standard, or a total scam.

Answer, restock, and serve the rush.
More correct answers pulls the rope your way.
Answer, then shoot down the alien wave.
Answer, then tap to leap the frozen ridge.
An H-R diagram plots hot stars left, cool right, bright at top, dim at bottom. A star has a surface temperature of 20,000 K and gives off 8,000 times the Sun's light each second. Where does it plot?
An H-R diagram plots hot stars left, cool right, bright at top, dim at bottom. A red dwarf has a surface temperature of 3,200 K and gives off one hundredth of the Sun's light each second. Where does it plot?
On an H-R diagram temperature runs hot-left to cool-right and light output runs dim-bottom to bright-top. A red giant's surface is about 3,500 K, yet it gives off 2,000 times the Sun's light. Where is it plotted?
On an H-R diagram temperature runs hot-left to cool-right and light output runs dim-bottom to bright-top. A white dwarf's surface reaches 12,000 K but it gives off only 1/500 of the Sun's light. Where is it plotted?
The H-R diagram plots a sample of stars. The Sun's surface is about 5,800 K and its light output defines the value 1. Where does the Sun plot?
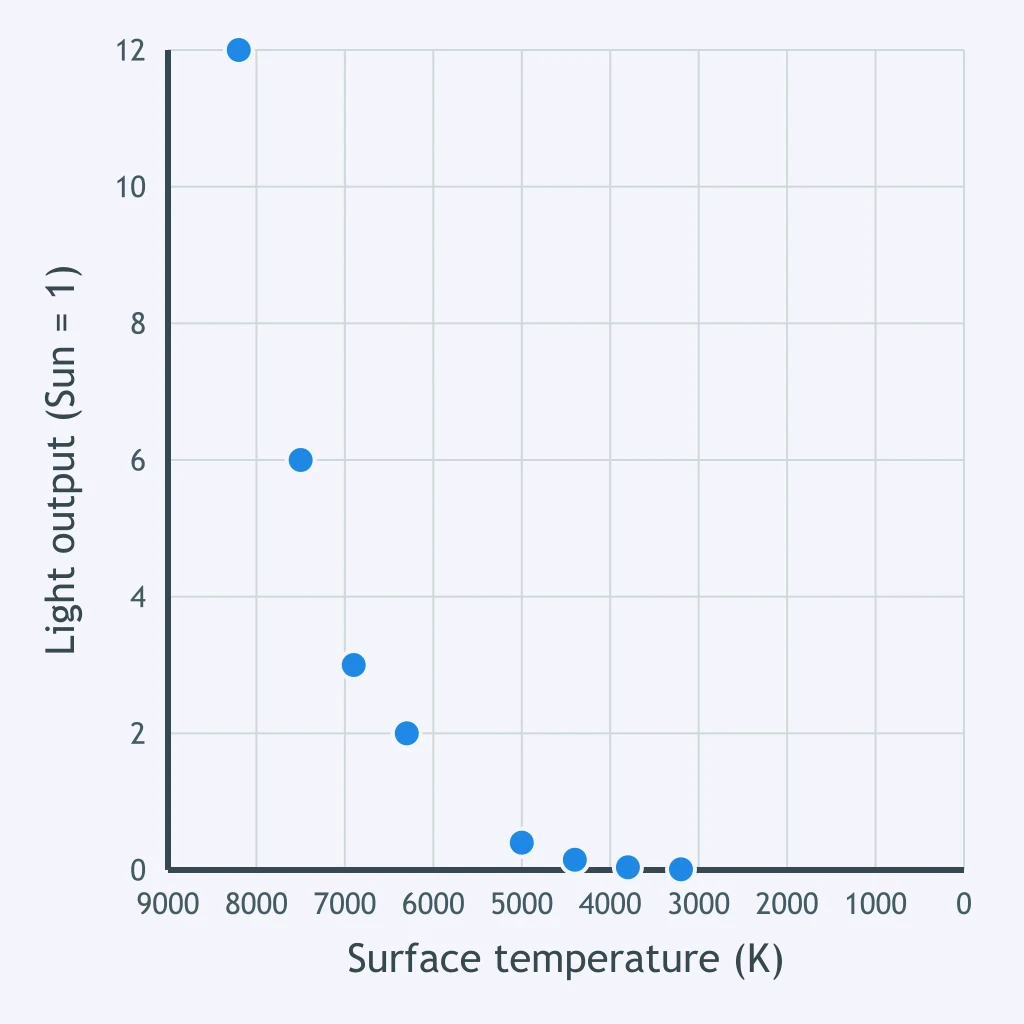
On an H-R diagram temperature runs hot-left to cool-right and light output runs dim-bottom to bright-top. A star's surface is cooler than the Sun's, but it gives off 300 times more light each second. Where does it plot relative to the Sun?
Use the table of four stars. On an H-R diagram hot stars plot left, cool right, bright at top, dim at bottom. Which star plots at the lower left of the diagram?
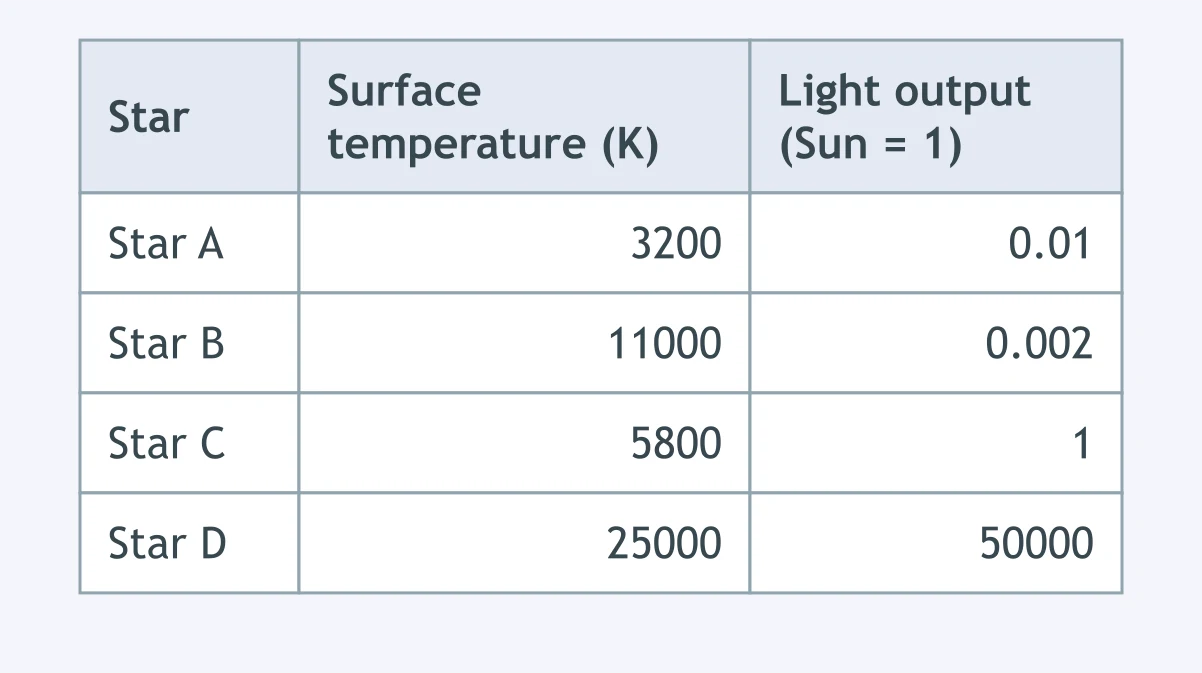
On an H-R diagram temperature runs hot-left to cool-right and light output runs dim-bottom to bright-top. Star P is plotted at the upper left and Star Q at the lower right. Which comparison is correct?
On an H-R diagram temperature runs hot-left to cool-right and light output runs dim-bottom to bright-top. Star R is plotted at the upper right and Star S at the lower left. Which comparison is correct?
On an H-R diagram temperature runs hot-left to cool-right and light output runs dim-bottom to bright-top. Stars G and H sit on the same vertical line, but G is far above H. What must be true?
On an H-R diagram temperature runs hot-left to cool-right and light output runs dim-bottom to bright-top. Stars J and K lie at the same height, but J is farther left. What must be true?
On an H-R diagram temperature runs hot-left to cool-right and light output runs dim-bottom to bright-top. Star T sits high on the right, far above the band. Star U sits low on the left, far below it. How are they classified?
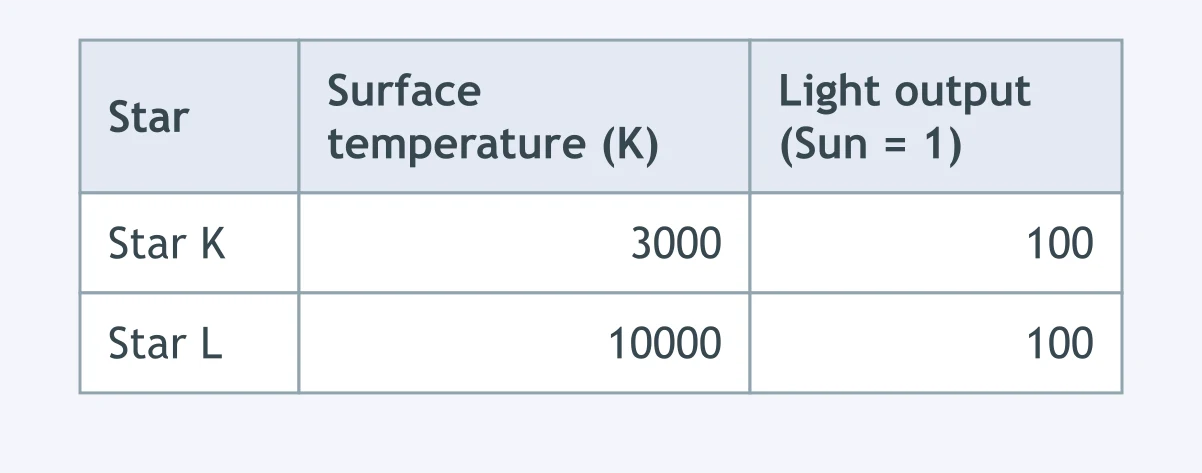
Use the table. On an H-R diagram, Stars K and L plot at the same height but at different places left to right. Which is the larger star, and why?
Two stars are plotted at exactly the same point on an H-R diagram, where temperature runs hot-left to cool-right and light output runs dim-bottom to bright-top. What must be true of them?
Most of the stars plotted on this H-R diagram fall along one wide band. What is that band, and what are those stars doing?
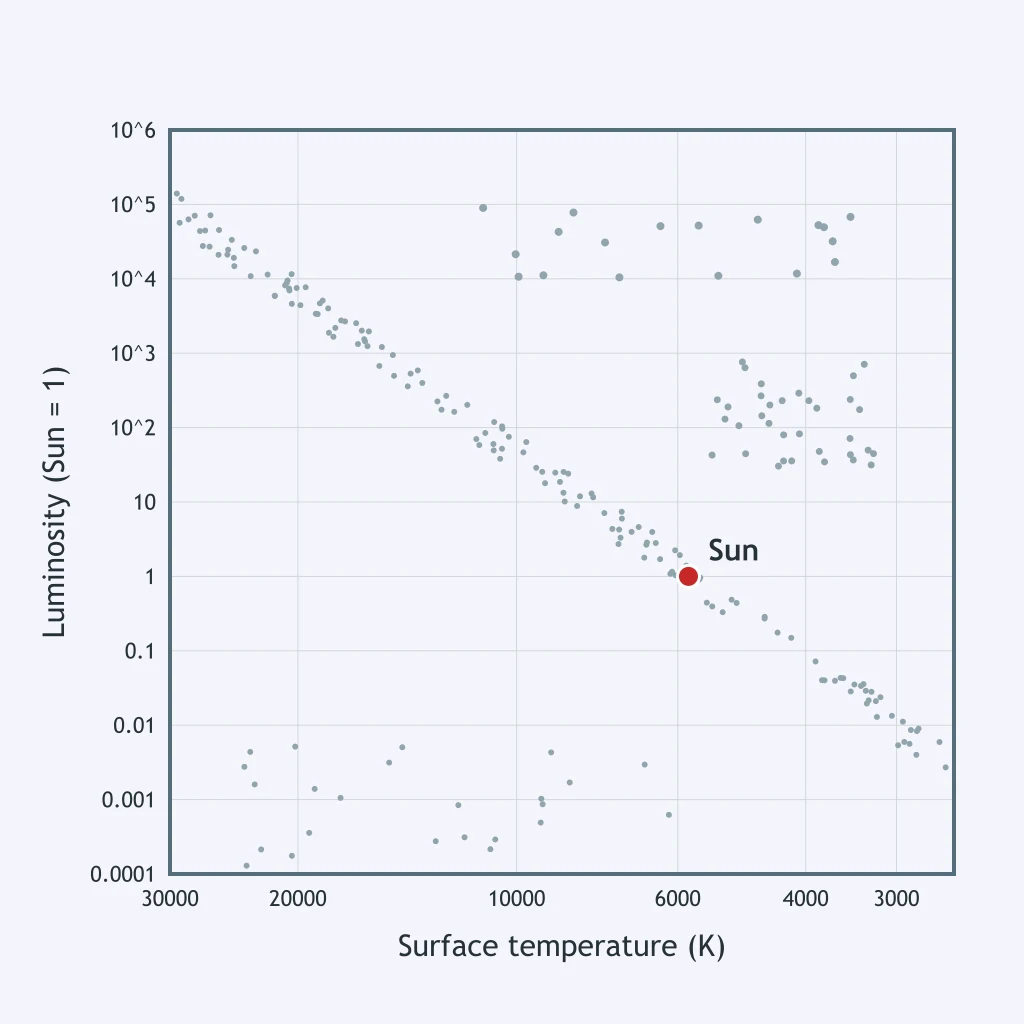
Look at the small group of stars plotted at the lower left of this H-R diagram. What explains that combination of surface temperature and light output?
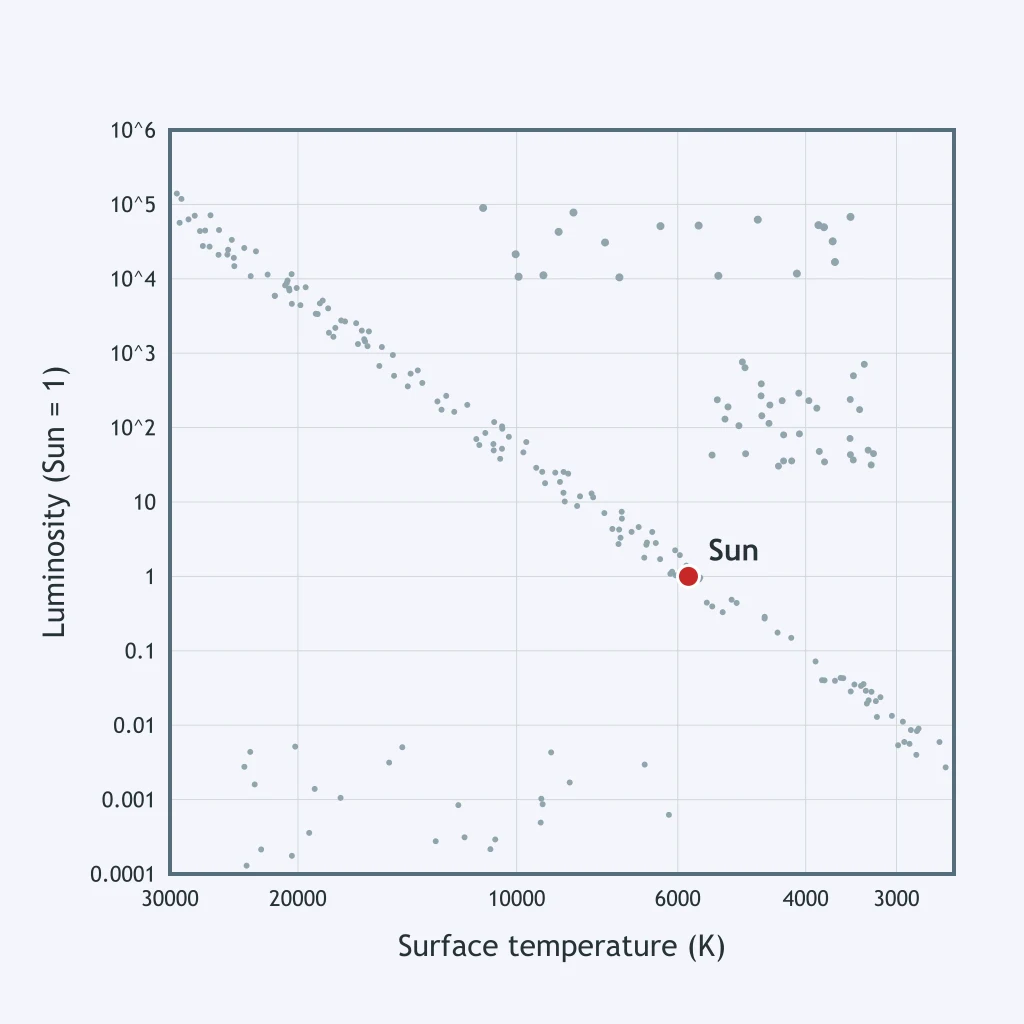
Look at the group of stars plotted at the upper right of this H-R diagram. What must be true of those stars?
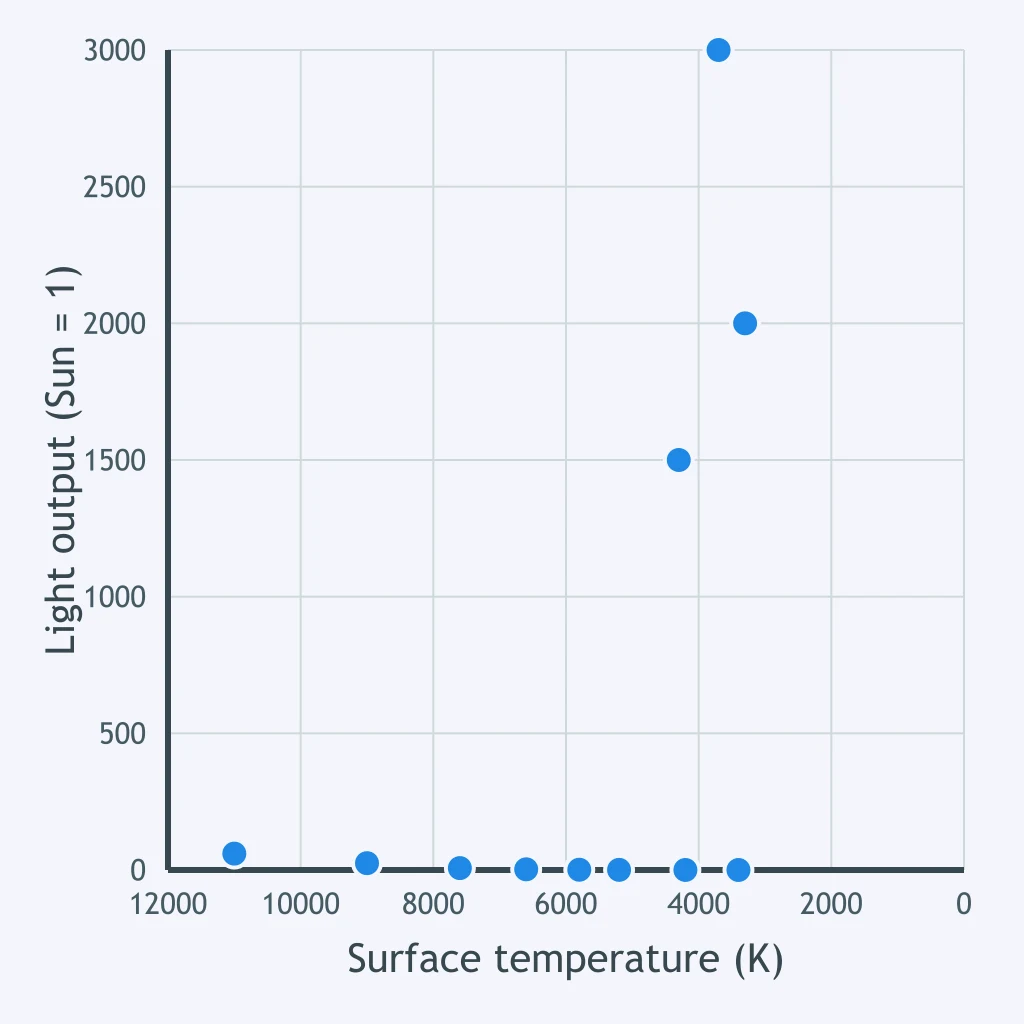
A student looks at an H-R diagram and says a star plotted far to the right must be far away from Earth. Why is that wrong?
Astronomers track a star whose plotted point leaves the main-sequence band and moves toward the upper right of the H-R diagram. What has happened to the star?
Plotting thousands of stars gives an H-R diagram three crowded areas: a long band, a clump at the upper right, and a clump at the lower left. What do the three areas represent?

Crack the passcode before the zombies get in.
Answer, then swat bugs for bonus points.
Race through questions at your own speed.
Same question on every screen. Fastest wins.

Pick a tile, answer, hit bonuses and steals.
Scale and Distance in Space
40 questions