Loading
by BlastRoom
A review of humidity, dew point, cloud formation, cloud classification, and precipitation.
#earth_space_science

40 questions
One question set, multiple game modes. Tap any game to see it in action. Not sure which to pick?
Answer to place stones and capture territory.
Outrun the snow together.
Earn blasts, then hunt the other team.
Answer to earn energy, then climb.

The class blasts through walls together.
Bid on mystery lots. Most money wins.
Sell tours. Nice, standard, or a total scam.

Answer, restock, and serve the rush.
More correct answers pulls the rope your way.
Answer, then shoot down the alien wave.
Answer, then tap to leap the frozen ridge.
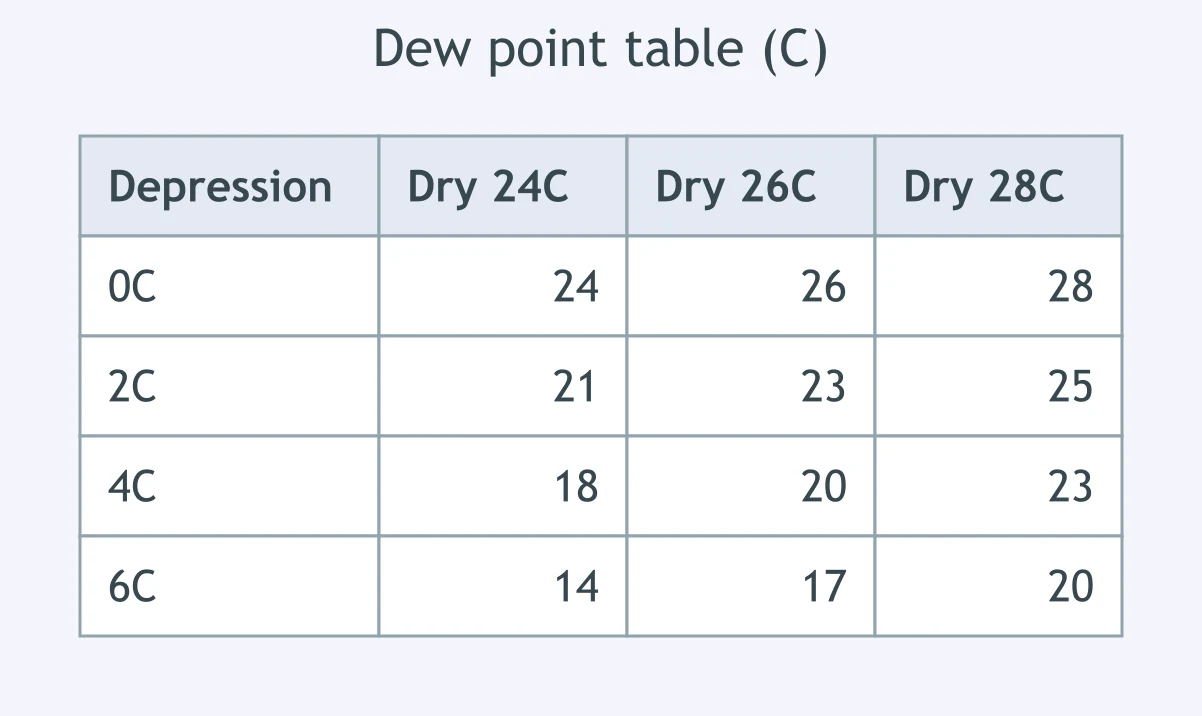
A sling psychrometer reads a dry-bulb temperature of 24 °C and a wet-bulb temperature of 18 °C. Use the dew point table. What is the dew point?
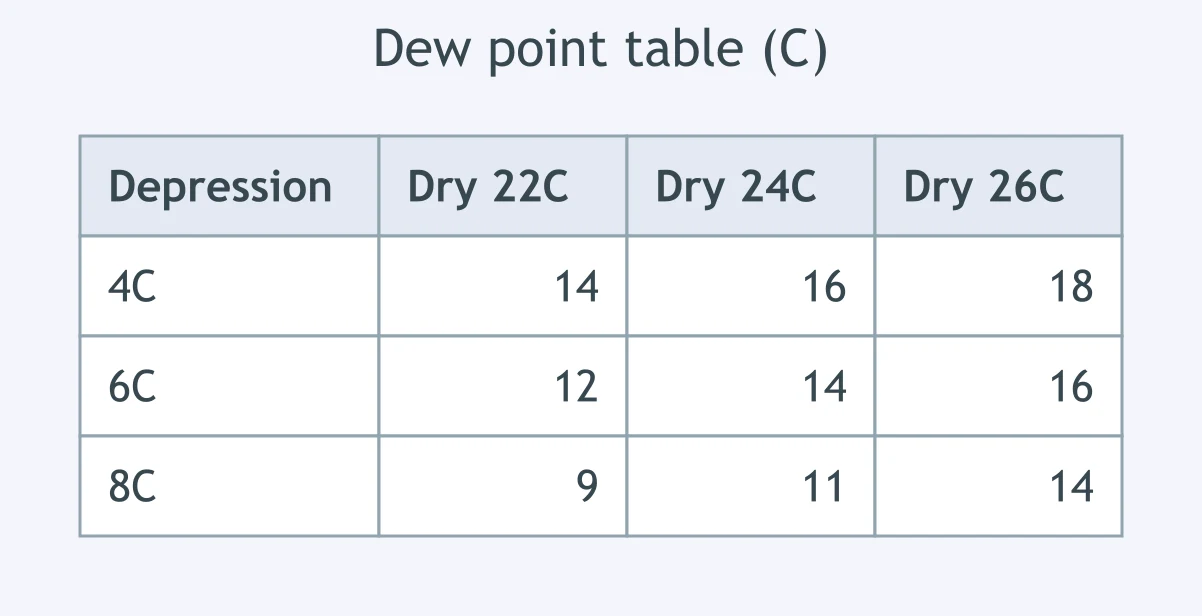
At a station, the dry bulb is 18 °C and the wet bulb is 14 °C. Using the dew point table, what dew point should be reported?
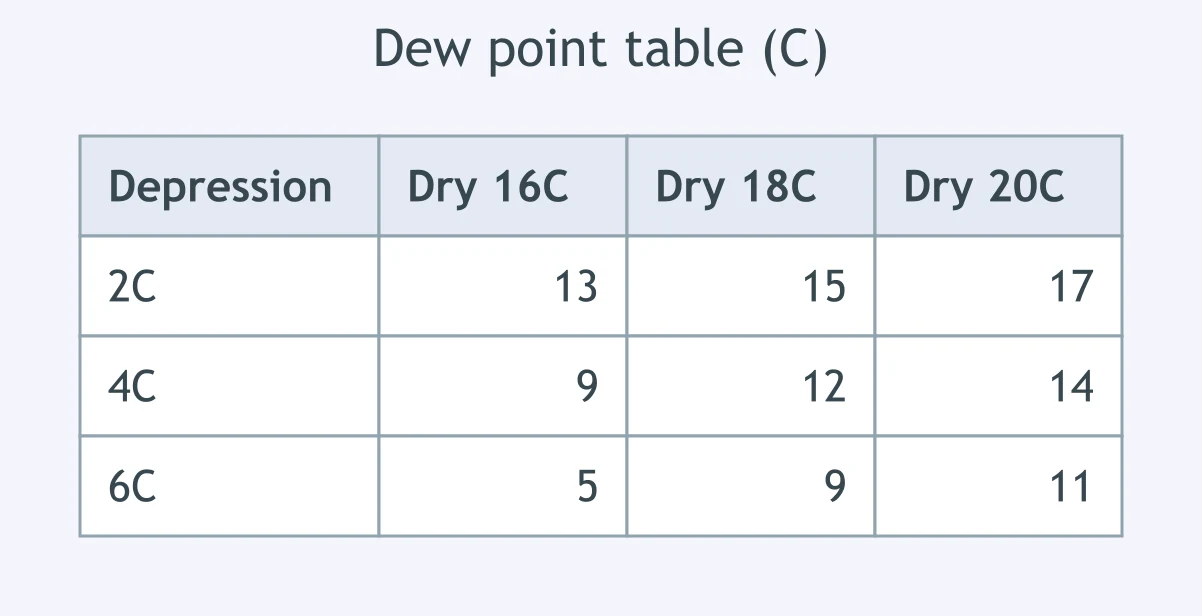
A dry bulb reads 30 °C while the wet bulb reads 24 °C. Use the table to find the dew point for this air sample.
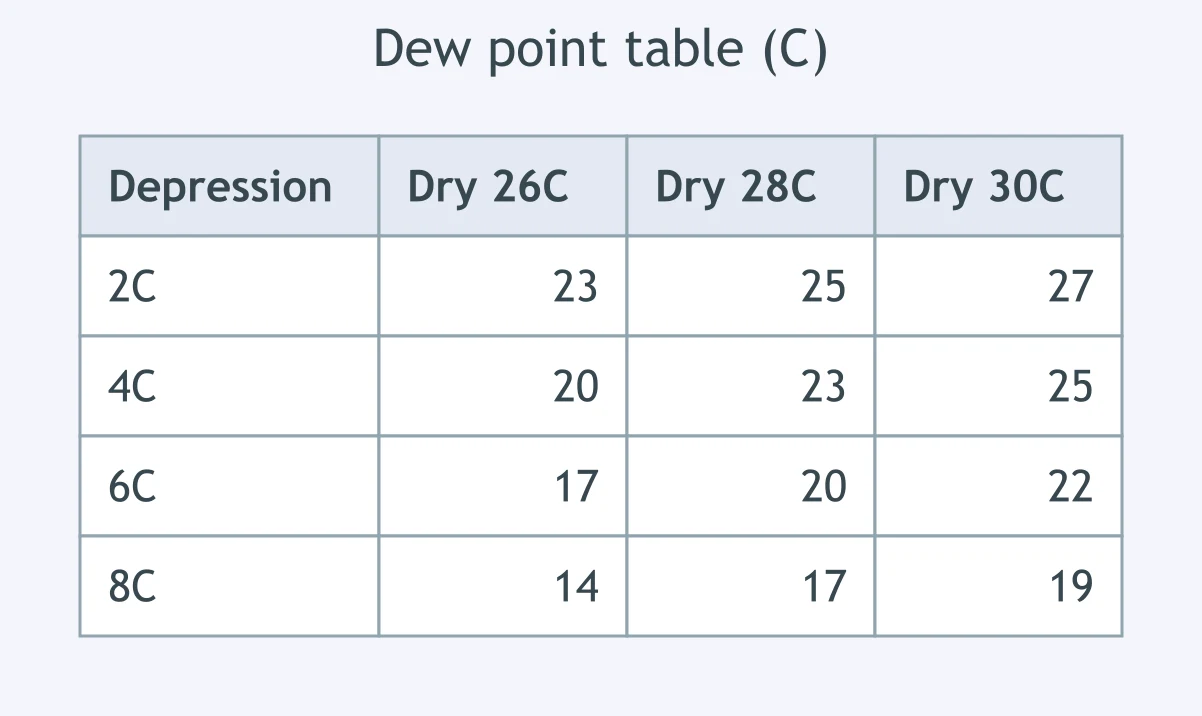
A student records a dry-bulb temperature of 12 °C and a wet-bulb temperature of 8 °C. What dew point is shown by the table?
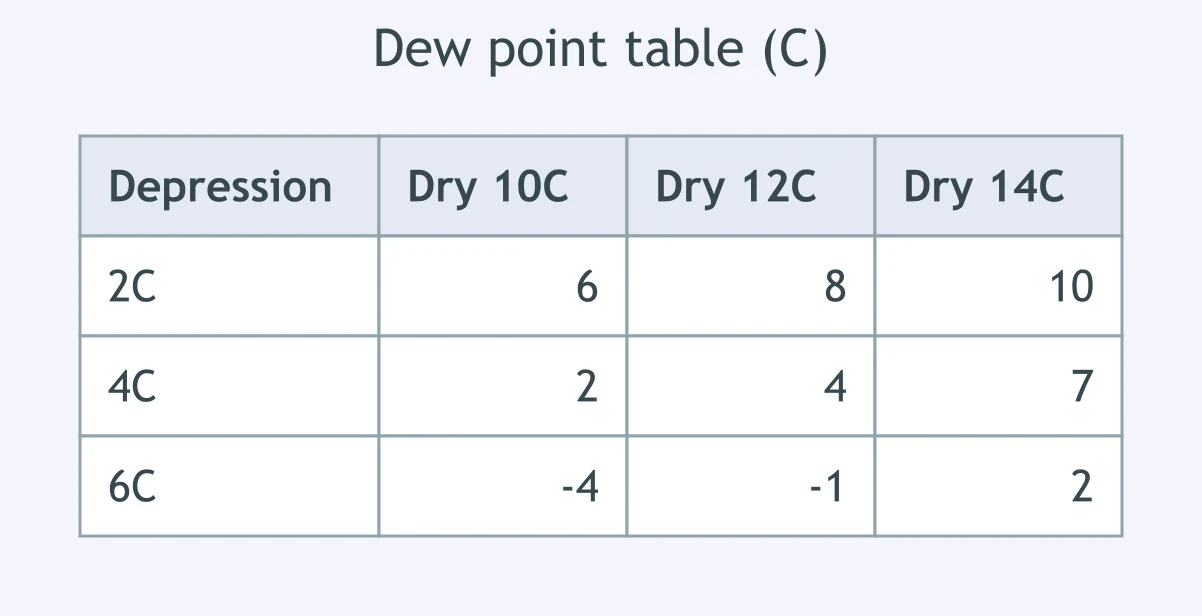
During a field observation, a psychrometer has a dry bulb of 28 °C and a wet bulb of 26 °C. Use the table to determine the dew point.
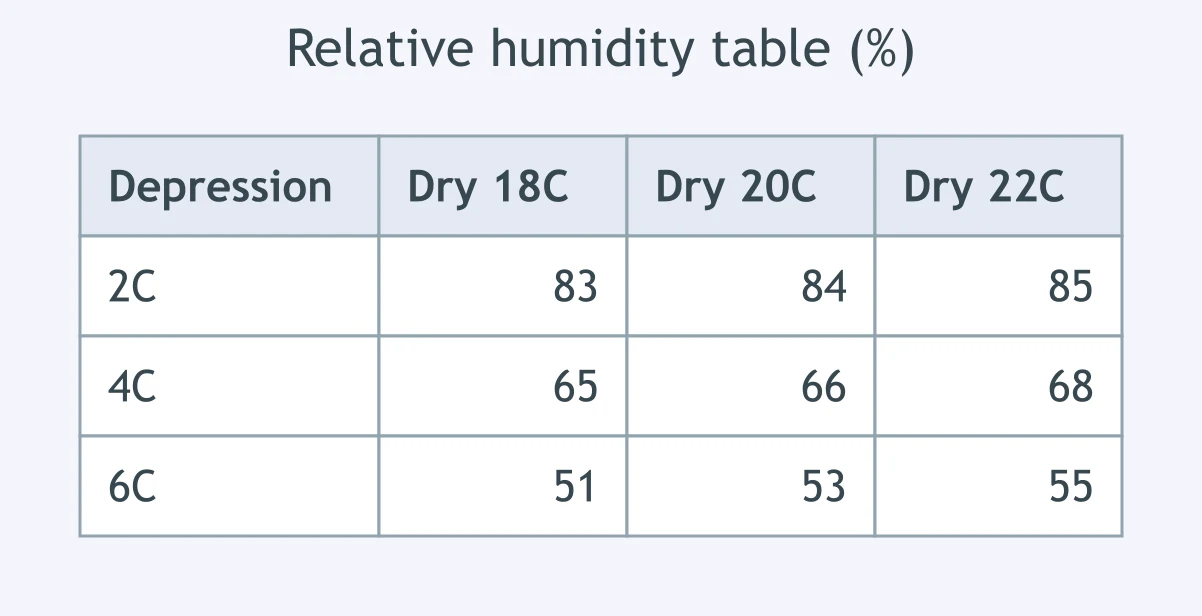
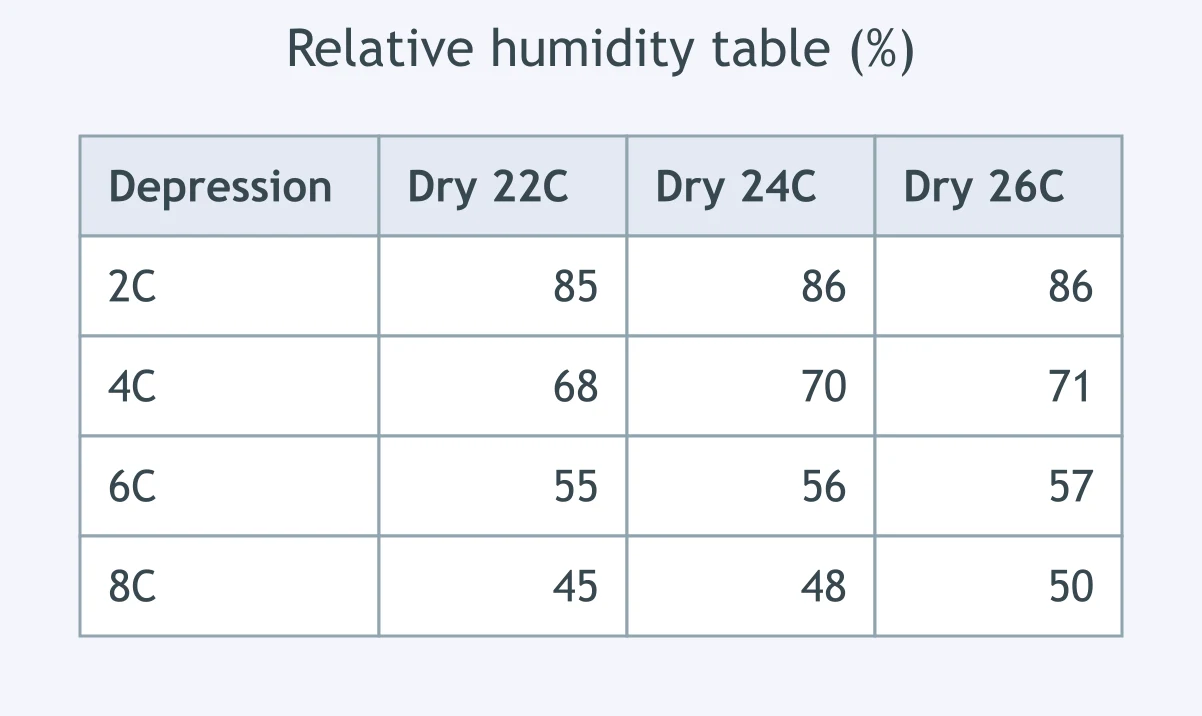
A psychrometer reads 20 °C dry bulb and 16 °C wet bulb. Use the relative humidity table. What is the relative humidity?
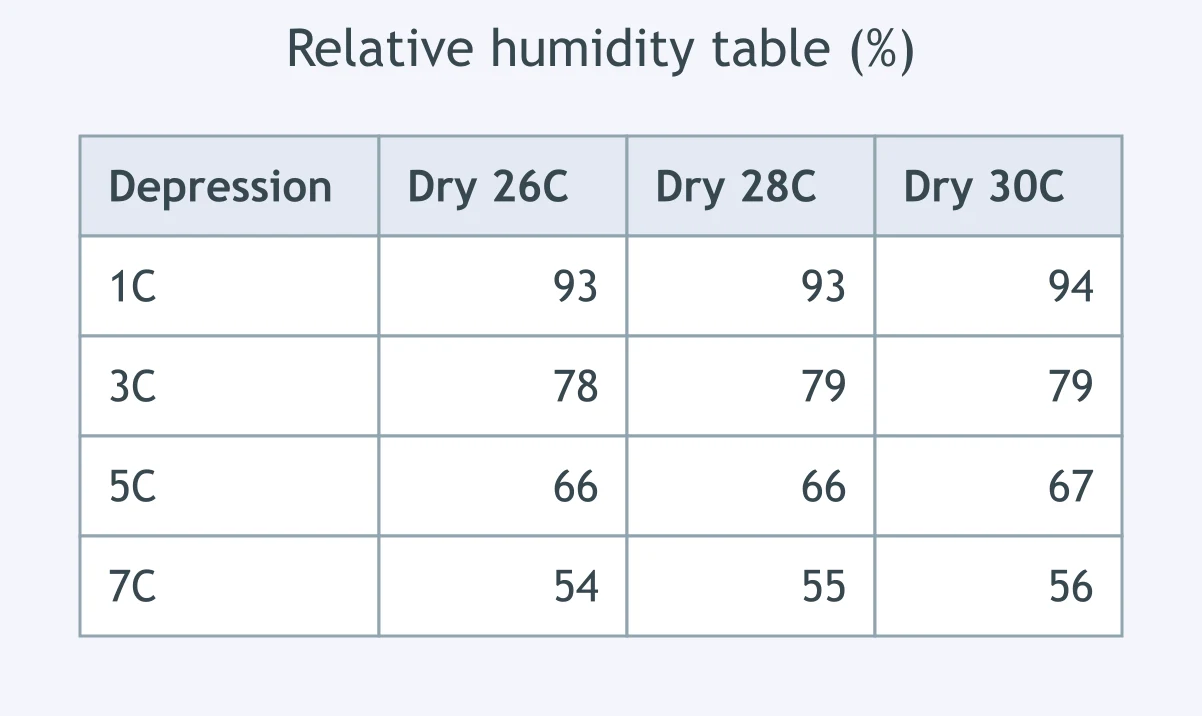
A weather observer measures 30 °C on the dry bulb and 27 °C on the wet bulb. According to the relative humidity table, what is the relative humidity?
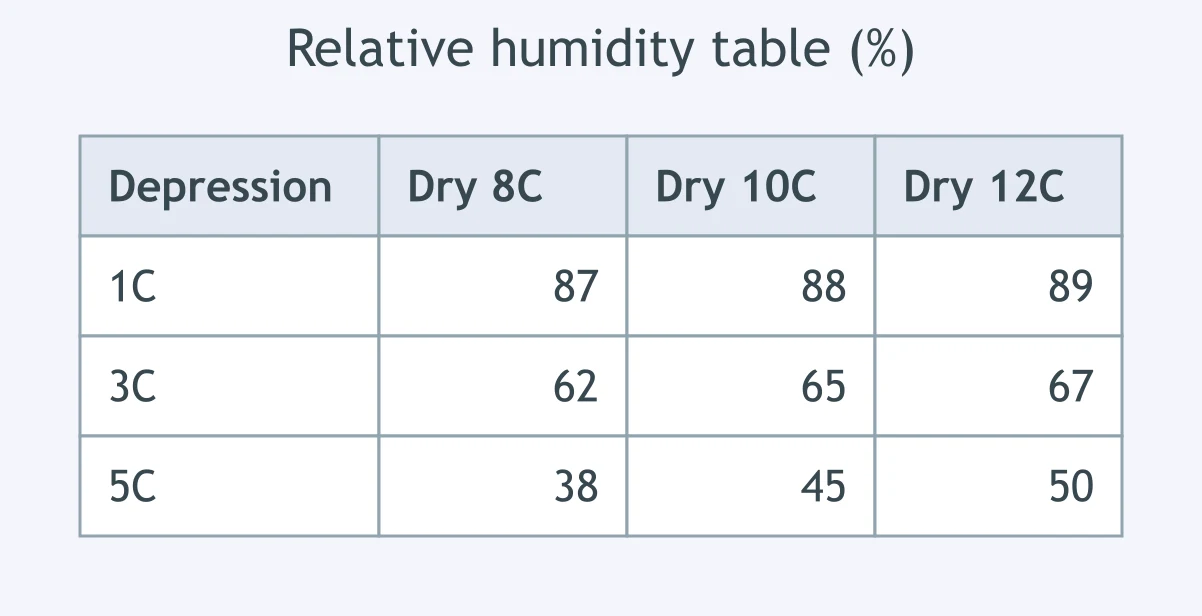
The dry bulb is 10 °C and the wet bulb is 7 °C. Use the relative humidity table to report the station's relative humidity.
A sling psychrometer shows a dry bulb of 26 °C and a wet bulb of 20 °C. What relative humidity is listed in the table?
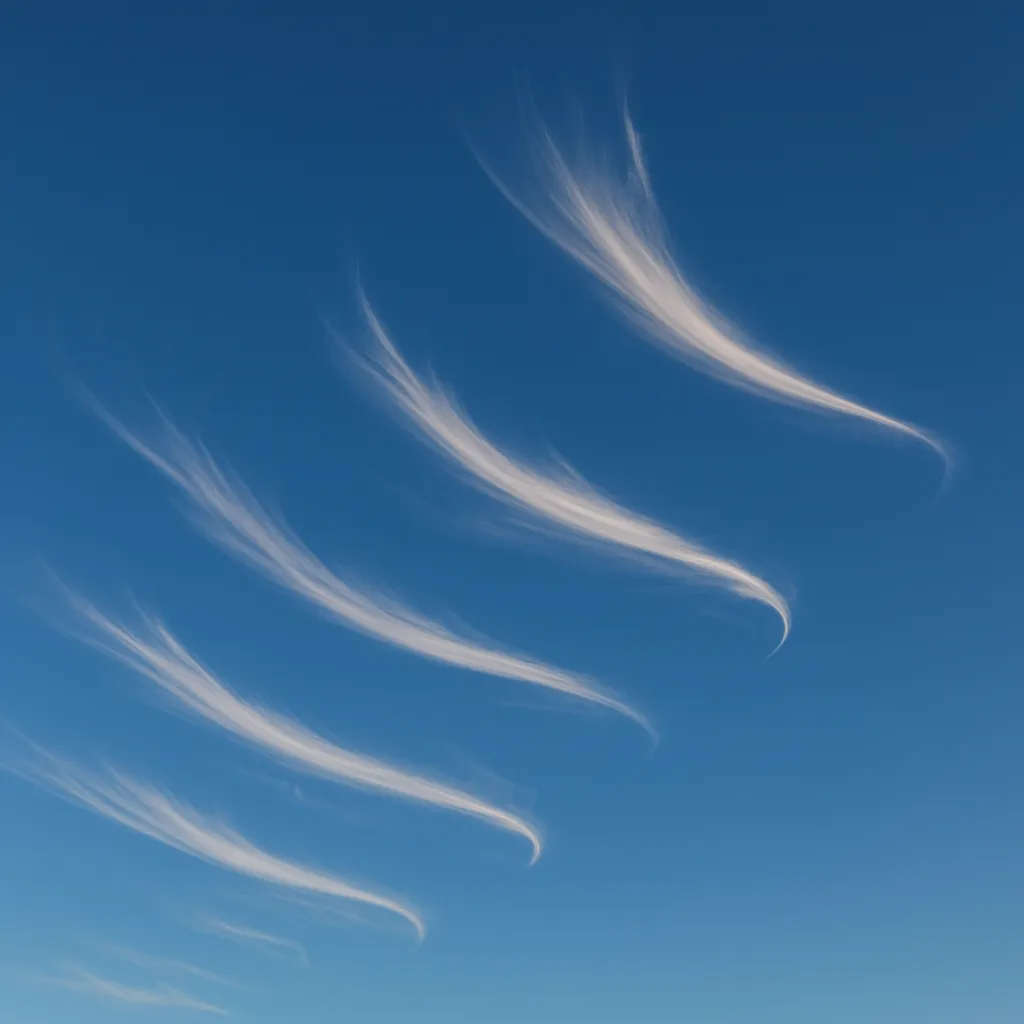
The sky photograph shows long, white, hooked filaments high above the ground. What cloud type is shown?
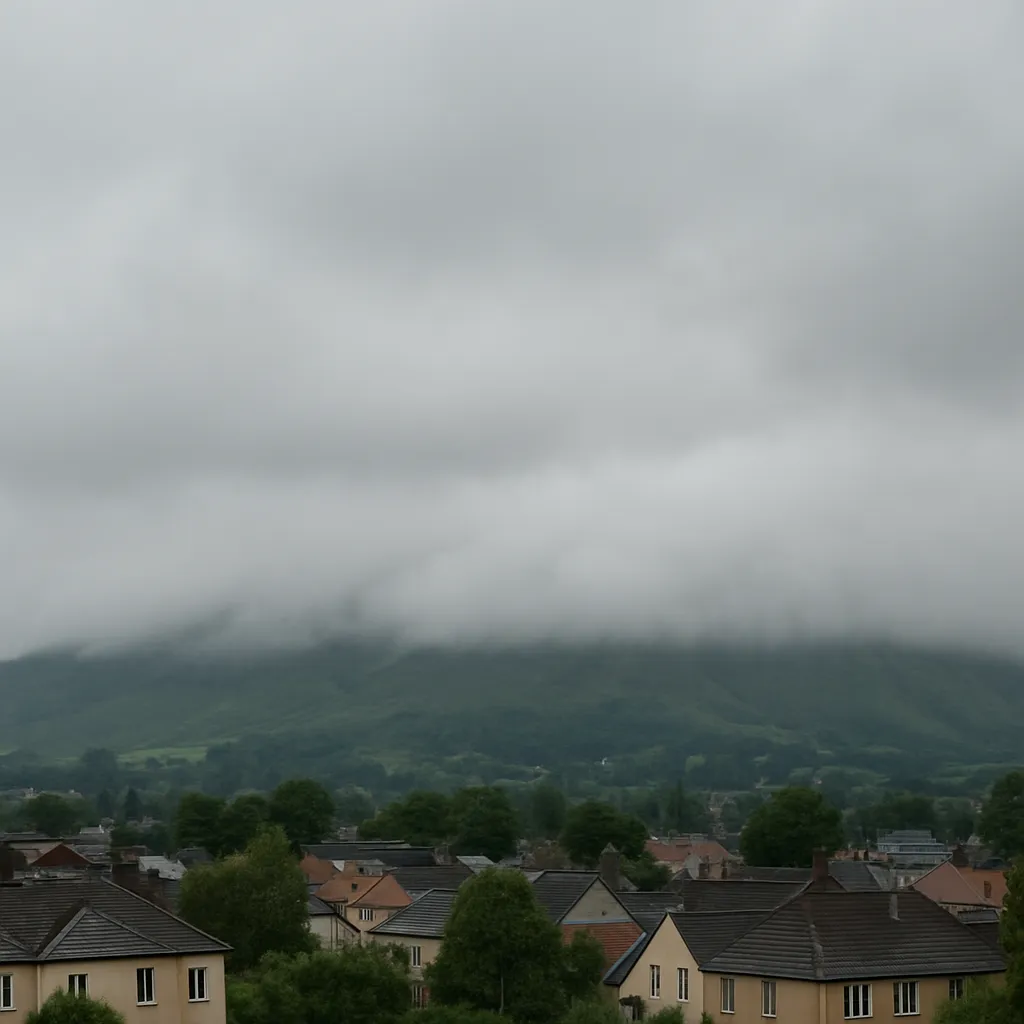
A photograph shows a low, smooth gray blanket of cloud with no separate puffs. What cloud type is shown?
The sky image shows puffy cotton-like clouds with flat bases and sharp edges. What cloud type is shown?

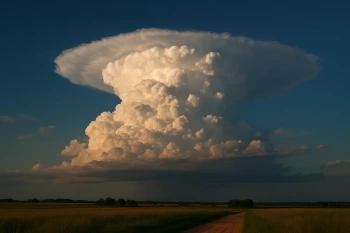
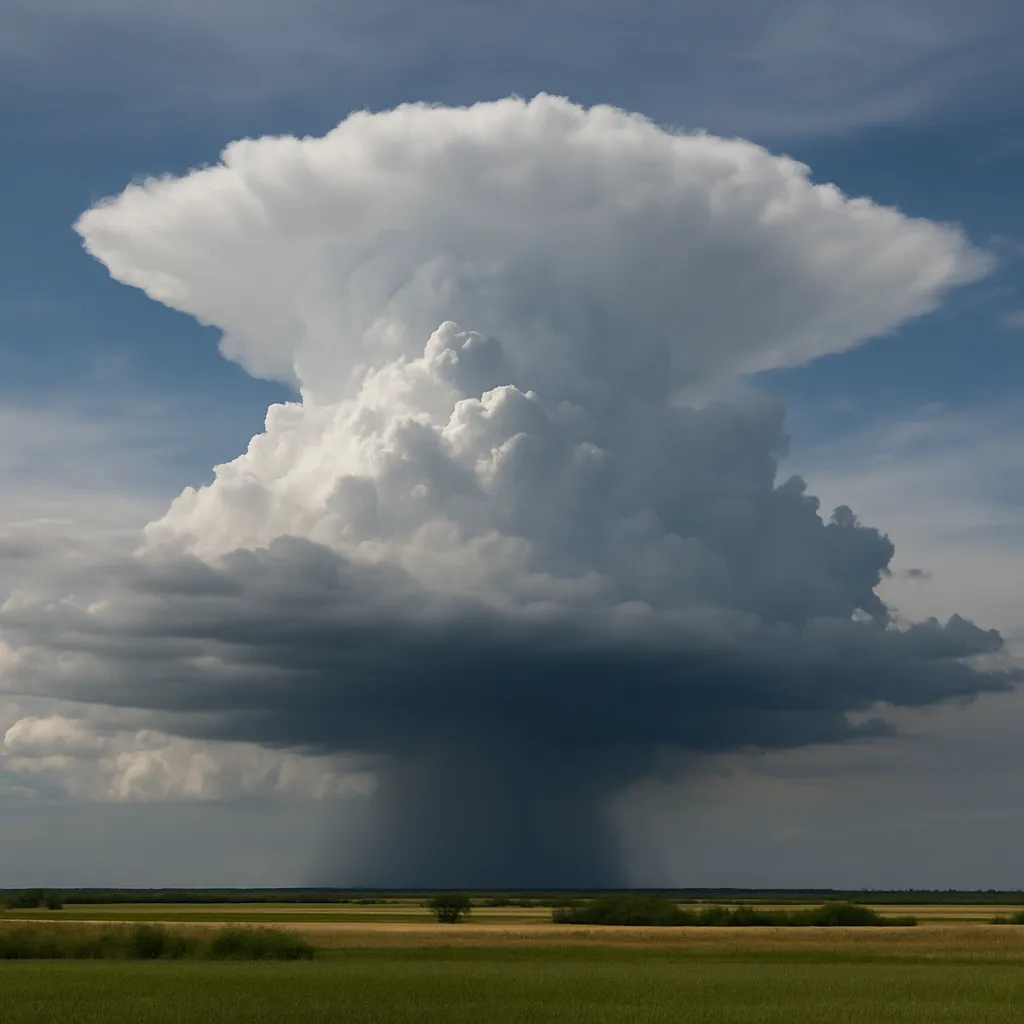
A sky photograph shows a tall storm cloud with a dark base and an anvil-shaped top. What cloud type is shown?
The photograph shows a gray-blue sheet of cloud through which the Sun appears dim and blurred. What cloud type is shown?
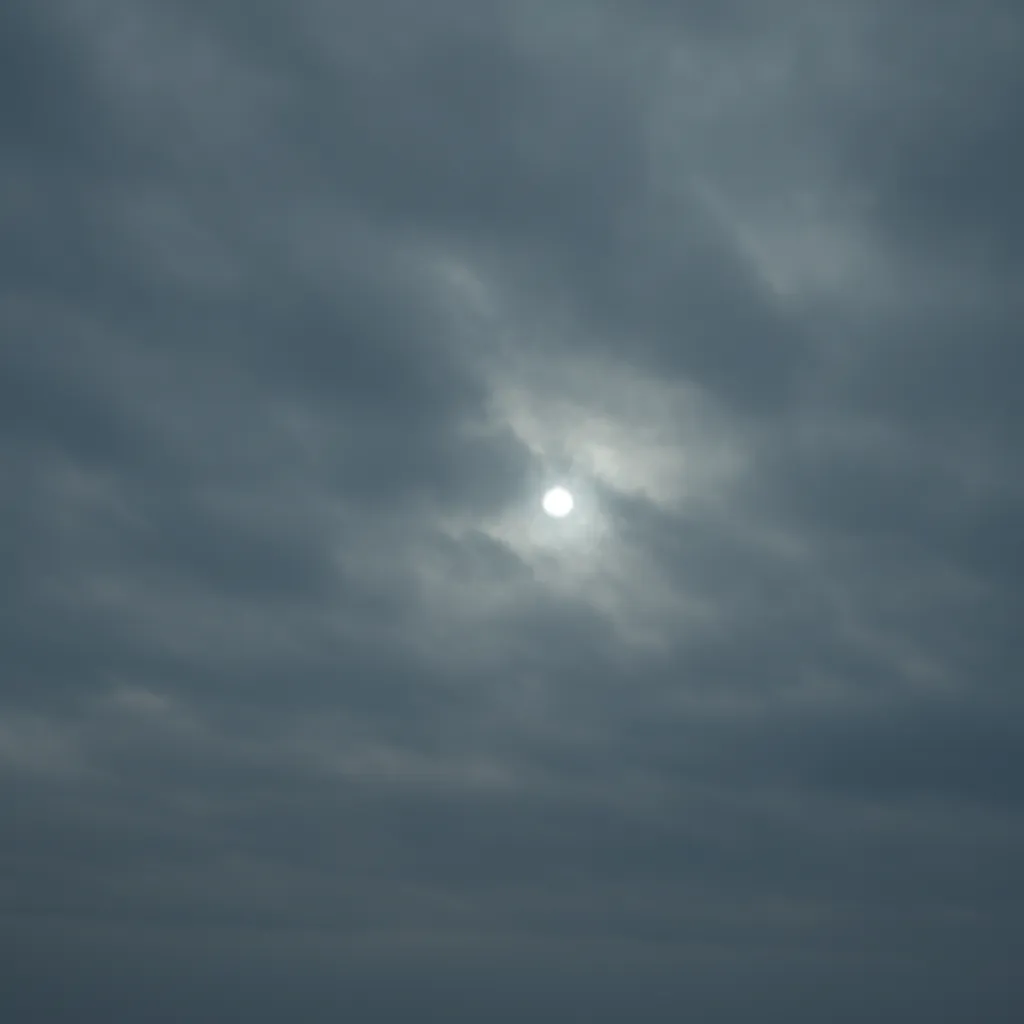
A photograph shows a dark, formless layer with steady rain falling from it. What cloud type is shown?

The sky image shows many small rippled white patches high overhead, like fish scales. What cloud type is shown?

A photograph shows gray-white rounded cloud rolls joined in a low broken layer. What cloud type is shown?
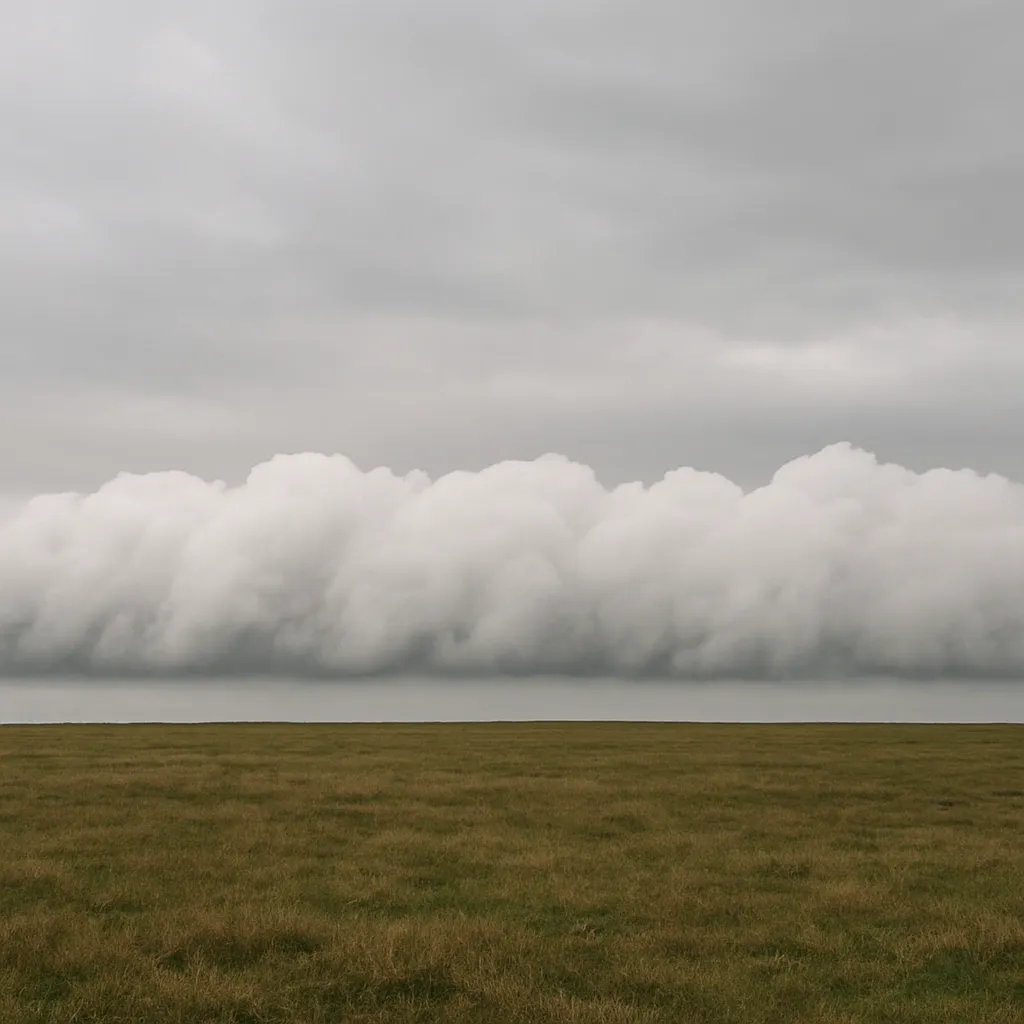
At a surface low, air converges and rises. Why does cloud cover often increase near the center?
Moist wind is forced up the windward side of a mountain. Why can orographic lifting produce clouds there?
A warm front makes warm, moist air glide upward over cooler surface air. What process forms broad layered clouds?
A cold front wedges under warm, humid air and a narrow band of cumulonimbus develops. What causes the cloud band?
On a humid sunny afternoon, rising thermals make cumulus clouds with nearly flat bases. What fixes the base height?
Cloud forms near a ridge crest as moist air climbs the windward slope. Why is the leeward slope often clearer?
Moist air blowing upslope develops foglike cloud along a hillside. What must happen for droplets to appear?
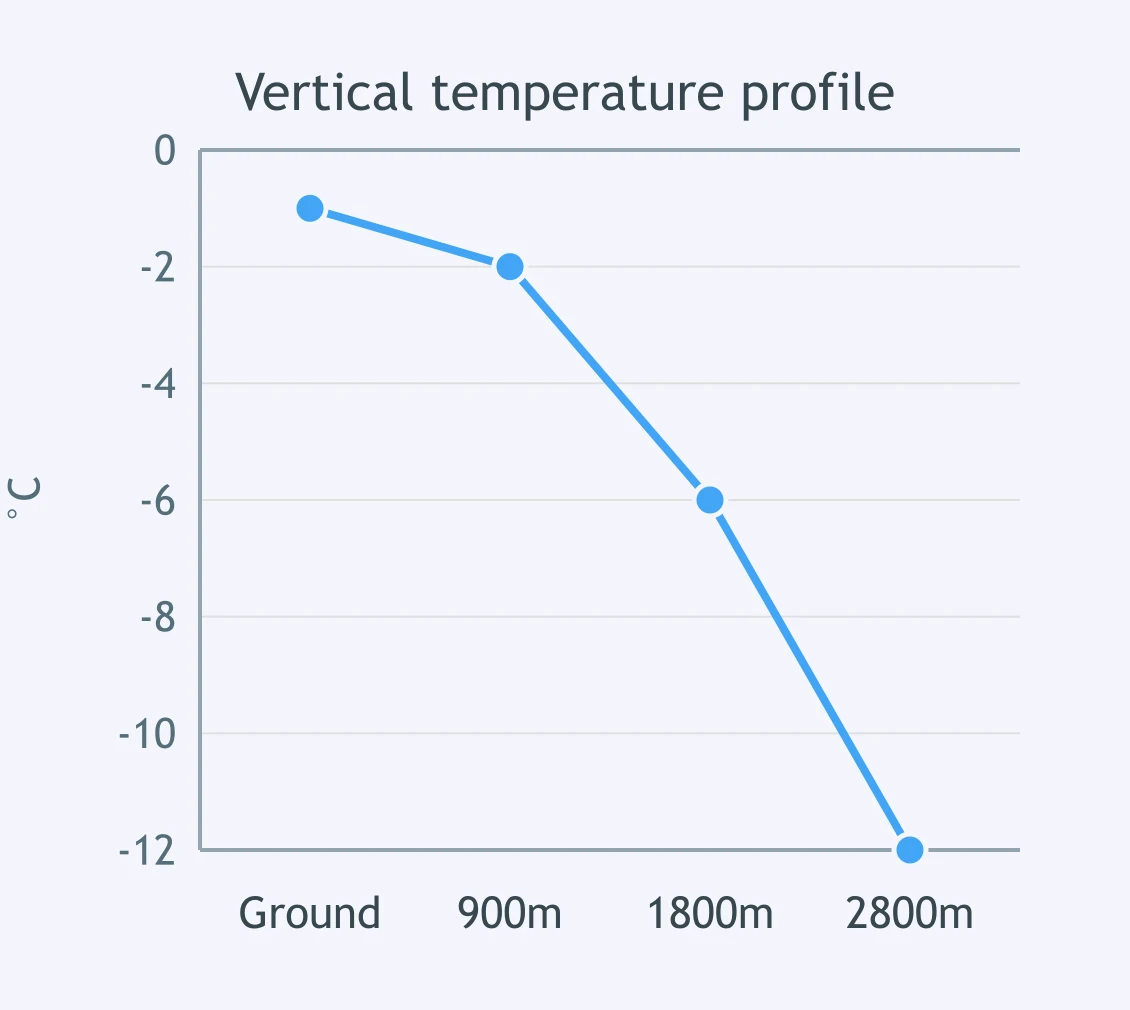
Use the plotted vertical temperature profile. Snow forms aloft and falls through the air column shown. What reaches the ground?
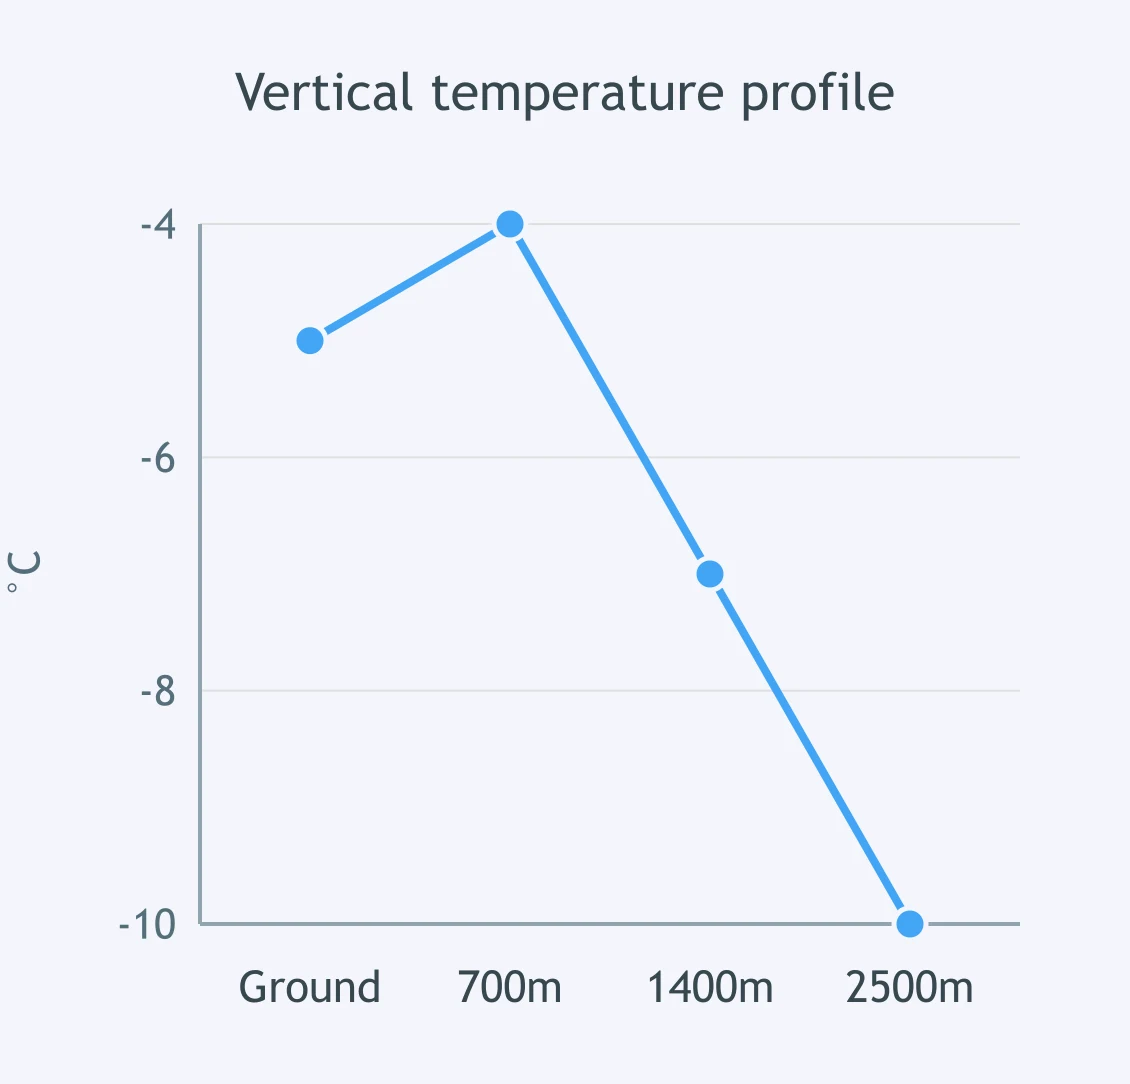
Use the plotted vertical temperature profile. Snow forms aloft and falls through the air column shown. What reaches the ground?
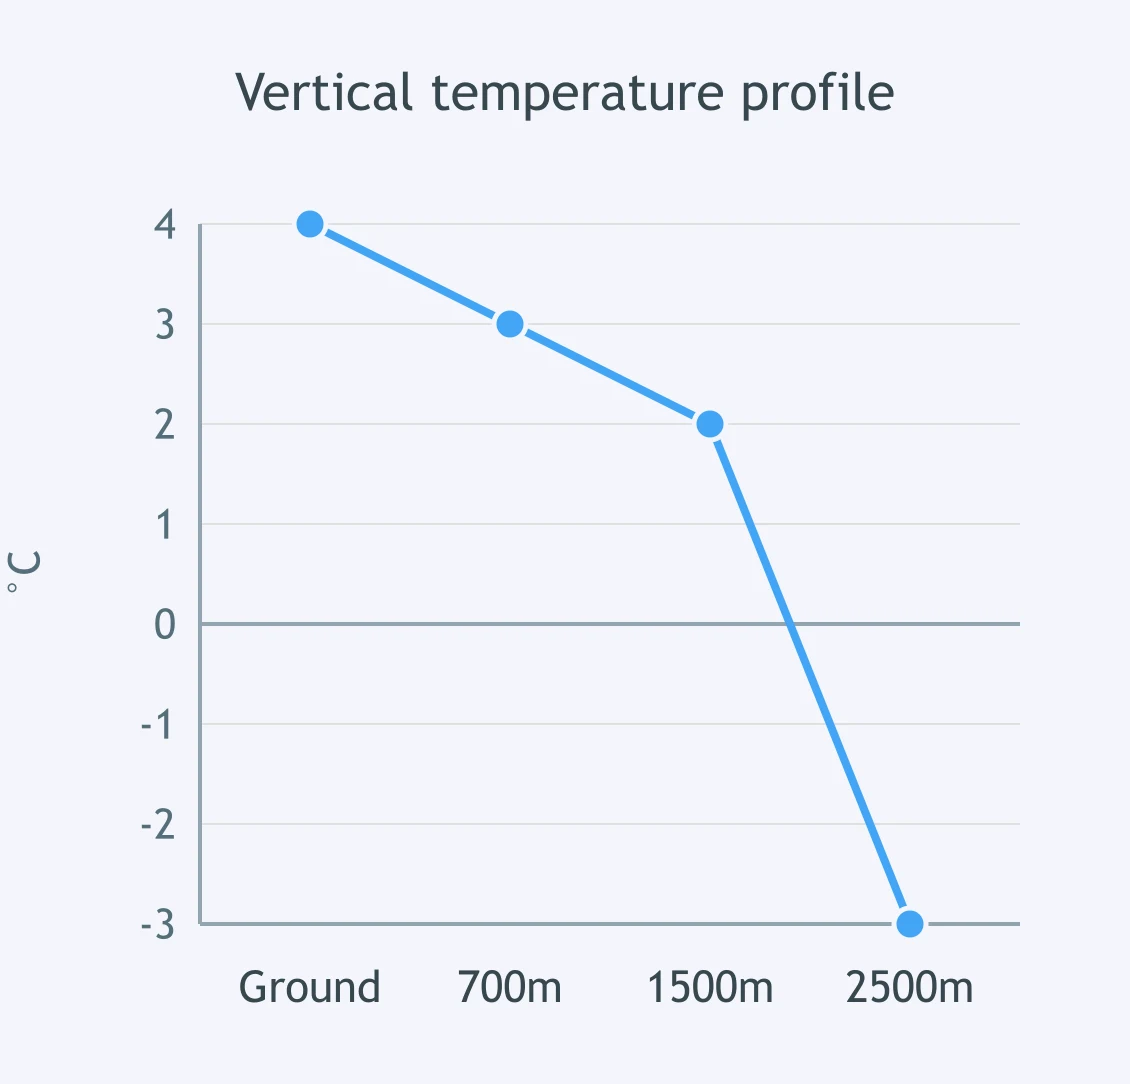
Read the vertical temperature profile for falling winter precipitation. What precipitation type reaches the ground?
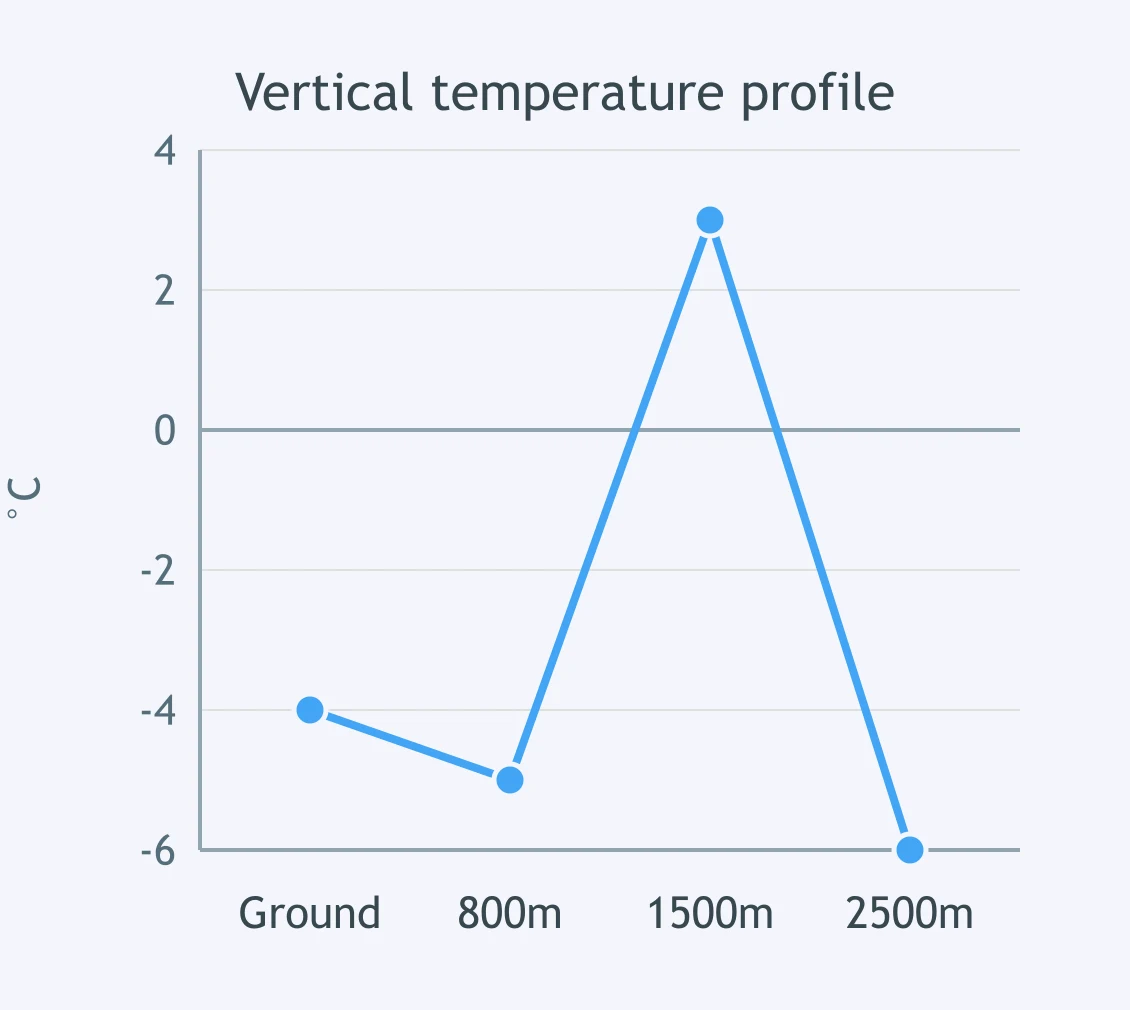
The plotted air column has snow falling from the cloud through the shown layers. What precipitation form should reach the surface?
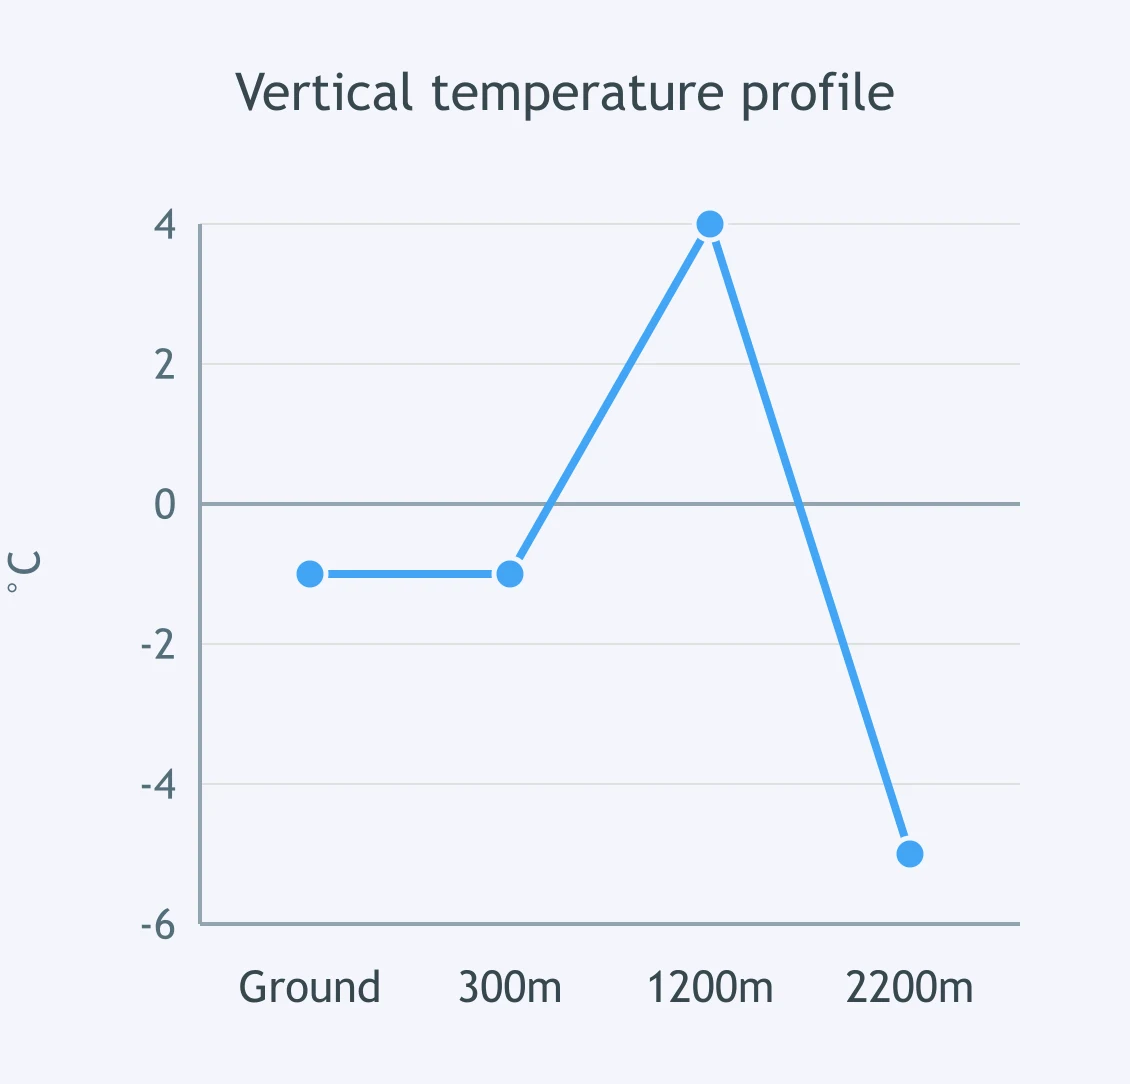
Use the vertical temperature profile to determine the precipitation type at the ground. Snow begins falling from aloft.
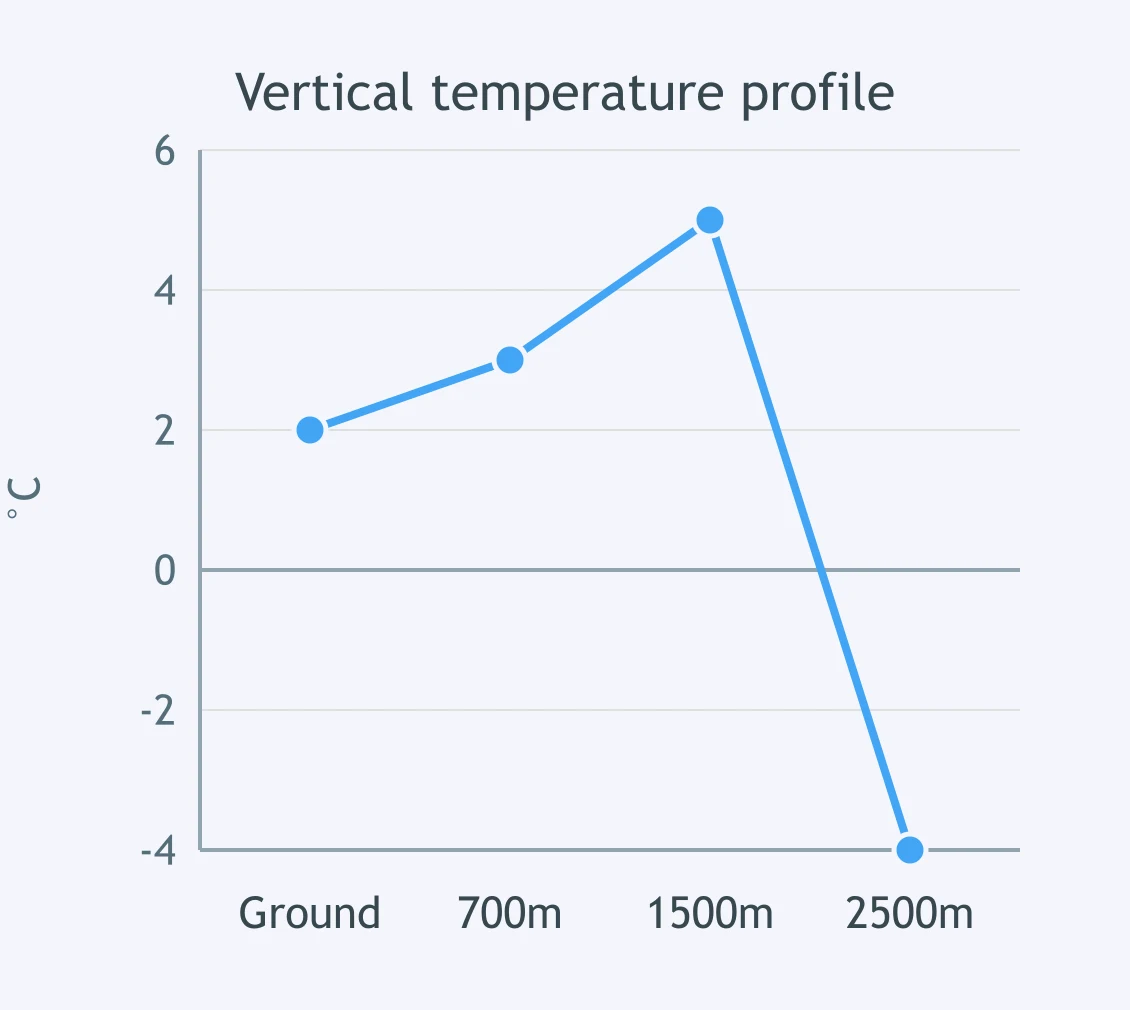
A winter precipitation profile is plotted for a station. Snow forms high in the cloud. What reaches the ground?
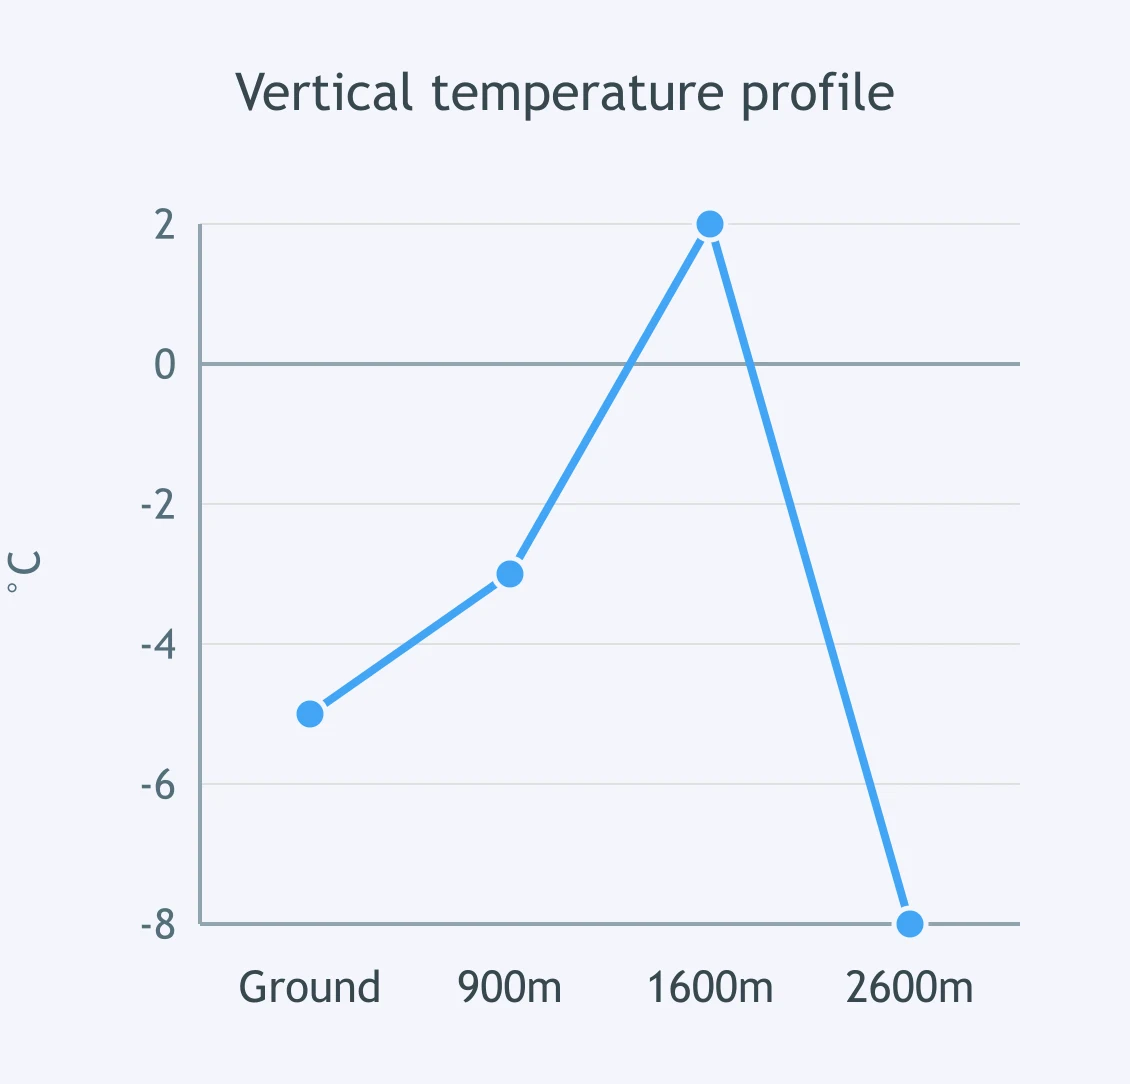
Use the vertical temperature profile. Falling crystals pass through the air column shown. What precipitation reaches the ground?
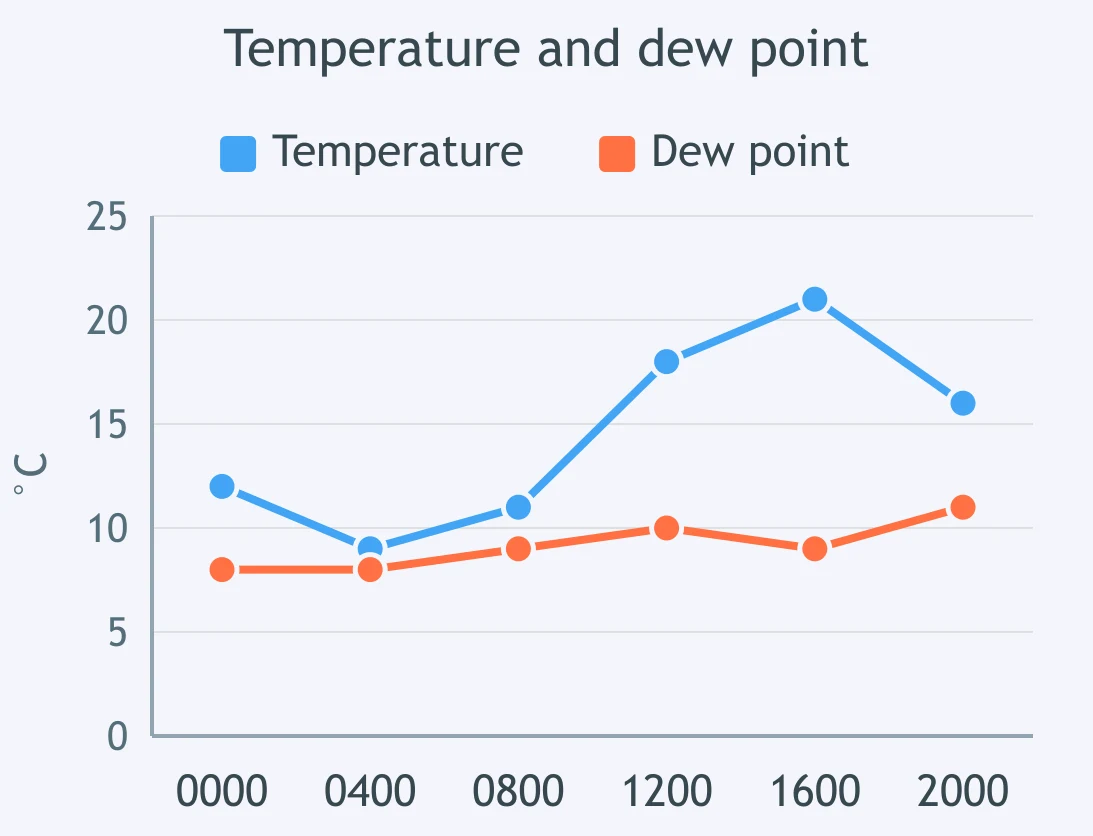
Use the temperature and dew point trace. At what plotted time is relative humidity highest?
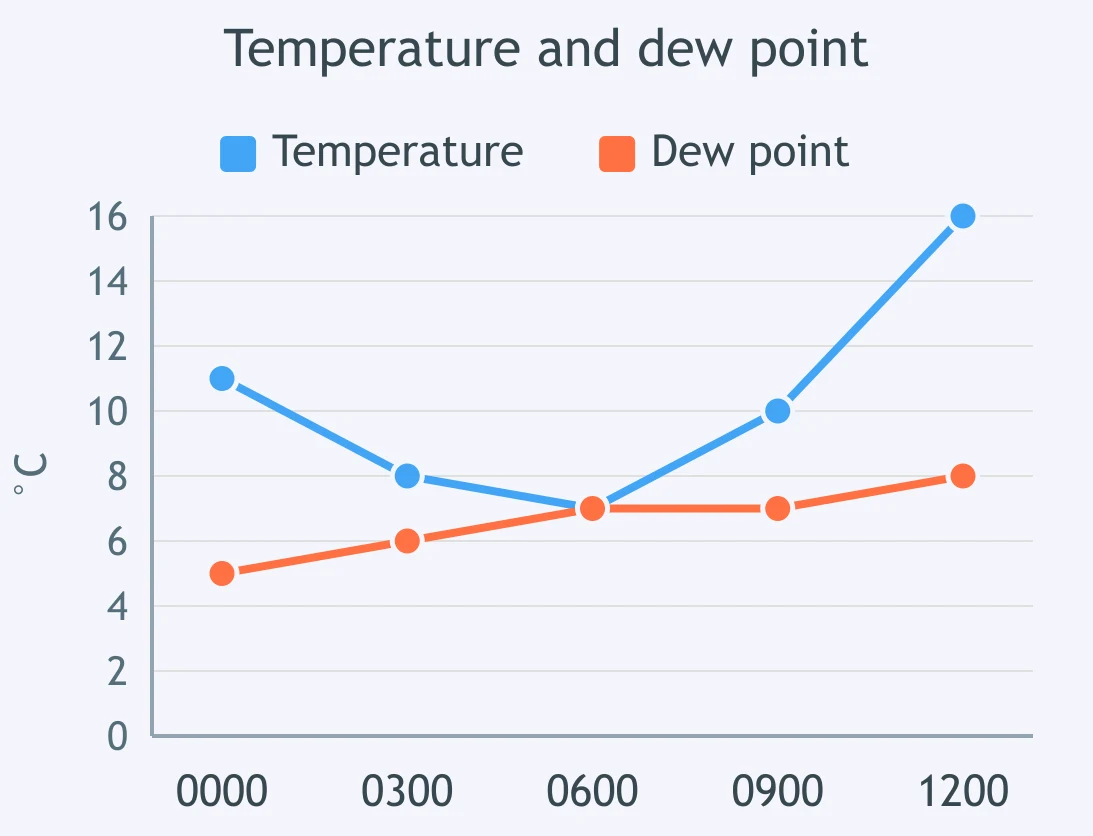
The line graph shows air temperature and dew point through the morning. At which plotted time is fog most likely?
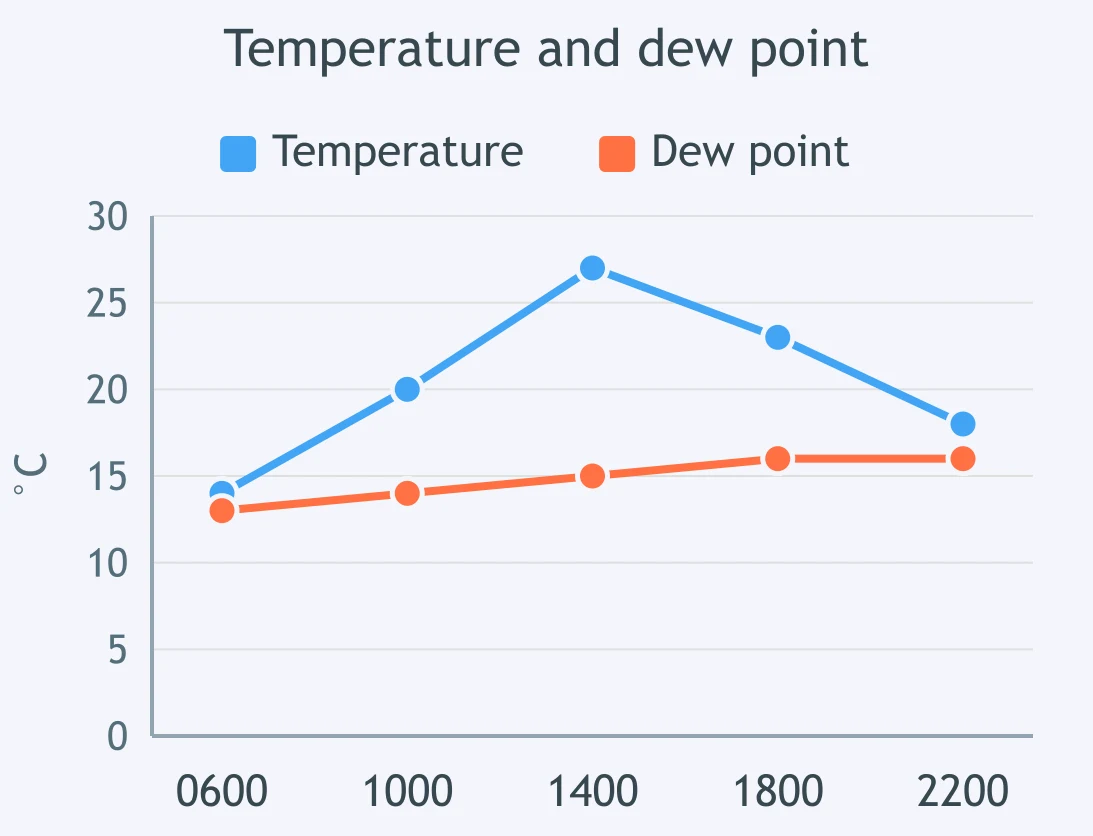
Read the temperature and dew point graph. At what plotted time is relative humidity lowest?
The graph shows evening cooling toward saturation. At what first plotted time does condensation become likely?
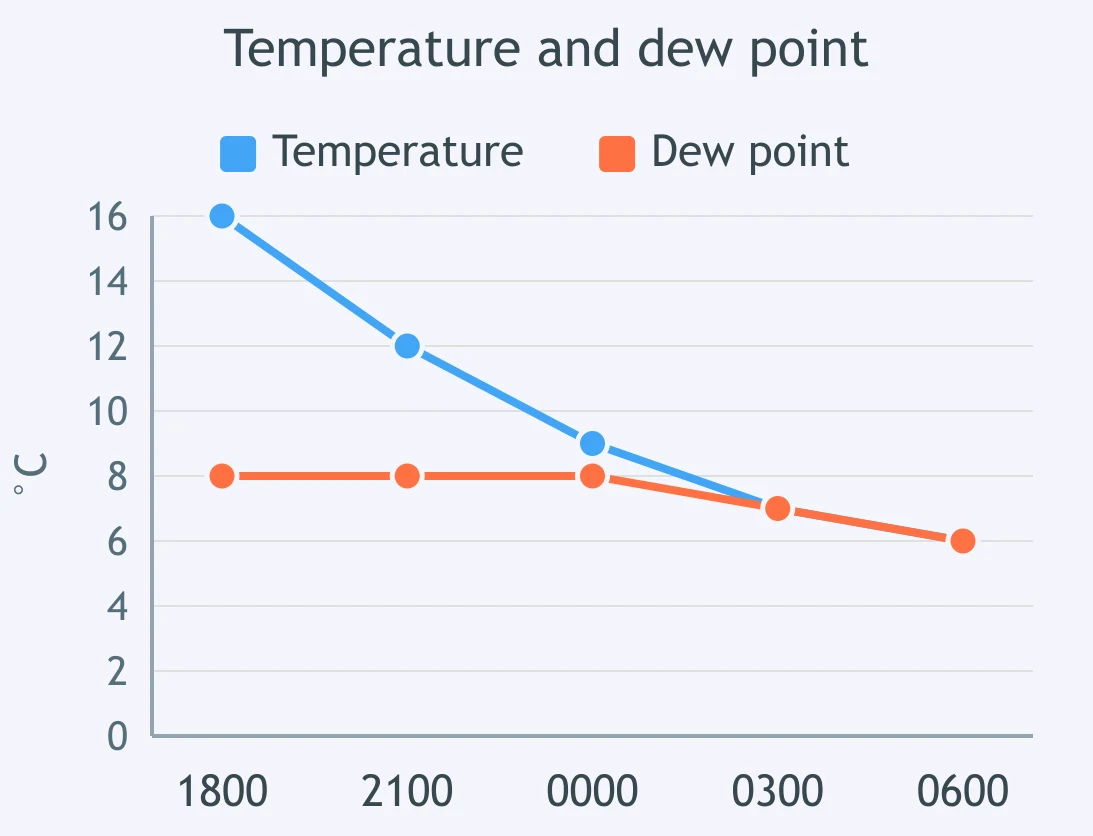
Use the plotted temperature and dew point data. At which hour does the air contain the greatest amount of water vapor?
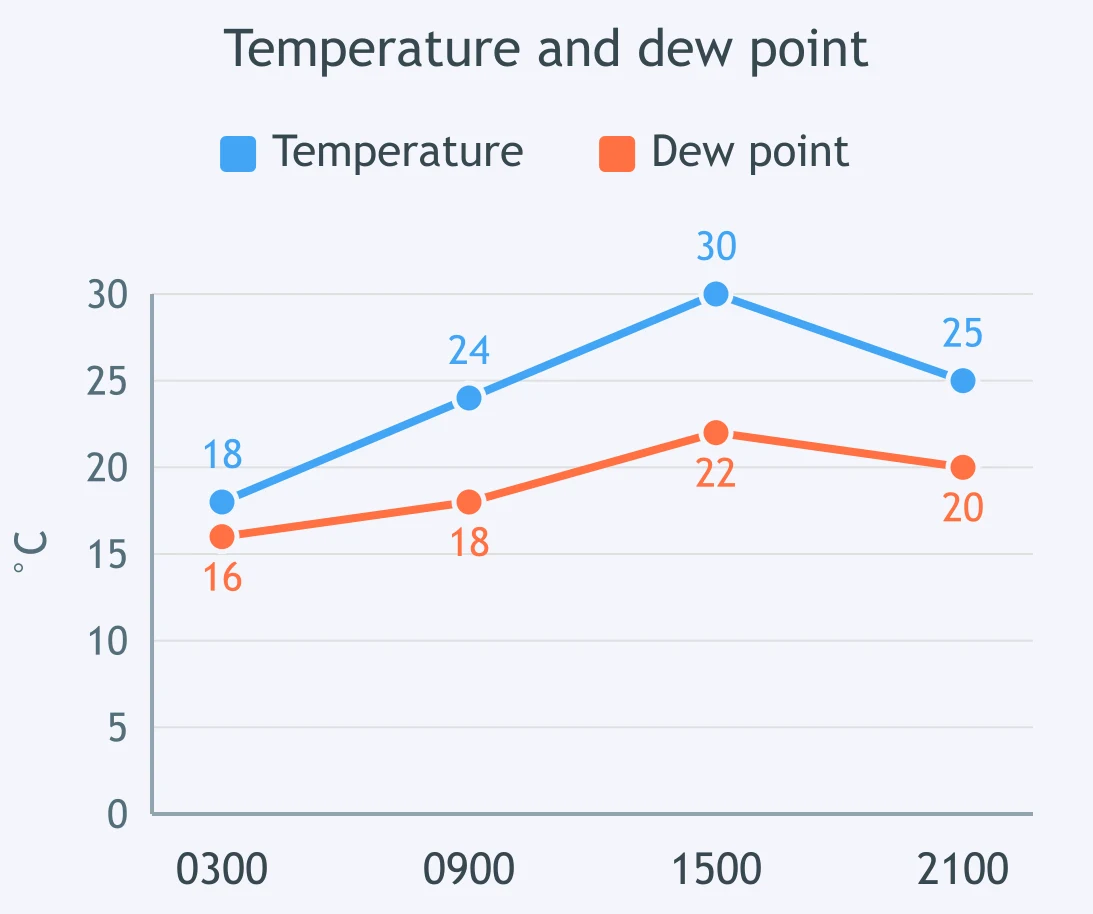
Use the graph of air temperature and dew point. What happens to relative humidity from 0800 to 1700?
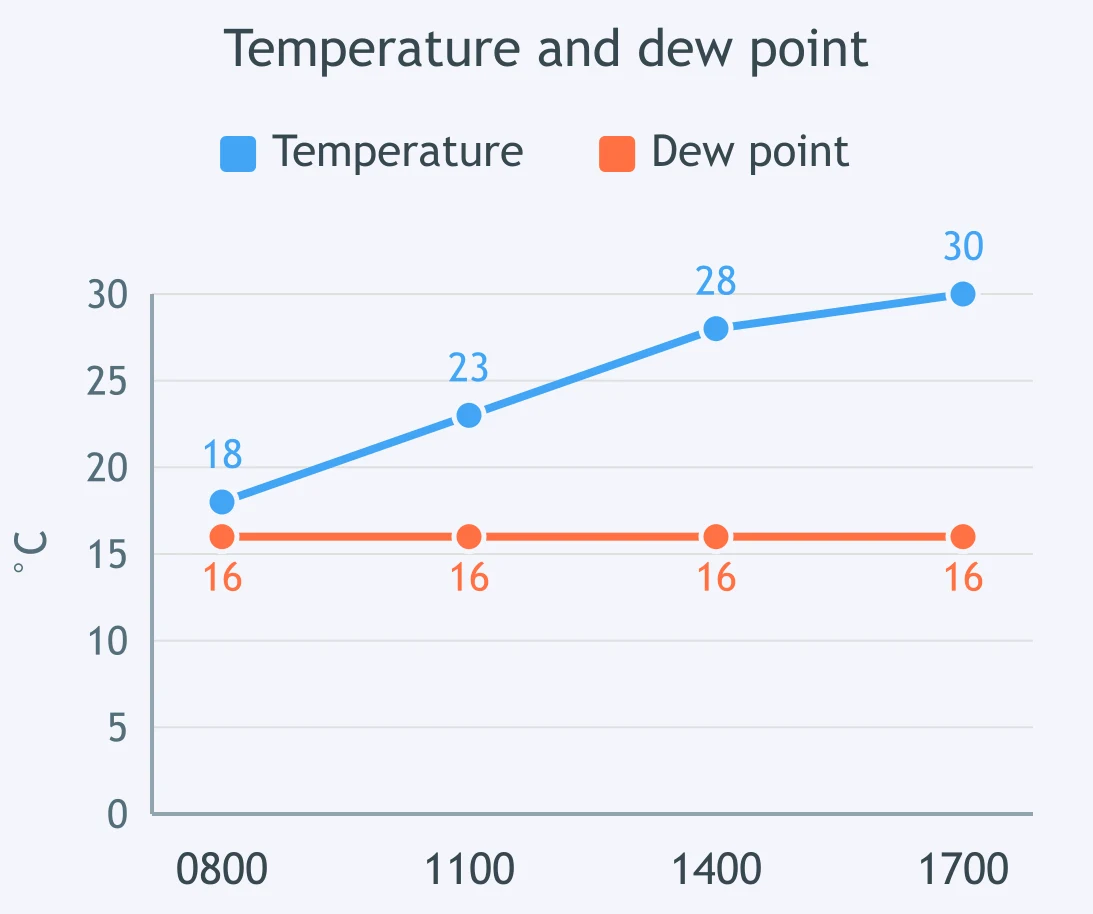
Two unsaturated air samples are both 22 °C. Sample A has a dew point of 18 °C, and Sample B has a dew point of 8 °C. Which sample contains more water vapor?
Sample A is 28 °C with a dew point of 10 °C. Sample B is 16 °C with a dew point of 10 °C. Which sample has the higher relative humidity?
Sample A is 20 °C with a dew point of 18 °C. Sample B is 30 °C with a dew point of 18 °C. Which sample has more actual water vapor?
Crack the passcode before the zombies get in.
Answer, then swat bugs for bonus points.
Race through questions at your own speed.
Same question on every screen. Fastest wins.

Pick a tile, answer, hit bonuses and steals.
40 questions