Loading
by BlastRoom
NOAA/NWS-based practice decoding station plots and synoptic maps; sources: https://www.wpc.ncep.noaa.gov/html/stationplot.shtml, https://www.weather.gov/jkl/education, https://www.weather.gov/lmk/basic-fronts.
#earth_space_science
60 questions
One question set, multiple game modes. Tap any game to see it in action. Not sure which to pick?
Answer to place stones and capture territory.
Outrun the snow together.
Earn blasts, then hunt the other team.
Answer to earn energy, then climb.

The class blasts through walls together.
Bid on mystery lots. Most money wins.
Sell tours. Nice, standard, or a total scam.

Answer, restock, and serve the rush.
More correct answers pulls the rope your way.
Answer, then shoot down the alien wave.
Answer, then tap to leap the frozen ridge.
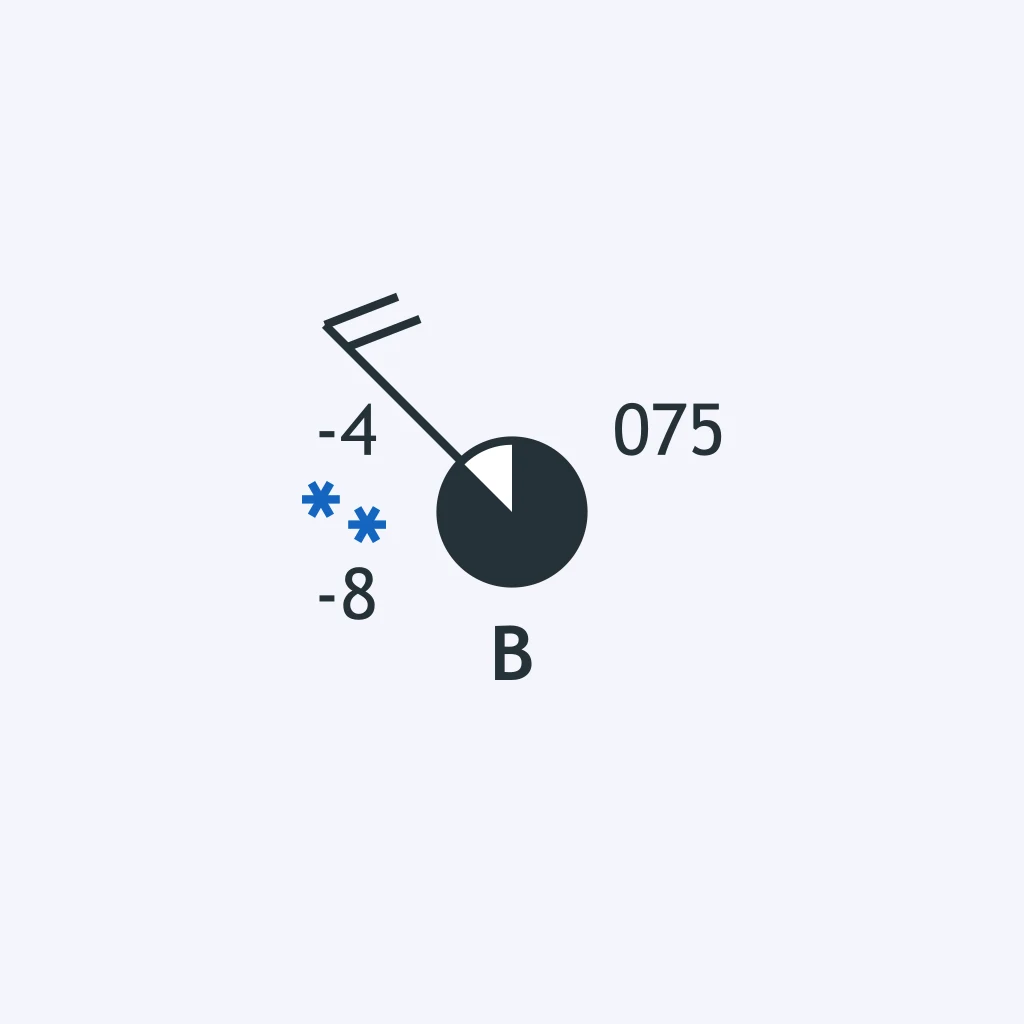
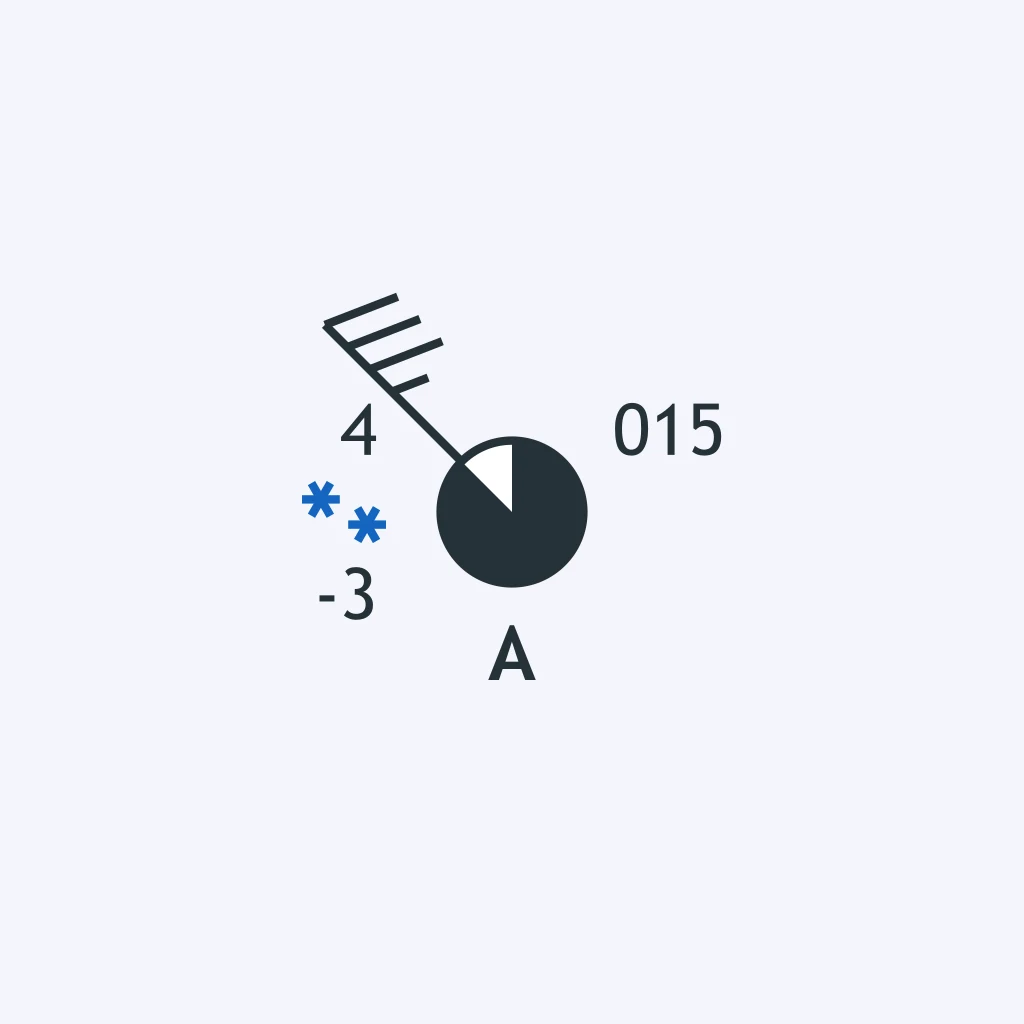
Station A's model is plotted in standard format. What dew point temperature is reported at Station A?
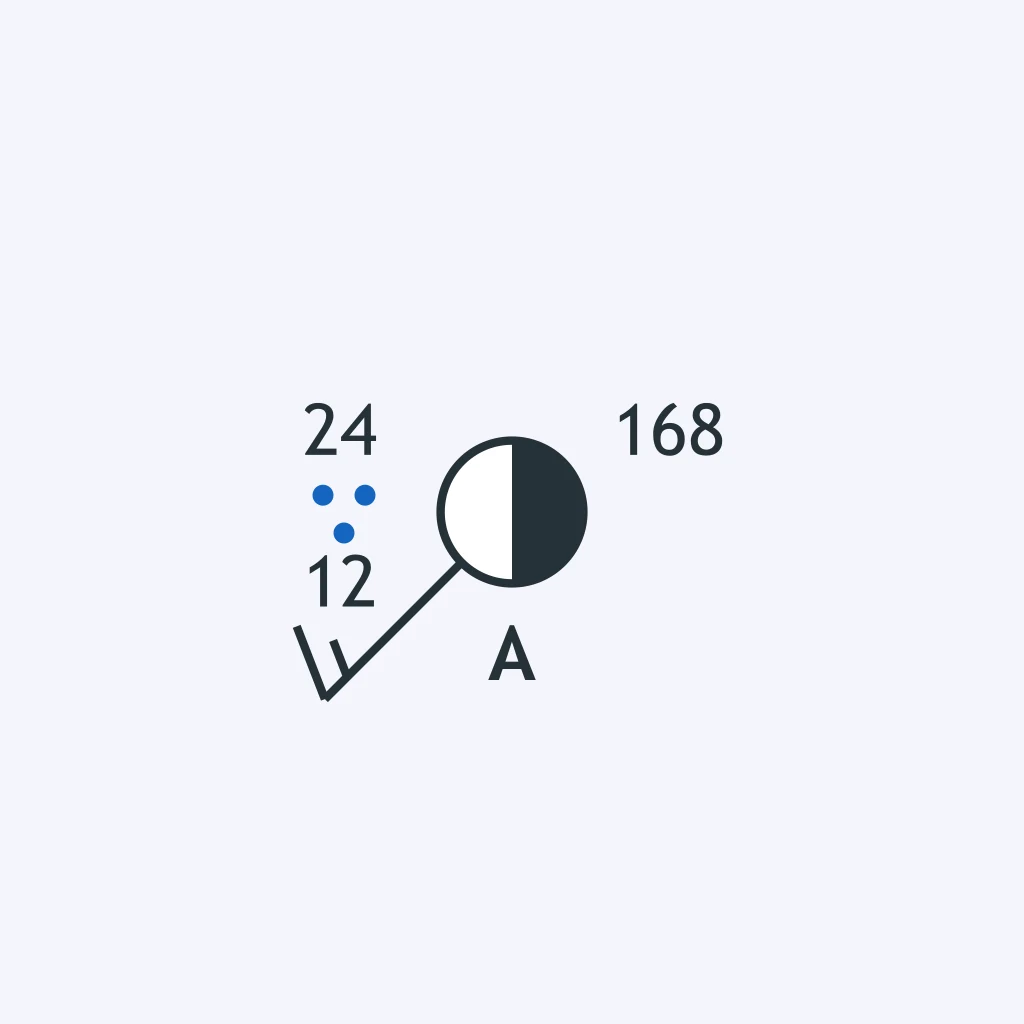
Use Station B's plotted model. What air temperature is shown for Station B?
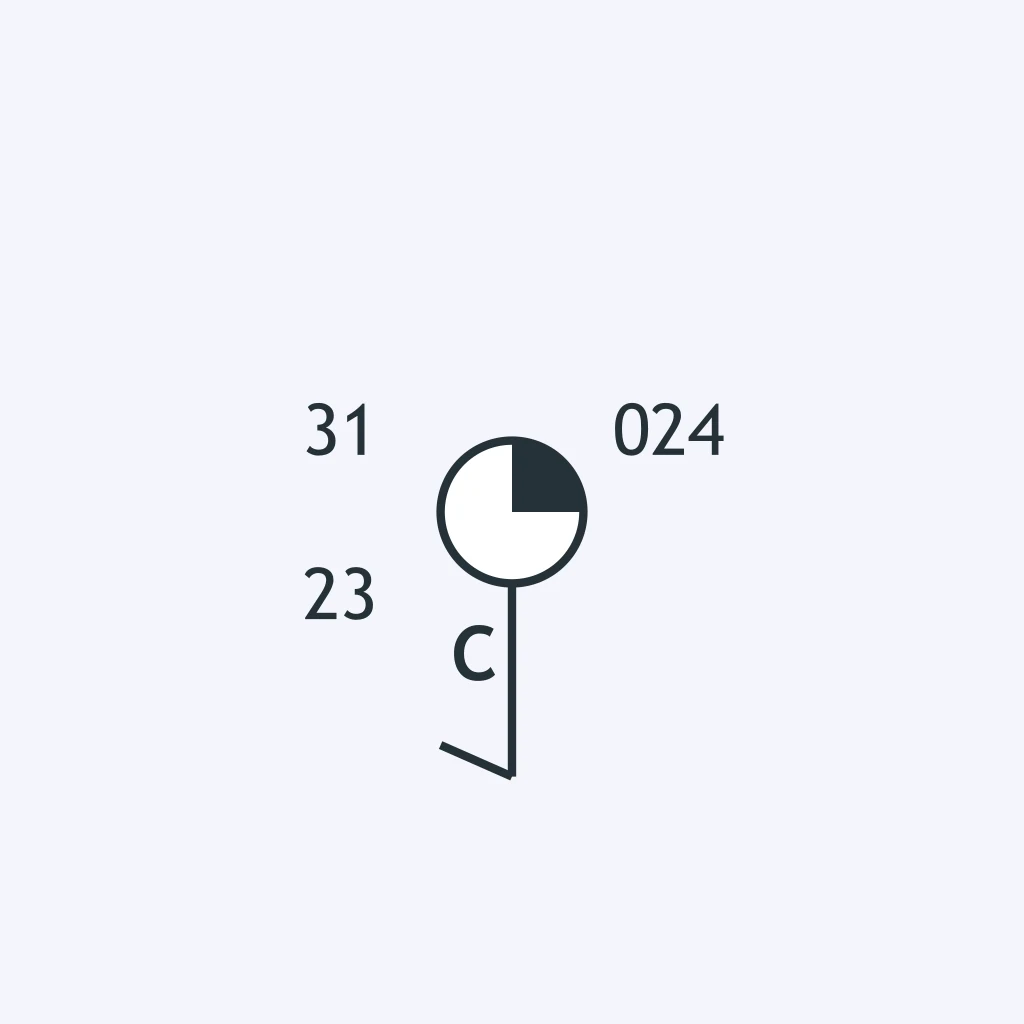
Station C has a standard station model. What dew point temperature is plotted for Station C?
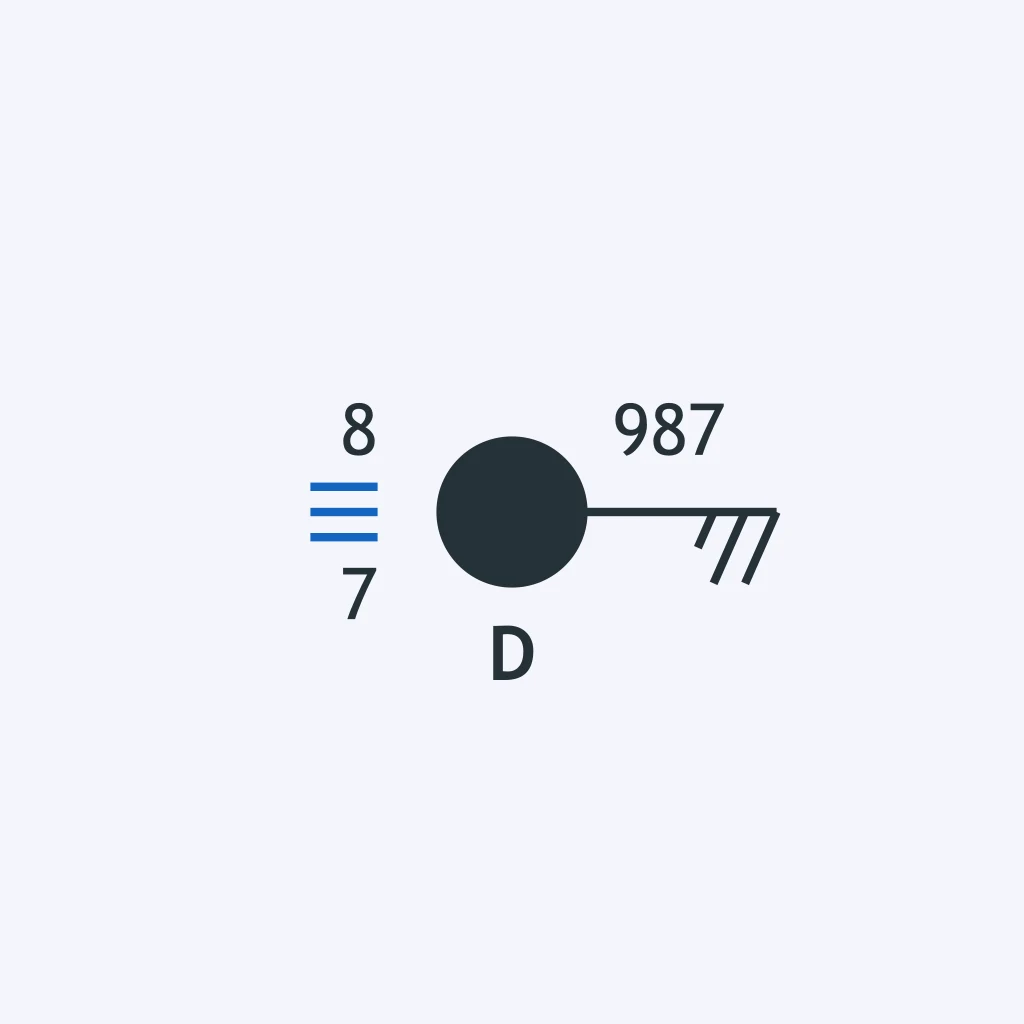
Read Station D's plotted data. What air temperature is reported at Station D?
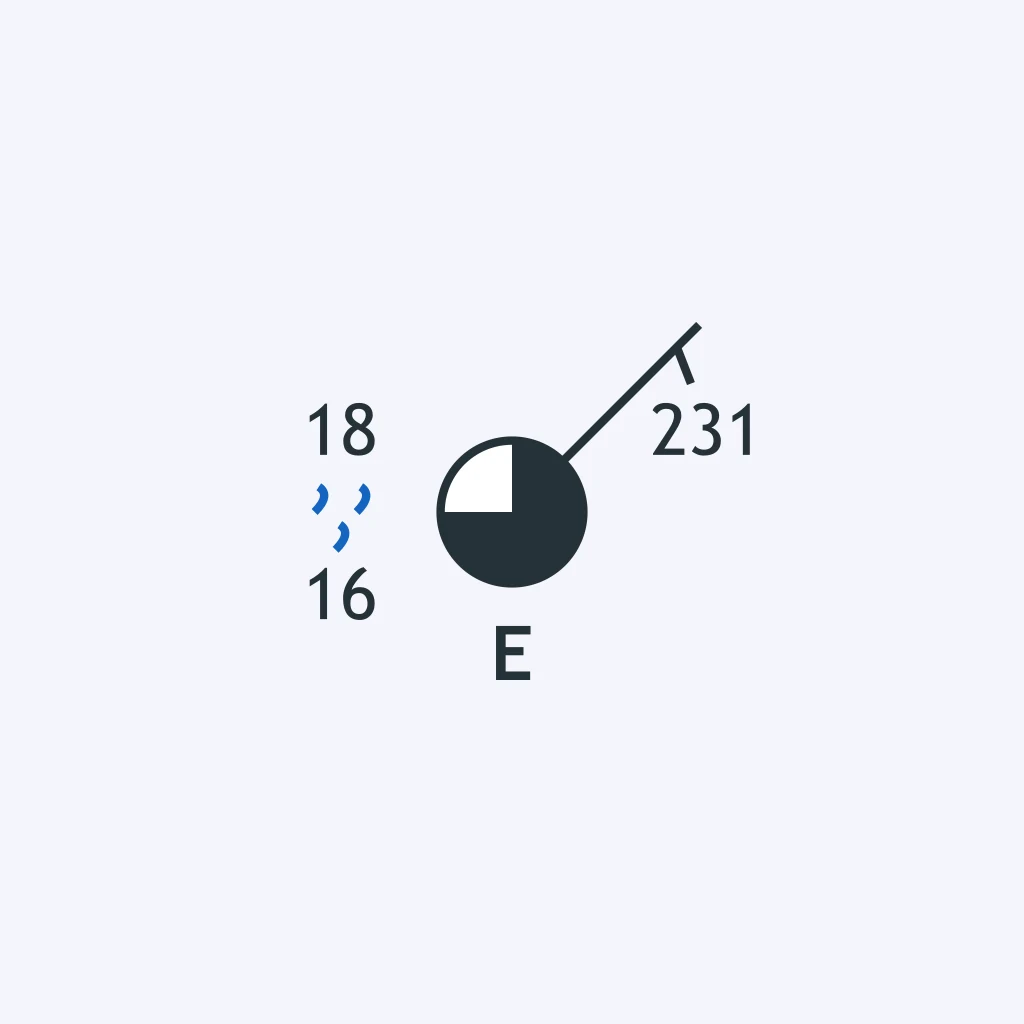
At Station E, what dew point temperature is shown on the station model?
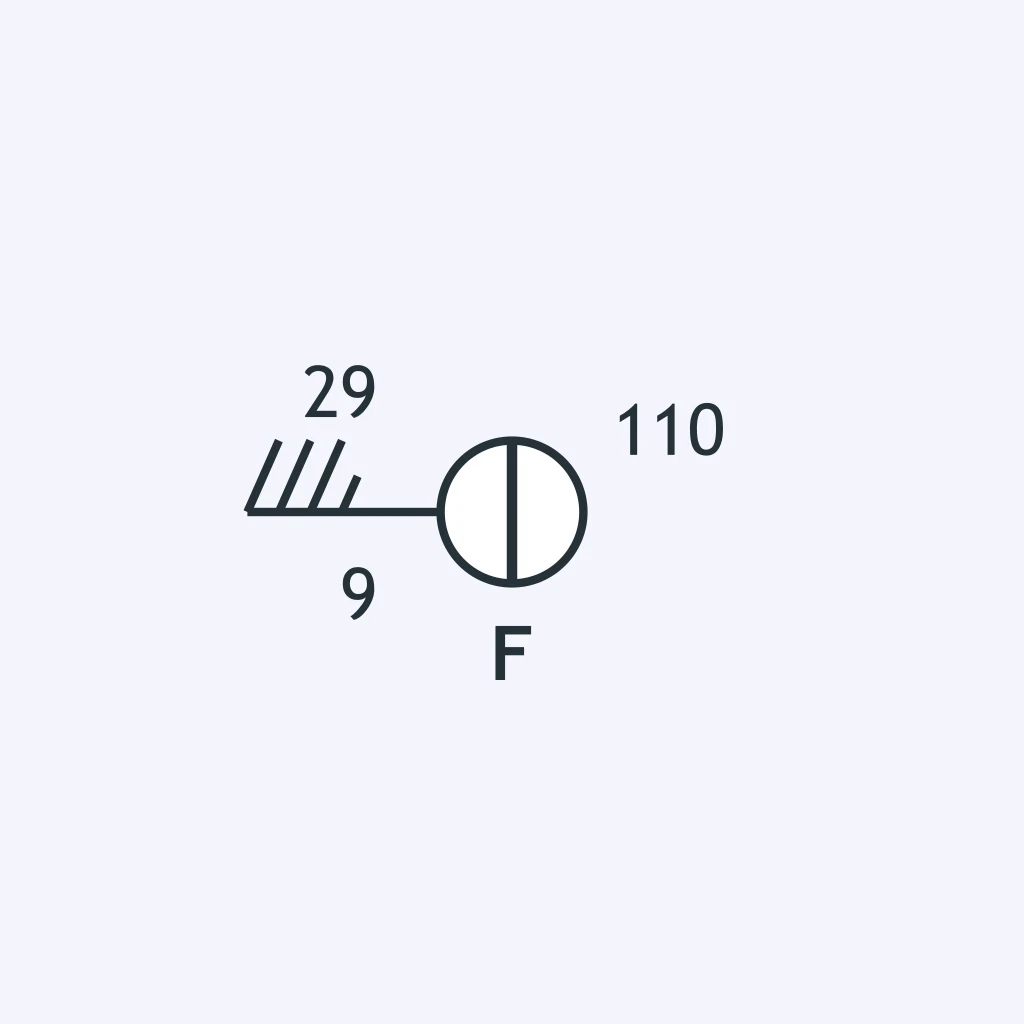
The figure shows Station F in standard station-model format. What is the air temperature?
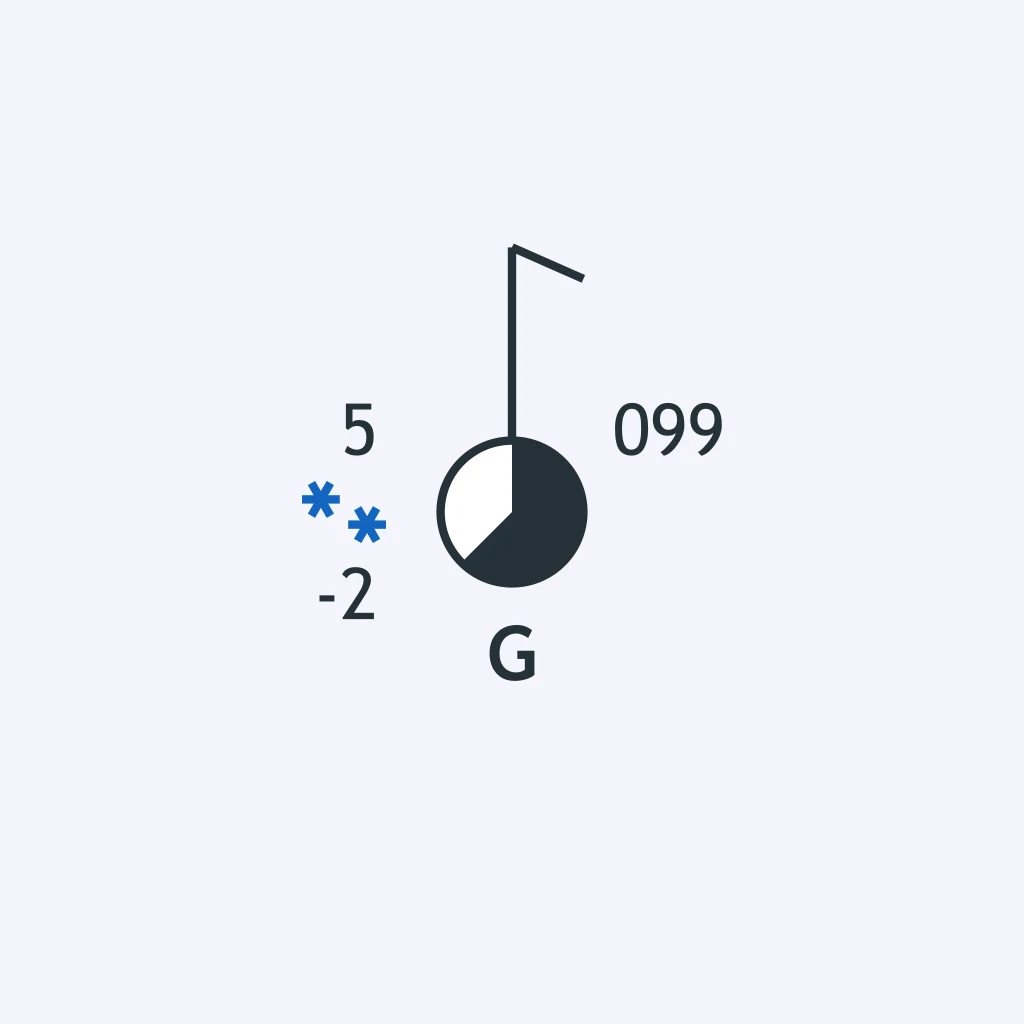
Look at Station G's model. What dew point temperature is reported?
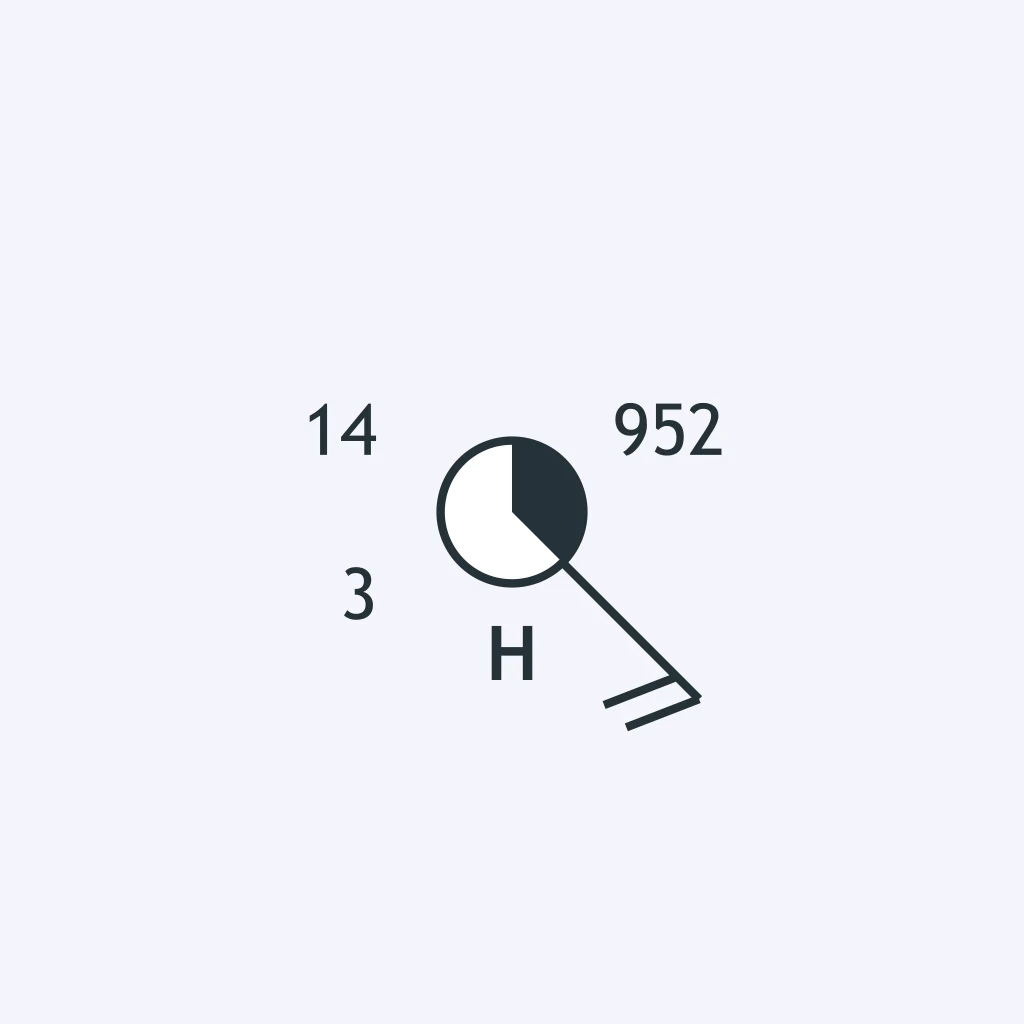
For Station H, what air temperature is plotted on the model?
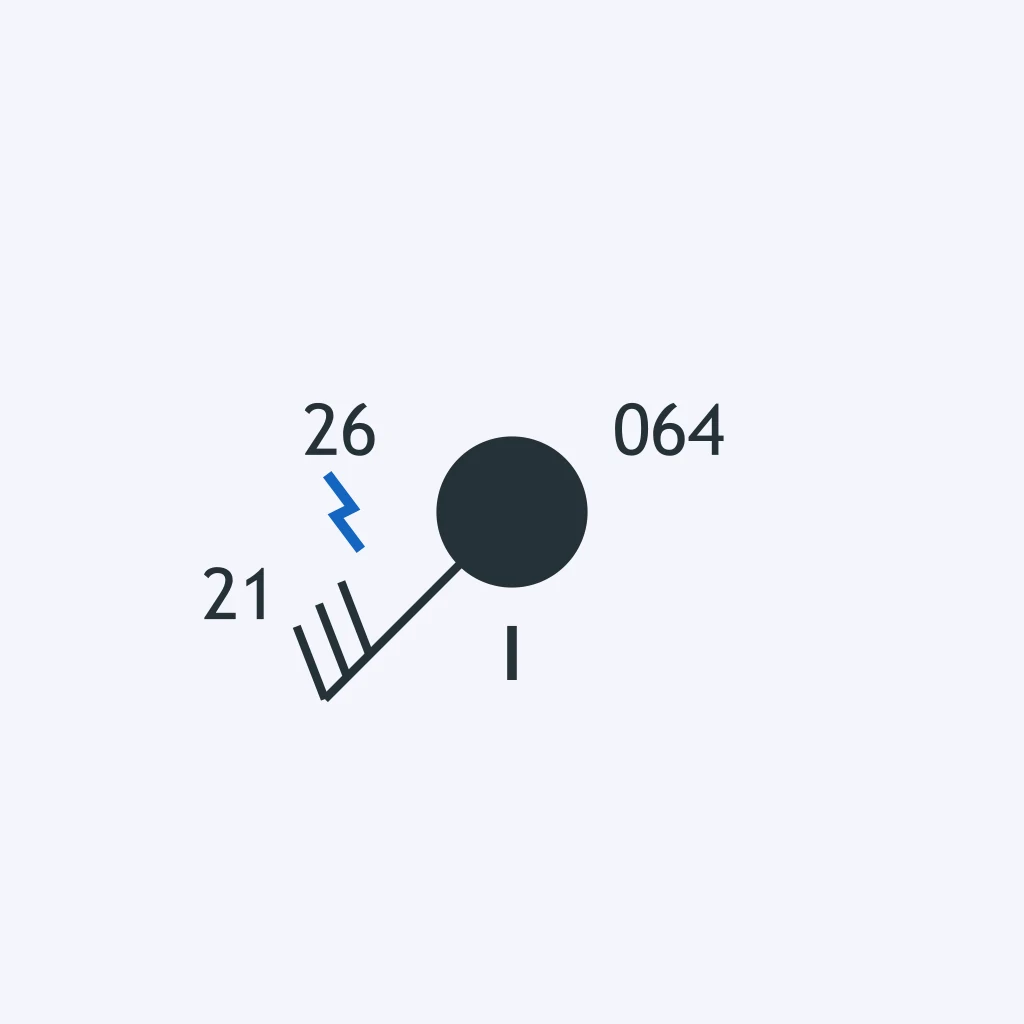
Station I reports several weather elements. What dew point temperature is plotted?
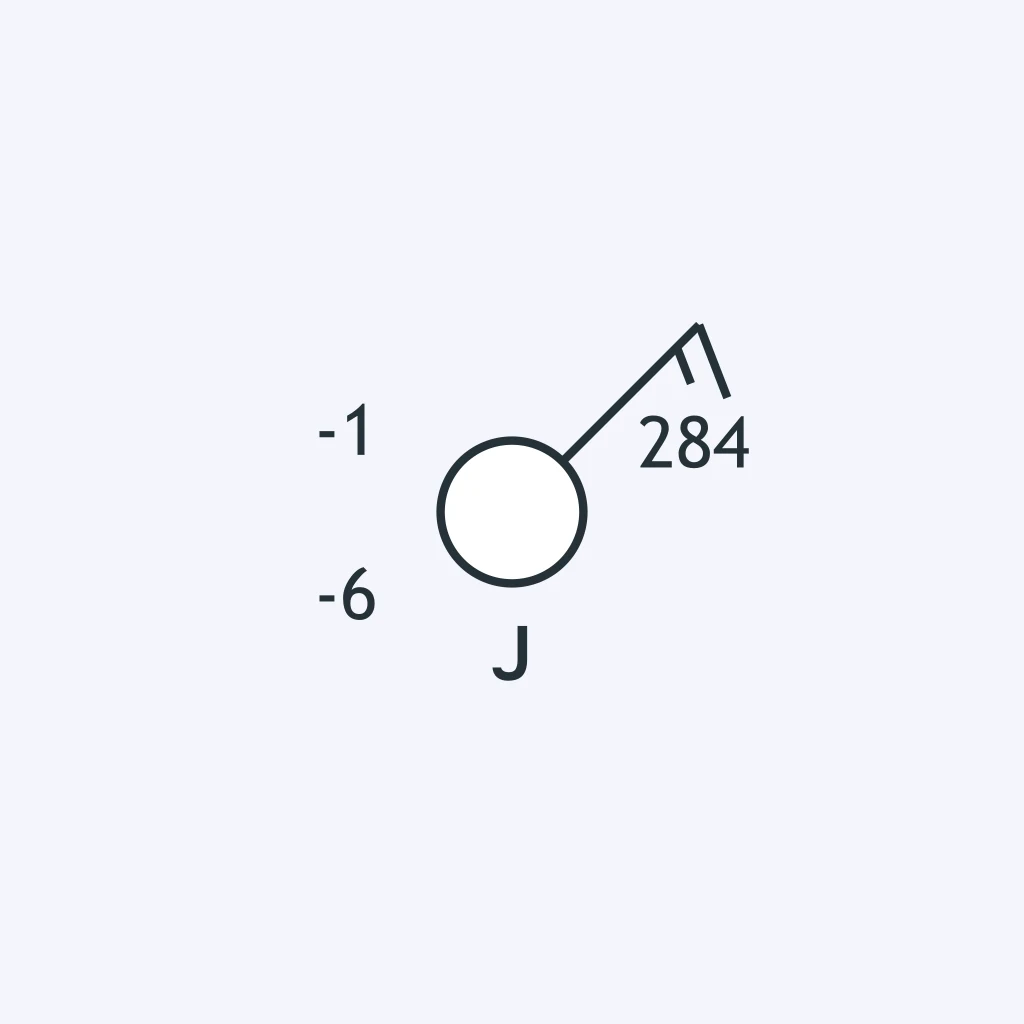
Read Station J's station model. What is the air temperature?
Station K's upper-right pressure code must be decoded. What is the actual sea-level pressure?
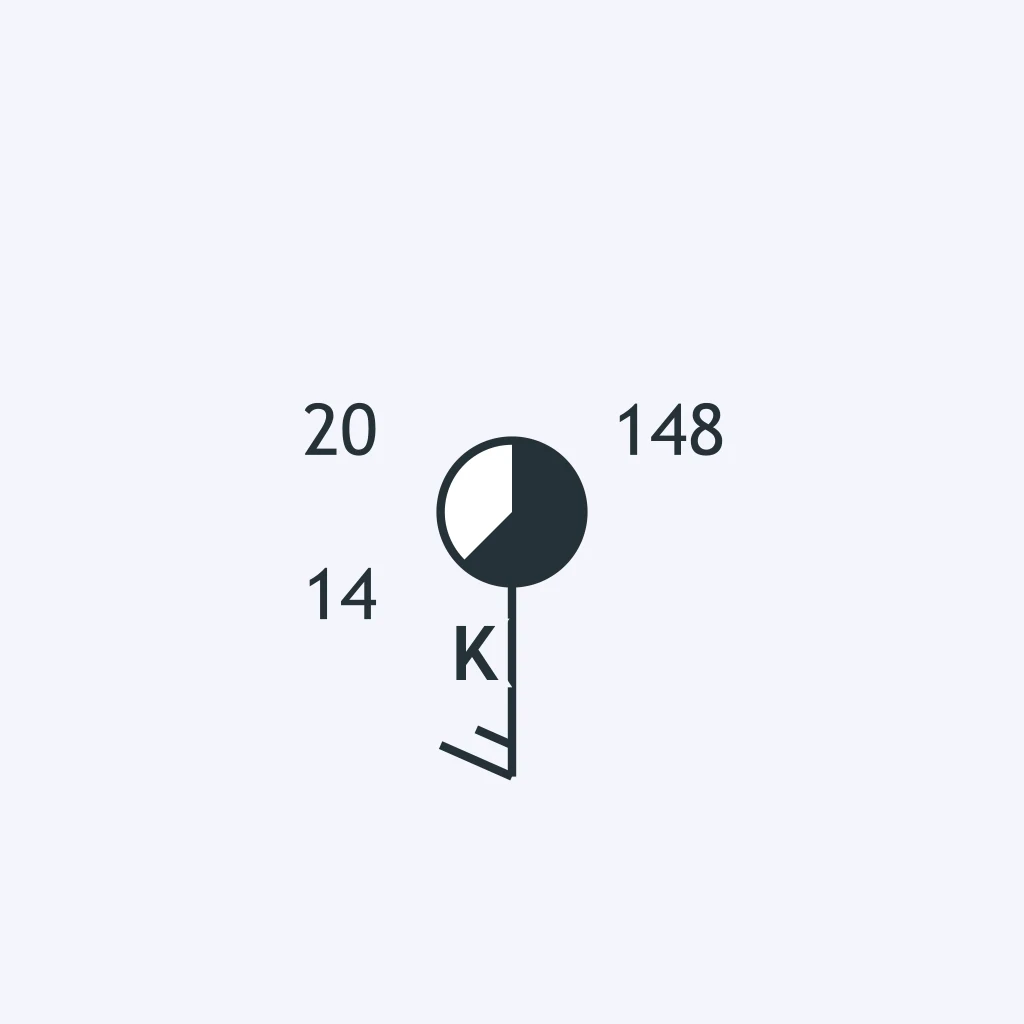
The upper-right number on Station L is a coded sea-level pressure. What actual pressure does it represent?
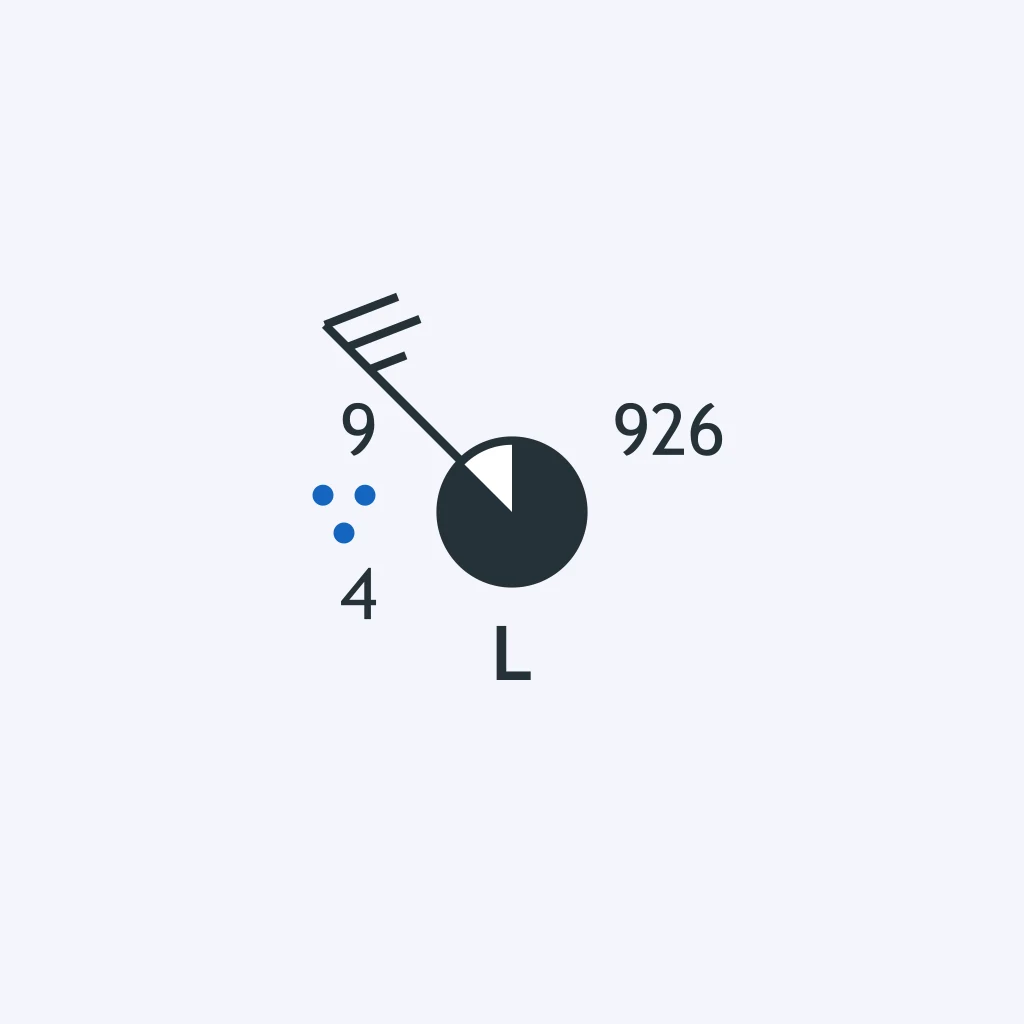
Decode Station M's sea-level pressure from the pressure code in the upper-right position.
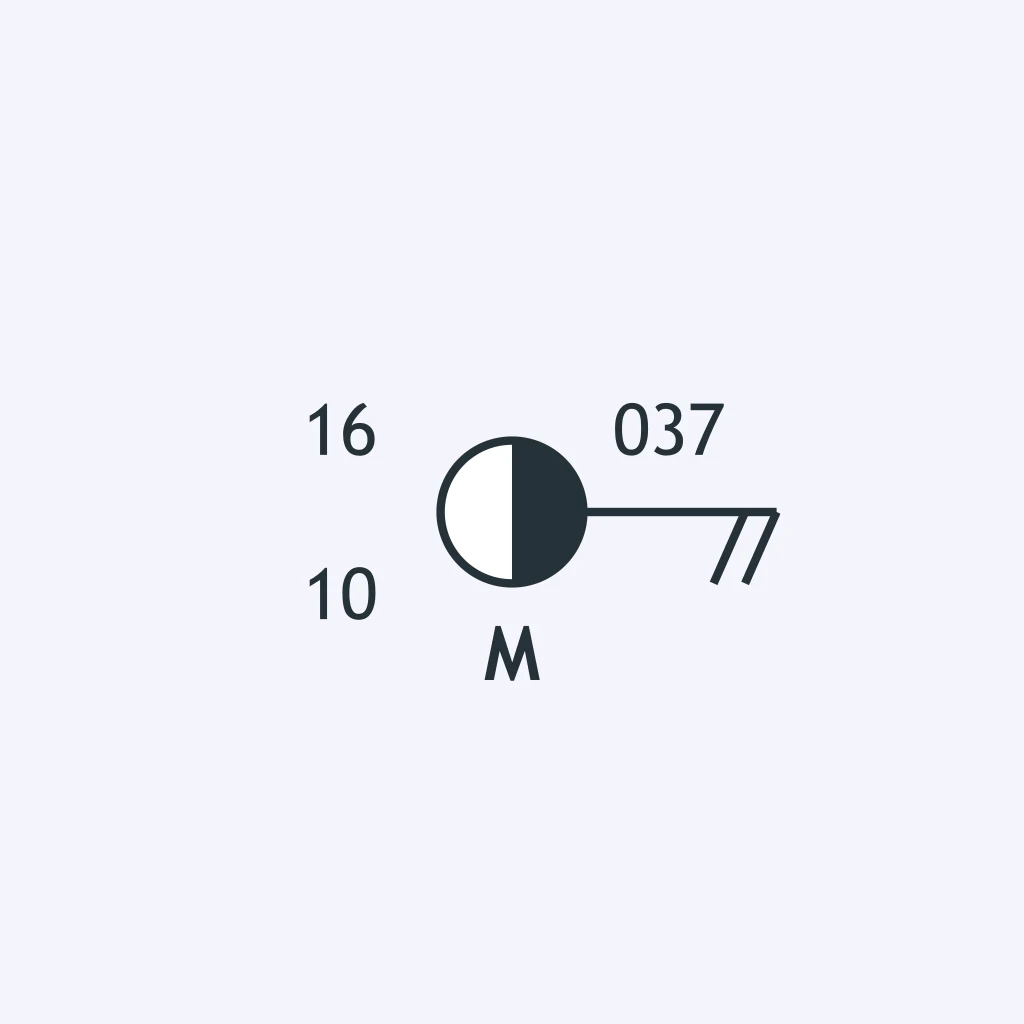
What actual sea-level pressure is shown by Station N's three-digit pressure code?
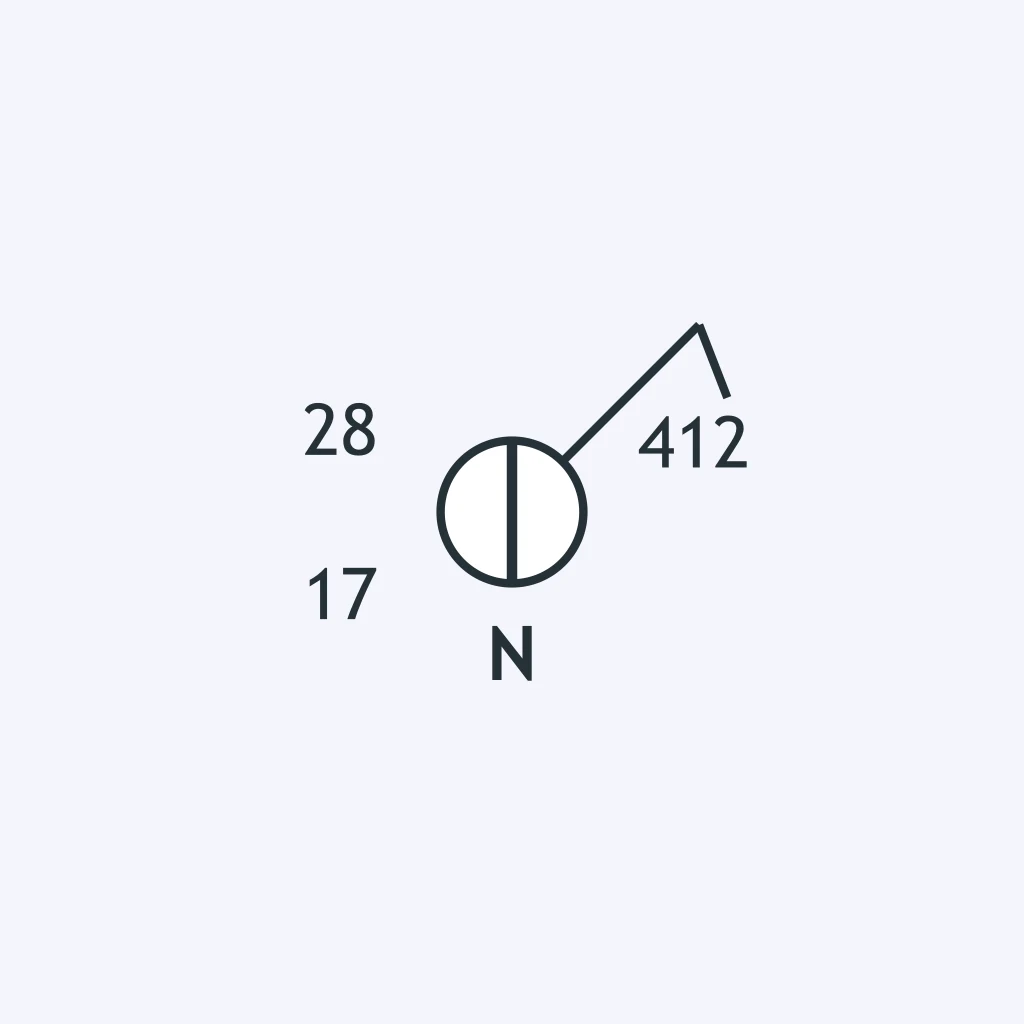
Station O's model gives coded sea-level pressure in the upper right. What is the actual pressure?
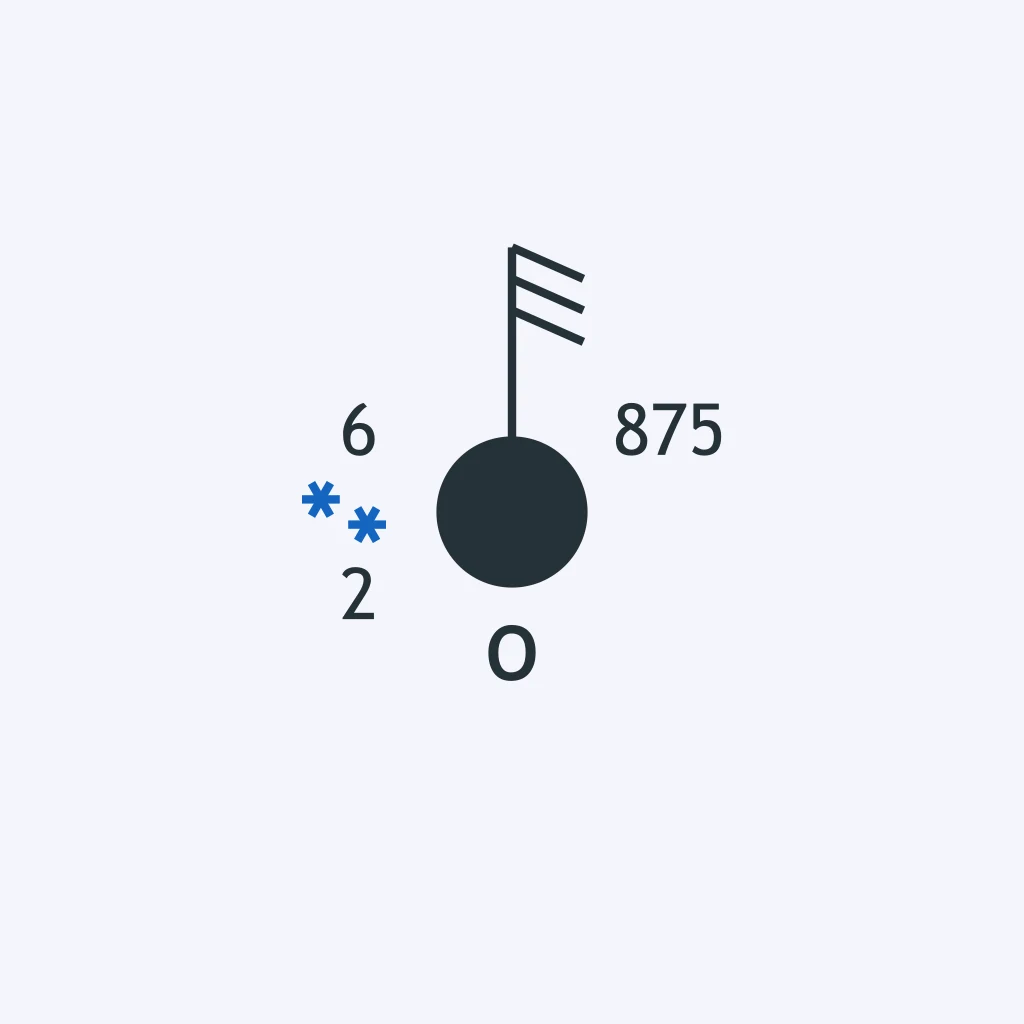
Read the coded pressure at Station P. What is the actual sea-level pressure?
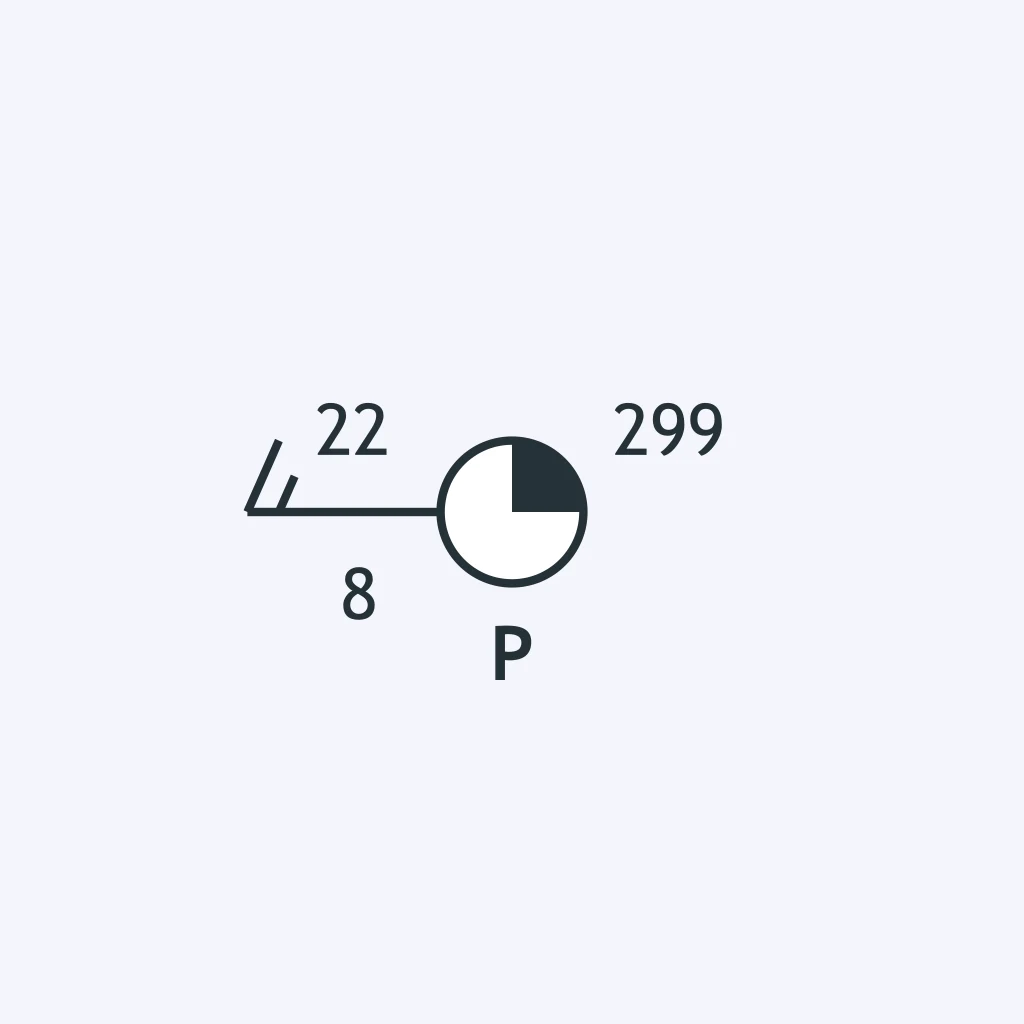
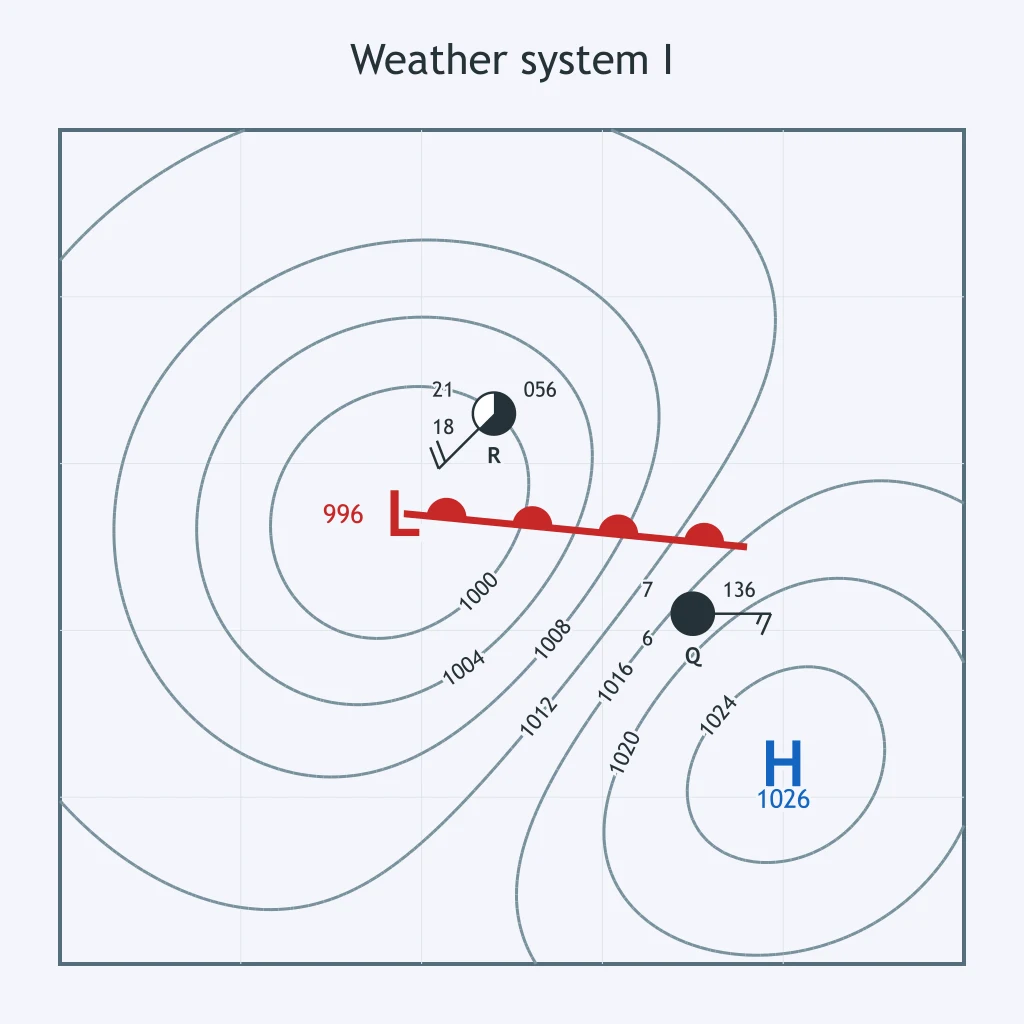
Station Q's upper-right pressure code represents what actual sea-level pressure?
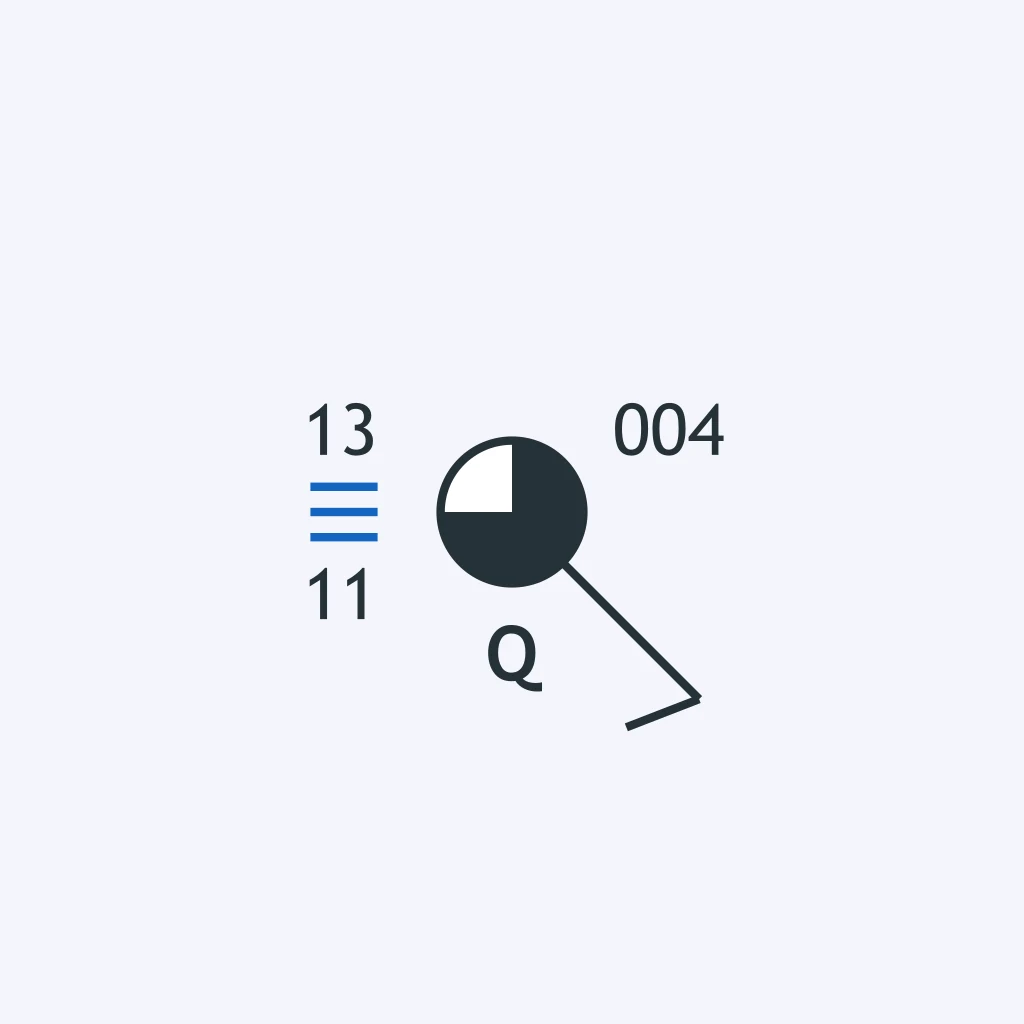
Use Station R's pressure code to find the actual sea-level pressure.
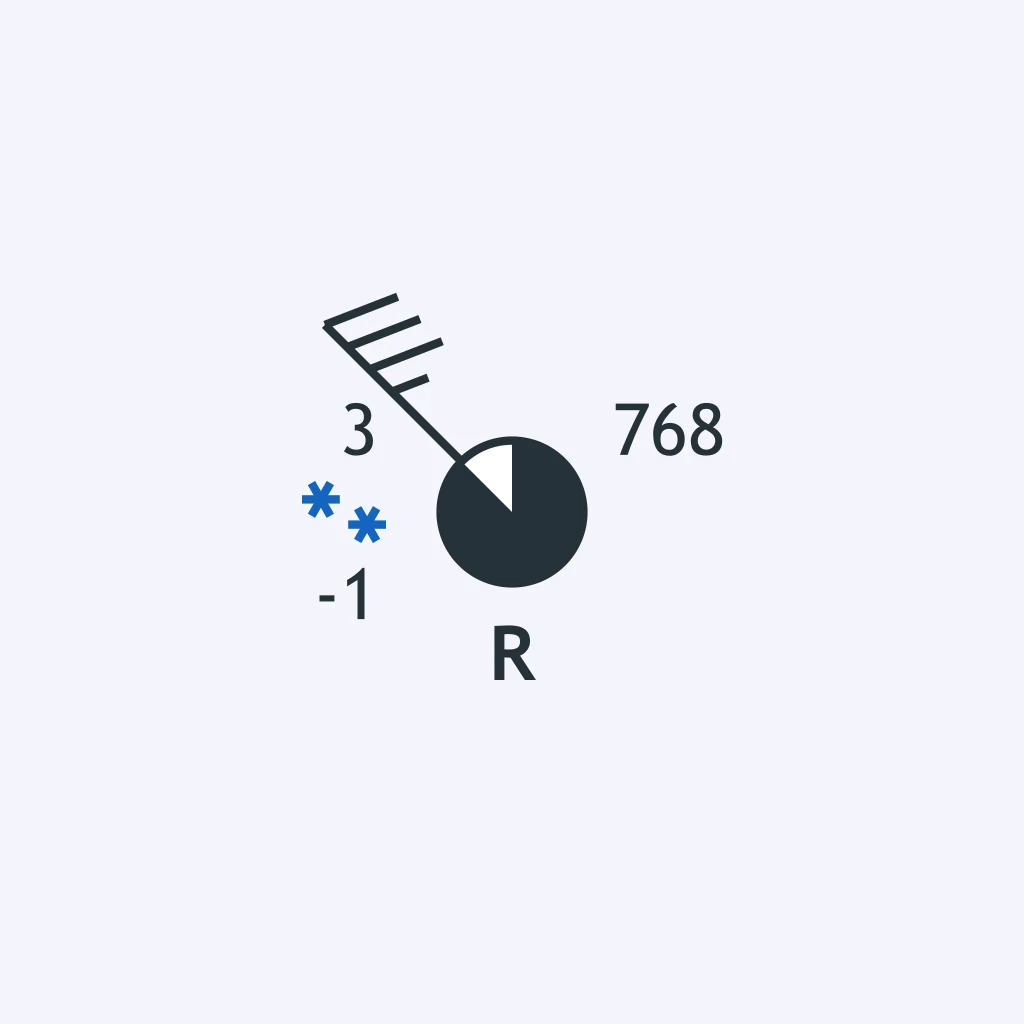
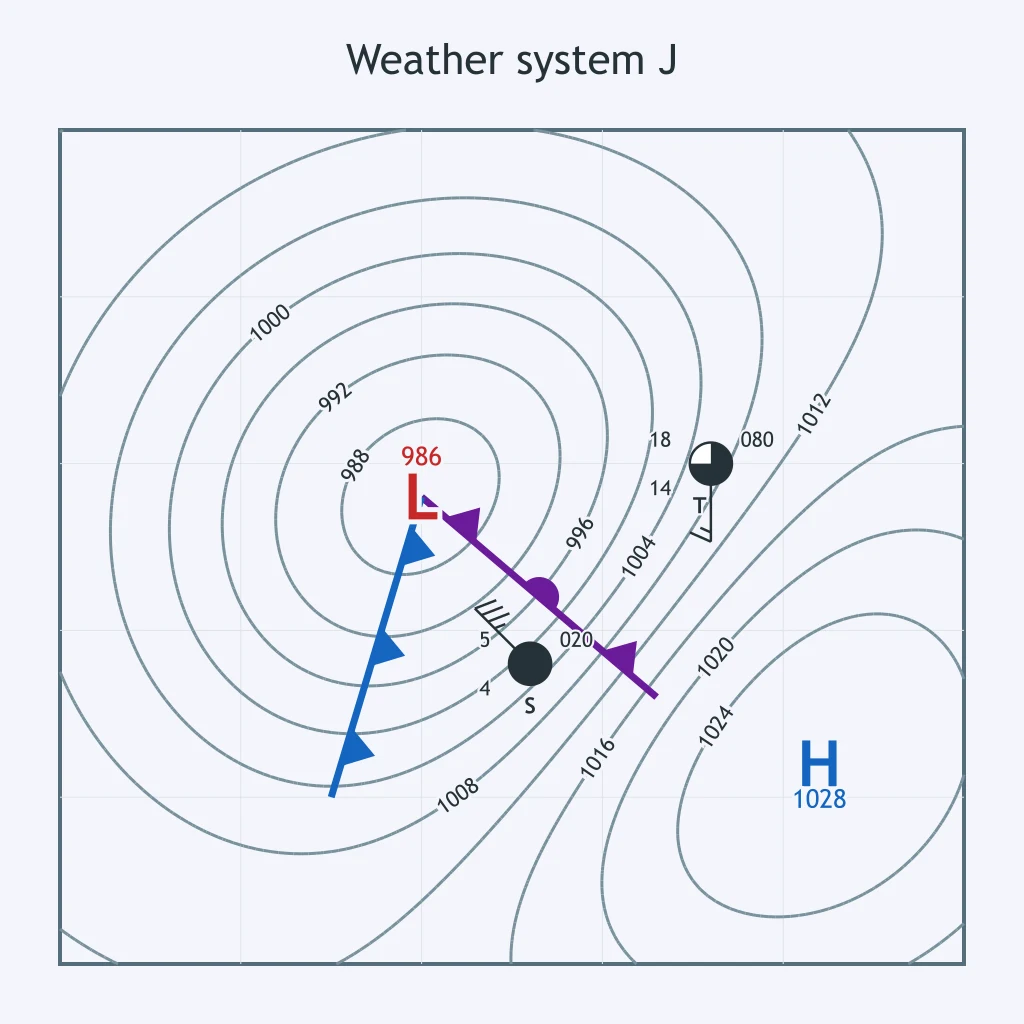
What actual sea-level pressure is encoded on Station S's model?
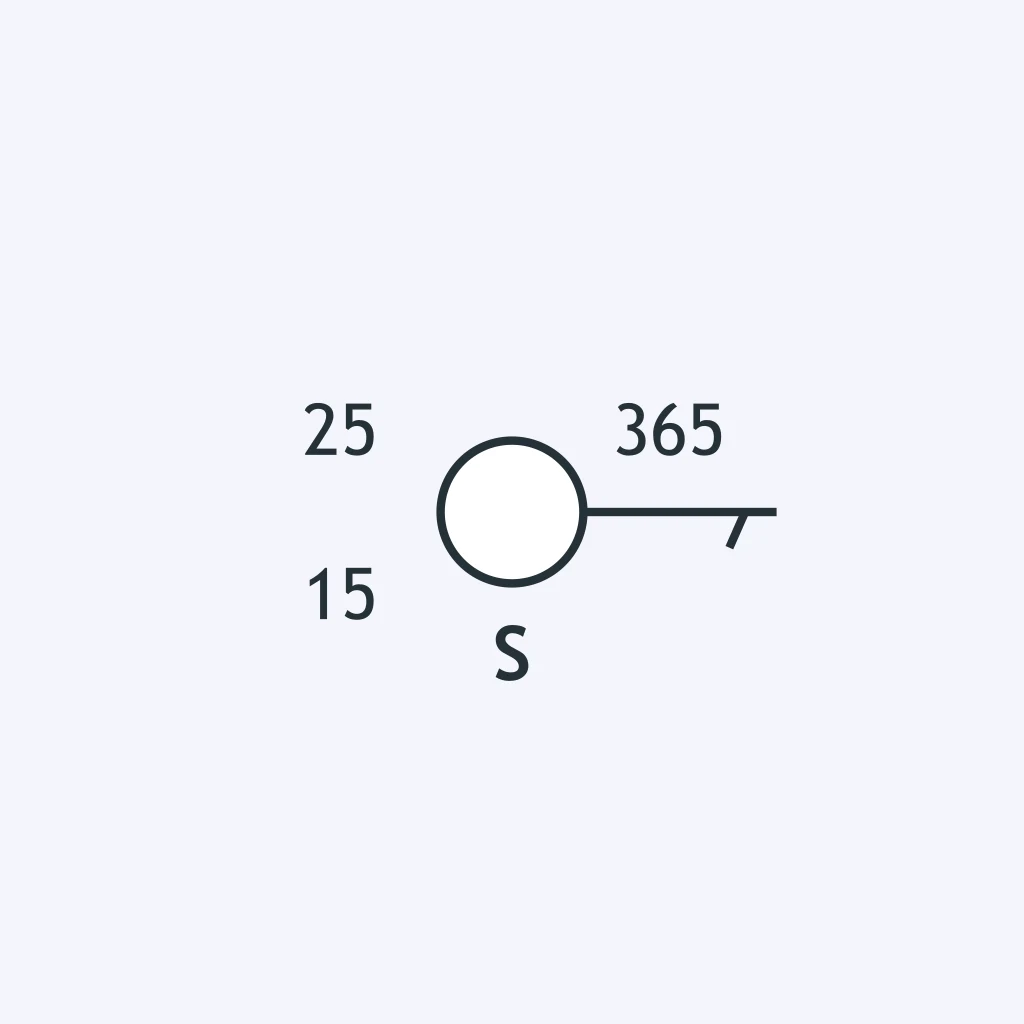
Station T has a coded sea-level pressure in the upper right. What actual pressure is reported?
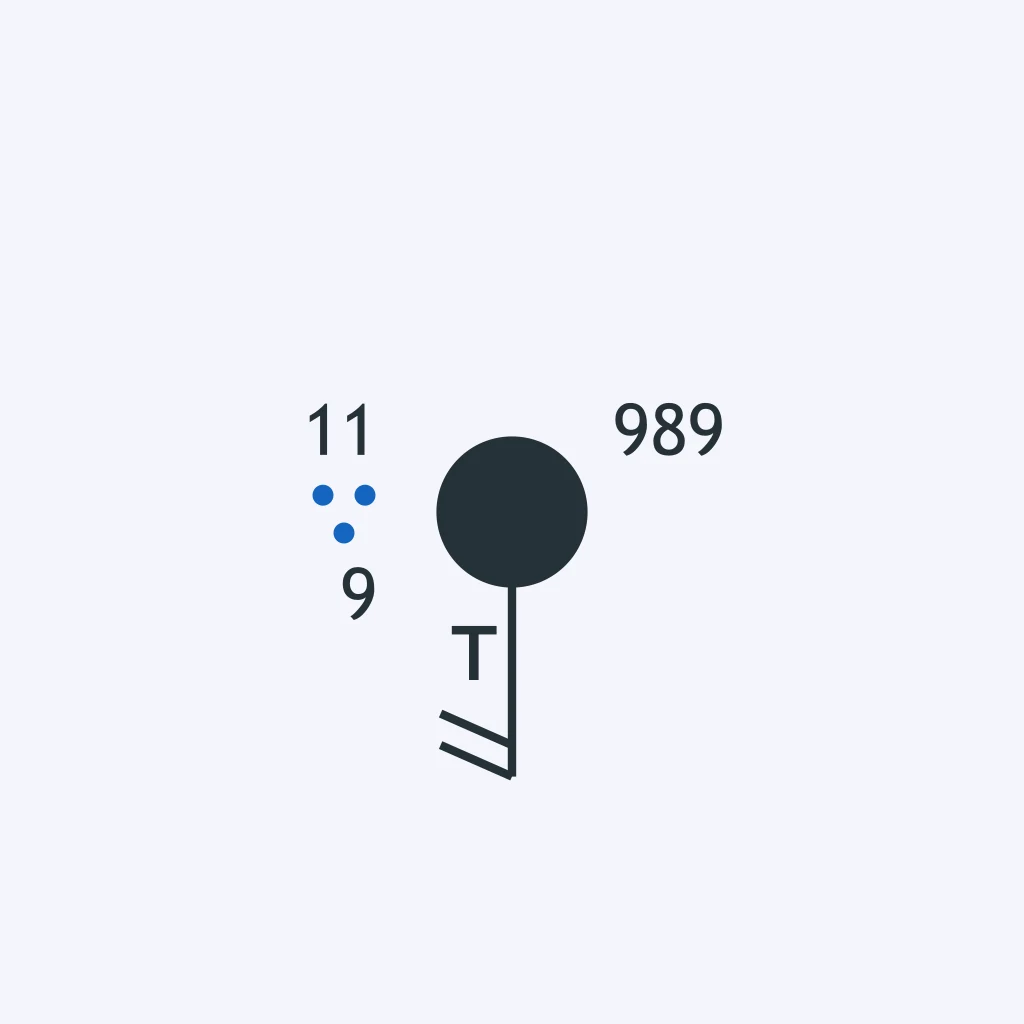
Station U's wind barb is plotted in standard format. What wind direction and speed are reported?
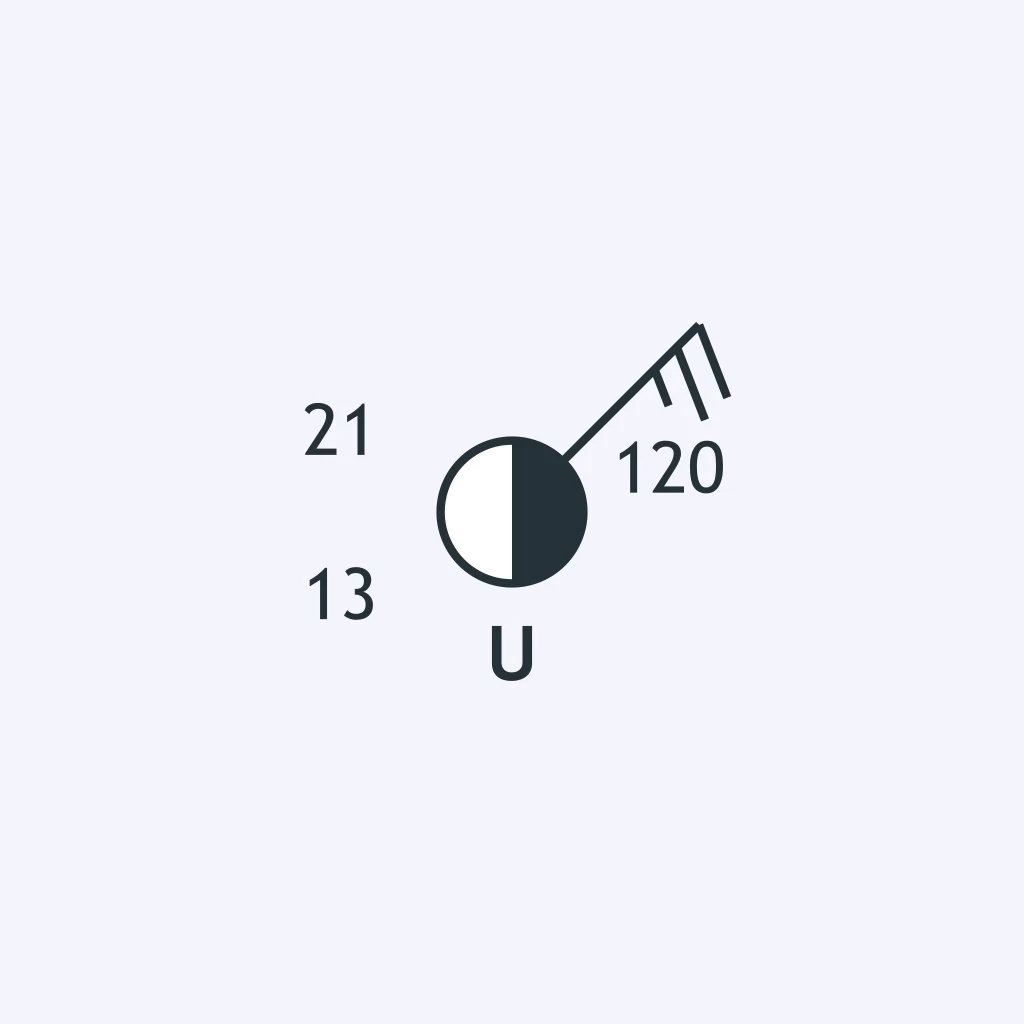
Read Station V's wind barb. What wind is being reported?
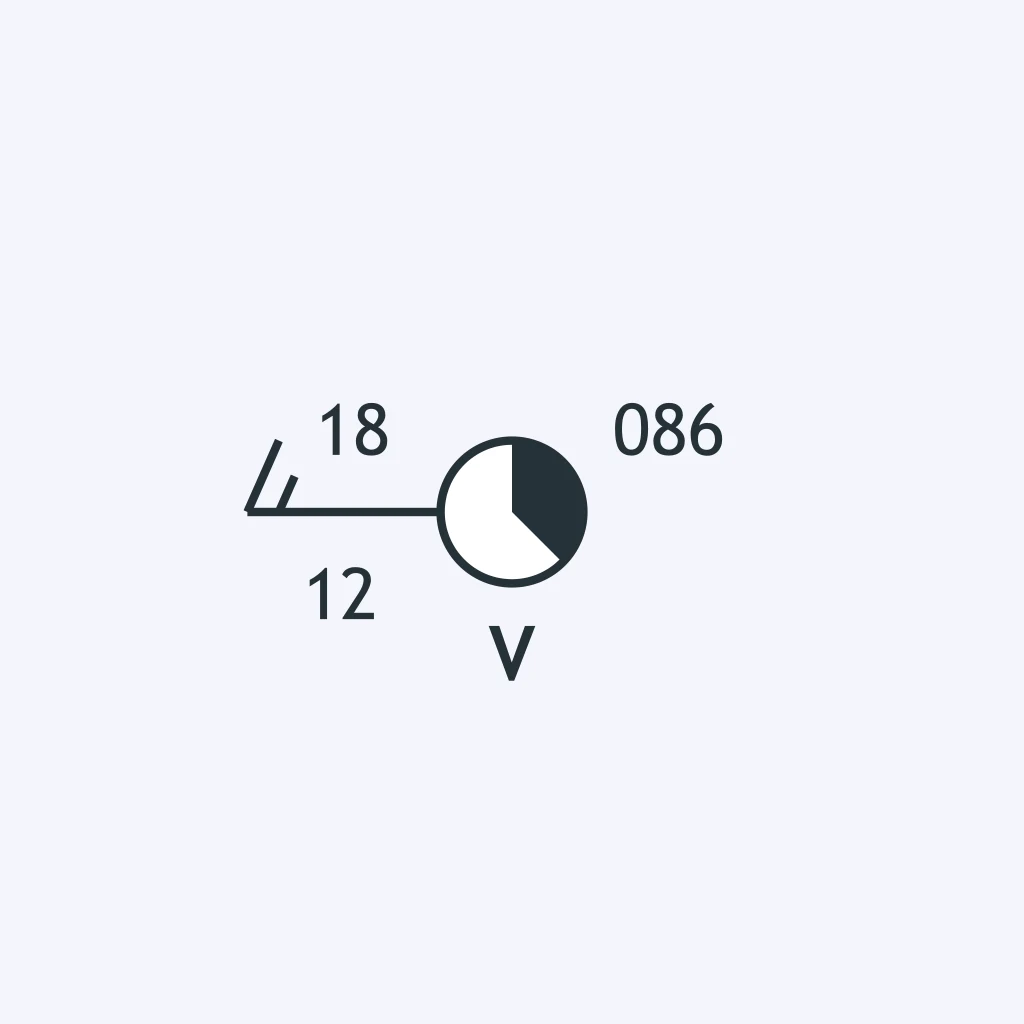
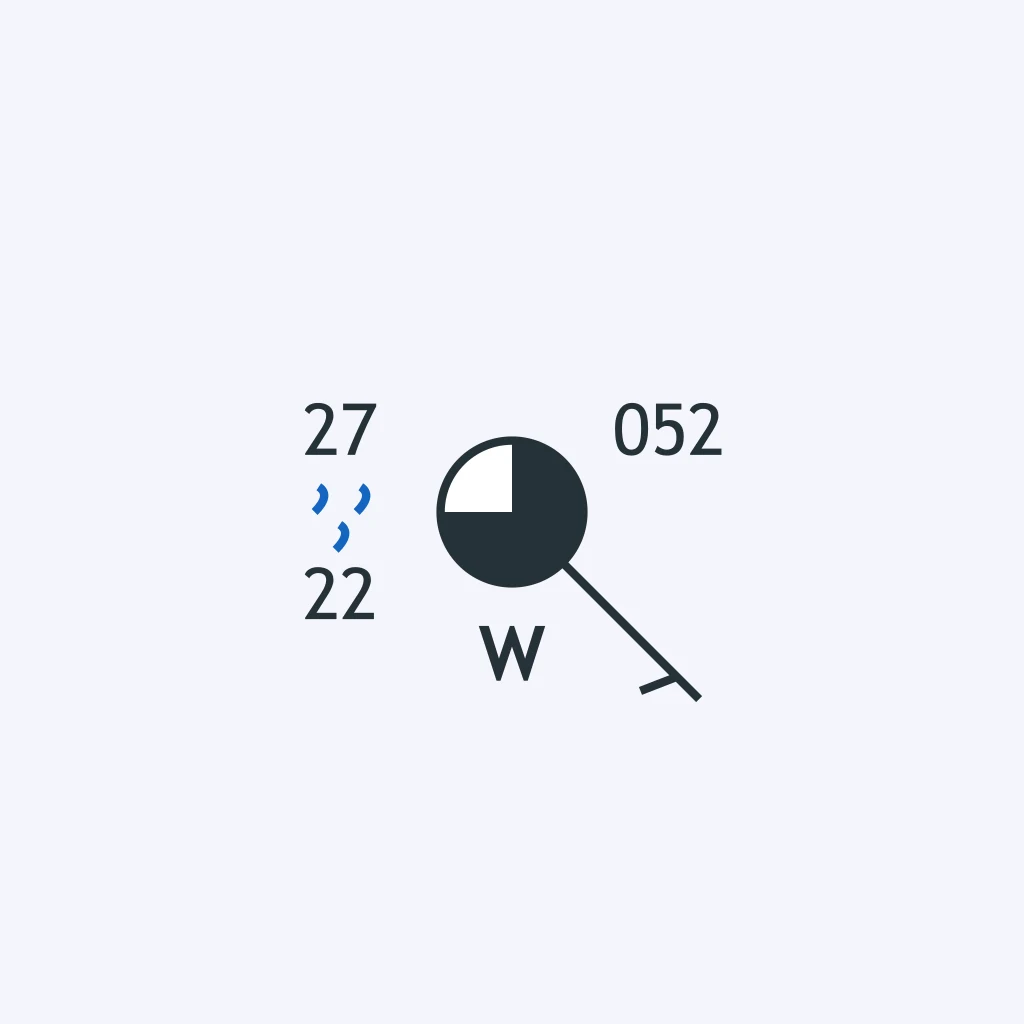
What wind direction and speed are plotted at Station W?
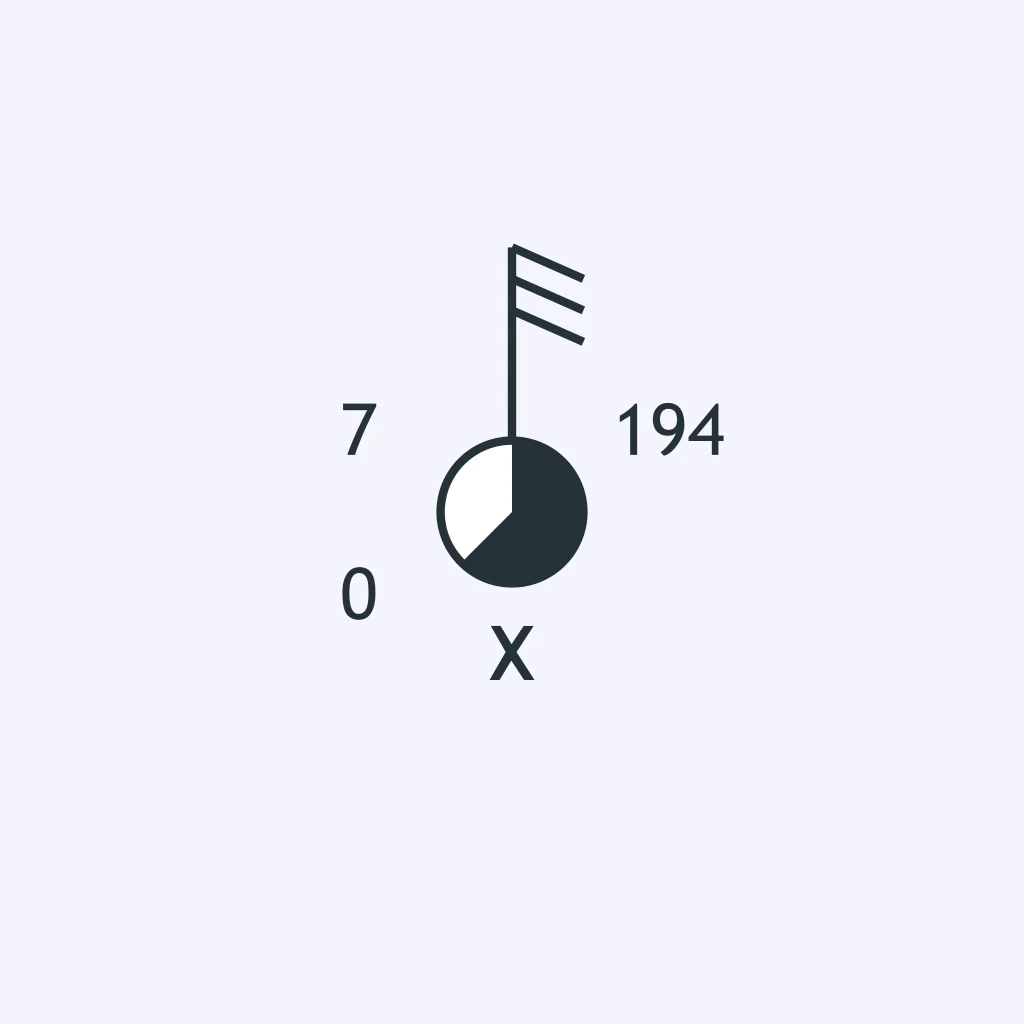
Station X's wind barb gives both direction and speed. What does it report?
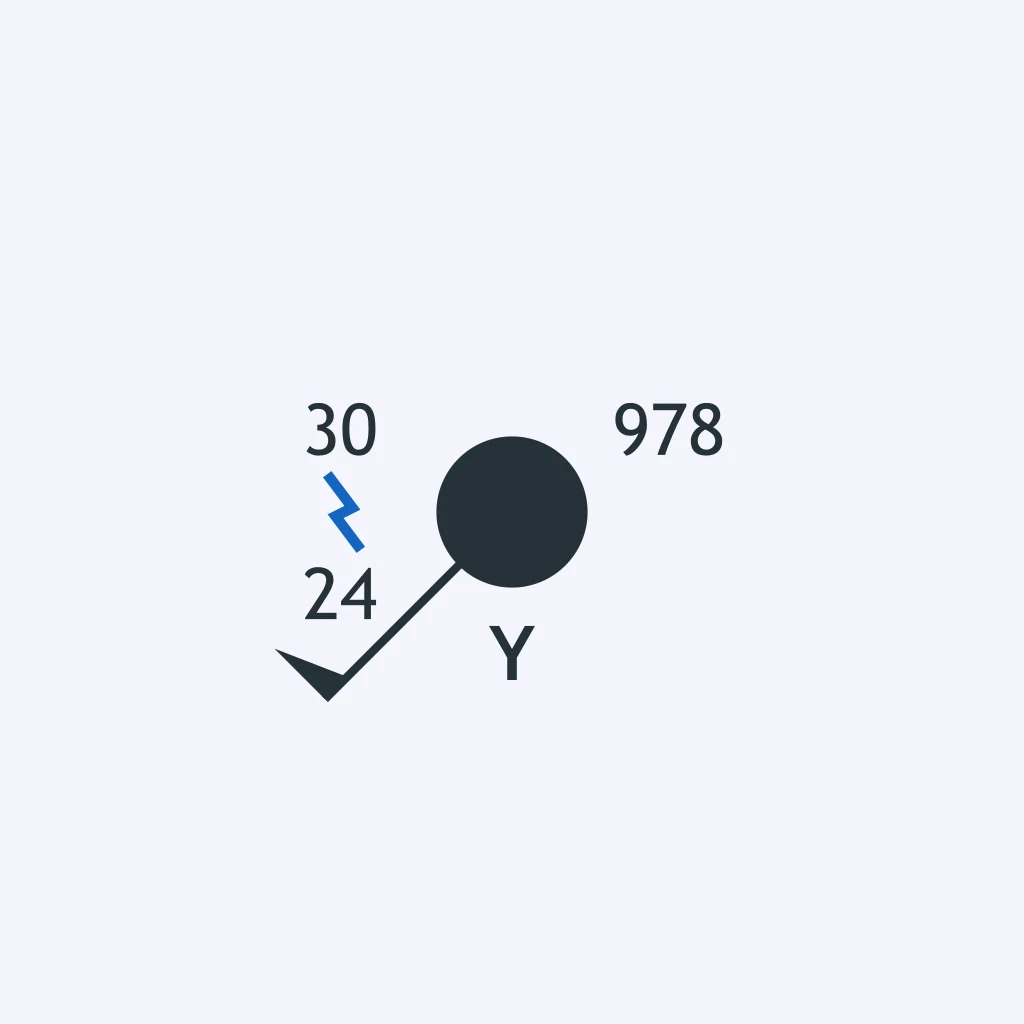
Use the wind barb at Station Y. What wind is shown?
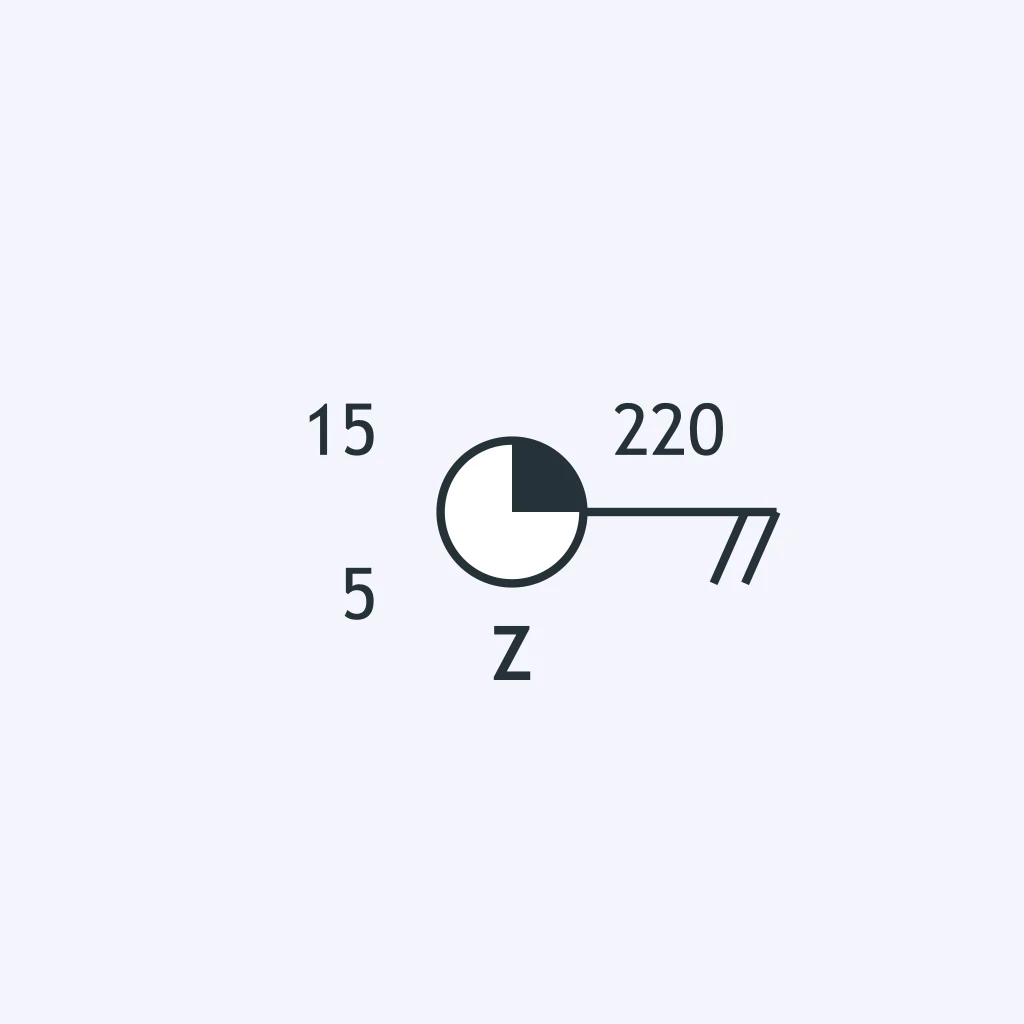
At Station Z, what wind direction and speed are encoded by the wind barb?
Read the wind plotted for Station A. What direction and speed are reported?
Station B's wind barb is the only wind information needed. What wind is plotted?
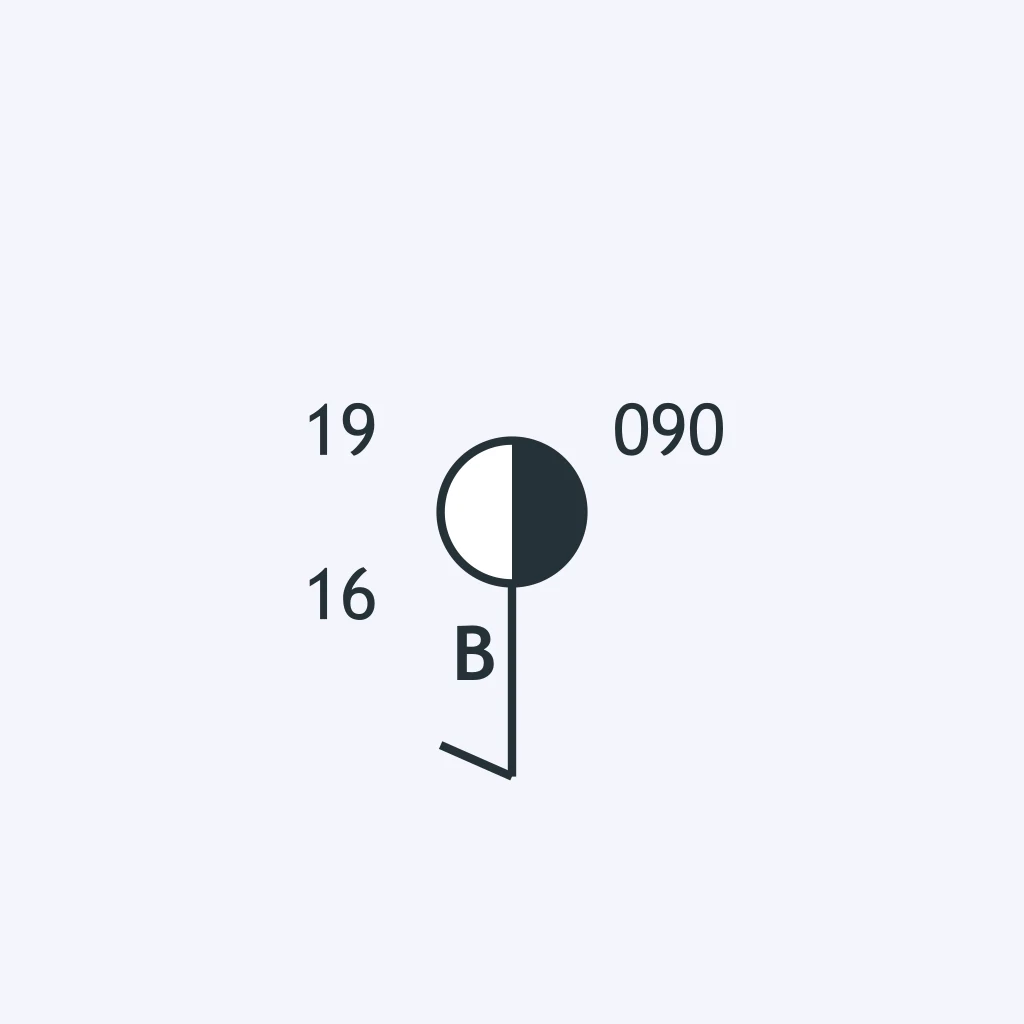
What wind does Station C's wind barb report?
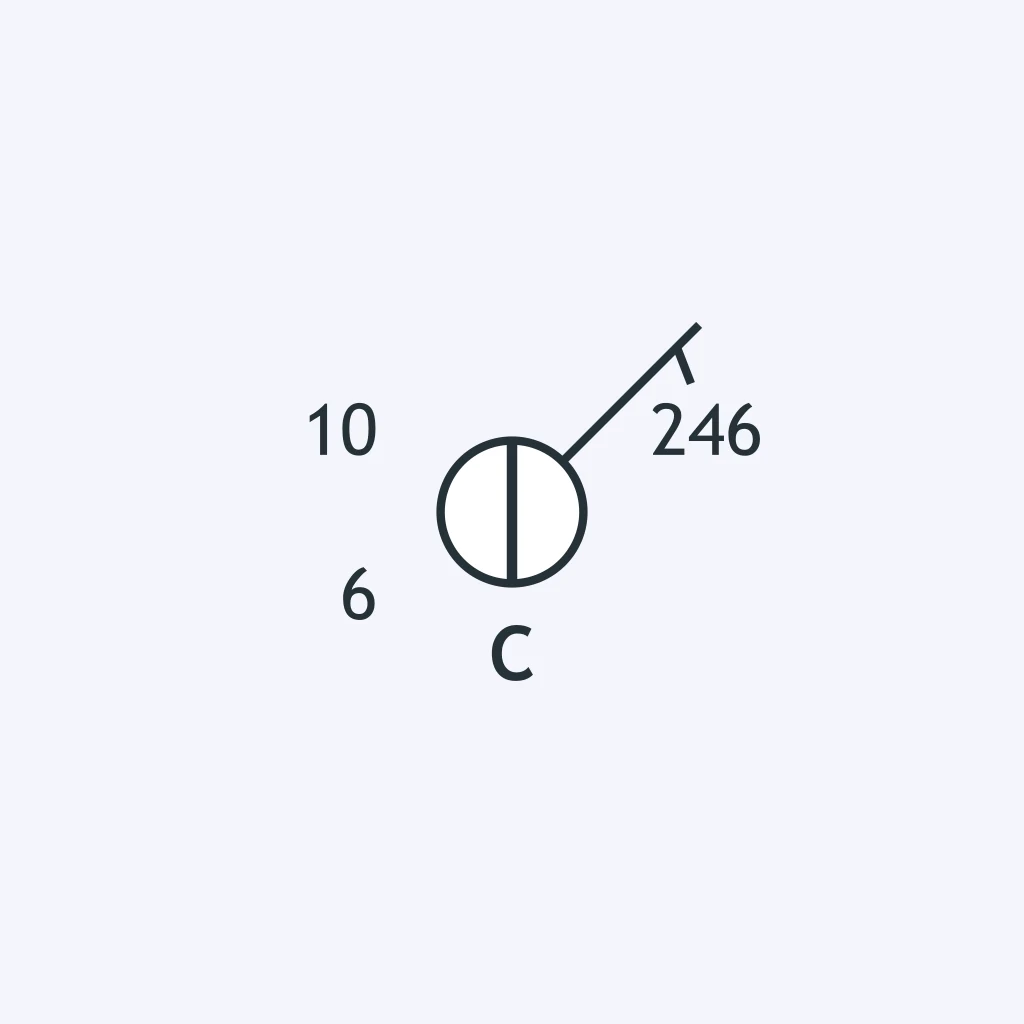
Use Station D's wind barb to decode the wind direction and speed.
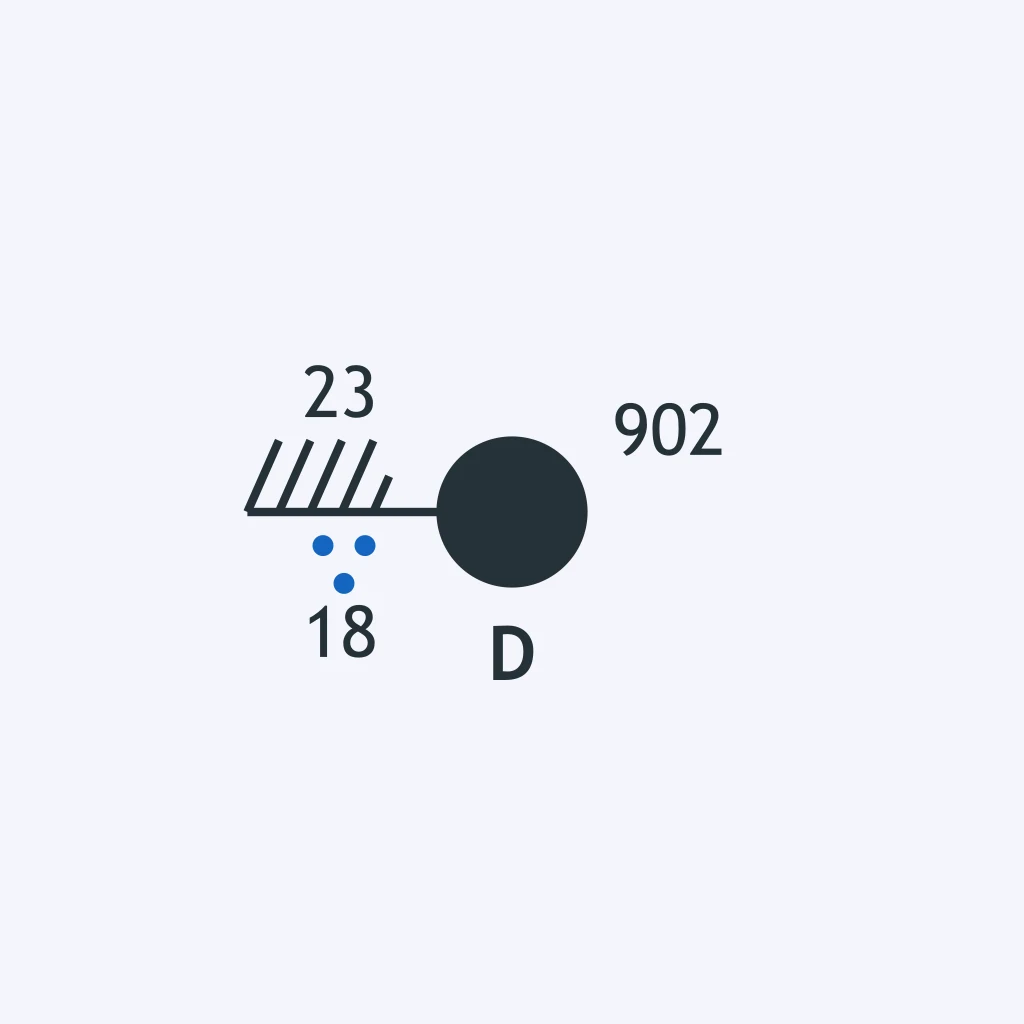
Station E shows sky cover, present weather, and pressure tendency. Which report matches the plot?
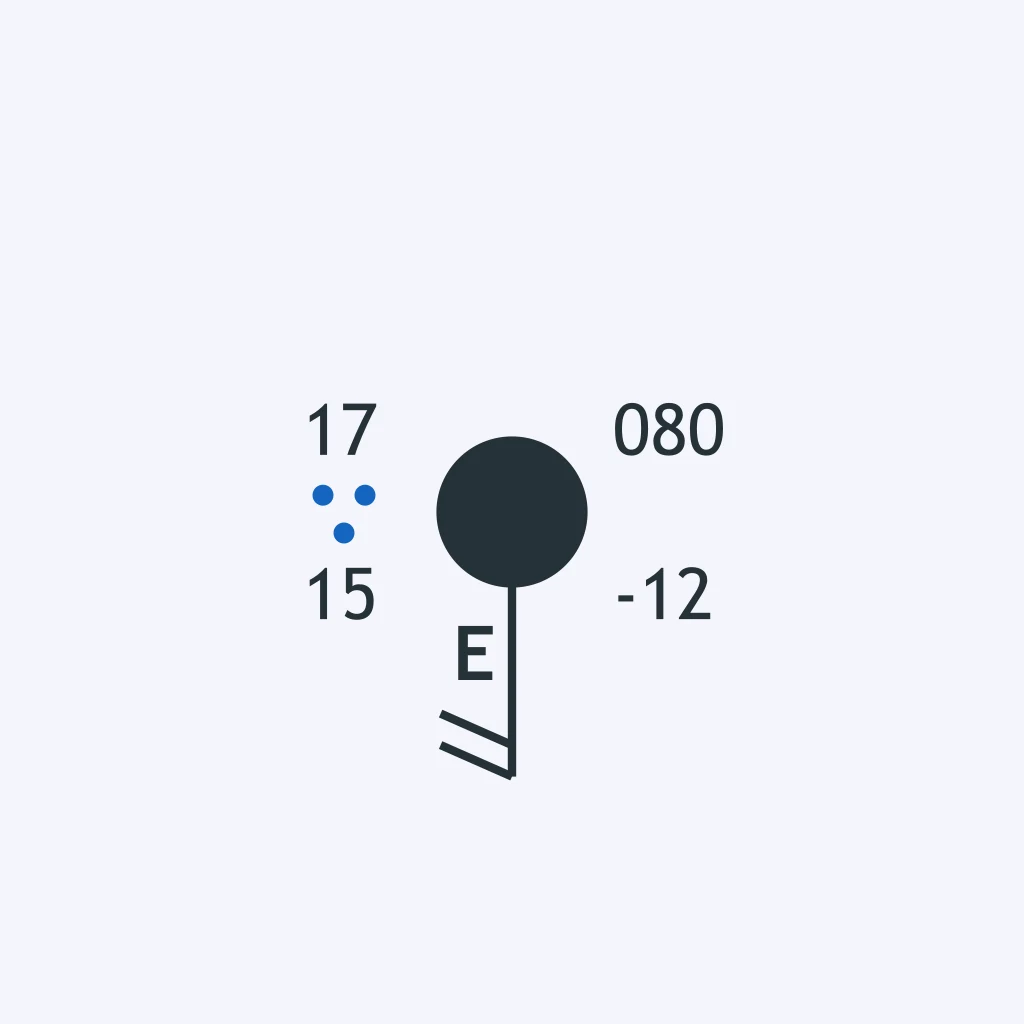
Read Station F's center circle and pressure-change entry. Which sky and pressure tendency are reported?
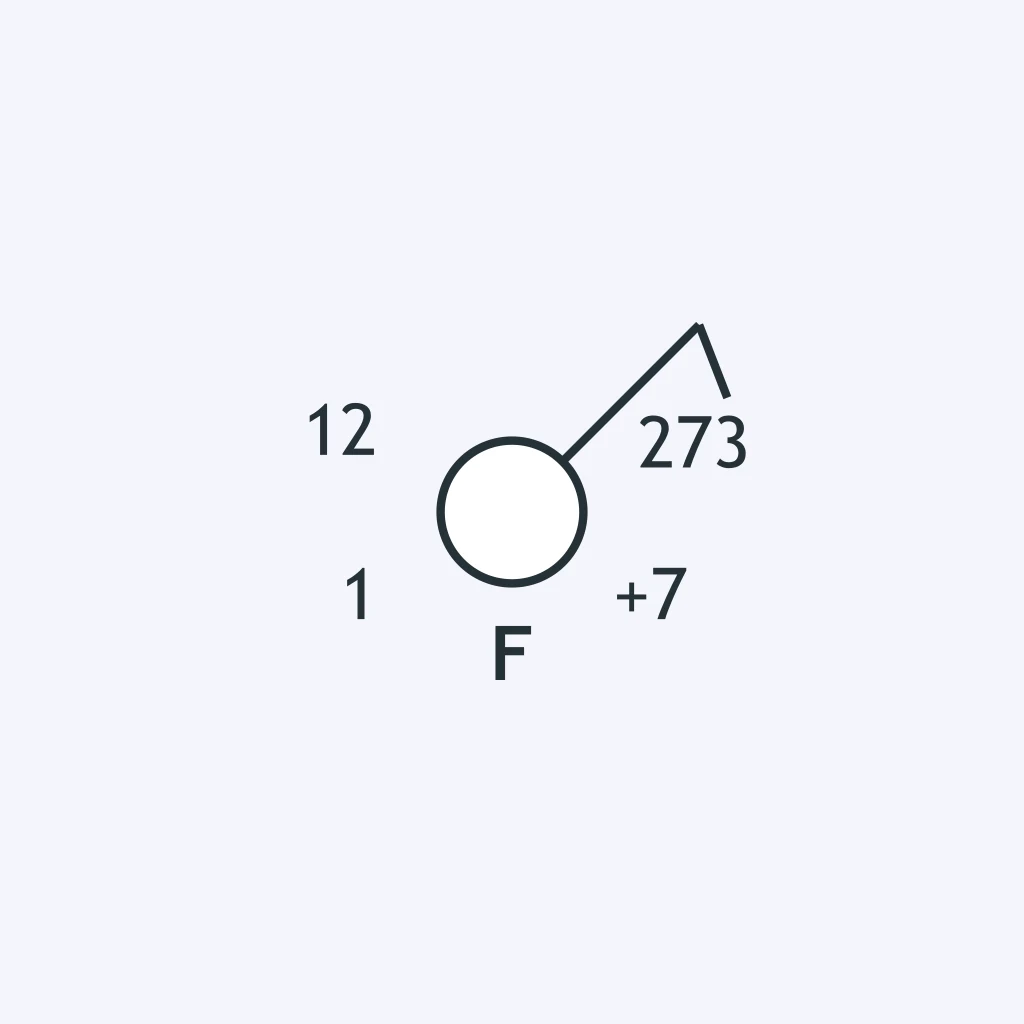
Station G includes a present-weather symbol and a pressure tendency. Which decoding is correct?
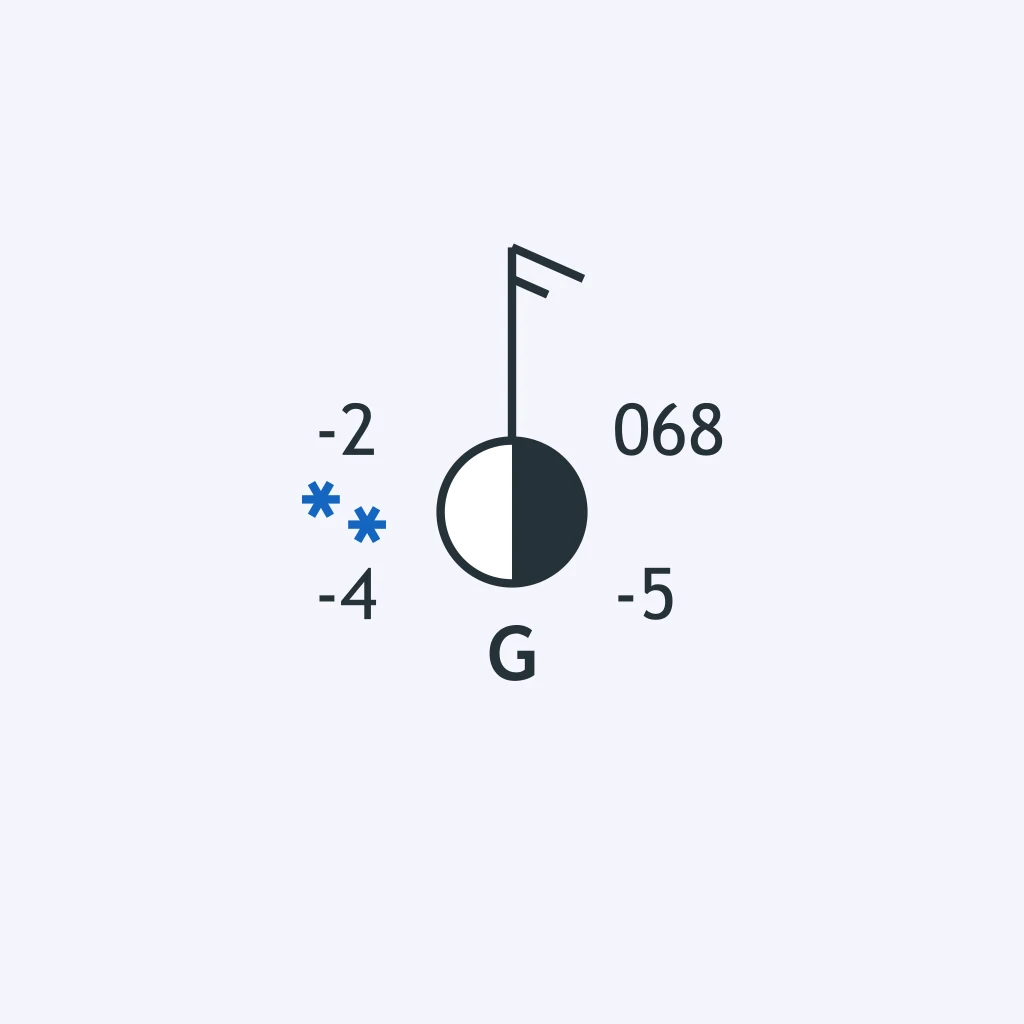
For Station H, decode the sky cover, present weather, and pressure tendency shown in the figure.
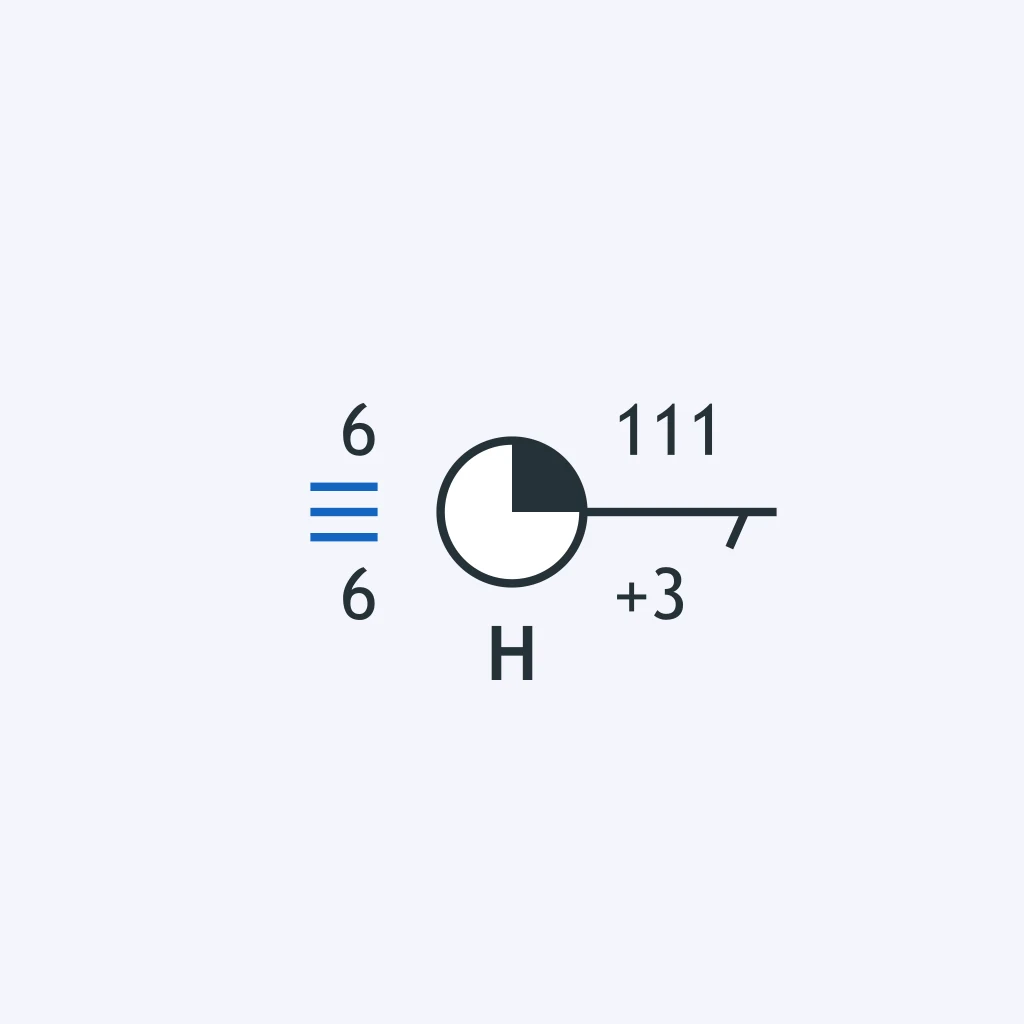
Station I's plot combines cloud cover, drizzle, and a pressure change. Which statement reads it correctly?
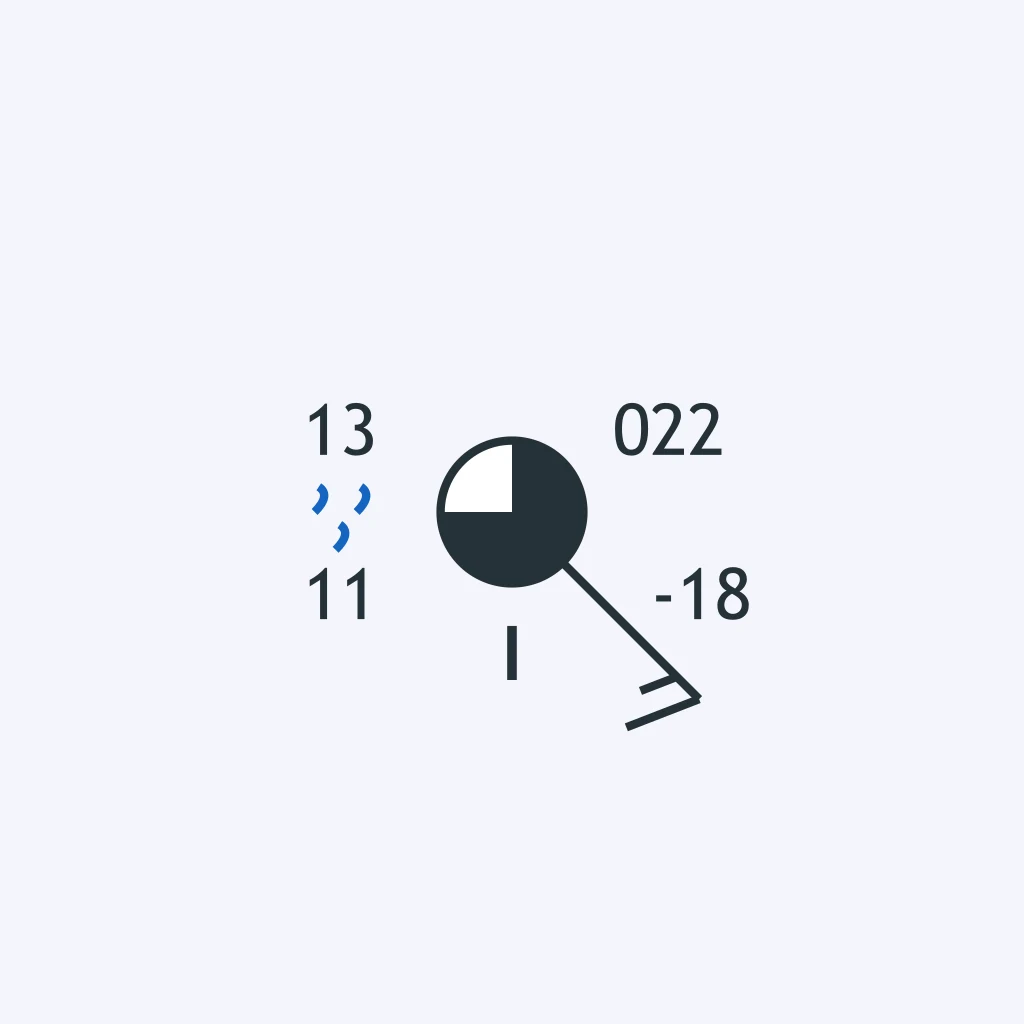
Decode Station J's sky cover, present weather, and pressure tendency.
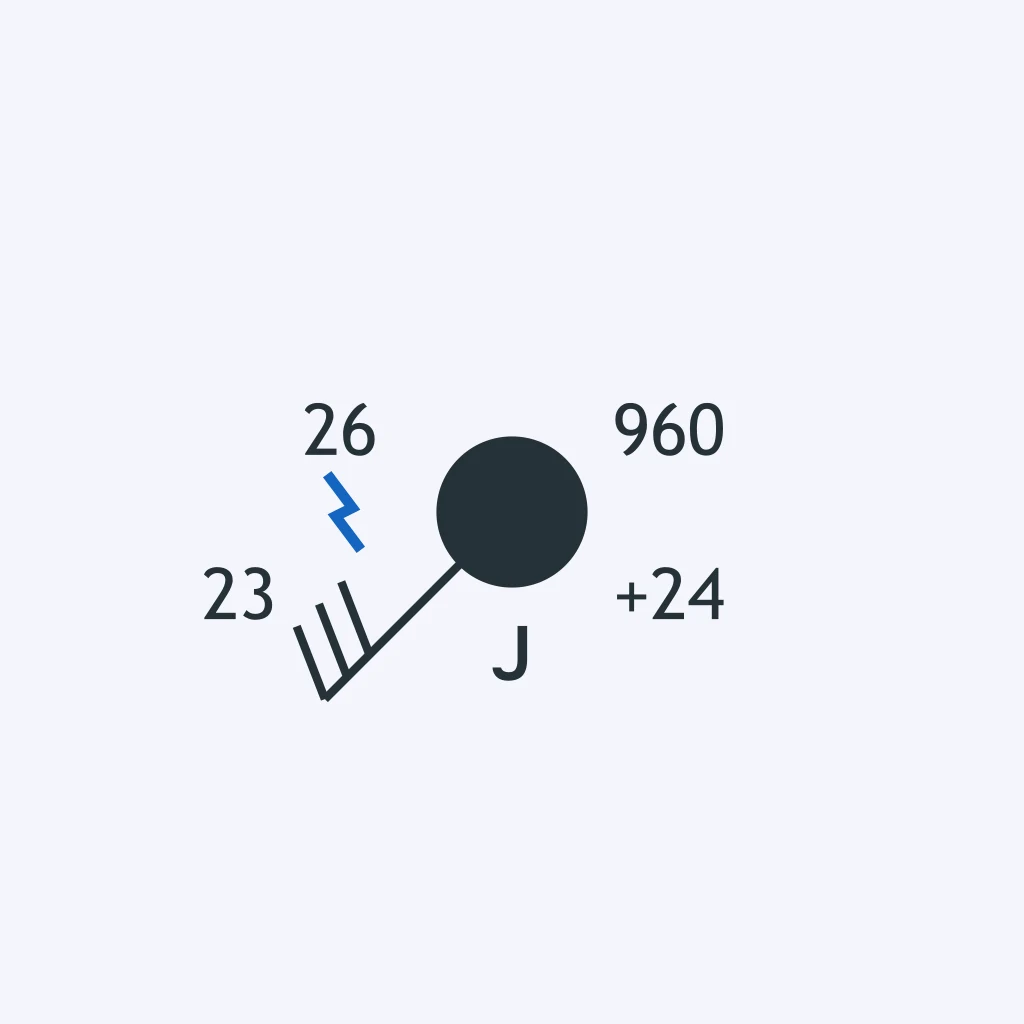
Station K has no present-weather symbol. What sky cover and pressure tendency are shown?
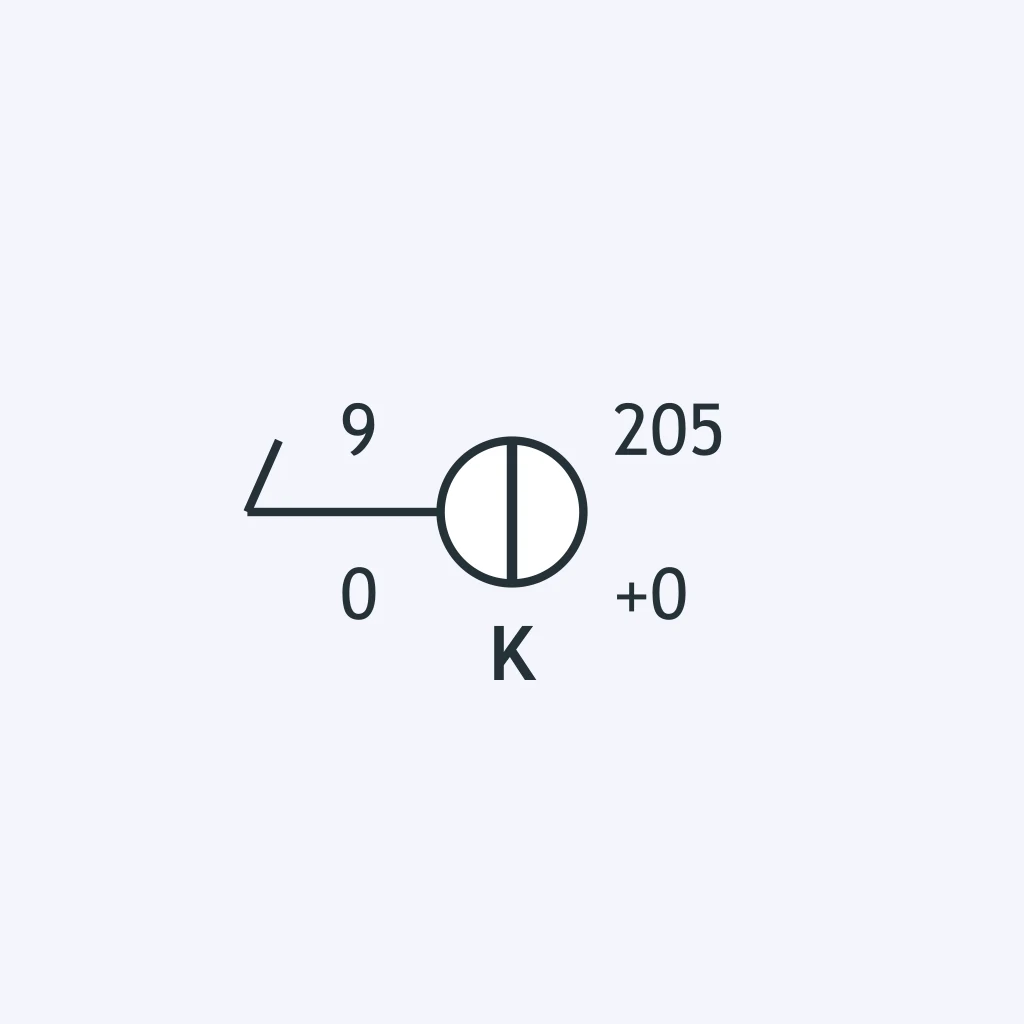
Use Station L's plotted symbols. Which sky, weather, and pressure-change report is correct?
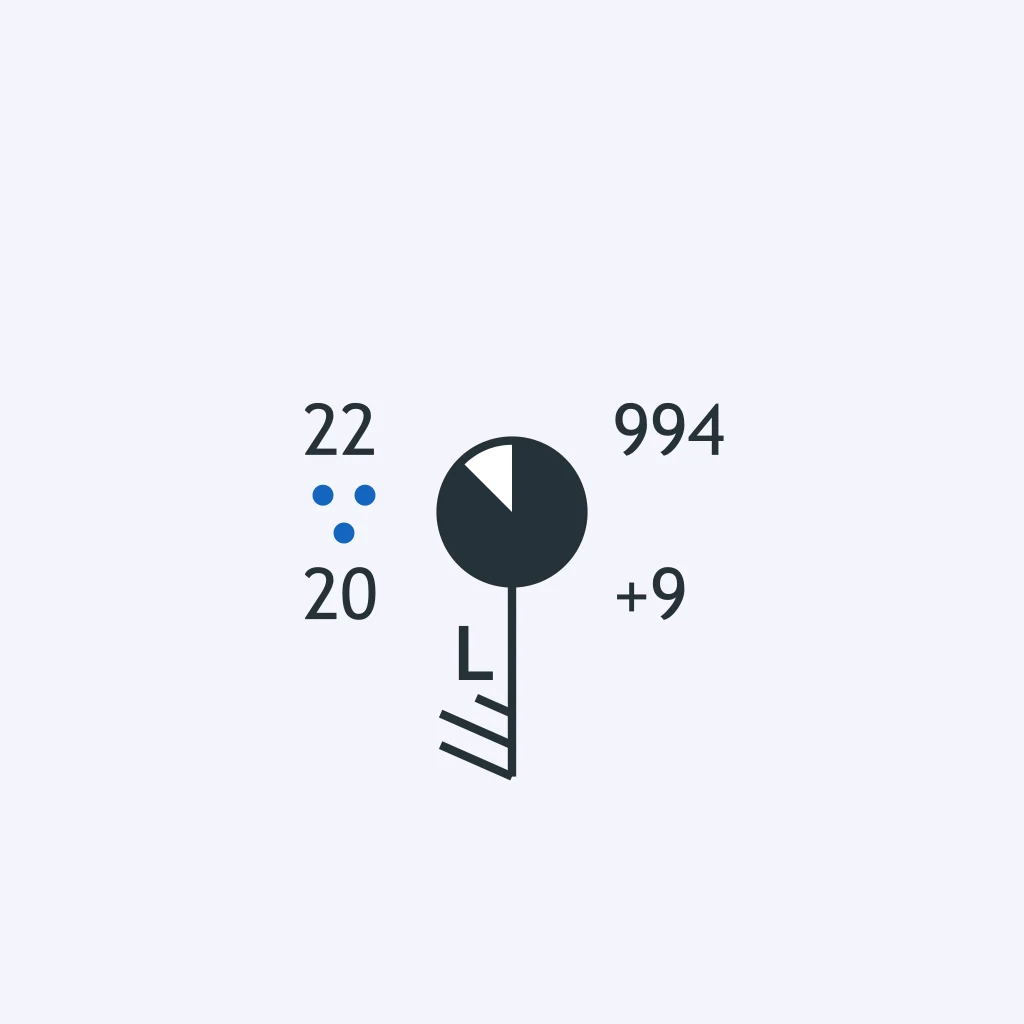
Station M's center circle, weather symbol, and pressure tendency must all be read. Which report is correct?
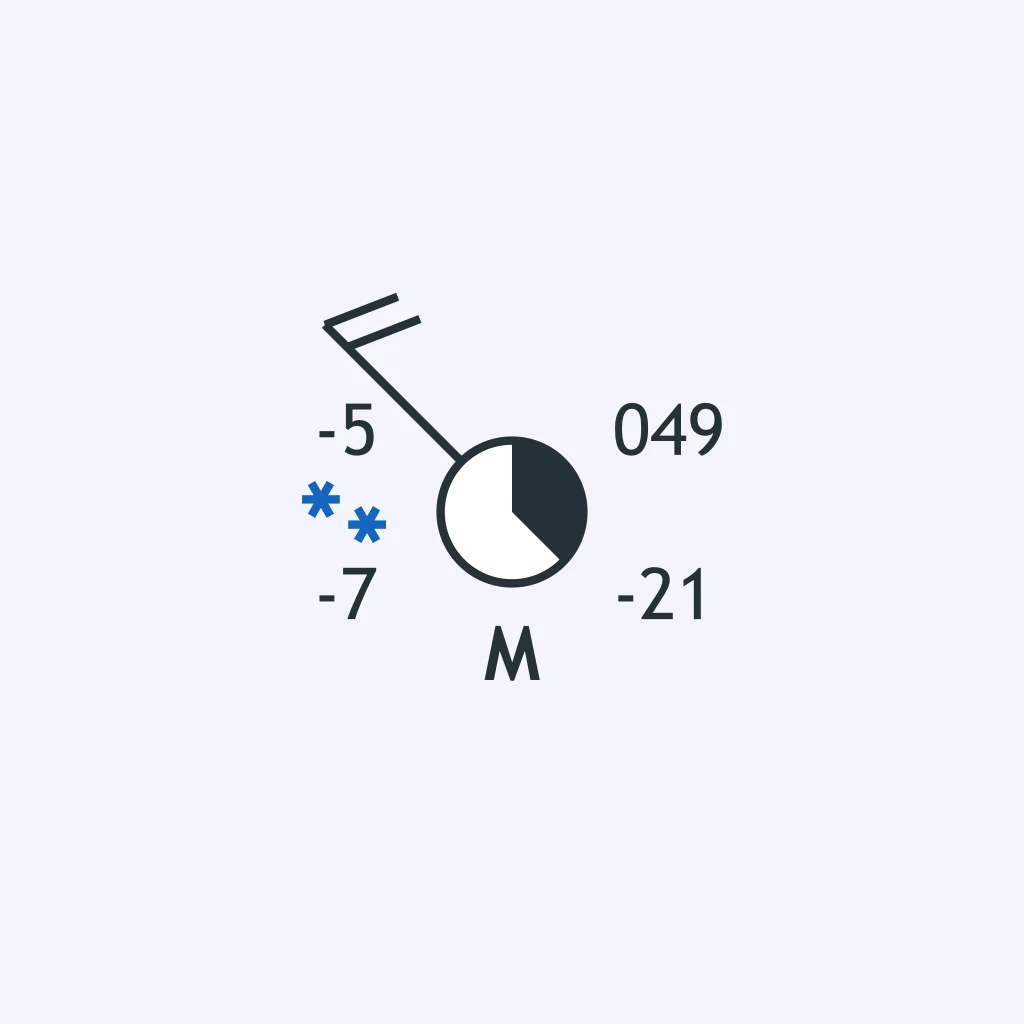
Read Station N's sky cover, present weather, and three-hour pressure tendency.
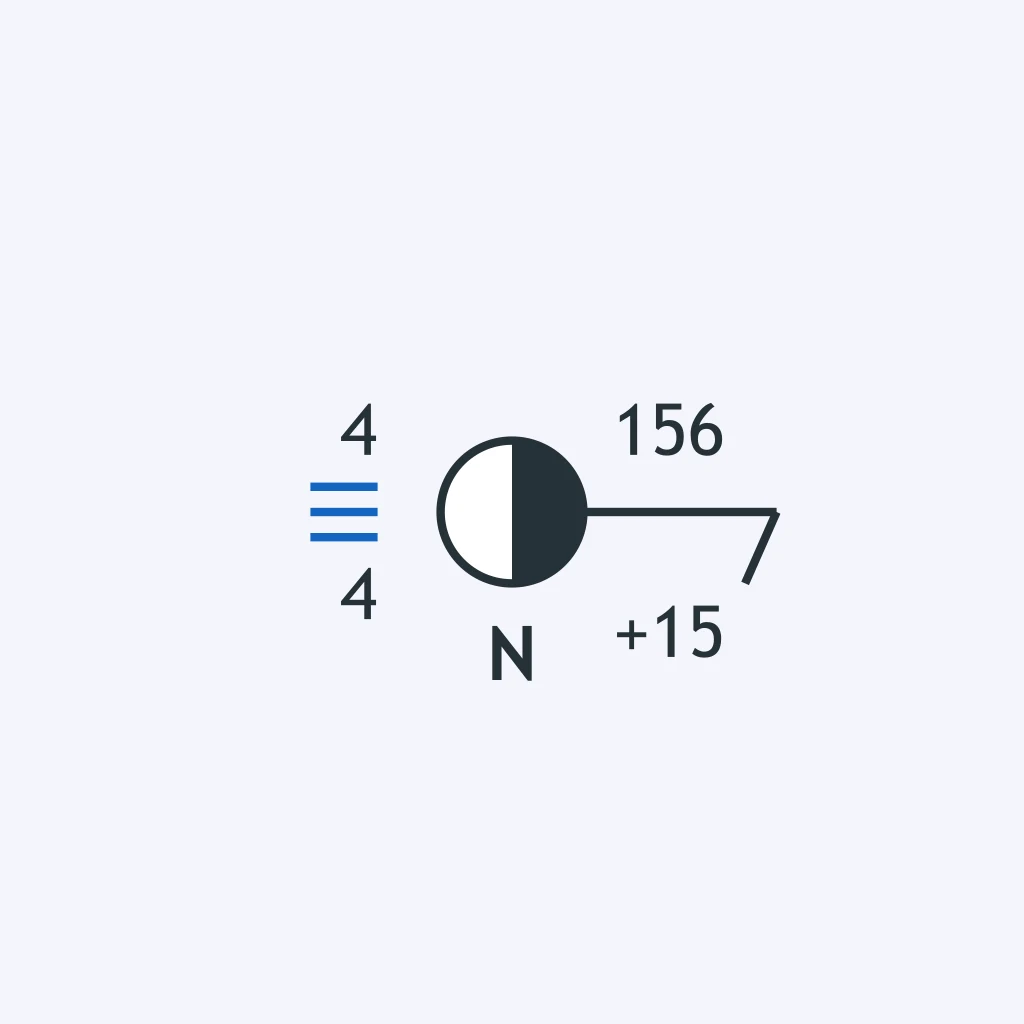
Stations A and B are plotted on the synoptic map. Which station reports the higher relative humidity?
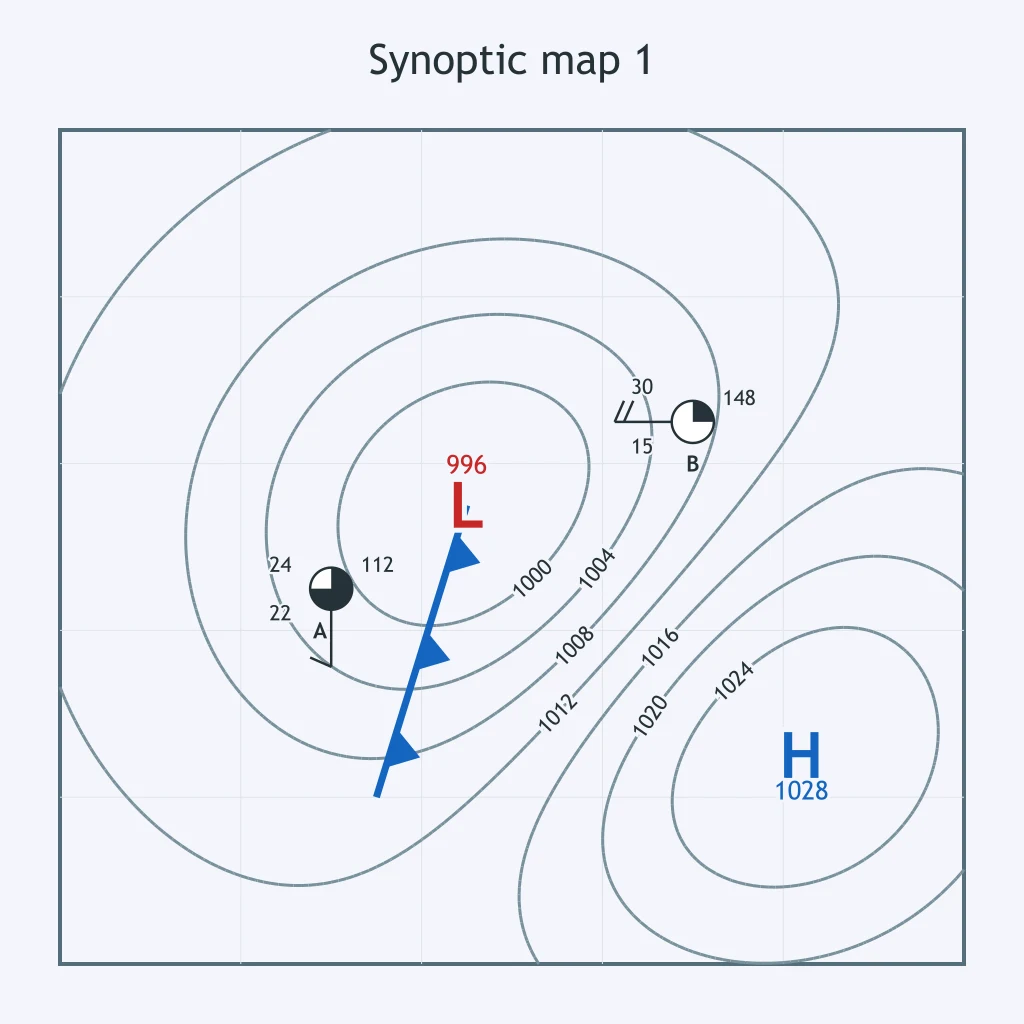
On the map, Stations C and D both have wind barbs. Which station reports the stronger wind?
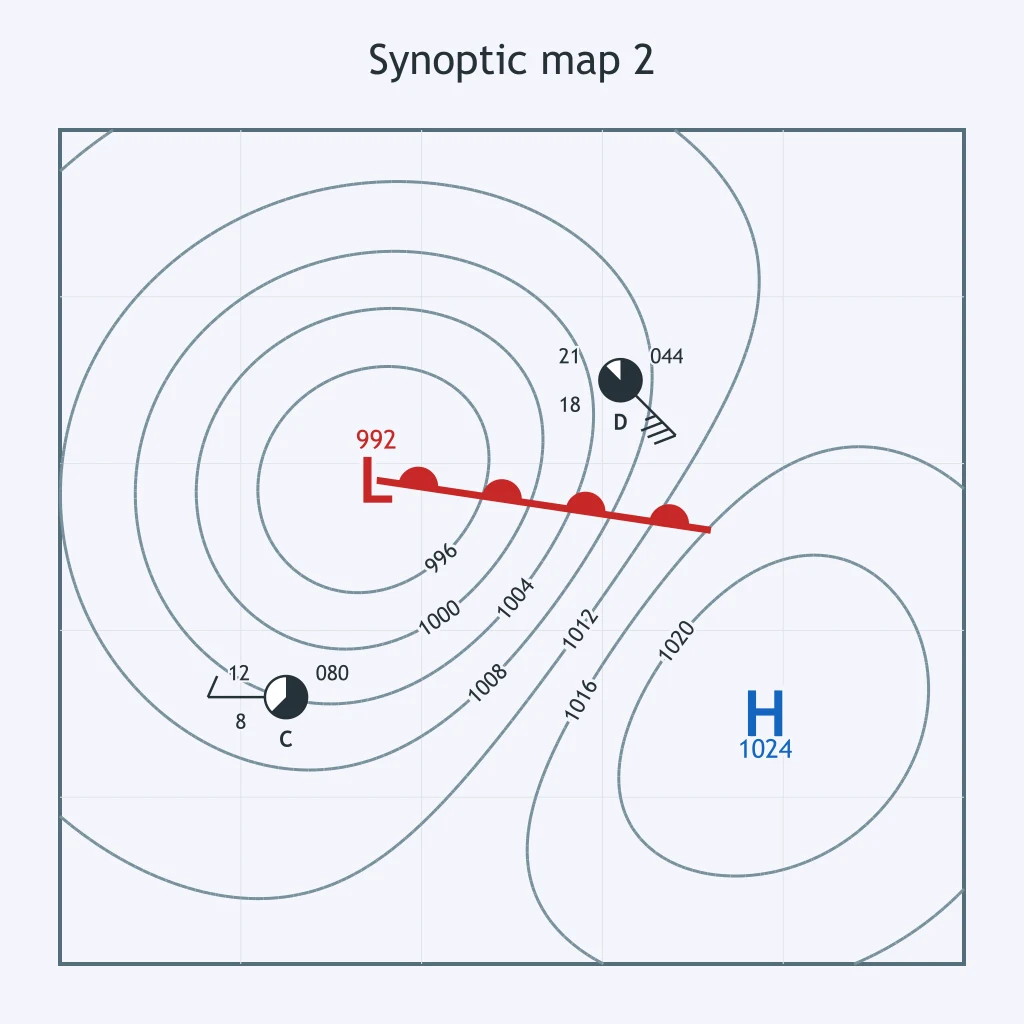
Stations E and F lie on opposite sides of the cold front. Which station is in the colder, drier air mass?
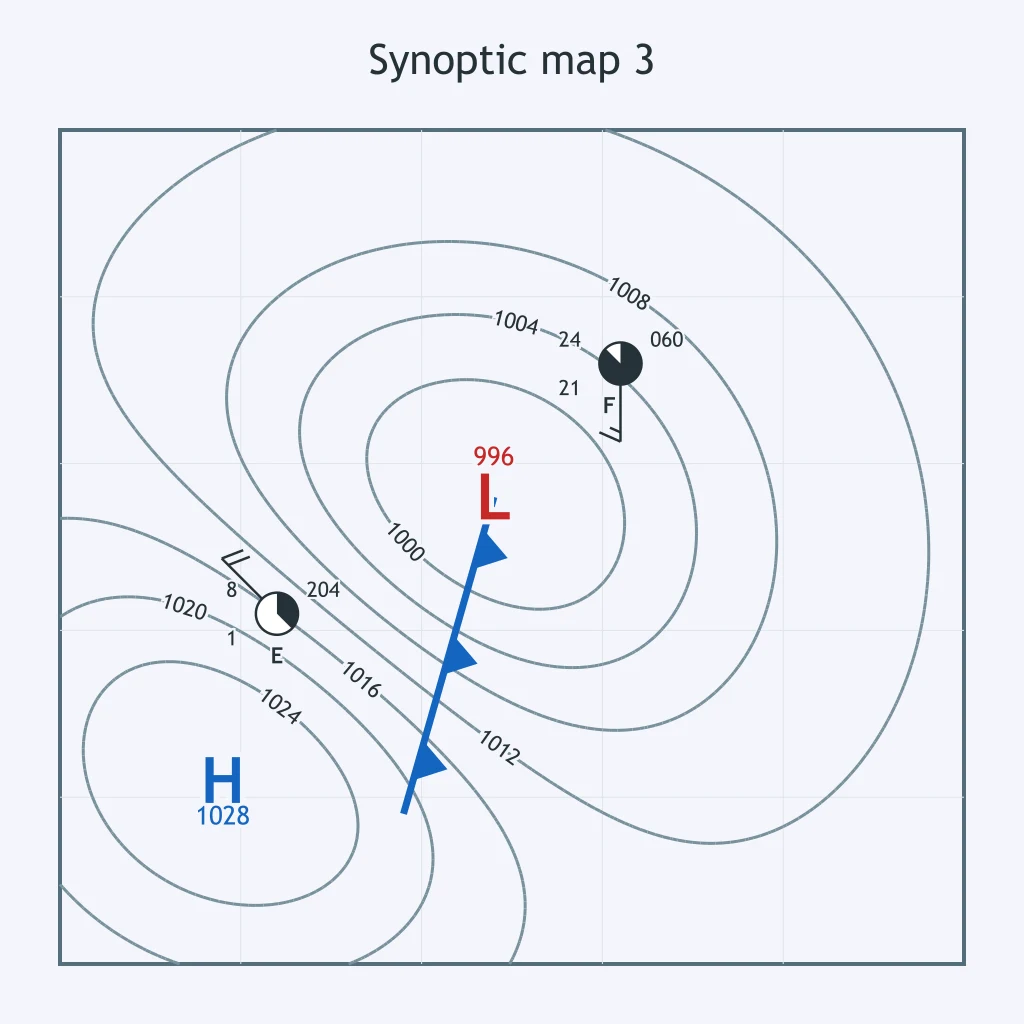
Compare the coded pressures at Stations G and H. Which station reports the higher actual sea-level pressure?
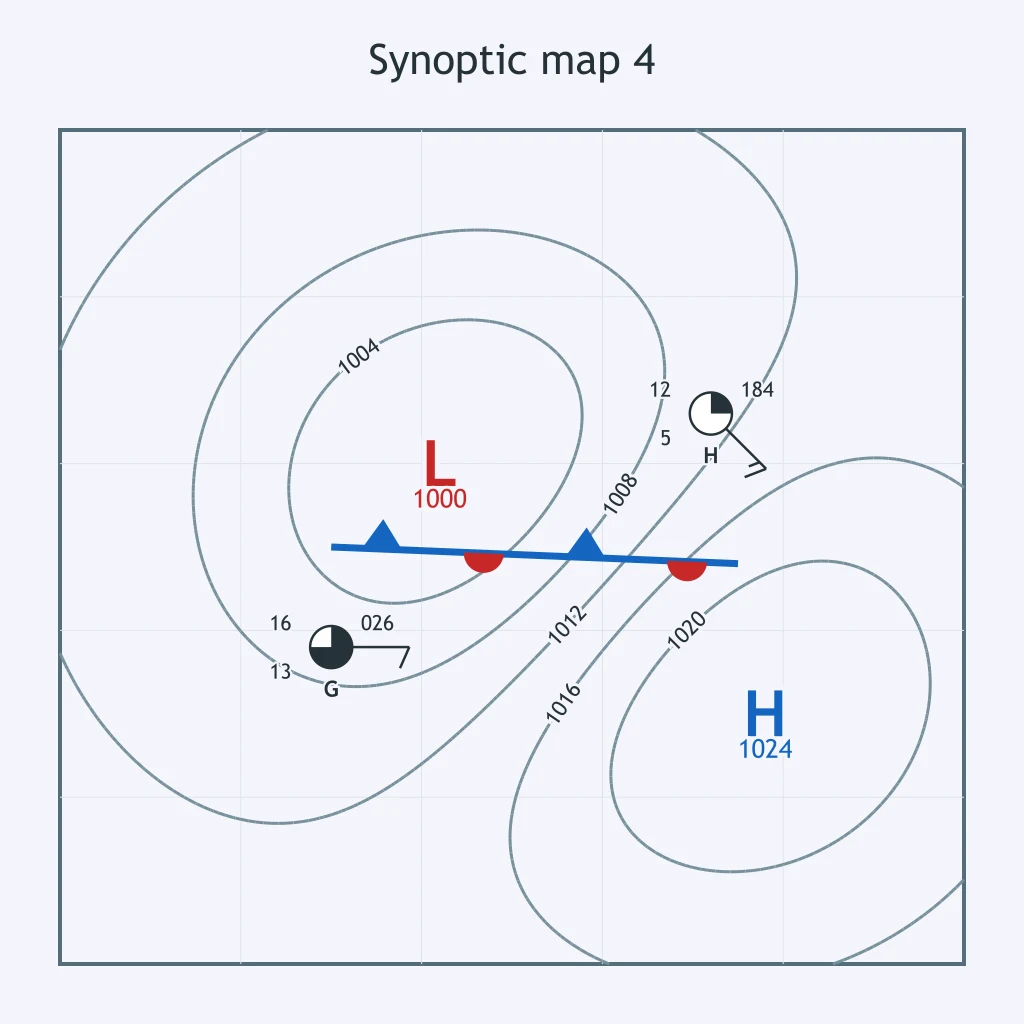
Stations I and J are plotted with a low-pressure center. Which station is closer to the low center?
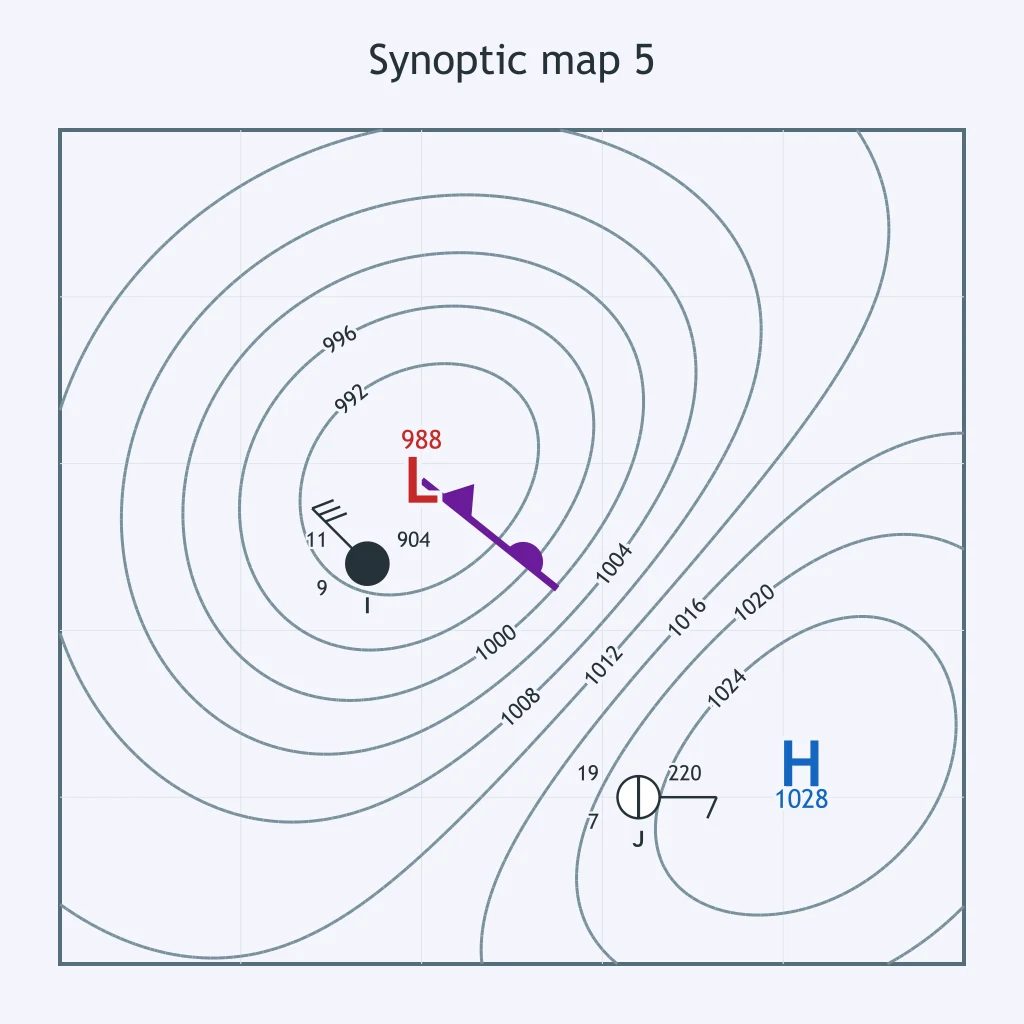
Stations K and L report different sky cover. Which station reports more cloud cover?
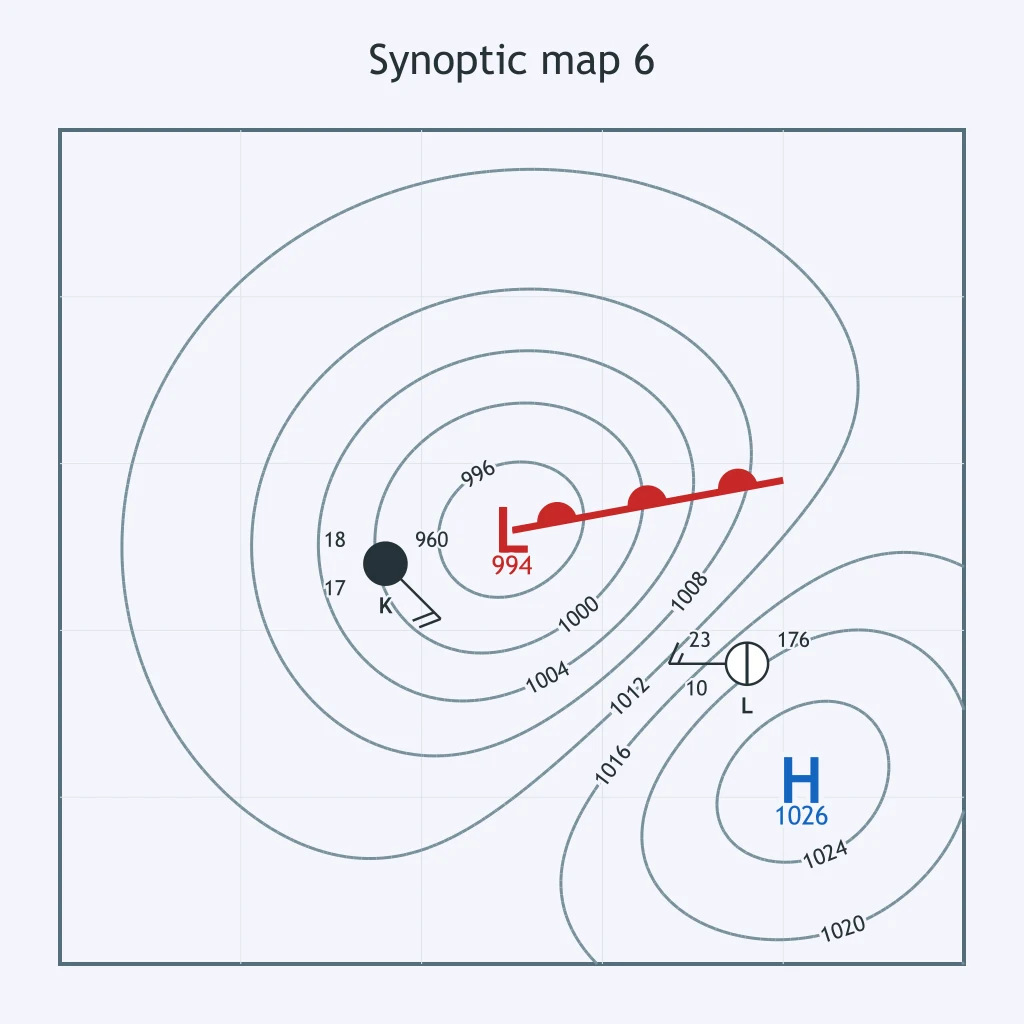
Stations M and N are plotted on the same map. Which station reports the warmer air temperature?
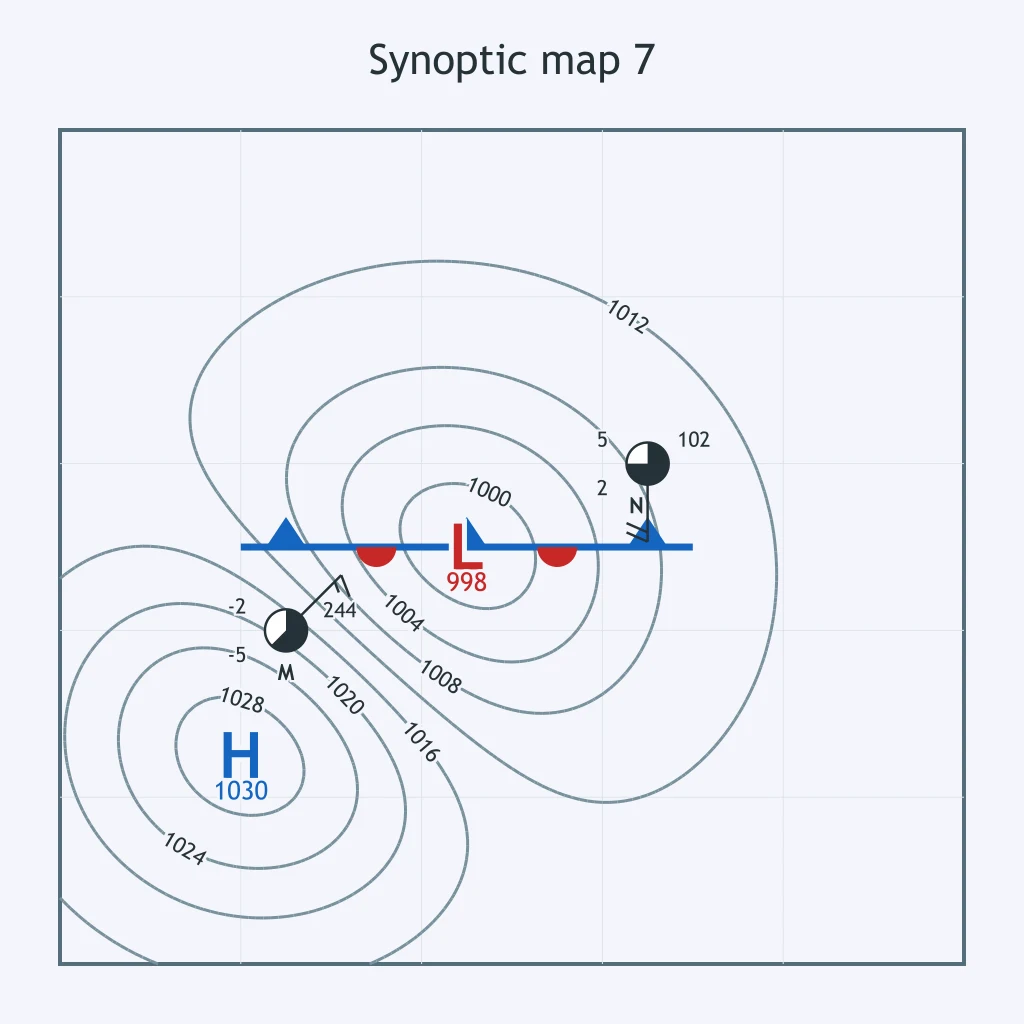
Compare Stations O and P. Which station reports the greater dew point temperature?
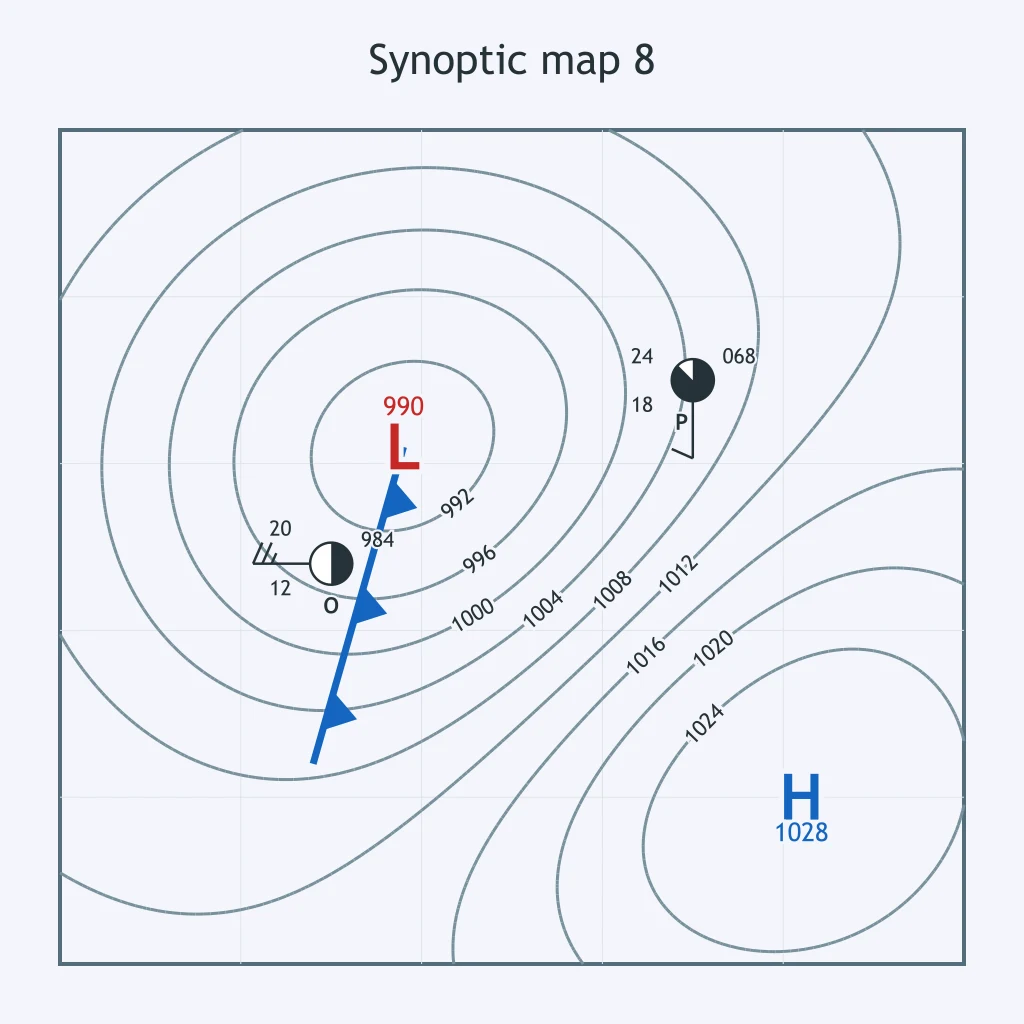
Stations Q and R have different temperature-dew point spreads. Which station reports the lower relative humidity?
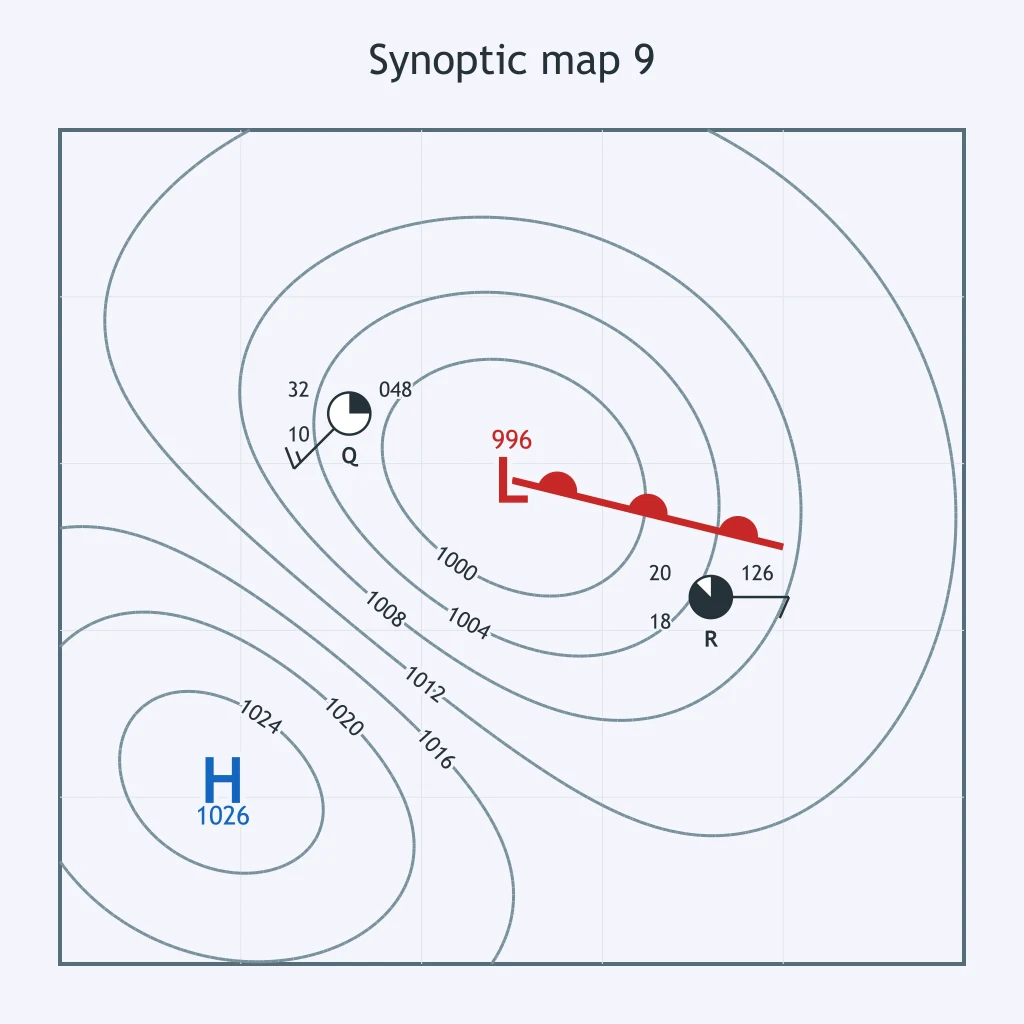
Stations S and T sit in different isobar spacing on the map. Which station is in the stronger pressure gradient?
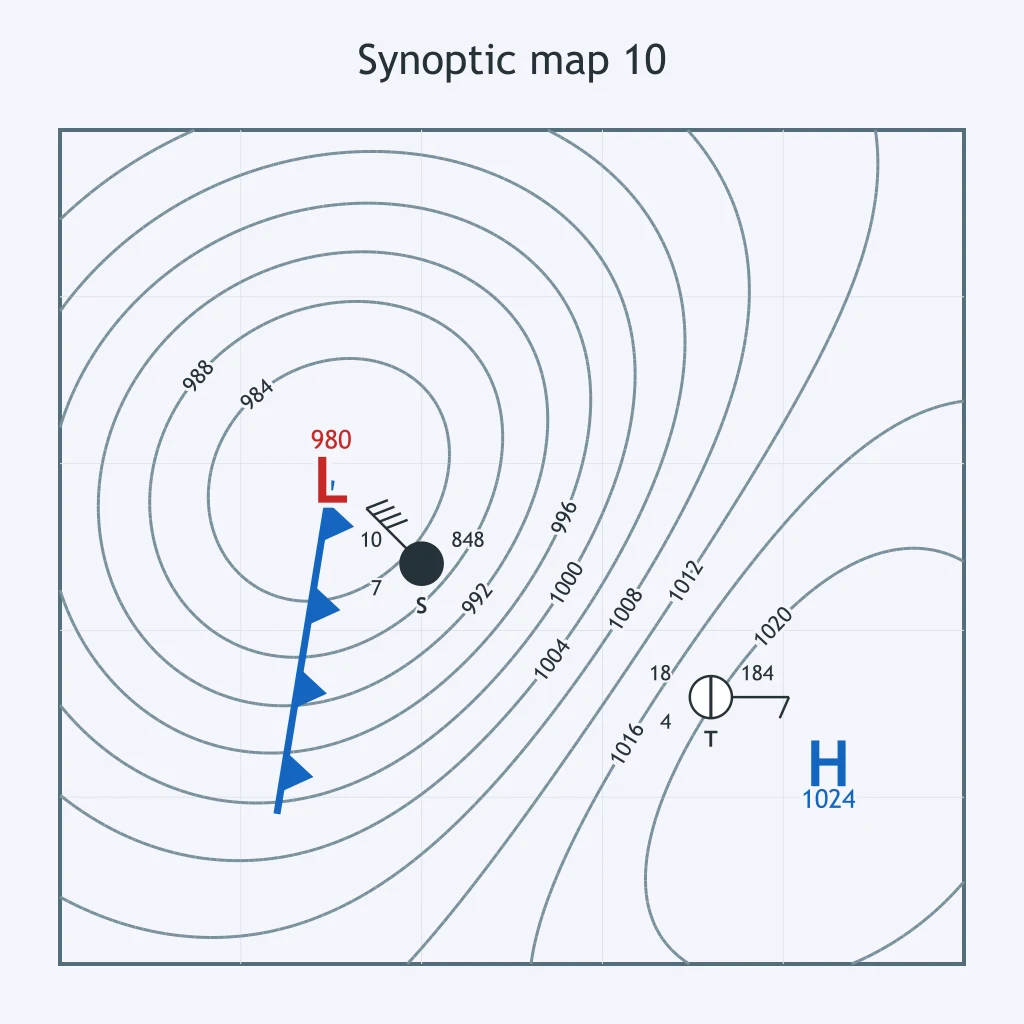
Use the station models for Stations A and B. What feature most likely lies between them?
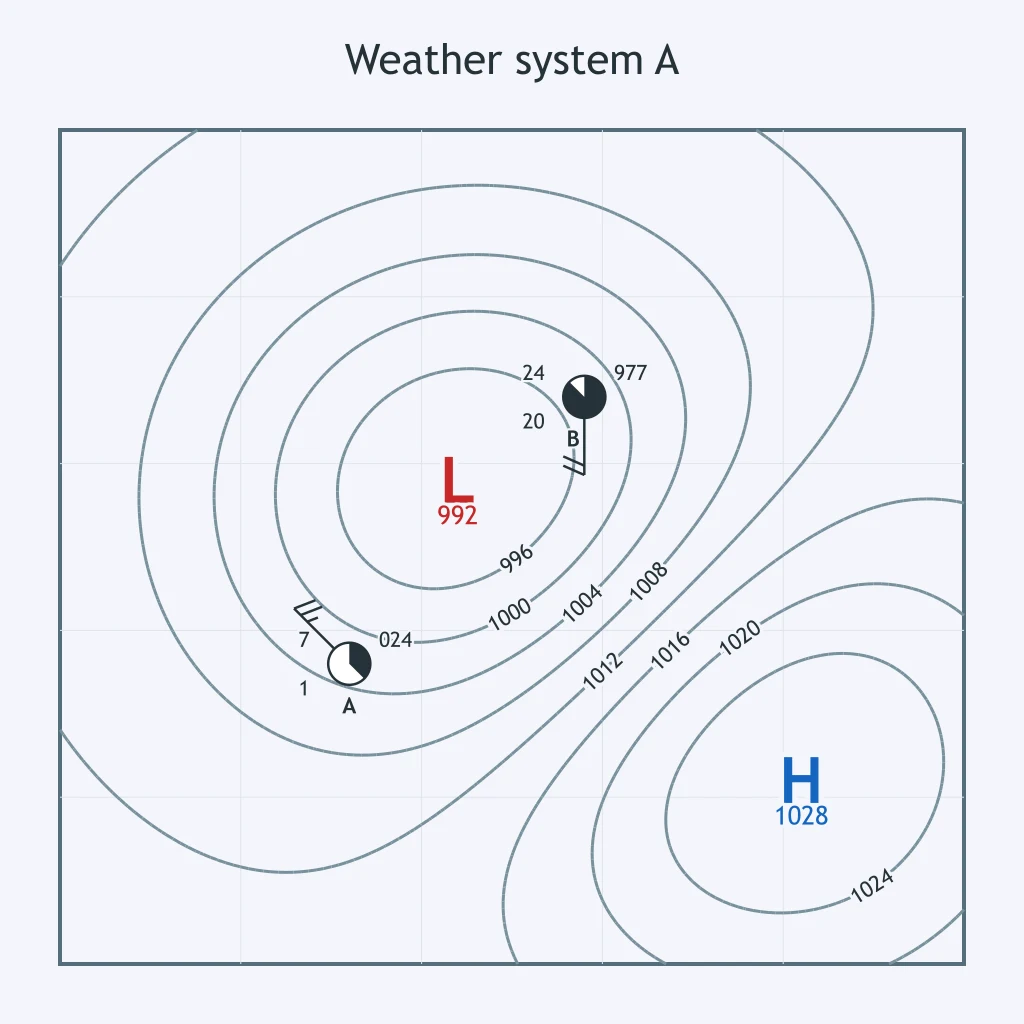
Use the map. What type of front separates Stations C and D?
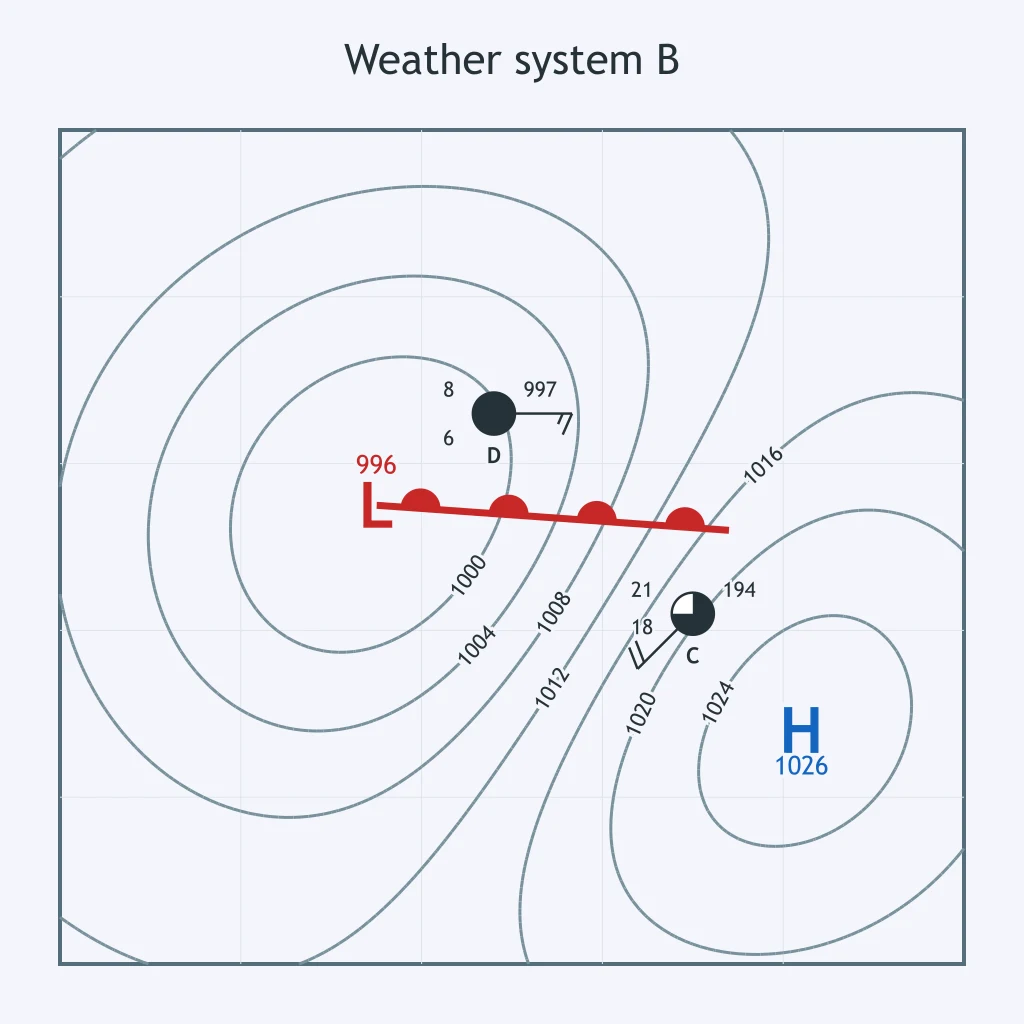
A front on the map separates cool northeast winds from warm southerly winds, but neither air mass is clearly advancing. What front is this?
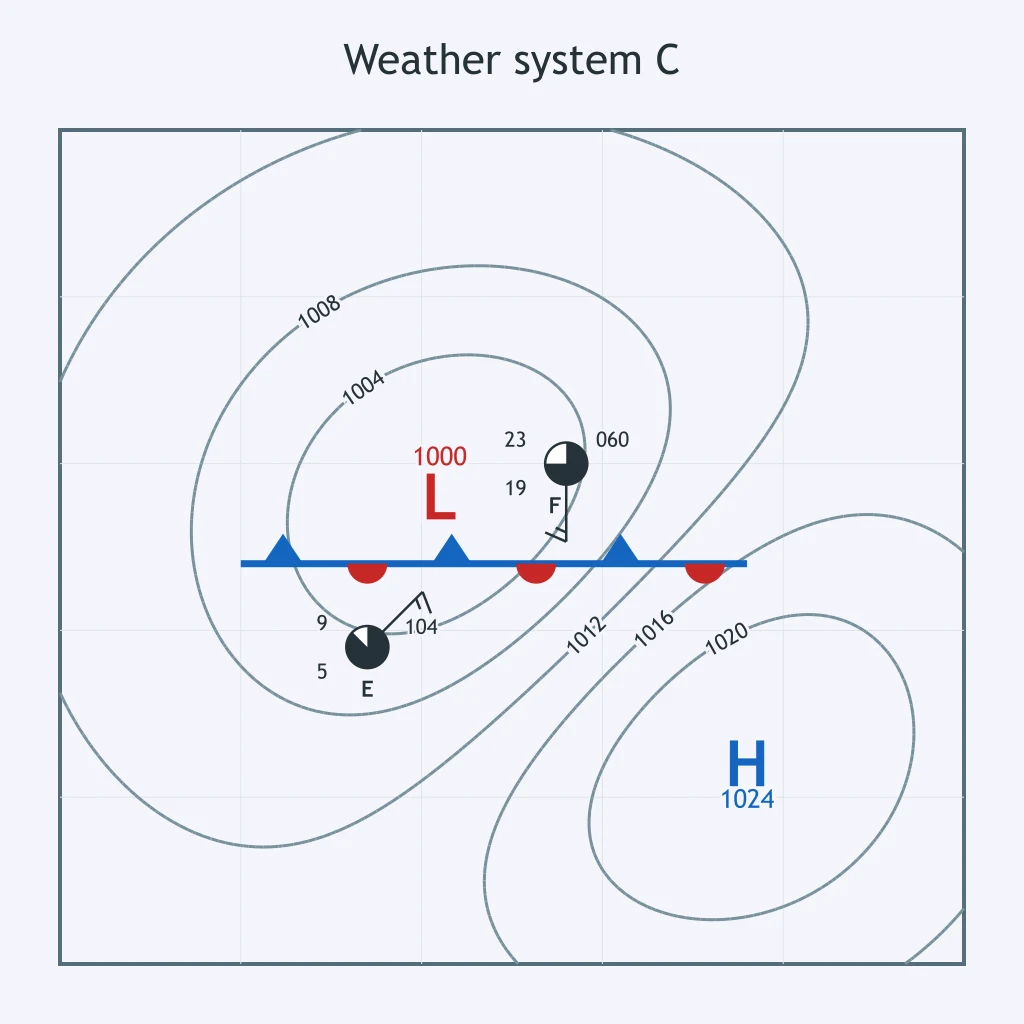
Near the low center, the plotted boundary shows a cold front catching a warm front. What type of front is at Station G?
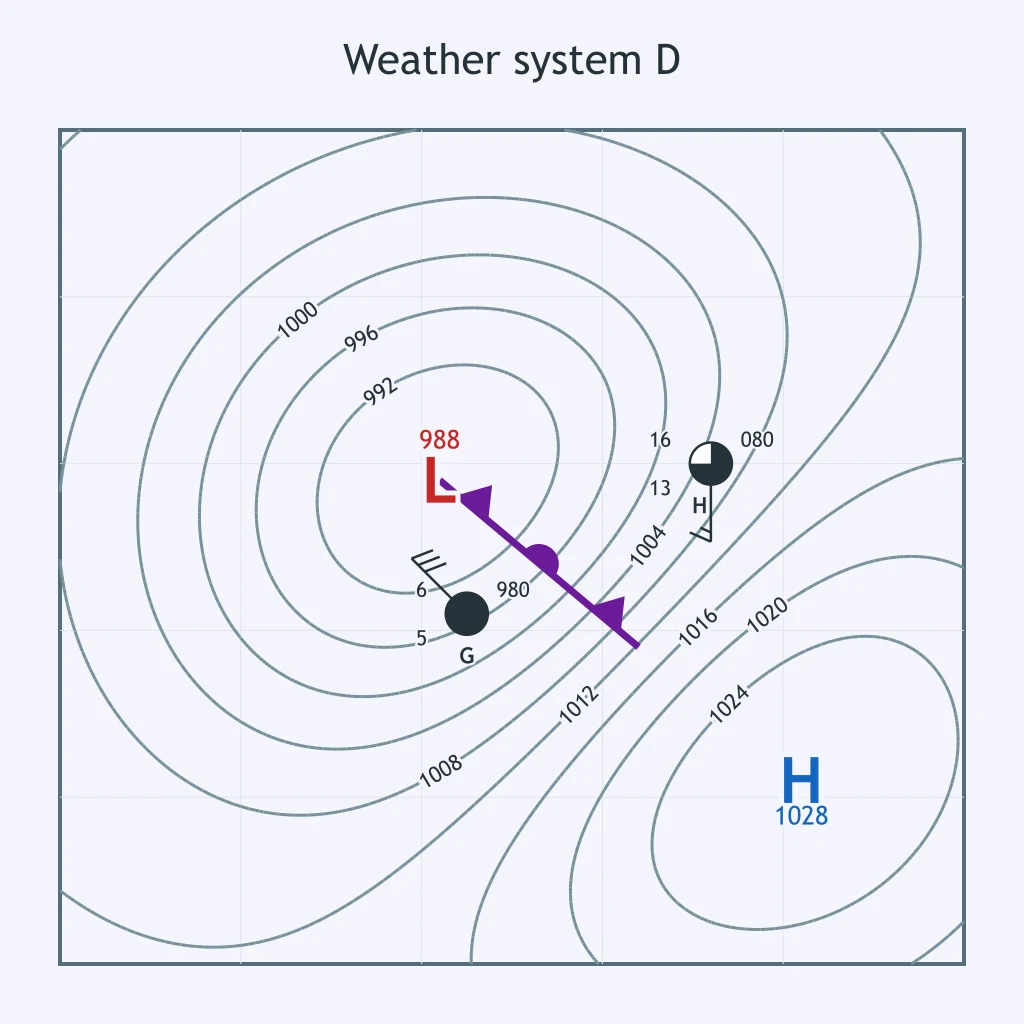
Station I is plotted at the lowest pressures with winds curving counterclockwise around it. What weather system center is closest?
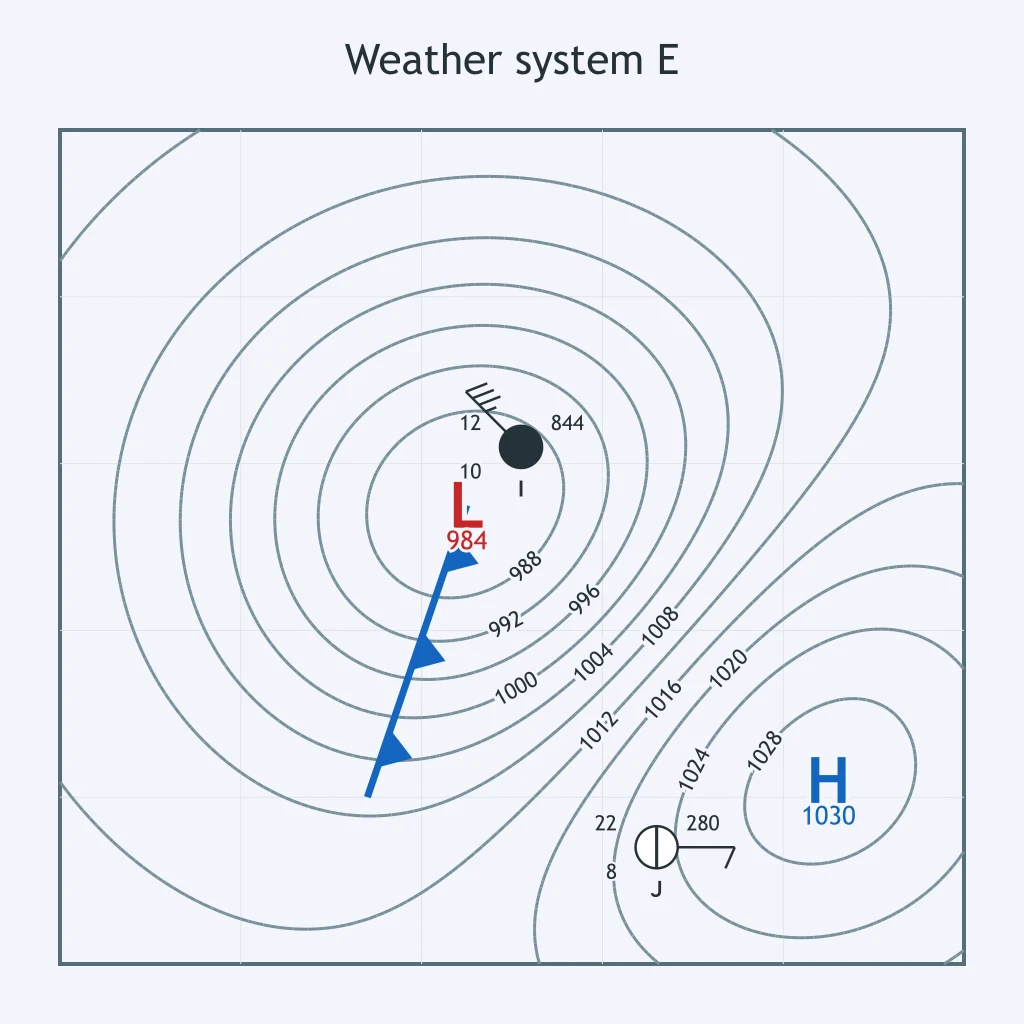
Station K lies in clear weather near the highest plotted pressure, with winds around the center. What system is it inside?
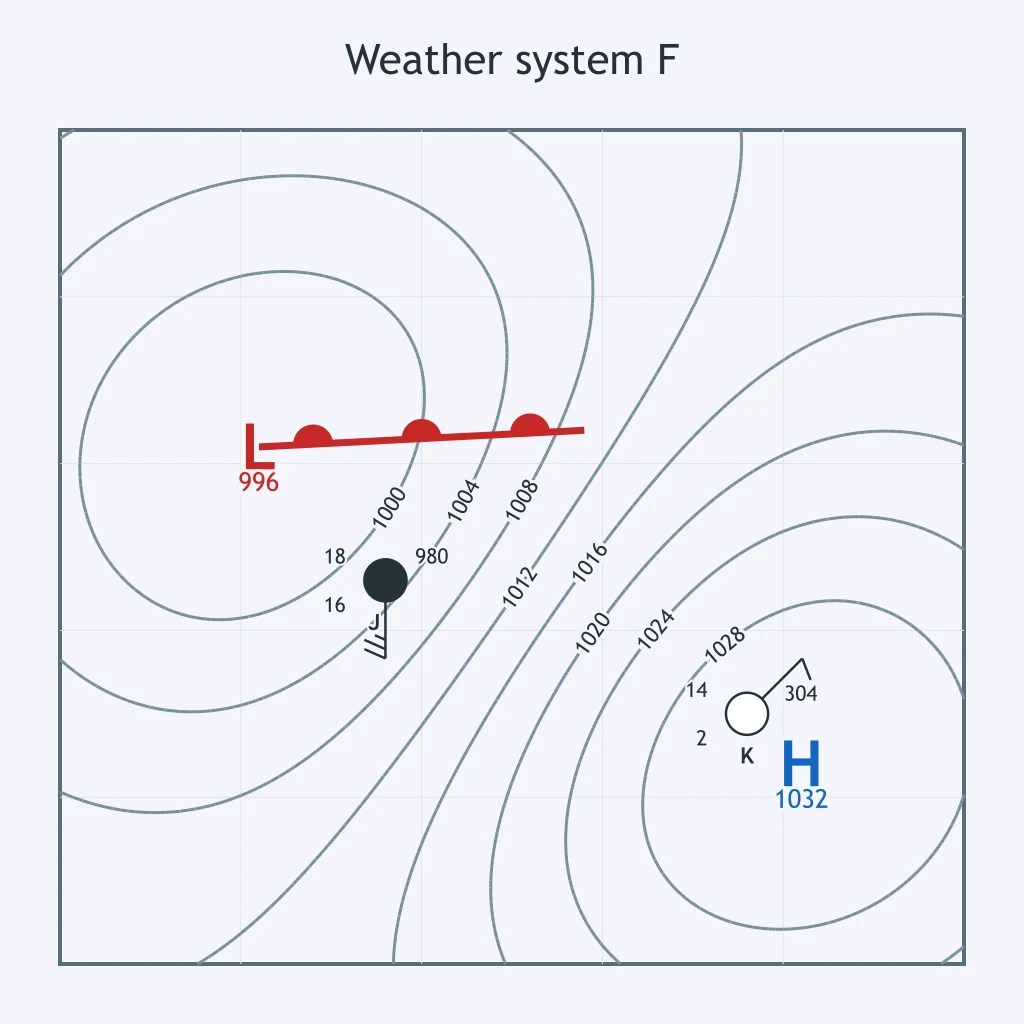
Use the map. What part of the cyclone is Station M in?
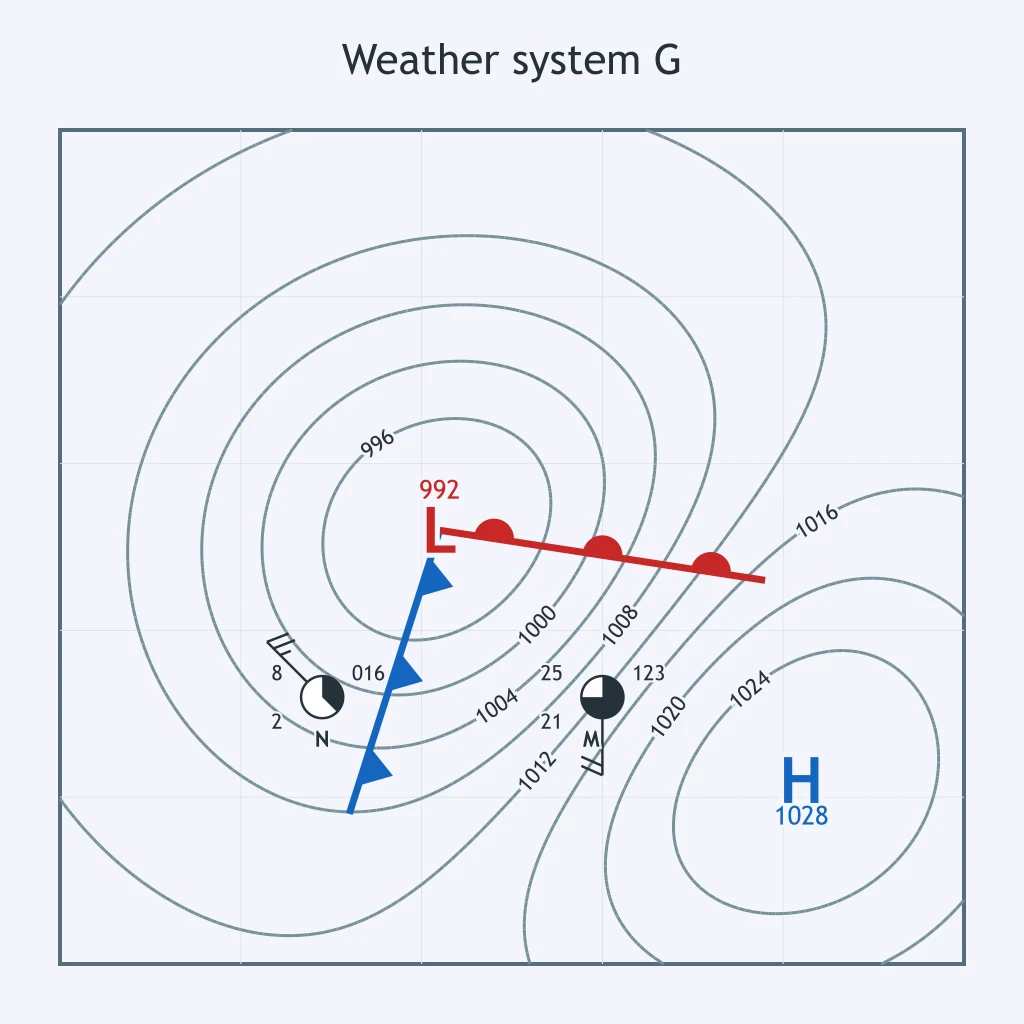
Station O is colder and drier than Station P and lies west of the cold-front symbols. Where is Station O located?
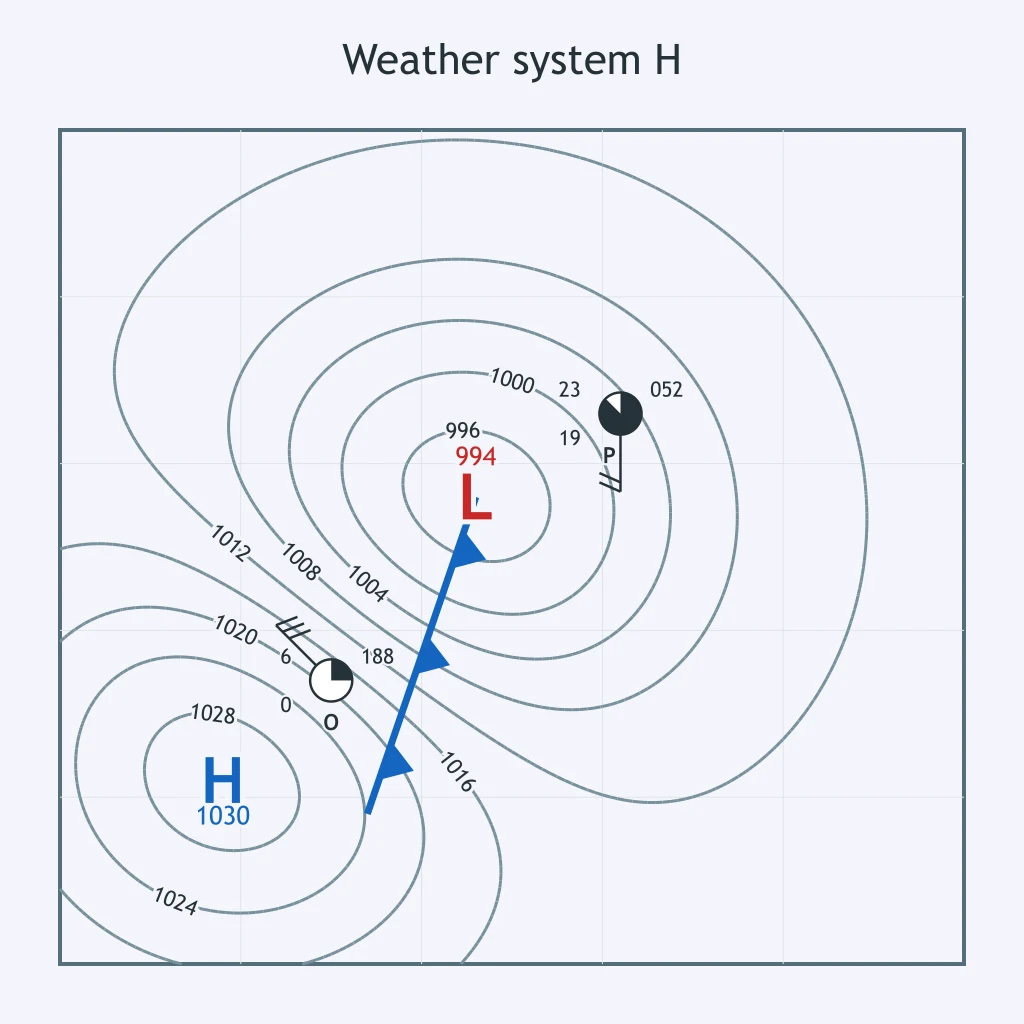
Station Q is cool, overcast, and has an easterly wind on the cool side of the warm-front symbols. Where is it located?
Station S sits along the front wrapping around the low where colder air has overtaken the warm front. Which feature is nearest Station S?
Crack the passcode before the zombies get in.
Answer, then swat bugs for bonus points.
Race through questions at your own speed.
Same question on every screen. Fastest wins.

Pick a tile, answer, hit bonuses and steals.
50 questions