Loading
by BlastRoom
Read synoptic weather maps to explain circulation, wind strength, weather, and the life cycle of highs, lows, and mid-latitude cyclones.
#earth_space_science
30 questions
One question set, multiple game modes. Tap any game to see it in action. Not sure which to pick?
Answer to place stones and capture territory.
Outrun the snow together.
Earn blasts, then hunt the other team.
Answer to earn energy, then climb.

The class blasts through walls together.
Bid on mystery lots. Most money wins.
Sell tours. Nice, standard, or a total scam.

Answer, restock, and serve the rush.
More correct answers pulls the rope your way.
Answer, then shoot down the alien wave.
Answer, then tap to leap the frozen ridge.
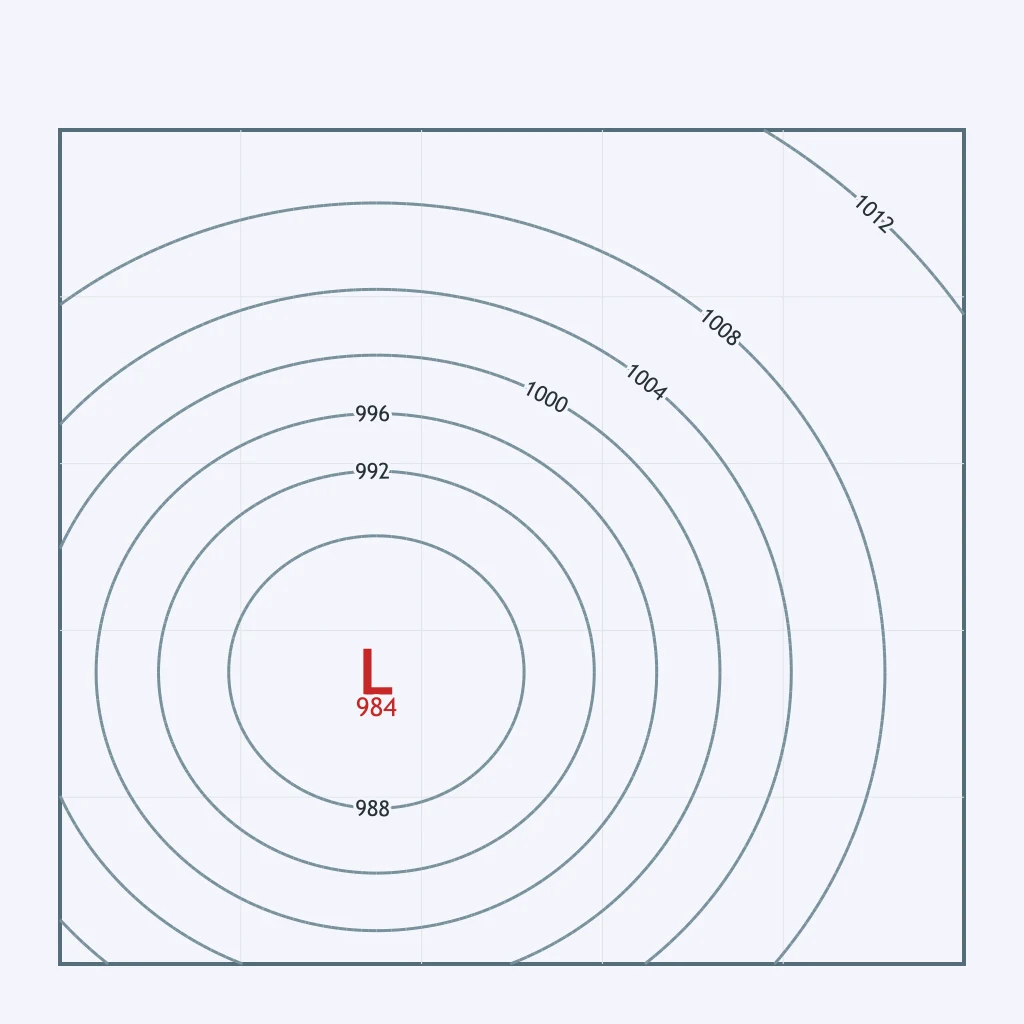
The weather map shows a low-pressure center over the Texas Panhandle with its isobars drawn around it. In the Northern Hemisphere, how does surface air move around that center?
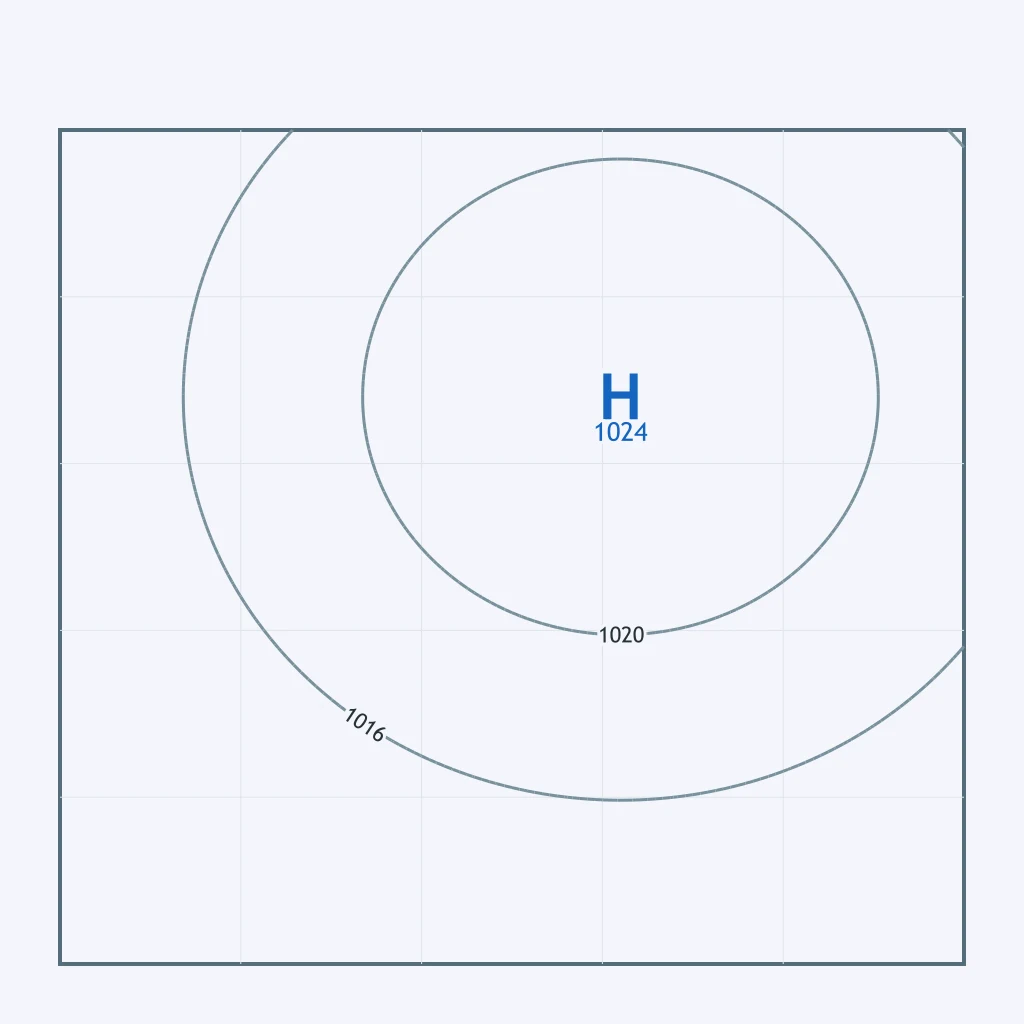
The weather map shows a high-pressure center over the Ohio Valley with its isobars drawn around it. In the Northern Hemisphere, how does surface air move around that center?
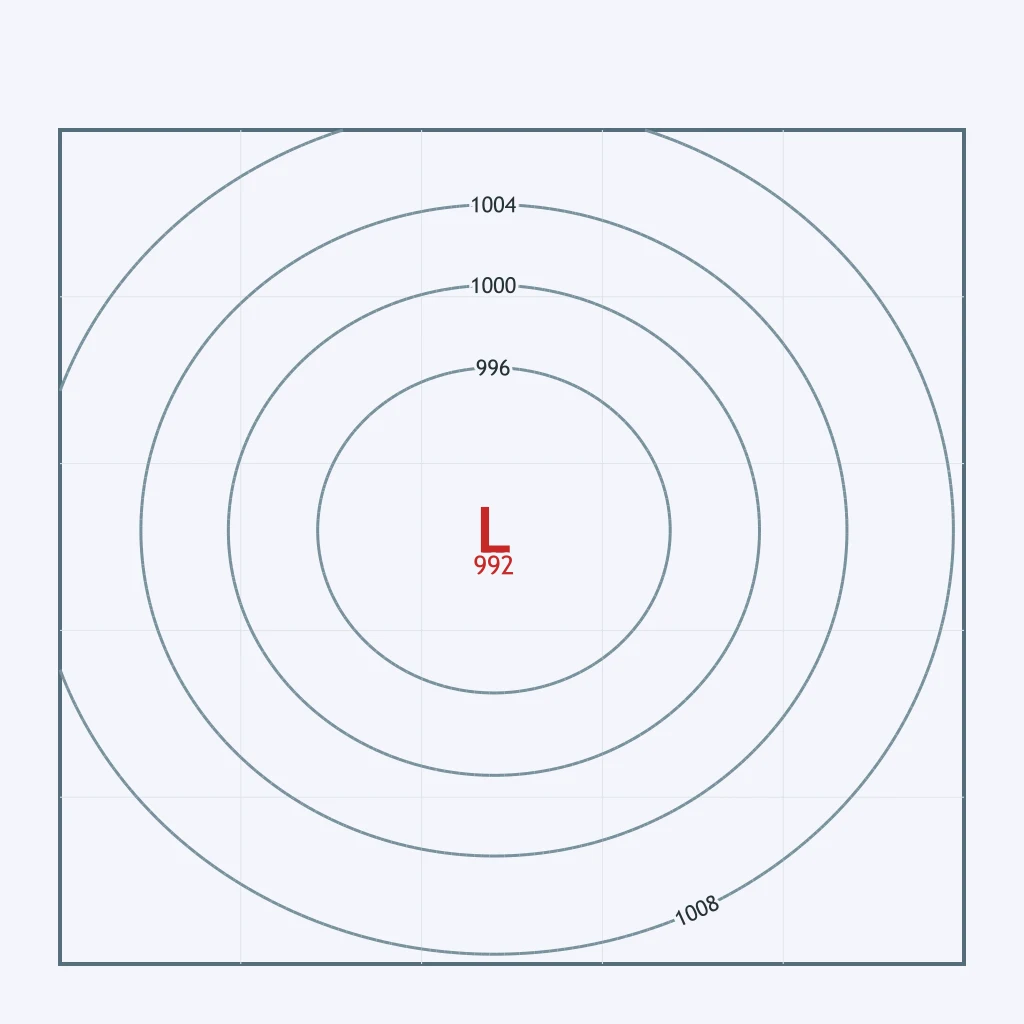
A low-pressure center sits over the Central Plains, its isobars circling it on the map. Which pair correctly names the rotation and the flow direction of the surface wind around it?
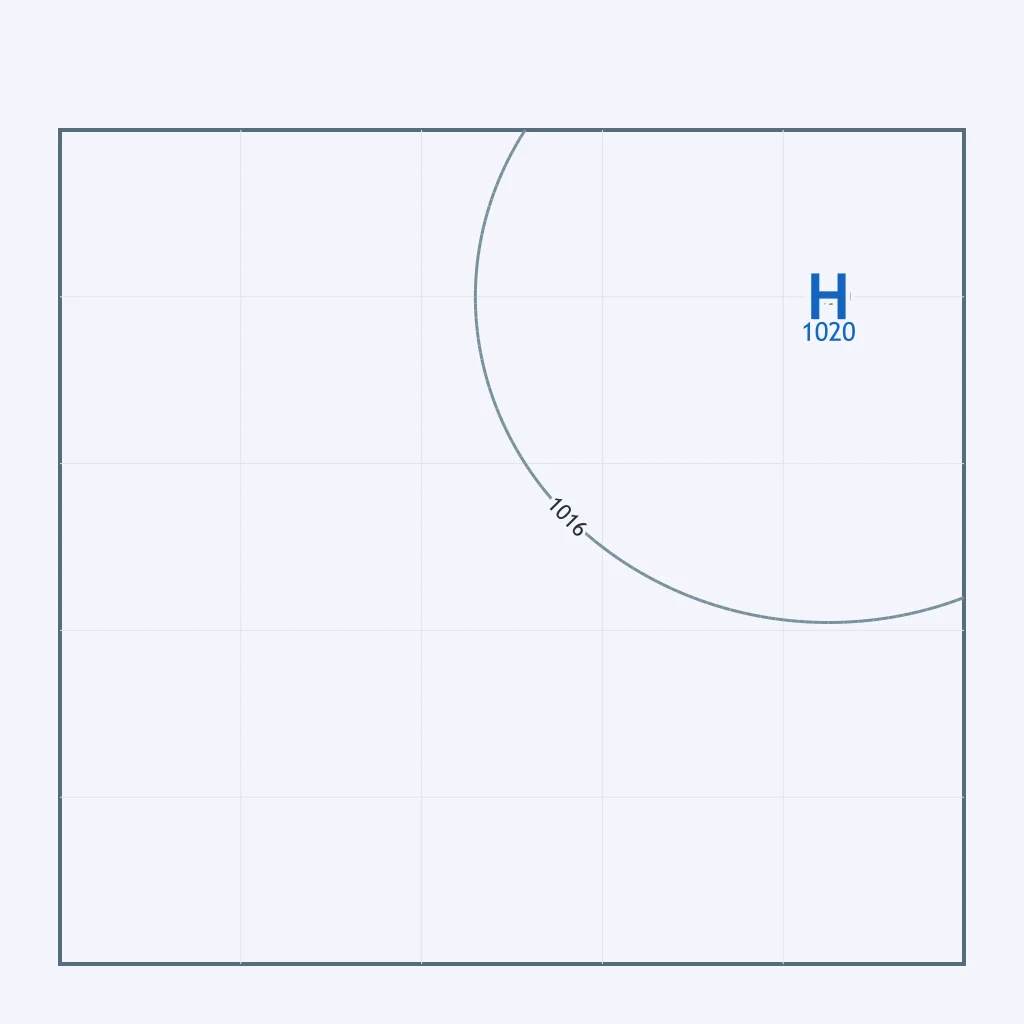
The map shows a ridge of high pressure over New England with isobars circling the center. Which pair correctly names the rotation and the flow direction of the surface wind there?
Because surface friction turns the wind across the isobars, air near the low-pressure center shown over the Gulf Coast spirals ___ and ___ the center.
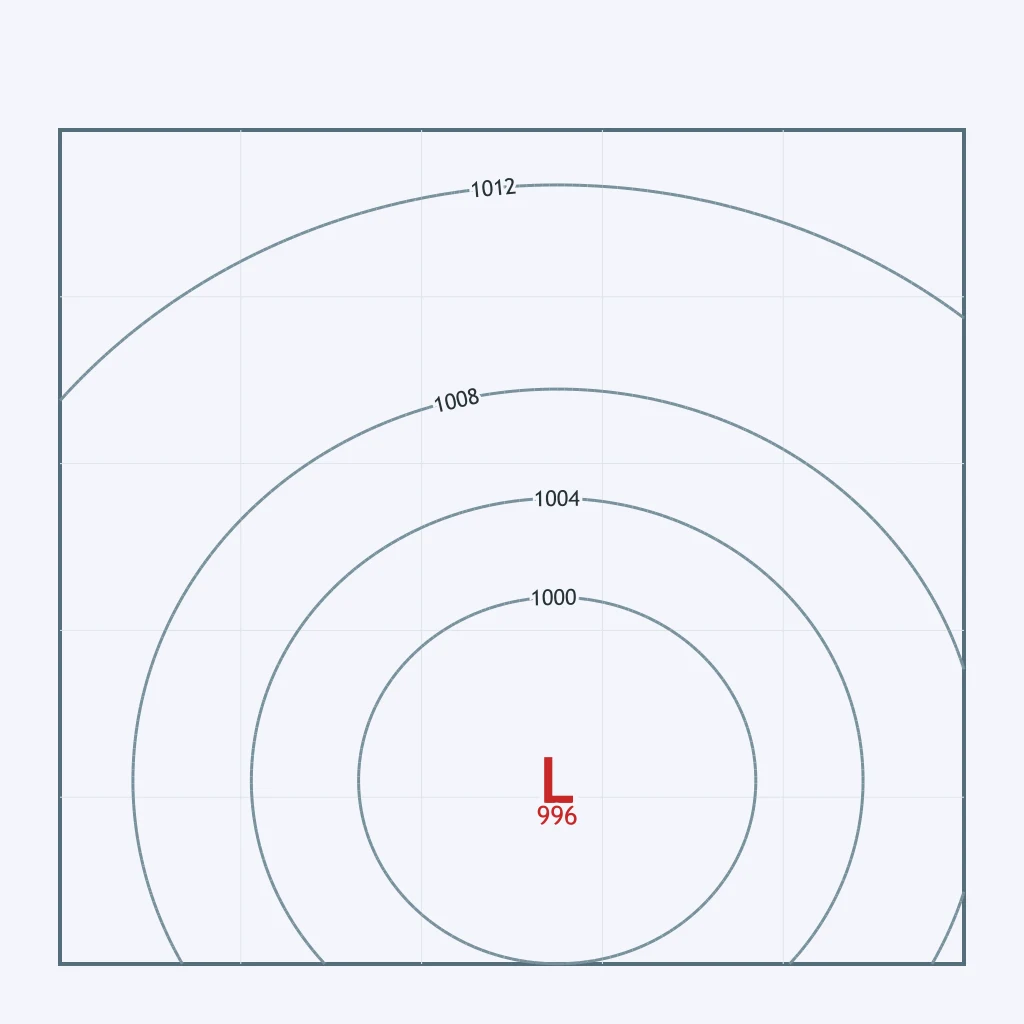
The map shows a high building over the Great Basin, its isobars circling the center. As surface air flows outward from that center, which way does it turn?
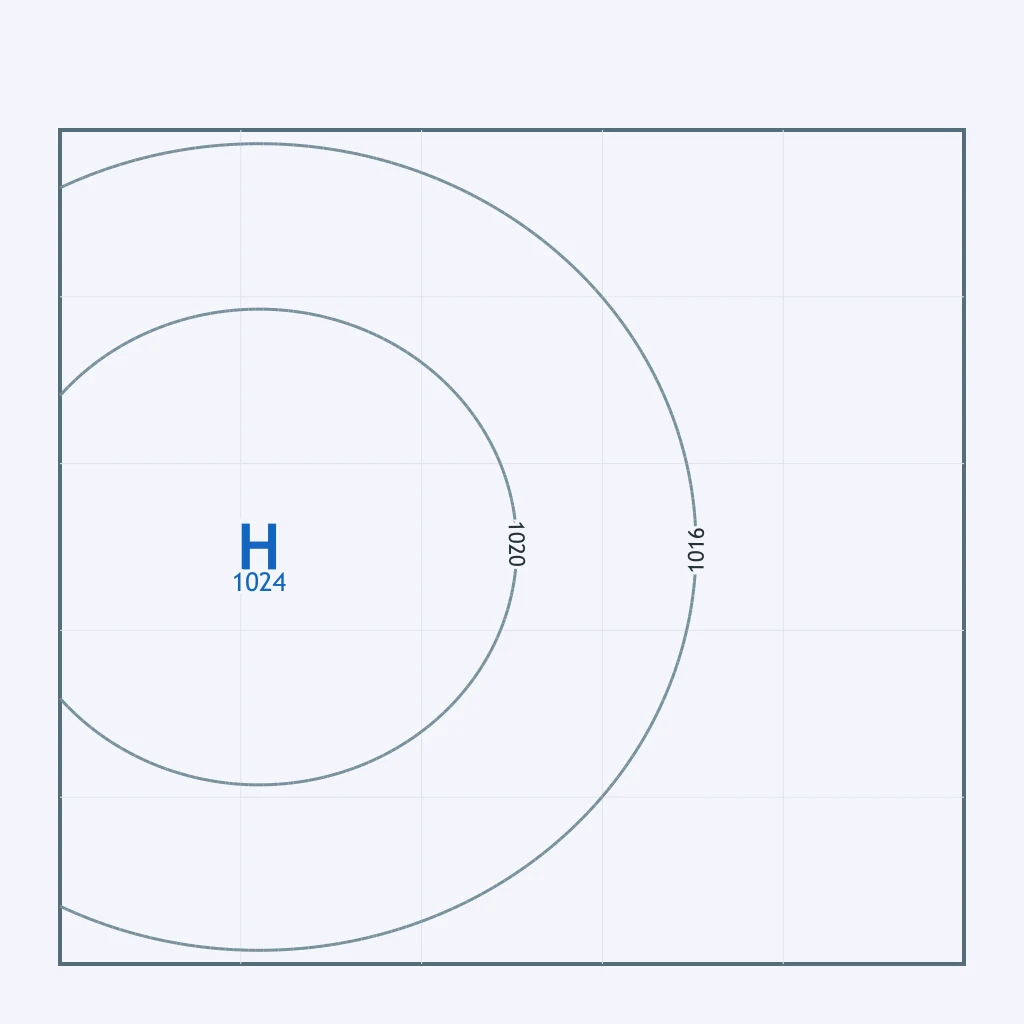
The map plots a low near the Pacific Northwest coast and a high over the Deep South, each with isobars circling it. Which pair correctly matches the surface circulation at each center?
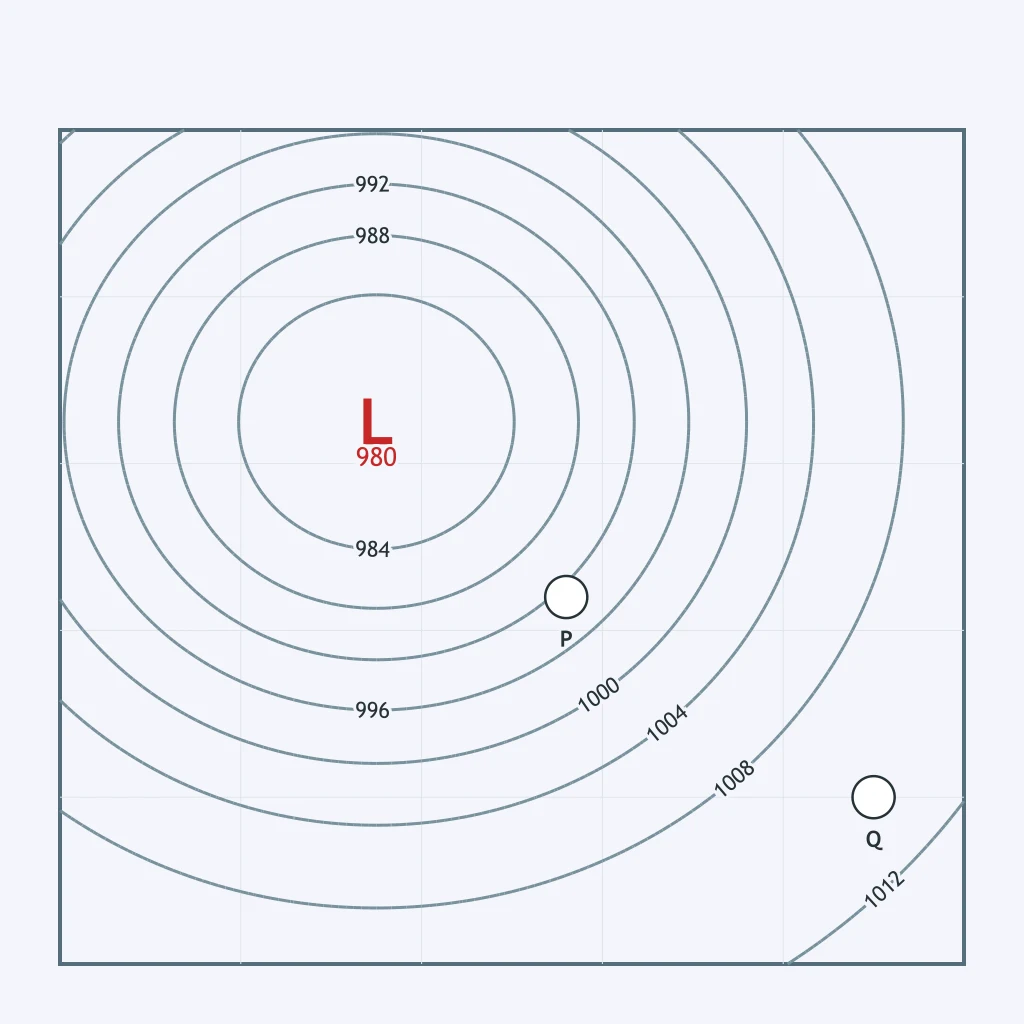
On the weather map, compare how closely the isobars are spaced near point P and near point Q. What does that spacing show?
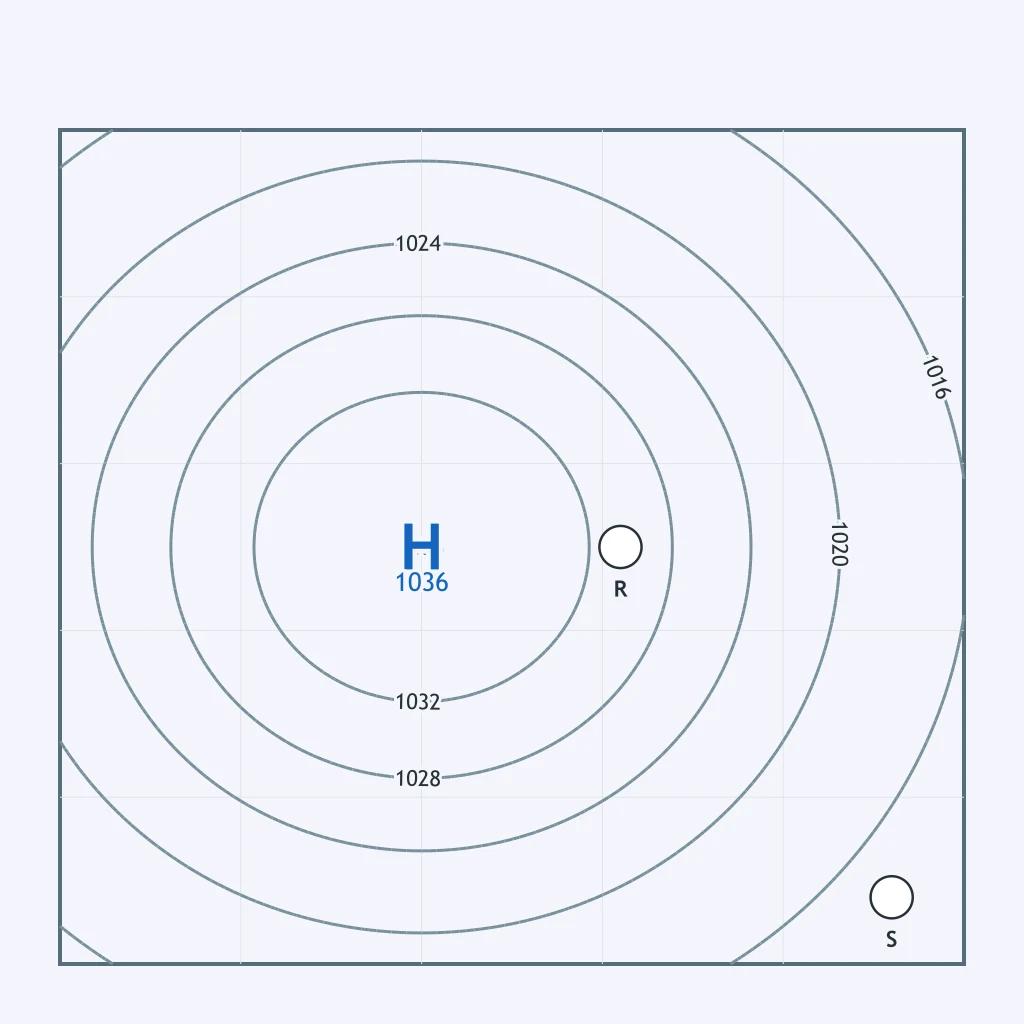
On the weather map, compare how closely the isobars are spaced around point R and around point S. Which location is under lighter, calmer wind?
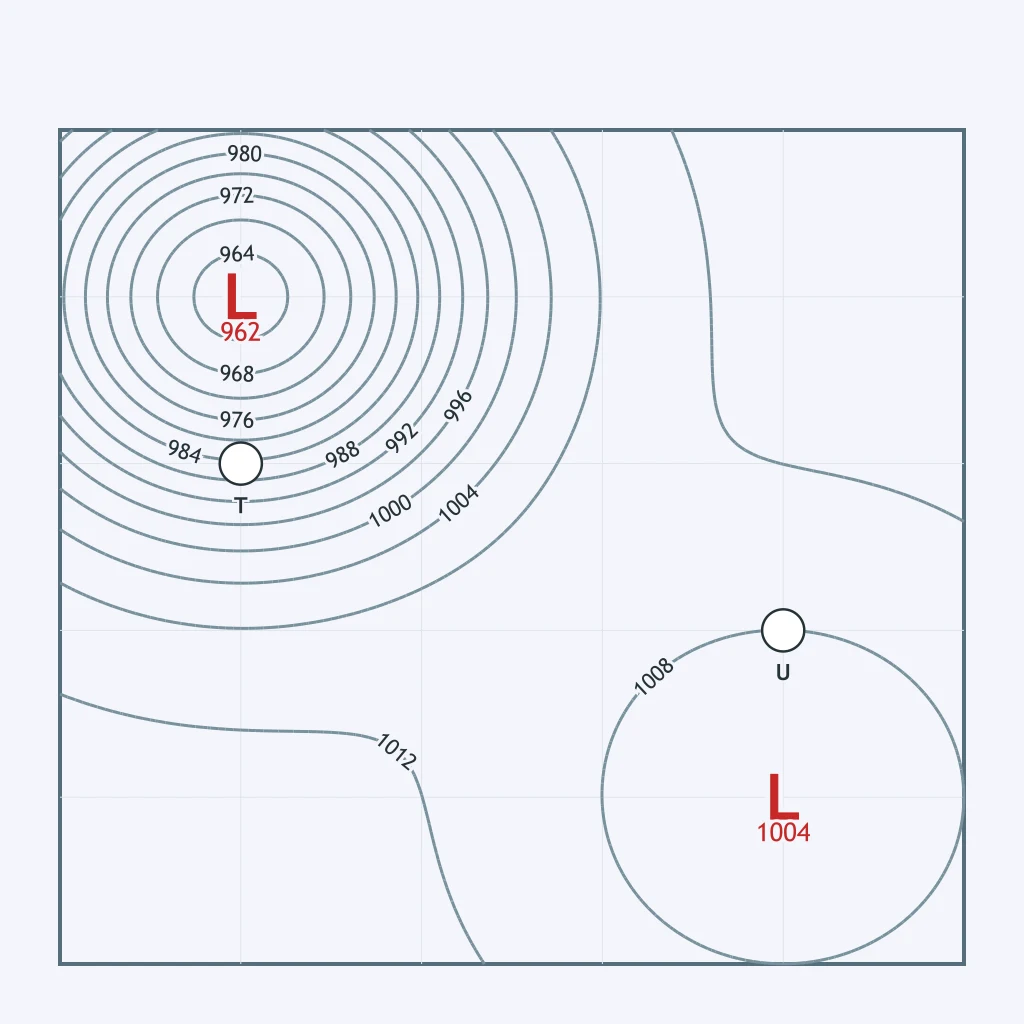
Point T sits near a low of 962 mb. Point U sits the same distance from a separate low of 1004 mb. At which point are the isobars packed more tightly, meaning faster wind?
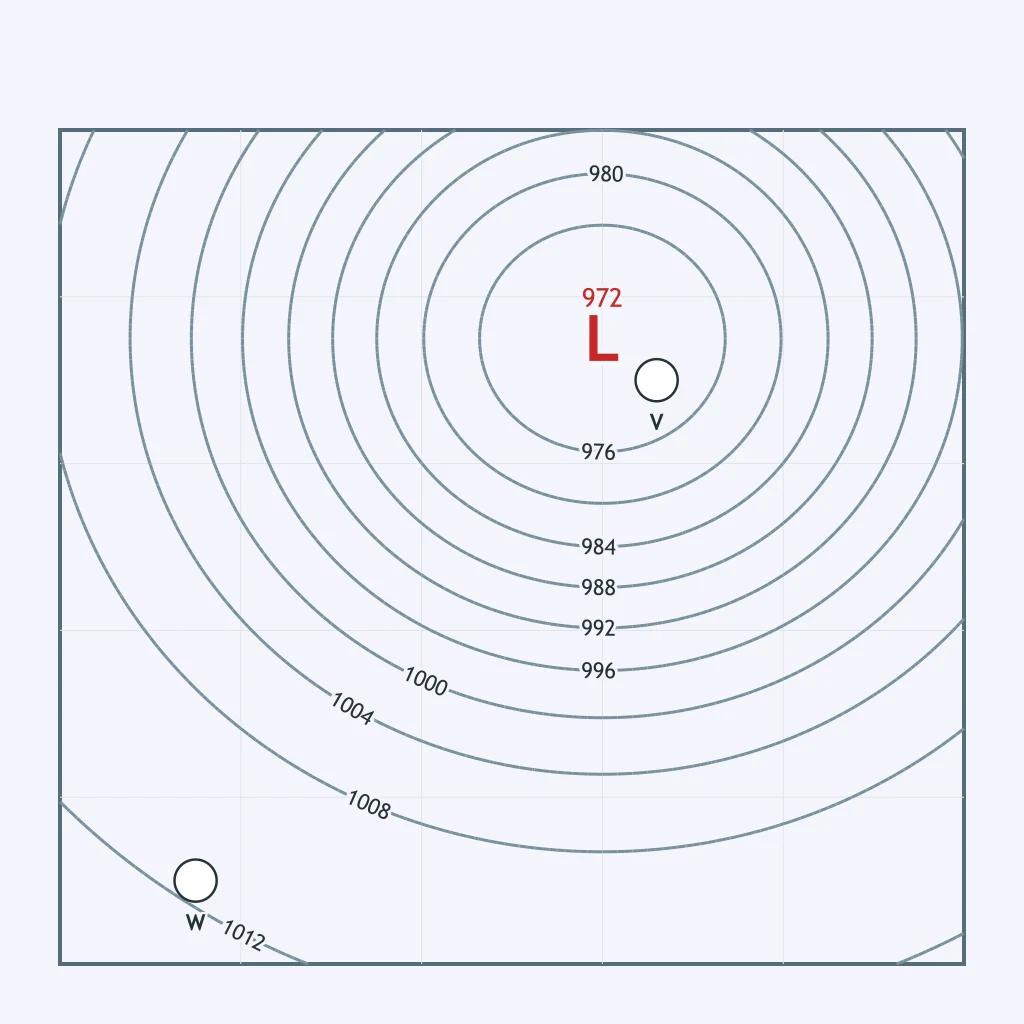
Between point V and point W on the map, which one sits in a region of steeper pressure gradient, based on how closely the isobars are spaced there?
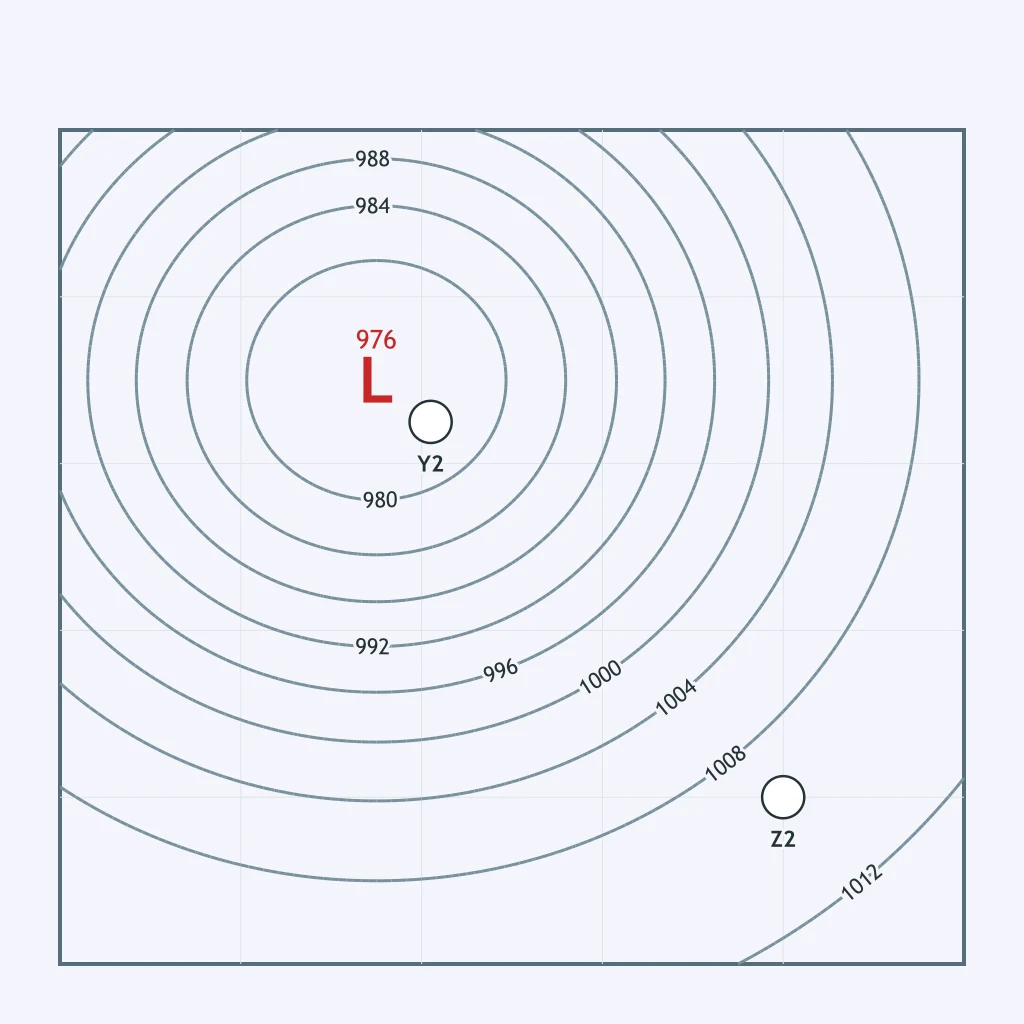
Compare how many isobars cross the same short distance near point Y2 and near point Z2 on the map. Which point has the stronger wind?
On a synoptic weather map, why do widely spaced isobars indicate lighter wind than closely spaced isobars?
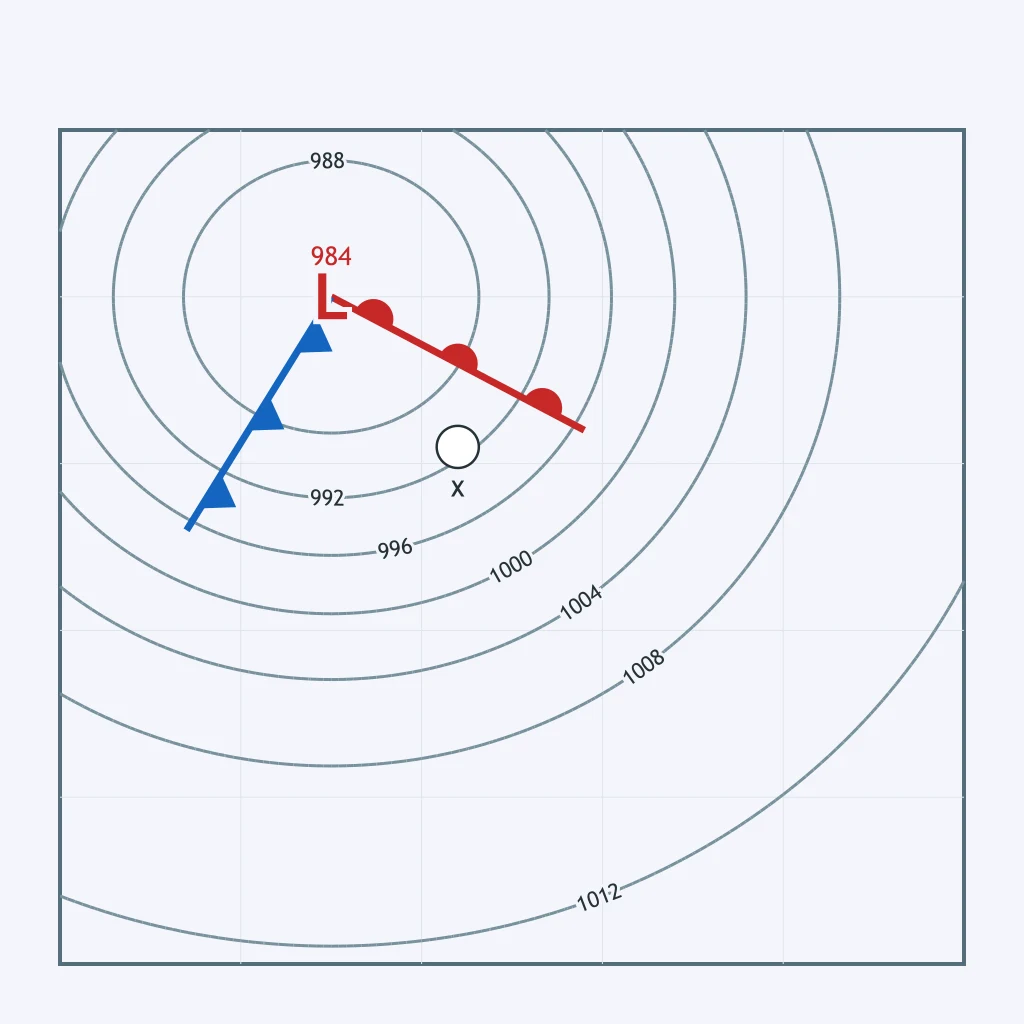
Use the weather map. What weather does point X most likely report?
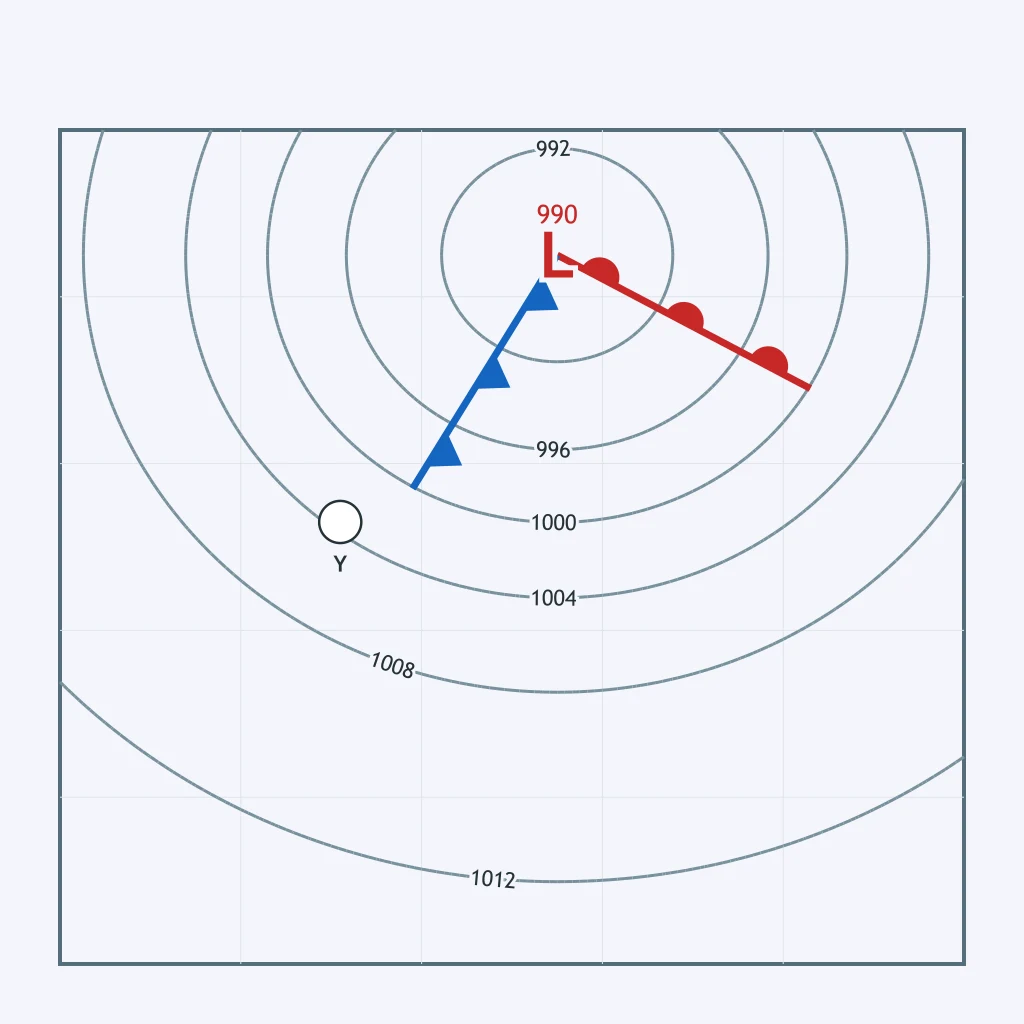
Use the weather map. What weather does point Y most likely report?
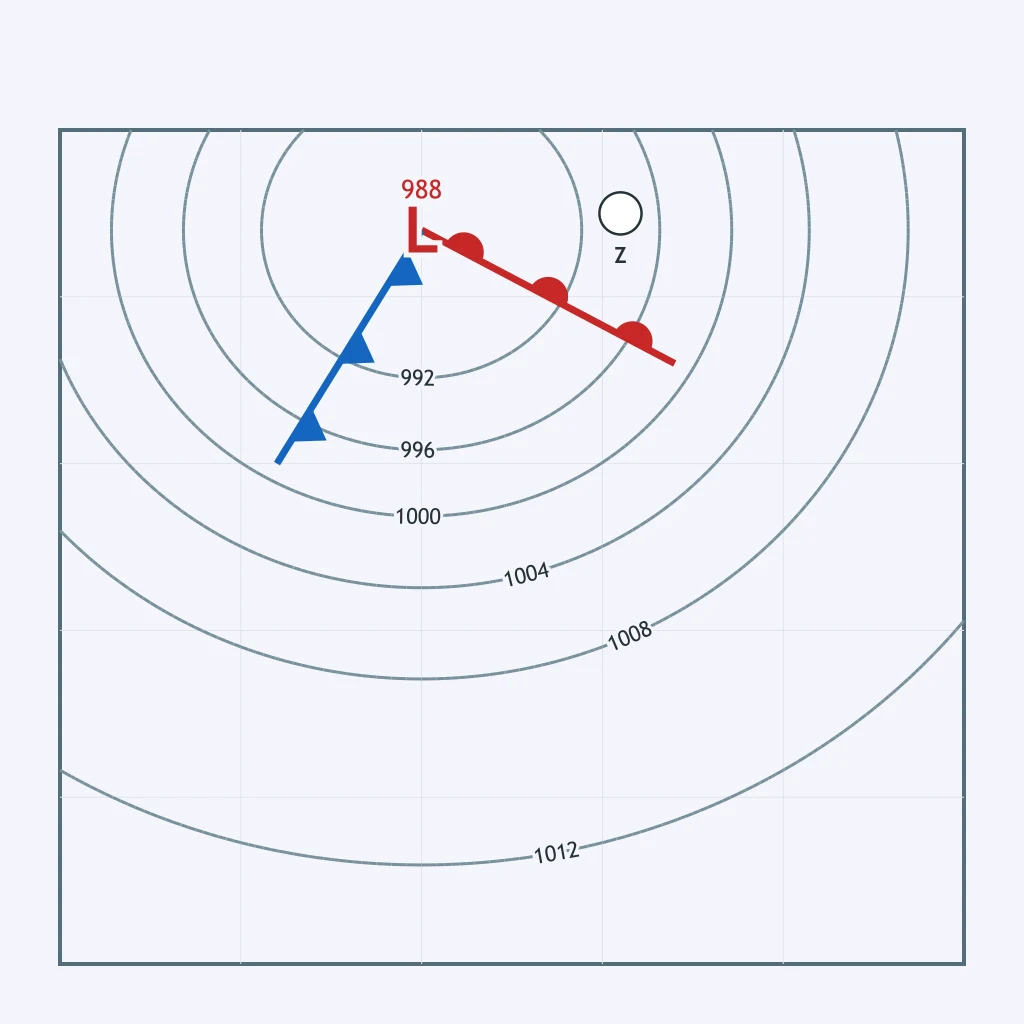
Use the weather map. What weather does point Z most likely report?
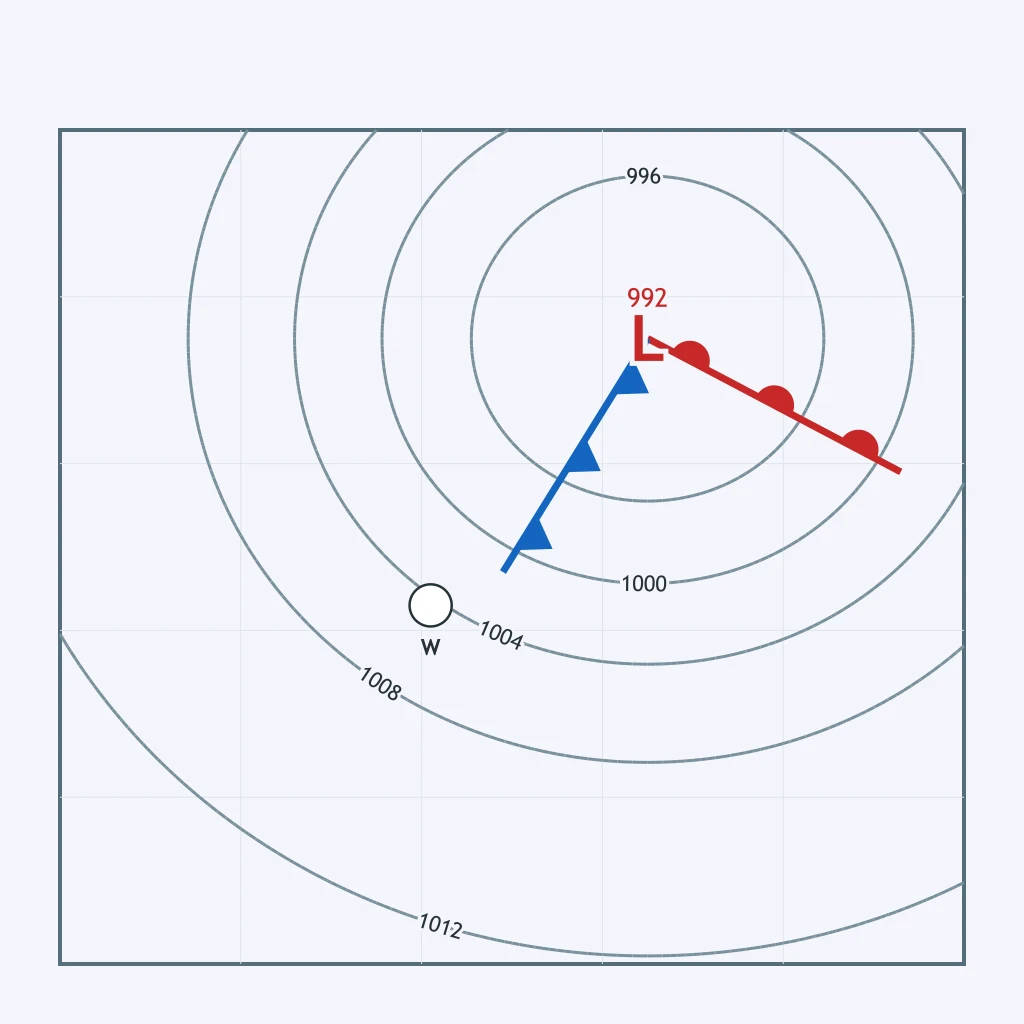
Use the weather map. Compared with the air on the other side of the nearby front, how does the temperature at point W differ?
Use the weather map. What weather does point N most likely report?
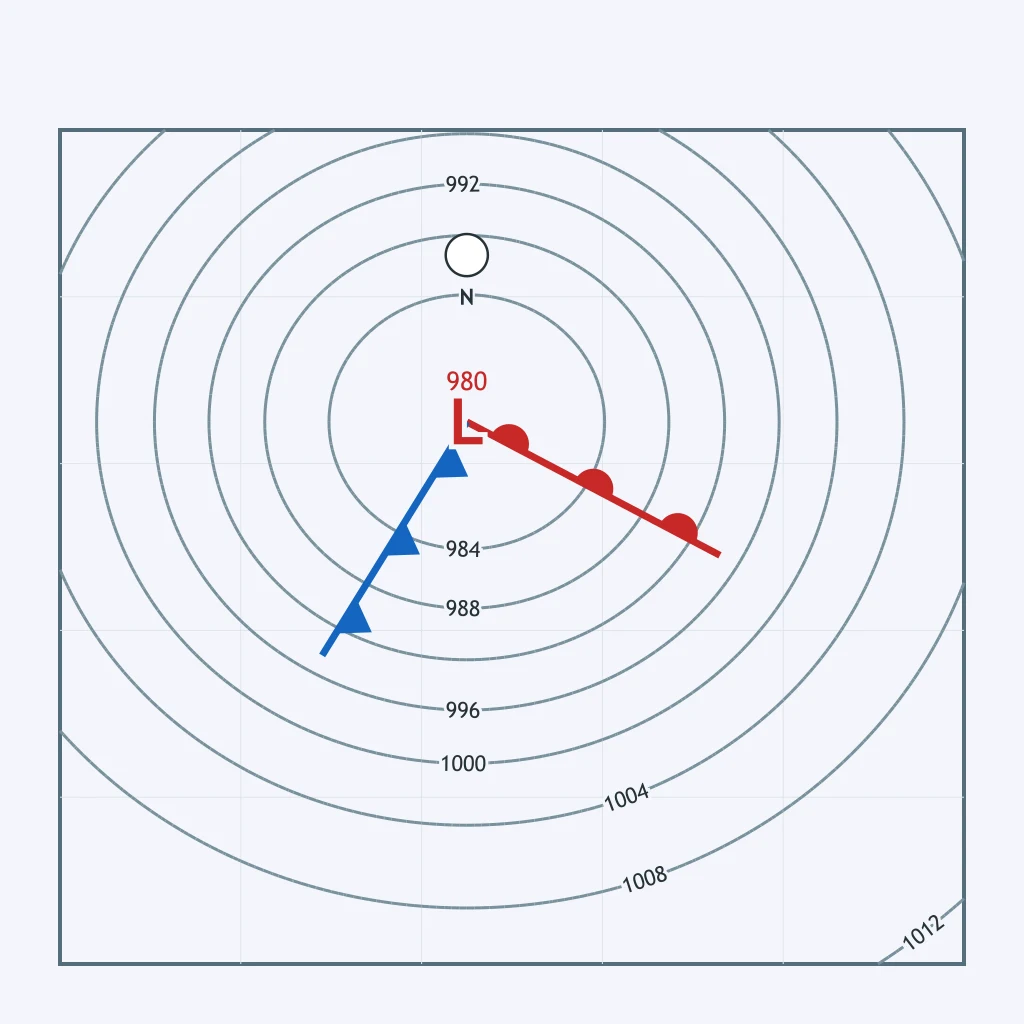
Use the weather map. What does the position of point M indicate about the air mass there?
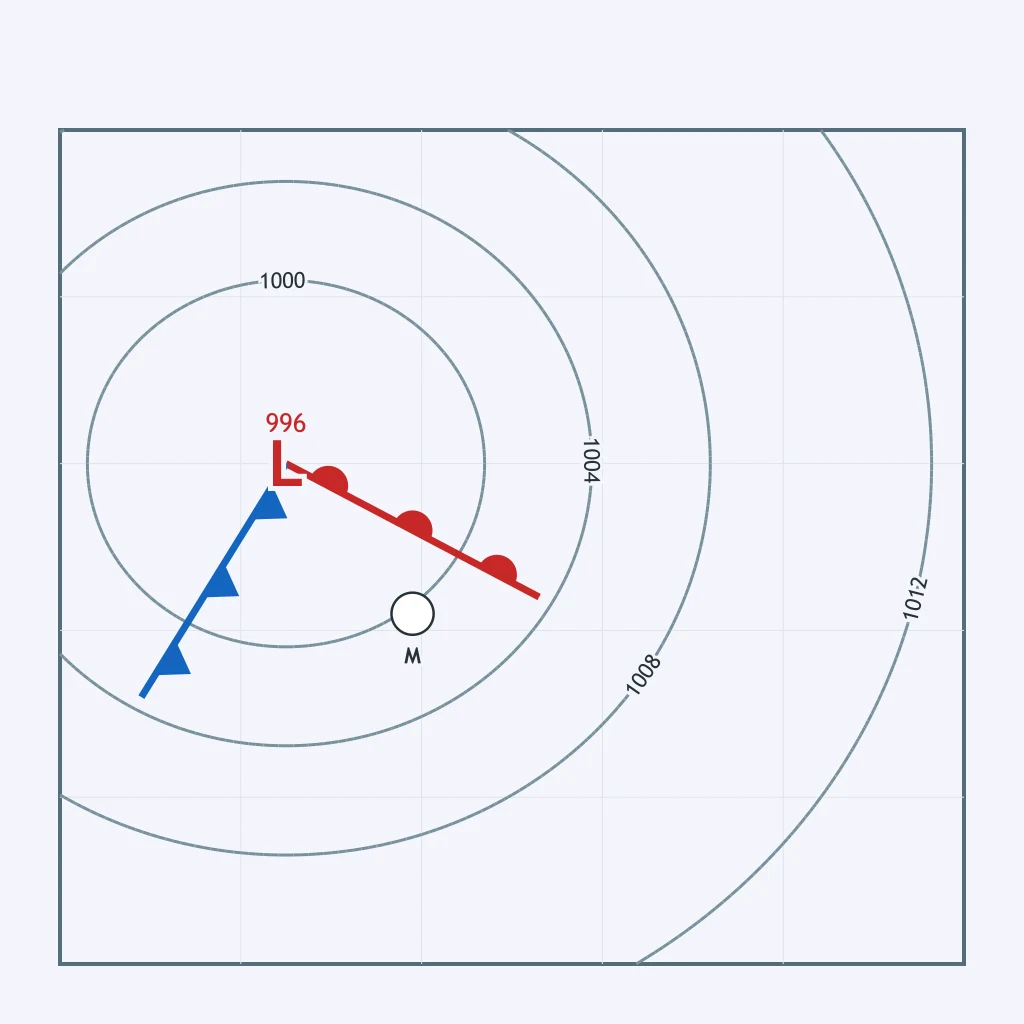
Point K on the map lies directly on the cold front as it sweeps east across the region. What weather is most likely occurring at K right now?
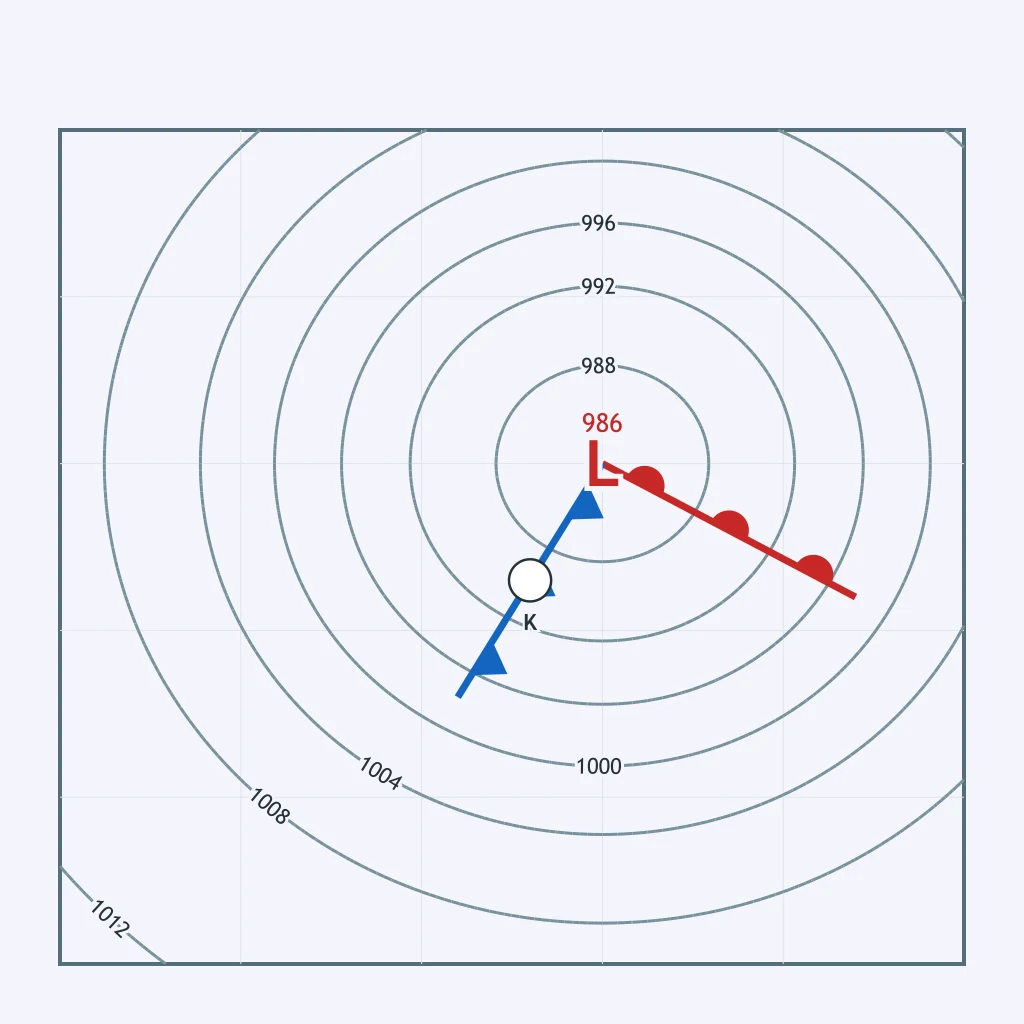
A mid-latitude cyclone begins as a small wave that develops along a stalled boundary between two air masses. What kind of front is that starting boundary?
As the wave stage of a mid-latitude cyclone develops, the deepening low organizes the stalled boundary into which two features?
The map shows a low with a single front drawn from its center. Which stage of the mid-latitude cyclone life cycle does this front represent?
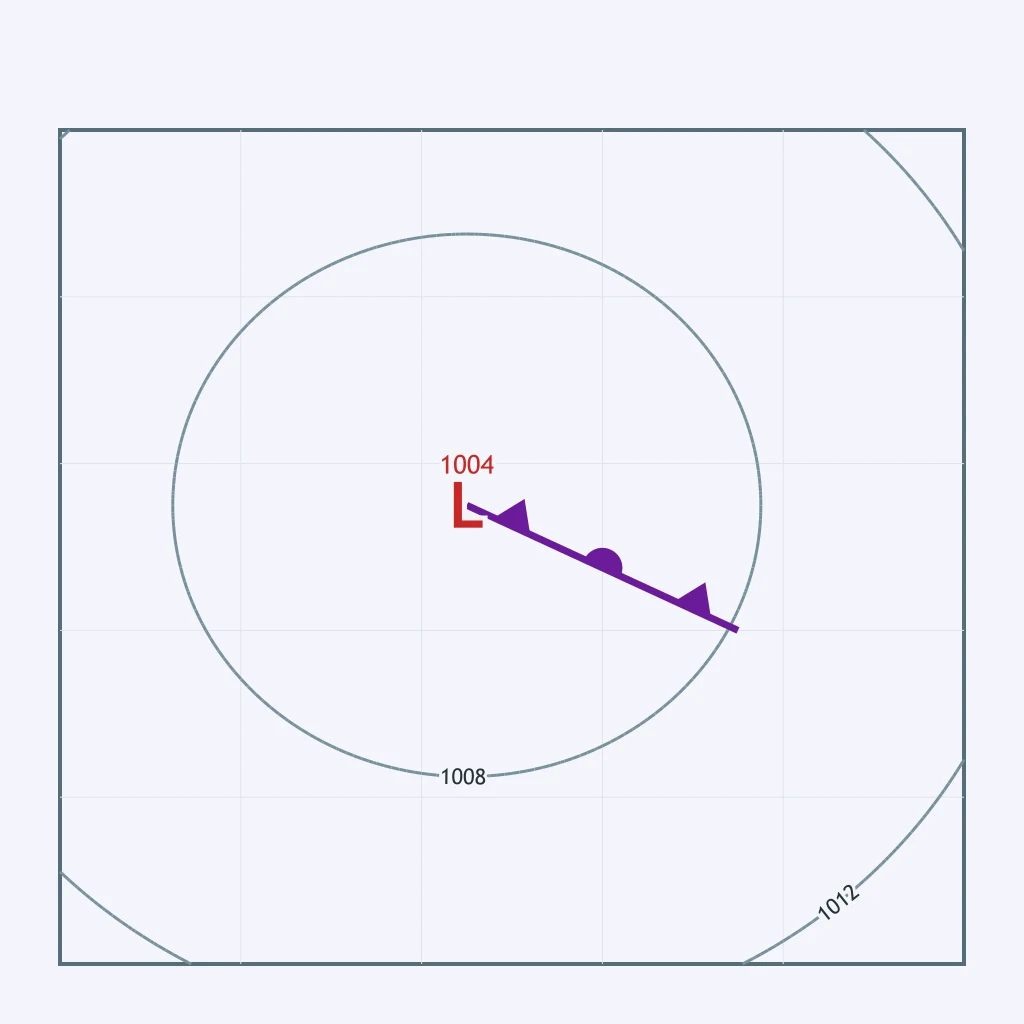
What generally happens to a mid-latitude cyclone once occlusion has lifted all of its warm-sector air off the surface?
The map shows a boundary between two air masses with only a slight bend and a weak, shallow low just forming along it. Which stage of the cyclone life cycle is shown?
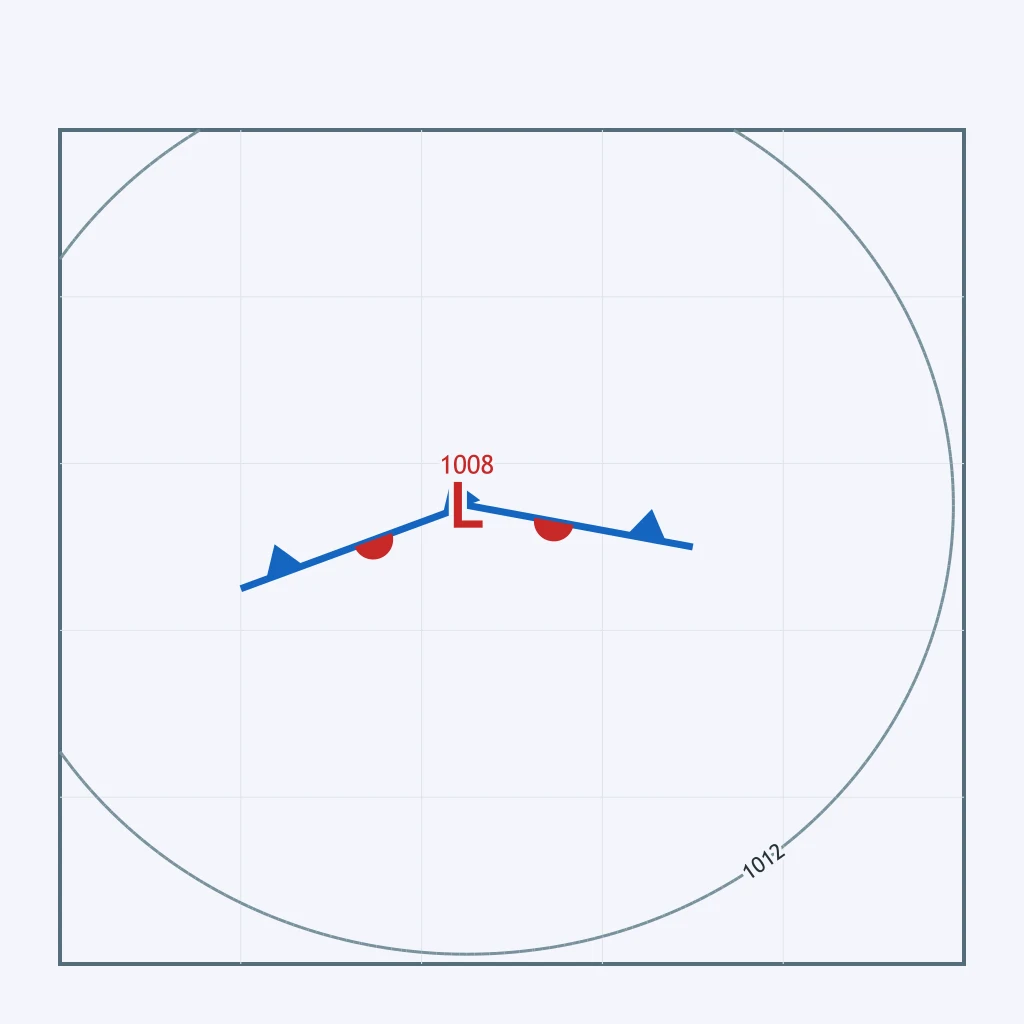
How does the structure of a mid-latitude cyclone in its mature open-wave stage differ from an occluded cyclone?
Mid-latitude cyclones in North America are generally steered from west to east by which persistent upper-level wind belt?
The map plots a low-pressure center near the map's northwest corner with isobars encircling it. Given that the prevailing westerlies steer mid-latitude systems, toward which direction will this low most likely track?
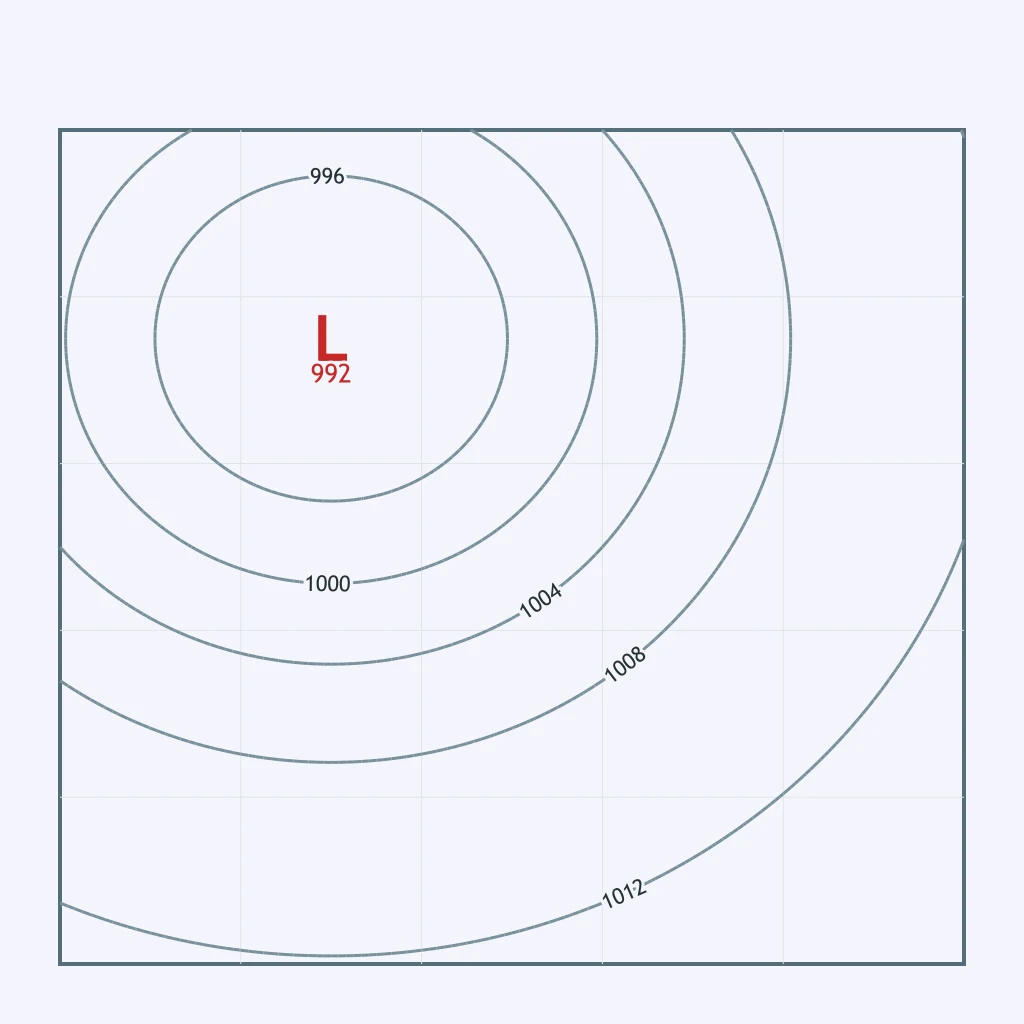
Meteorologists plot a cyclone's center over Kansas City on day one, over Chicago on day two, and over Detroit on day three. Which general direction does that three-day track show?
A deep upper-level trough in the jet stream dips unusually far south over the Great Plains. What effect does this have on the track of a surface cyclone moving through that region?
Crack the passcode before the zombies get in.
Answer, then swat bugs for bonus points.
Race through questions at your own speed.
Same question on every screen. Fastest wins.

Pick a tile, answer, hit bonuses and steals.
30 questions