Loading
by BlastRoom
Students use P-S arrival times, travel-time curves, and station circles to locate earthquake epicenters.
#earth_space_science

40 questions
One question set, multiple game modes. Tap any game to see it in action. Not sure which to pick?
Answer to place stones and capture territory.
Outrun the snow together.
Earn blasts, then hunt the other team.
Answer to earn energy, then climb.

The class blasts through walls together.
Bid on mystery lots. Most money wins.
Sell tours. Nice, standard, or a total scam.

Answer, restock, and serve the rush.
More correct answers pulls the rope your way.
Answer, then shoot down the alien wave.
Answer, then tap to leap the frozen ridge.
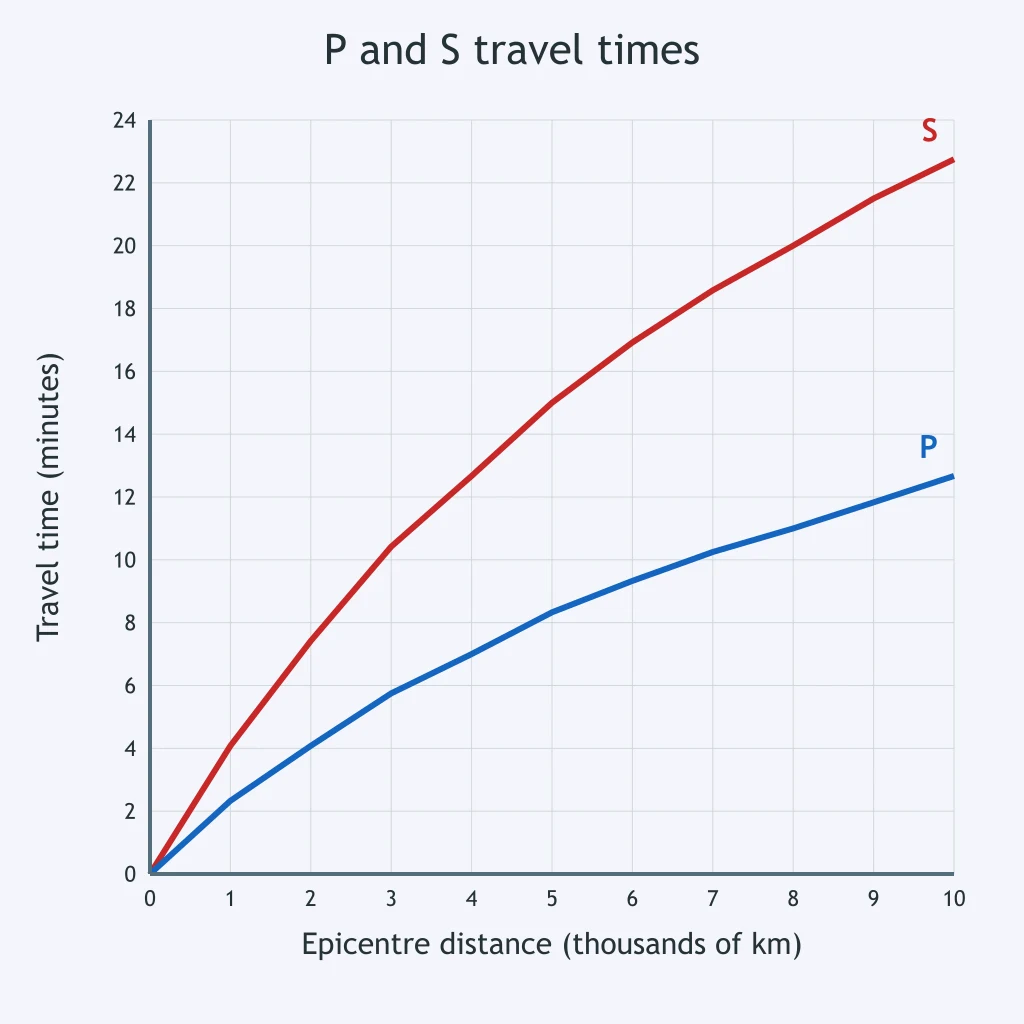
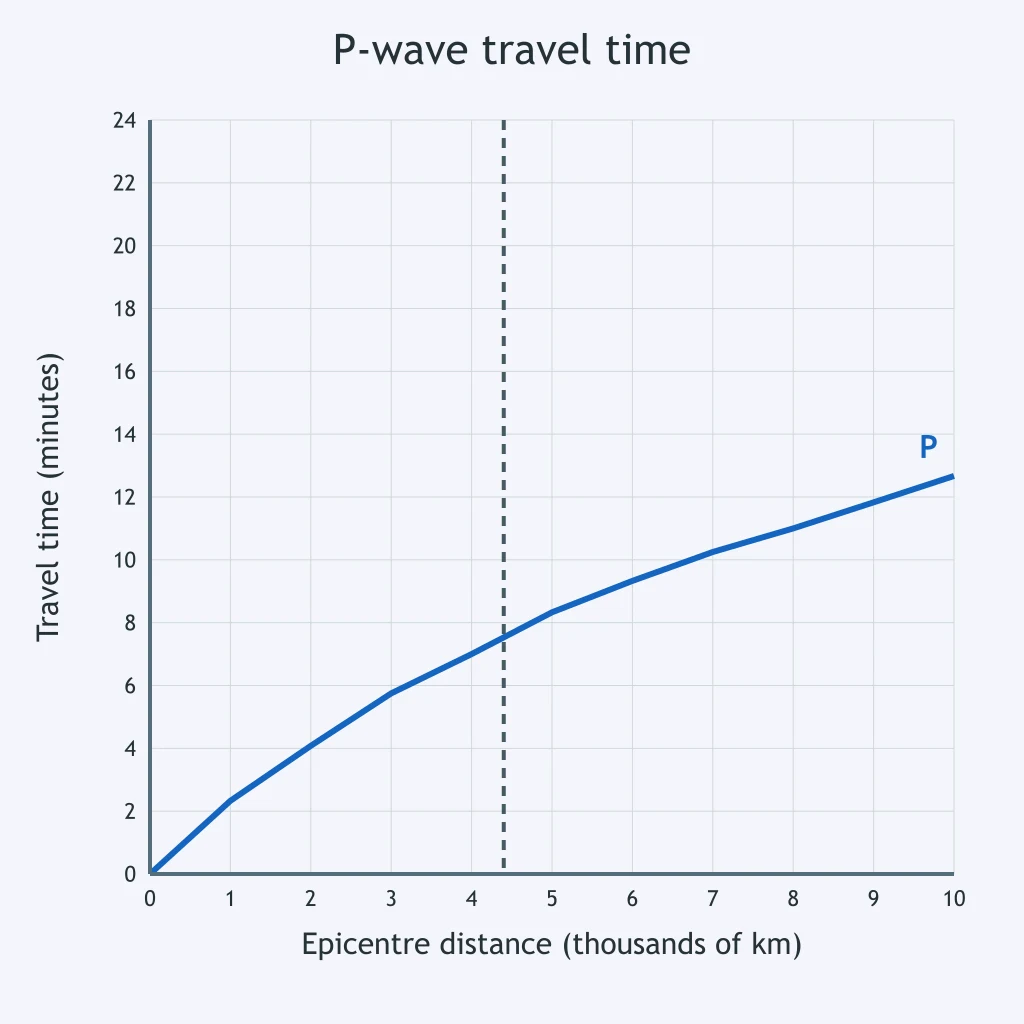
Station A's P wave arrives at 08:14:00 and its S wave at 08:15:30. Using the travel-time graph, how far is Station A from the epicenter?
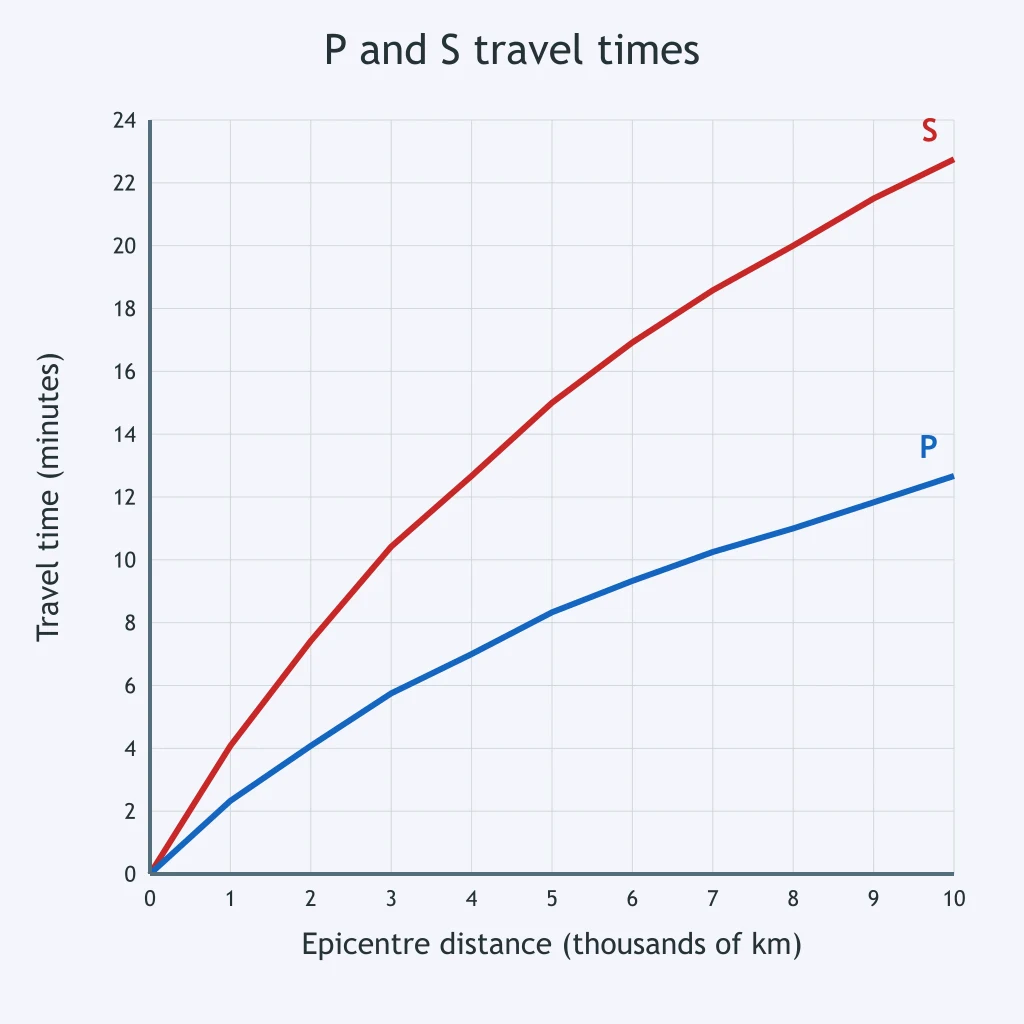
At Station B, the first P arrival is 10:05:20 and the first S arrival is 10:07:34. Use the travel-time graph to find the epicenter distance.
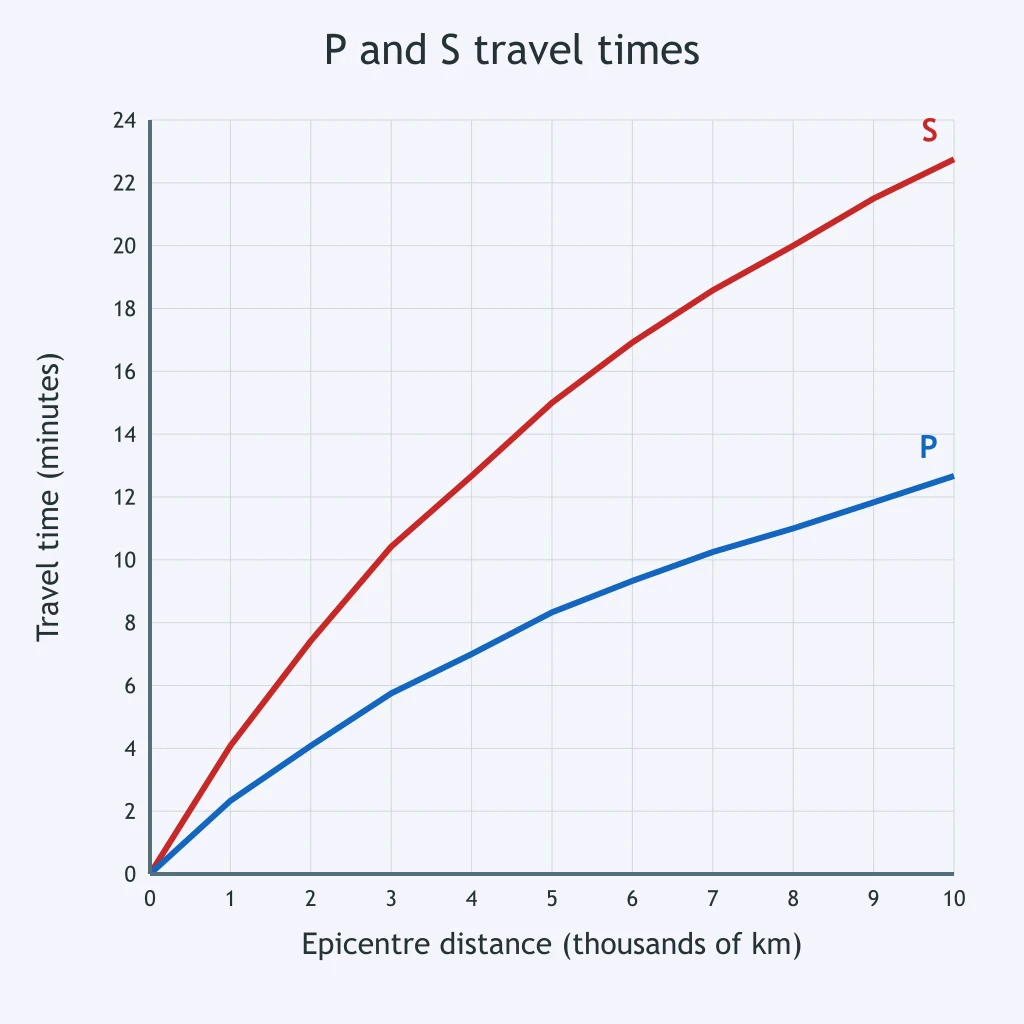
Station C records P at 01:12:00 and S at 01:14:46. According to the travel-time graph, what is Station C's distance from the epicenter?
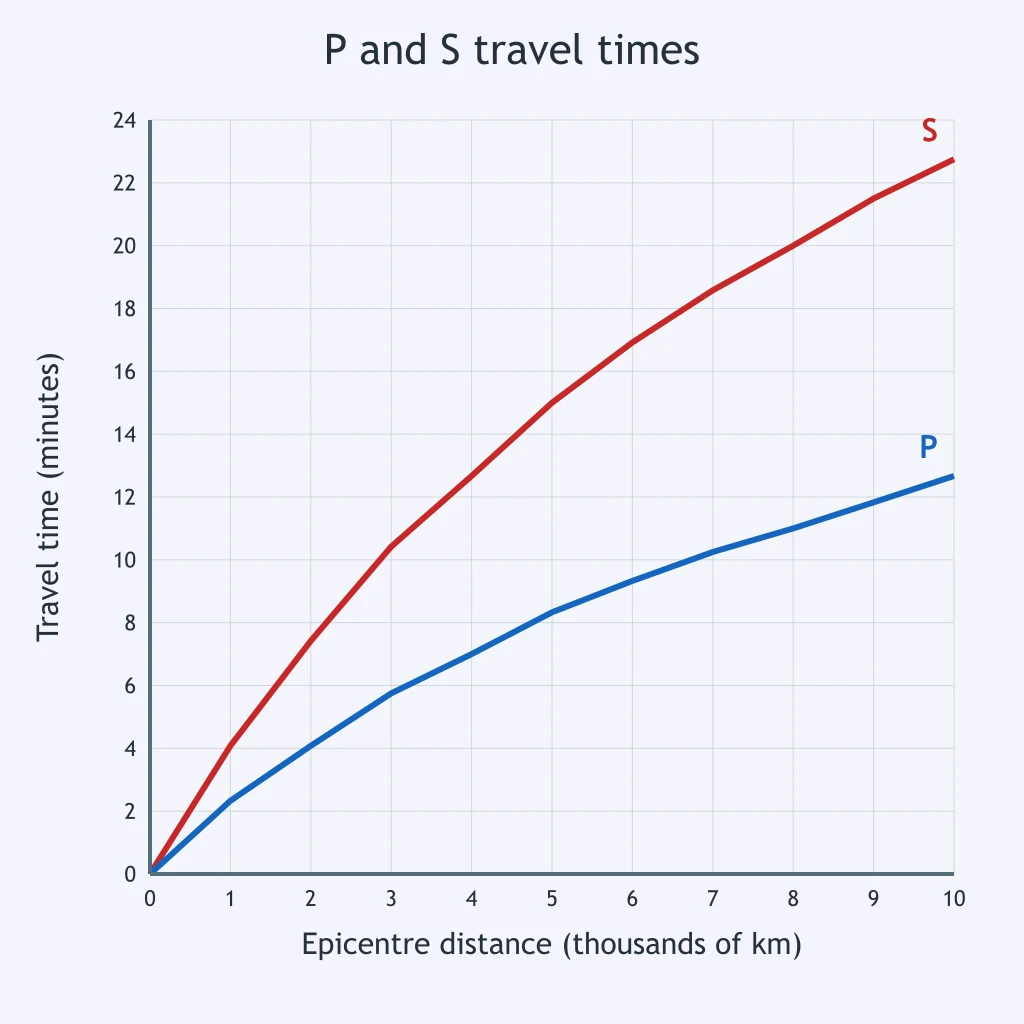
Station D's seismogram gives a P arrival of 14:22:10 and an S arrival of 14:25:31. Use the graph to estimate the epicenter distance.
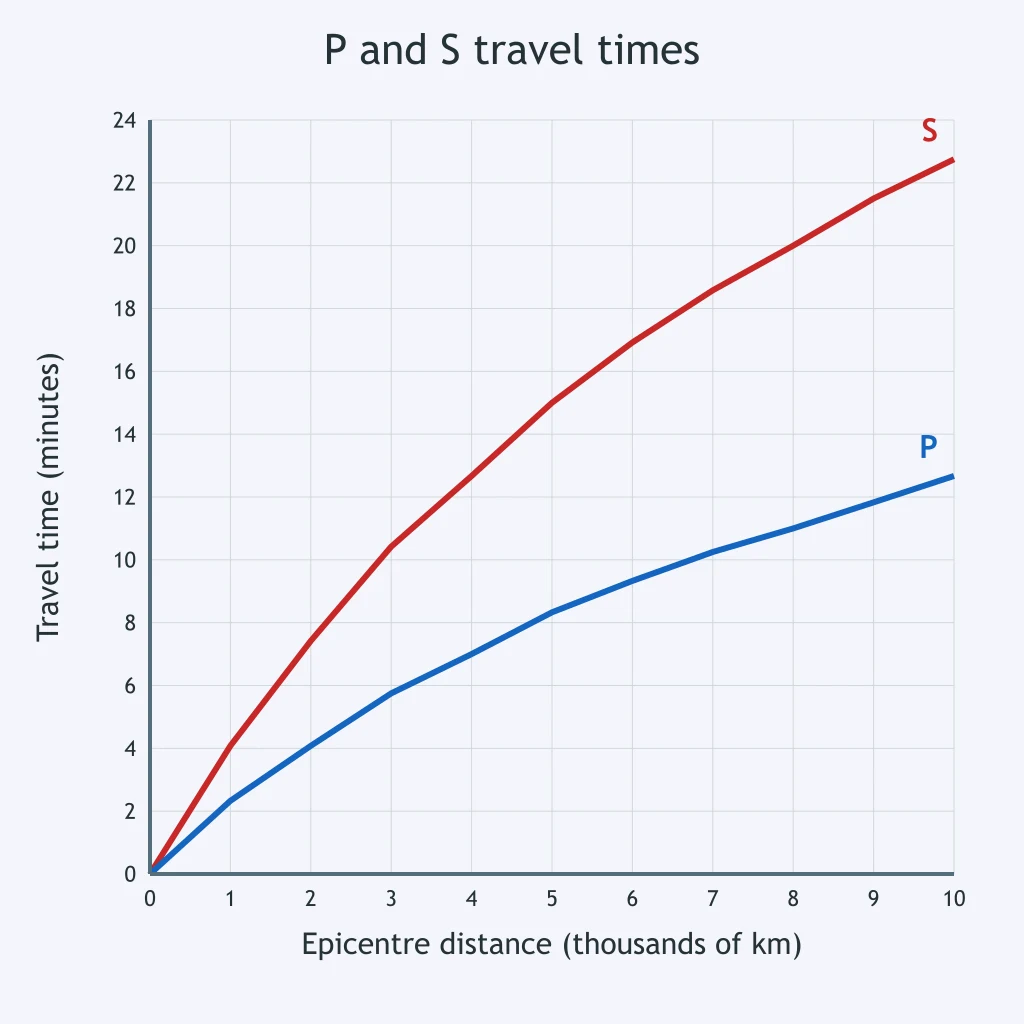
A station records the P wave at 19:00:00 and the S wave at 19:04:02. What epicenter distance is indicated by the travel-time graph?
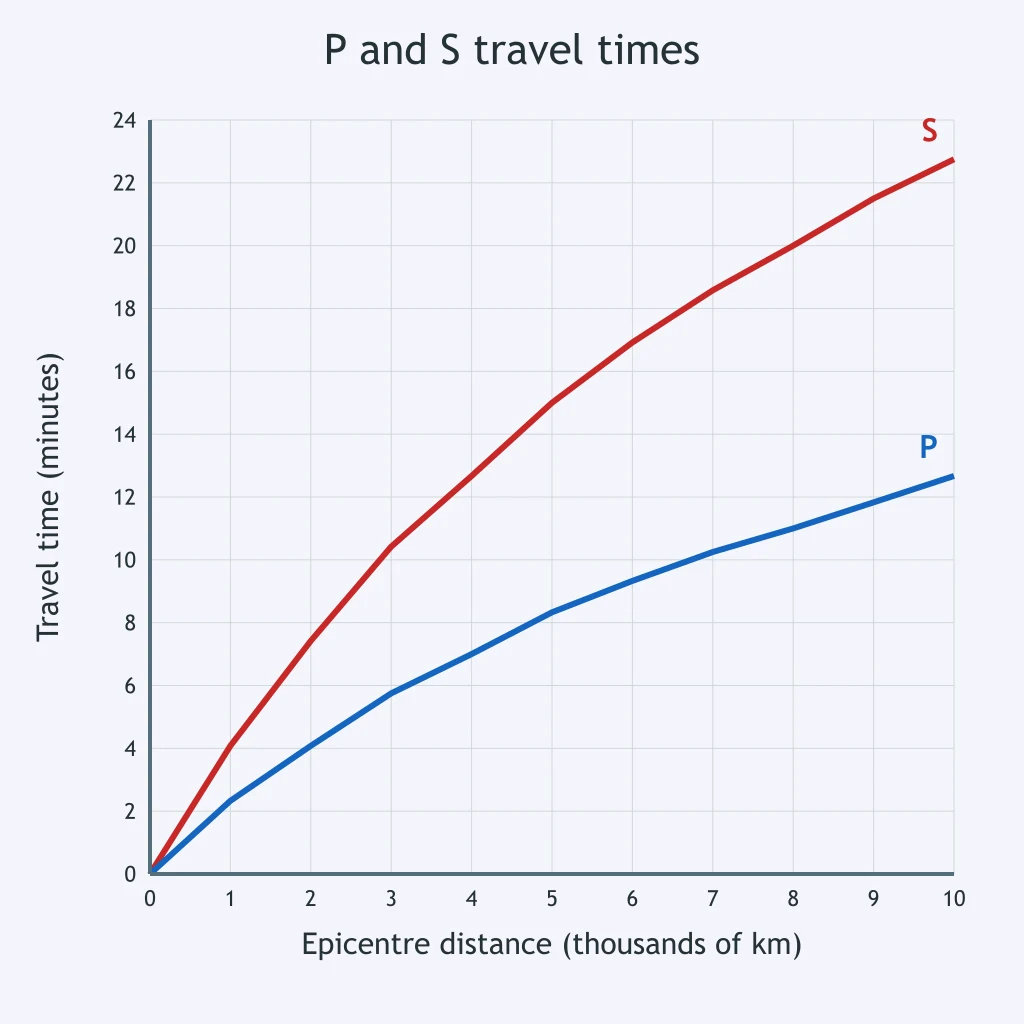
Station F records first P motion at 06:33:30 and first S motion at 06:37:53. Use the travel-time graph to estimate its distance from the epicenter.
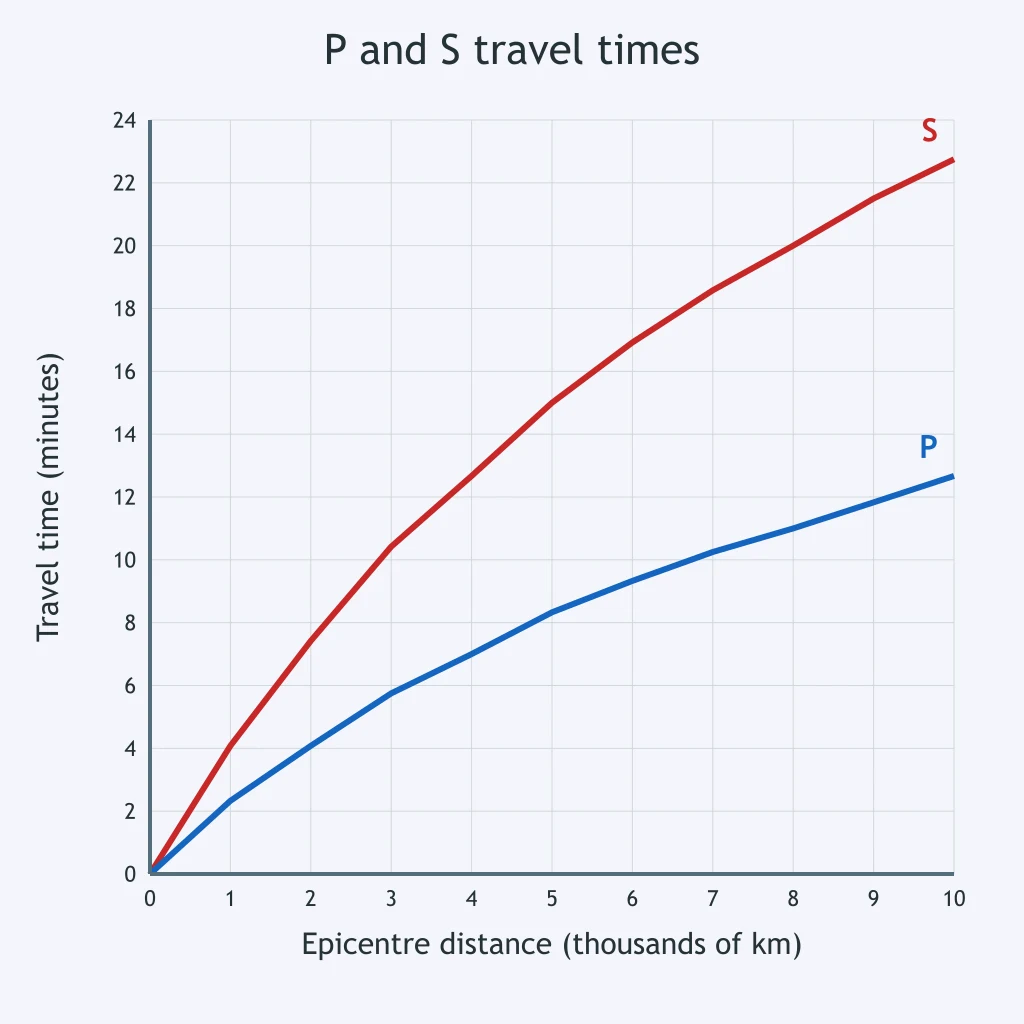
At Station G, P arrives at 11:48:15 and S arrives at 11:53:12. What distance should be used as the station-circle radius?
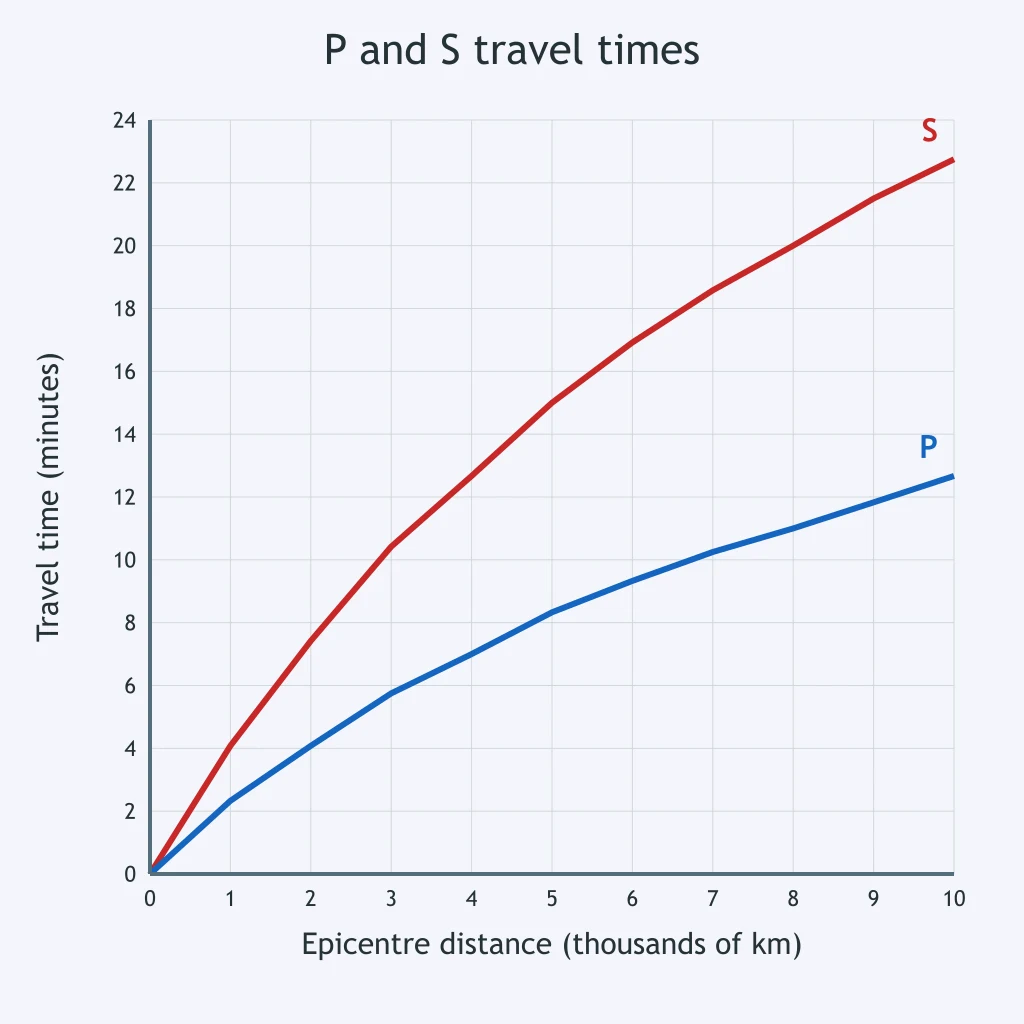
A seismogram shows P at 23:10:00 and S at 23:15:31. Use the travel-time graph to choose the epicenter distance.
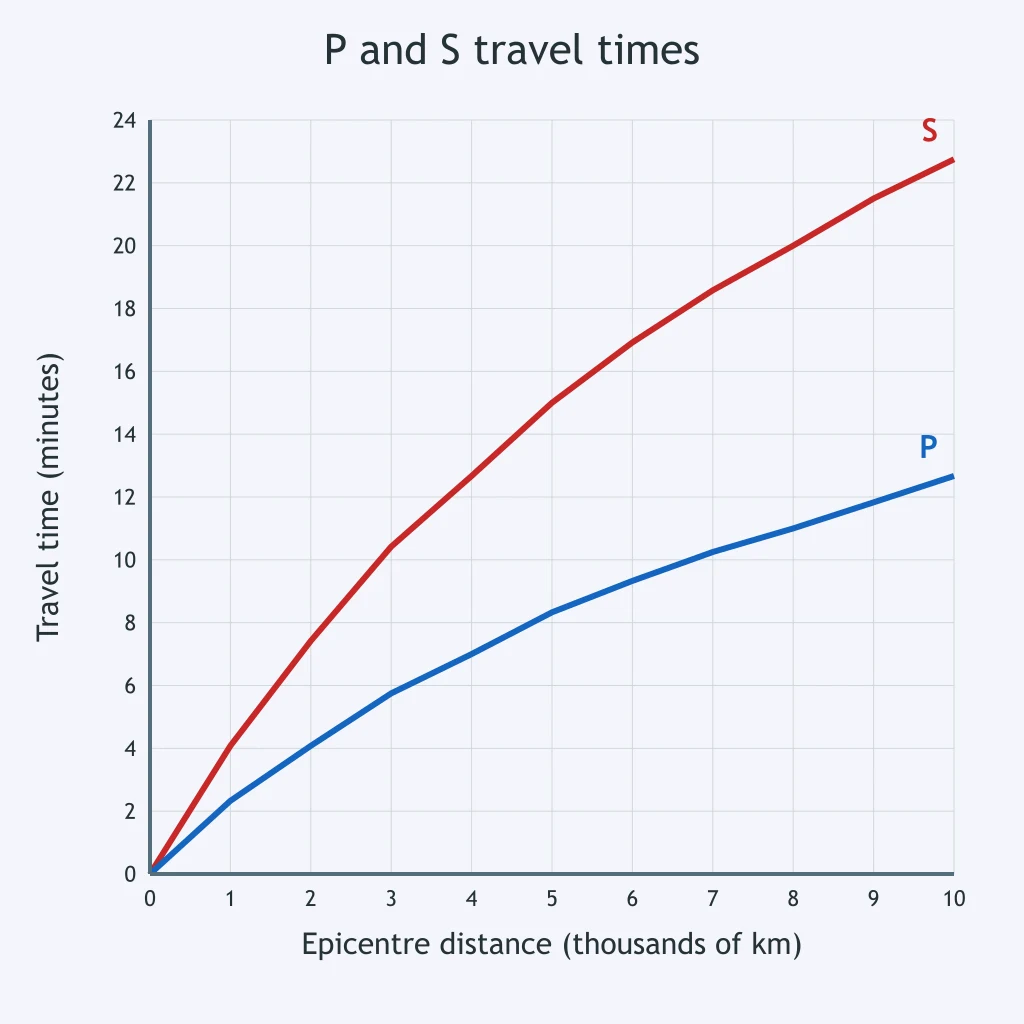
Station J records a P arrival at 04:08:40 and an S arrival at 04:14:44. What is the approximate epicenter distance?
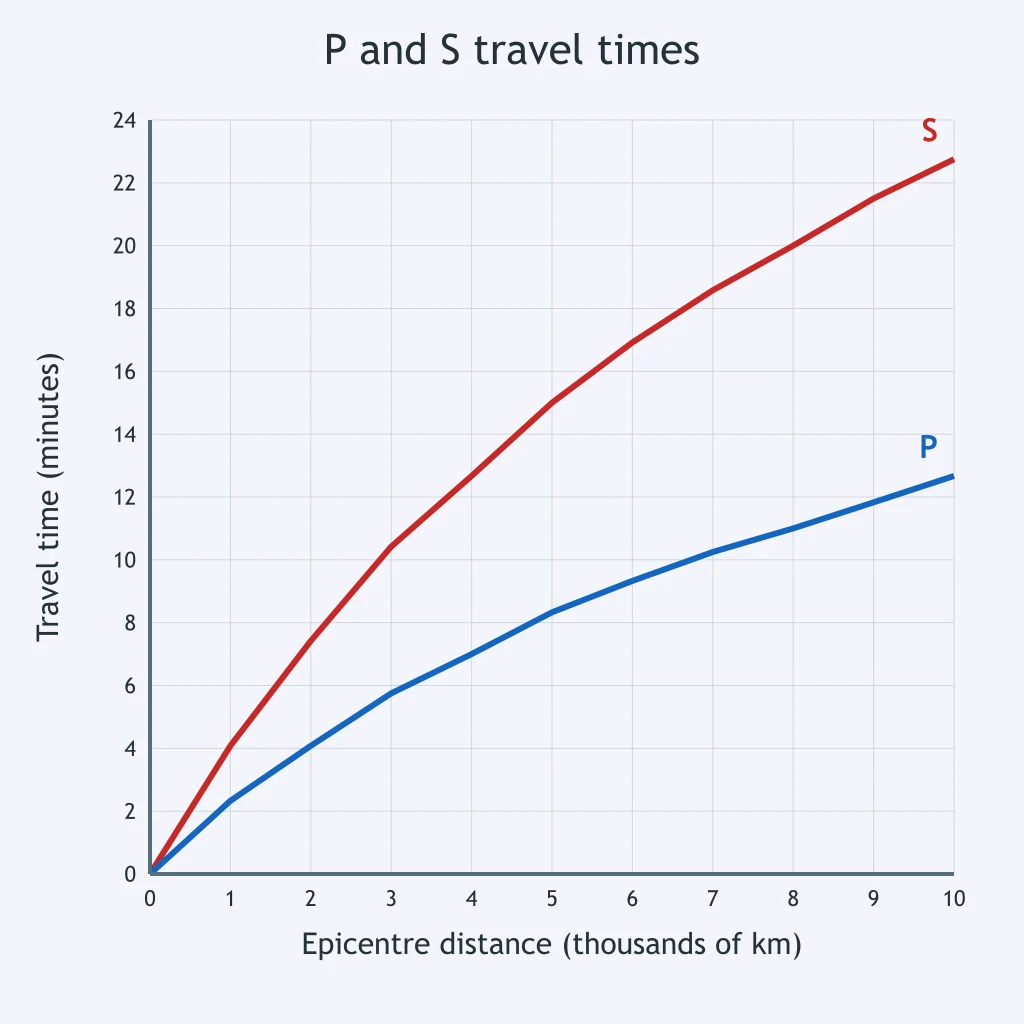
A station's P wave arrives at 17:26:00 and its S wave at 17:32:37. According to the graph, how far is the station from the epicenter?
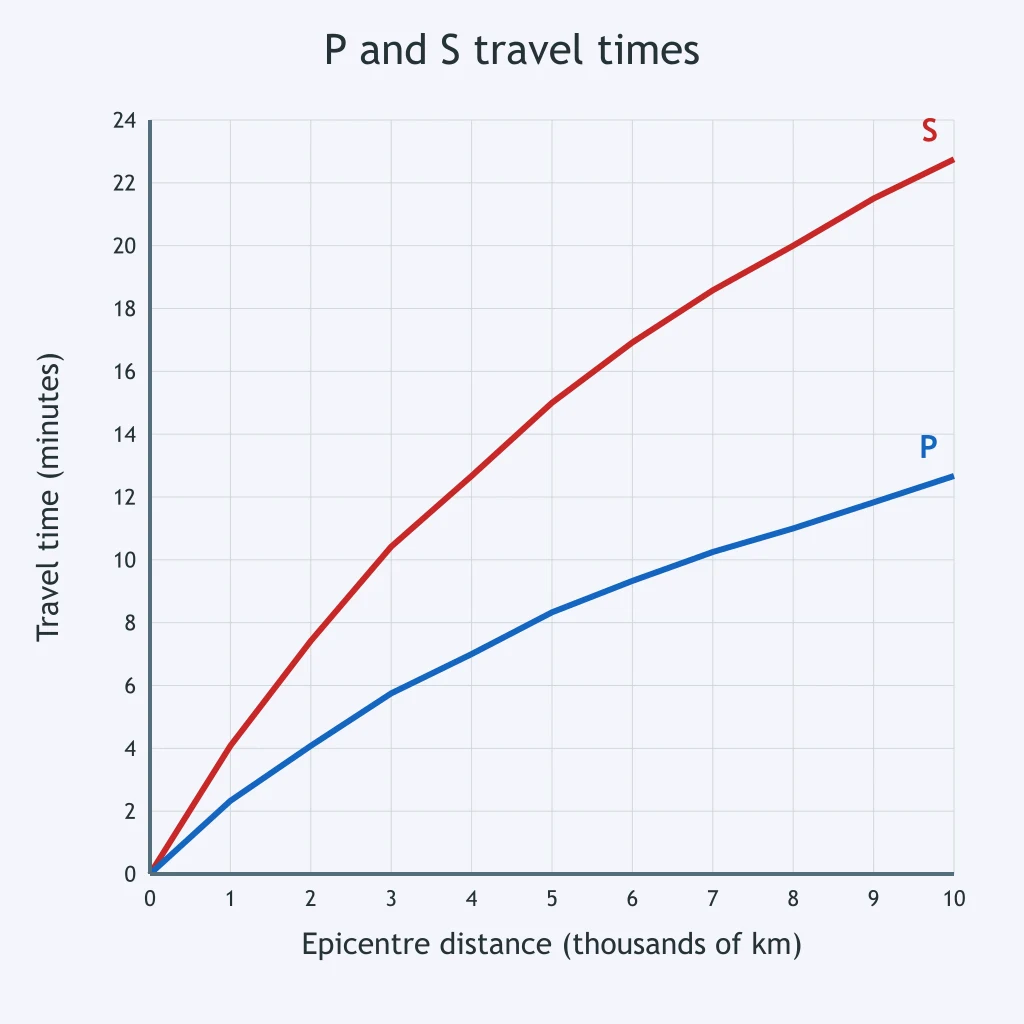
Station L records P at 12:00:30 and S at 12:07:40. Use the graph to estimate the distance from Station L to the epicenter.
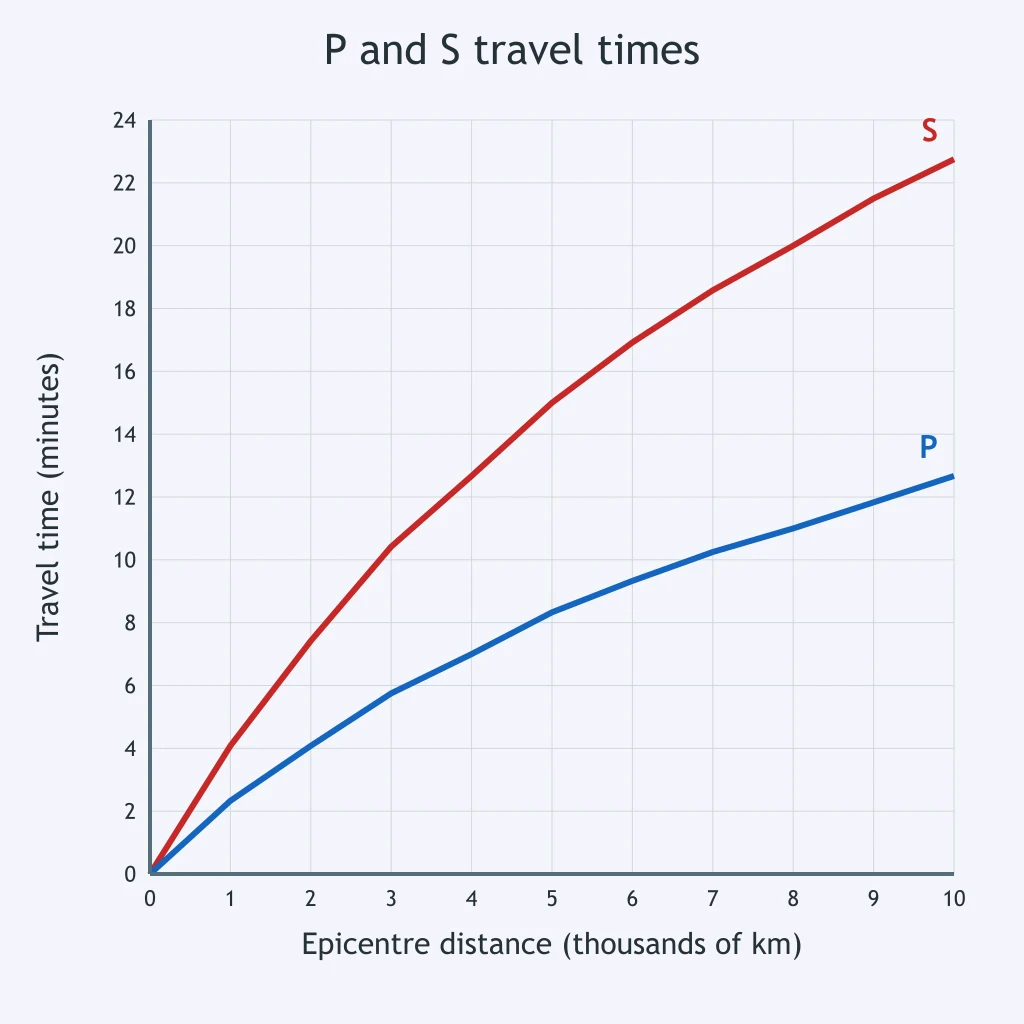
Station M records the first P wave at 05:44:00 and the first S wave at 05:47:44. What distance does the travel-time graph indicate?
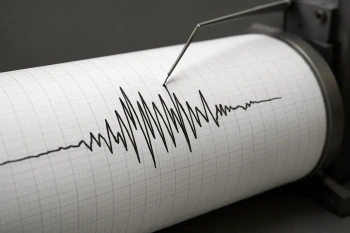
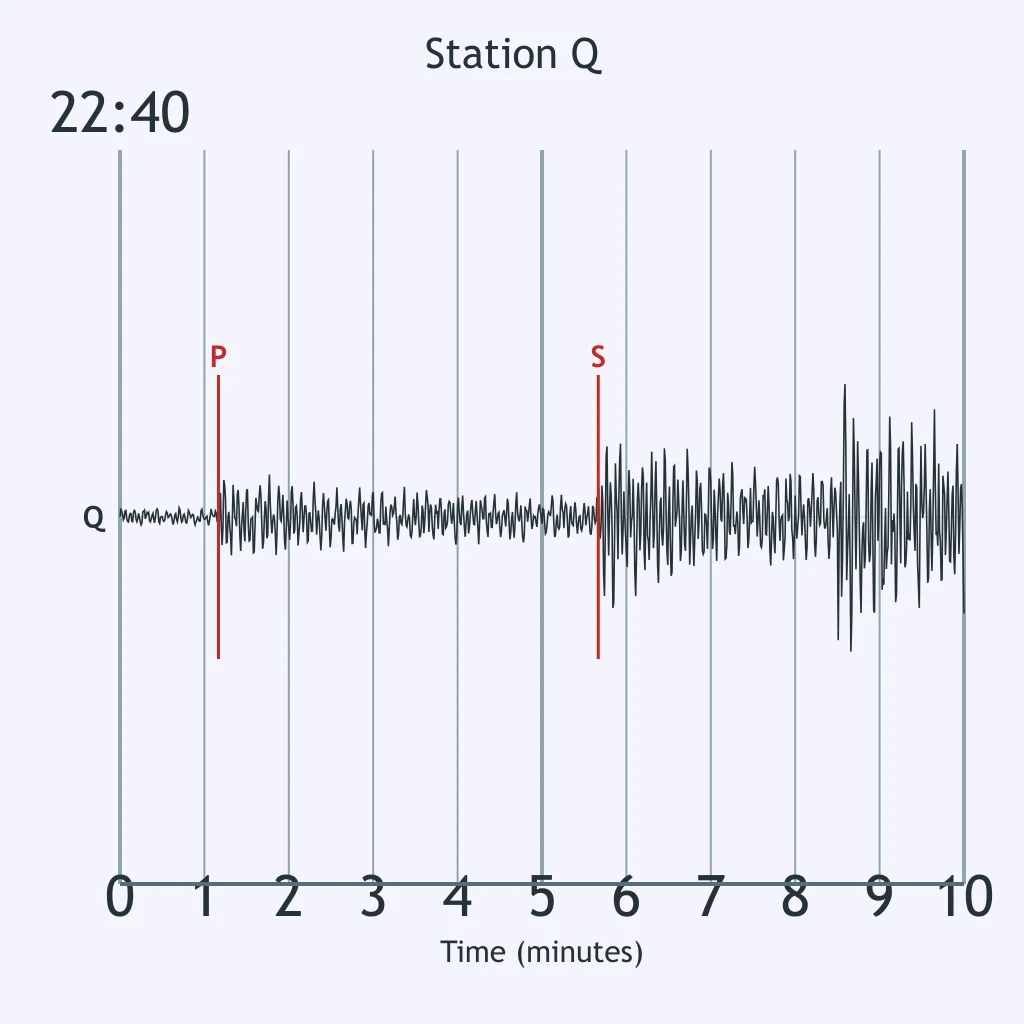
Read the Station Q seismogram. What is the P-S time difference between the first P arrival and the first S arrival?
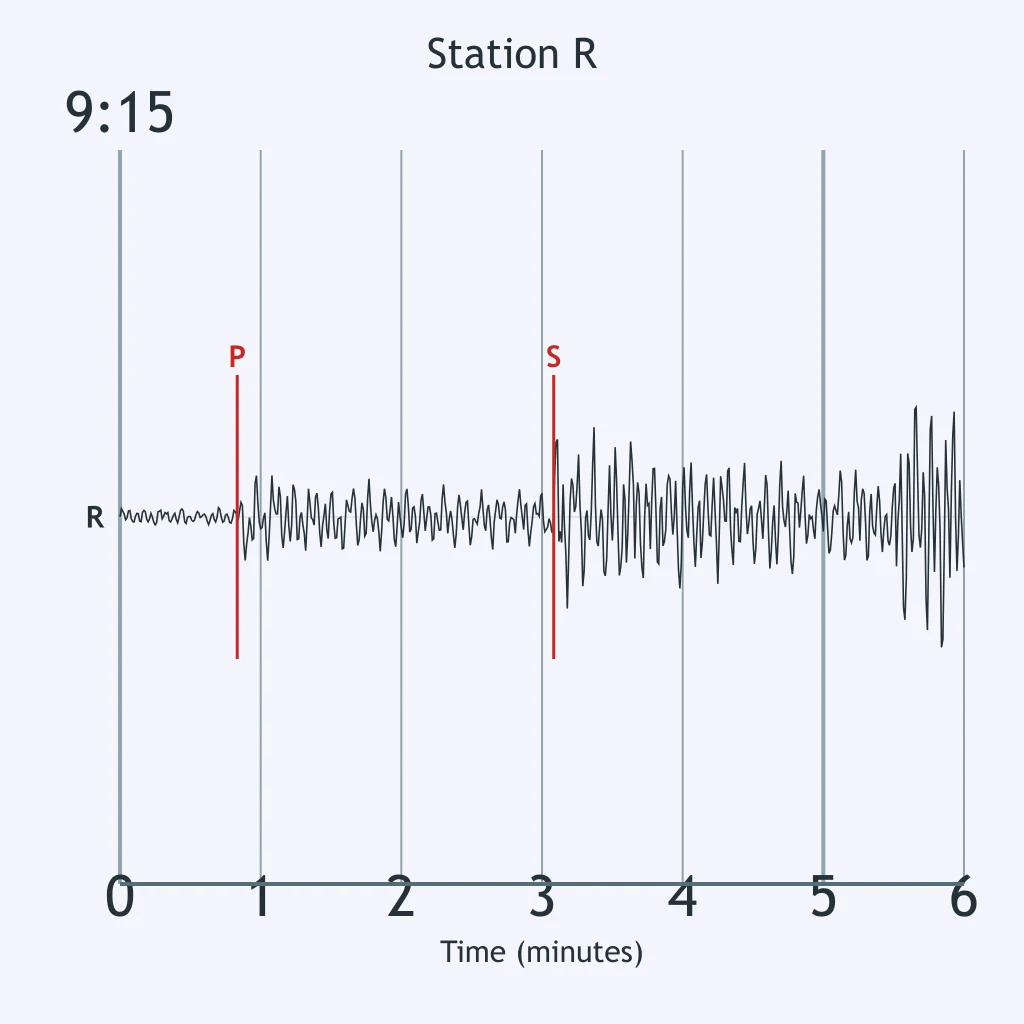
Use the Station R seismogram to read the time between the P and S arrivals.
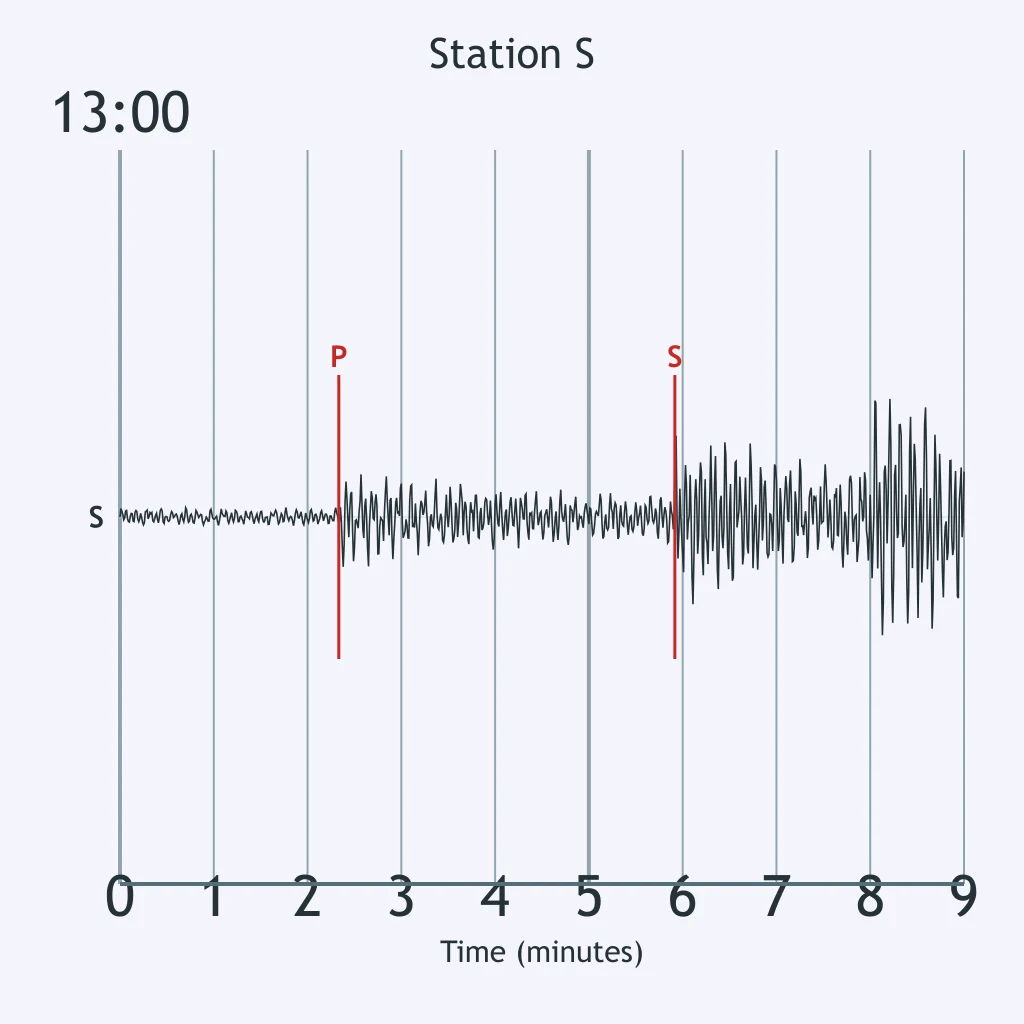
On the Station S trace, how much time separates the first P wave from the first S wave?
Read the Station T seismogram. What S-minus-P interval should be used with the travel-time graph?
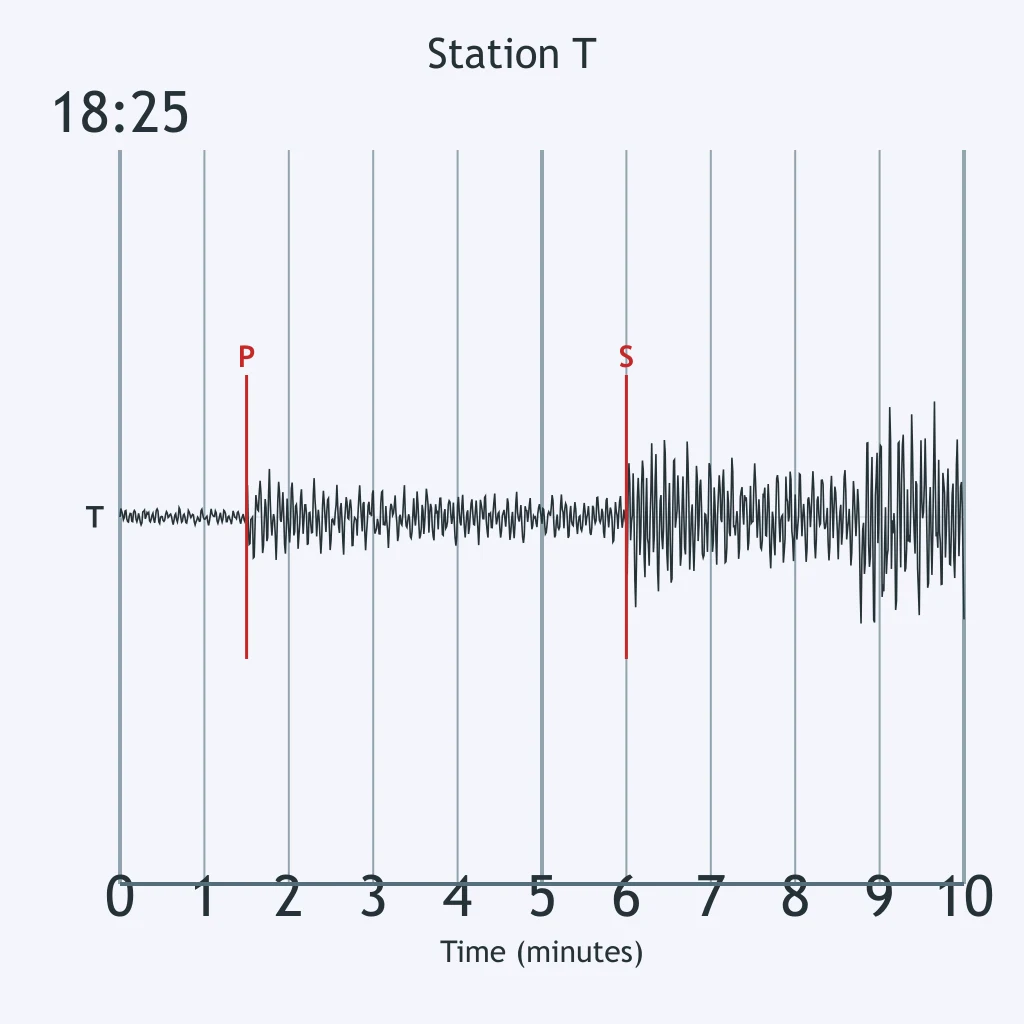
The Station U seismogram marks the first P and S arrivals. What is the P-S time difference?
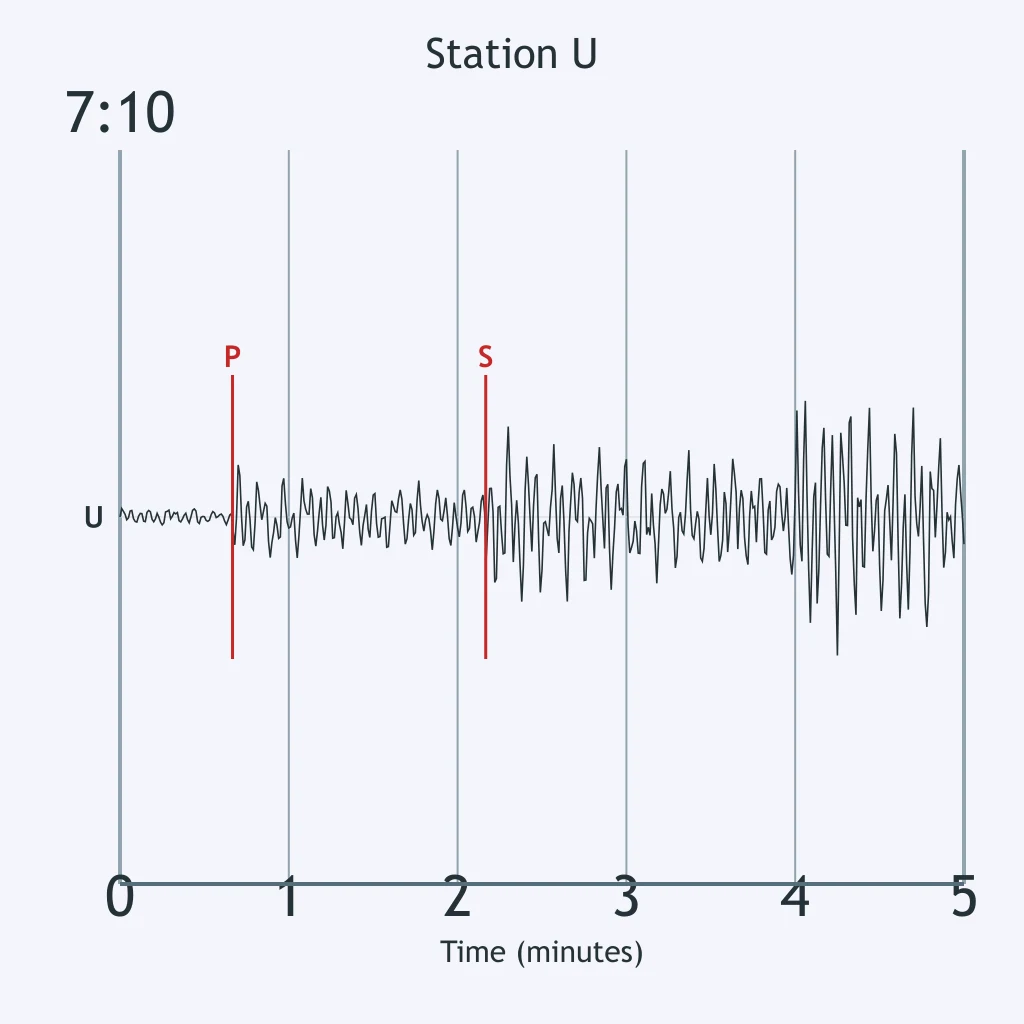
Use the Station V trace to measure the S-minus-P interval.
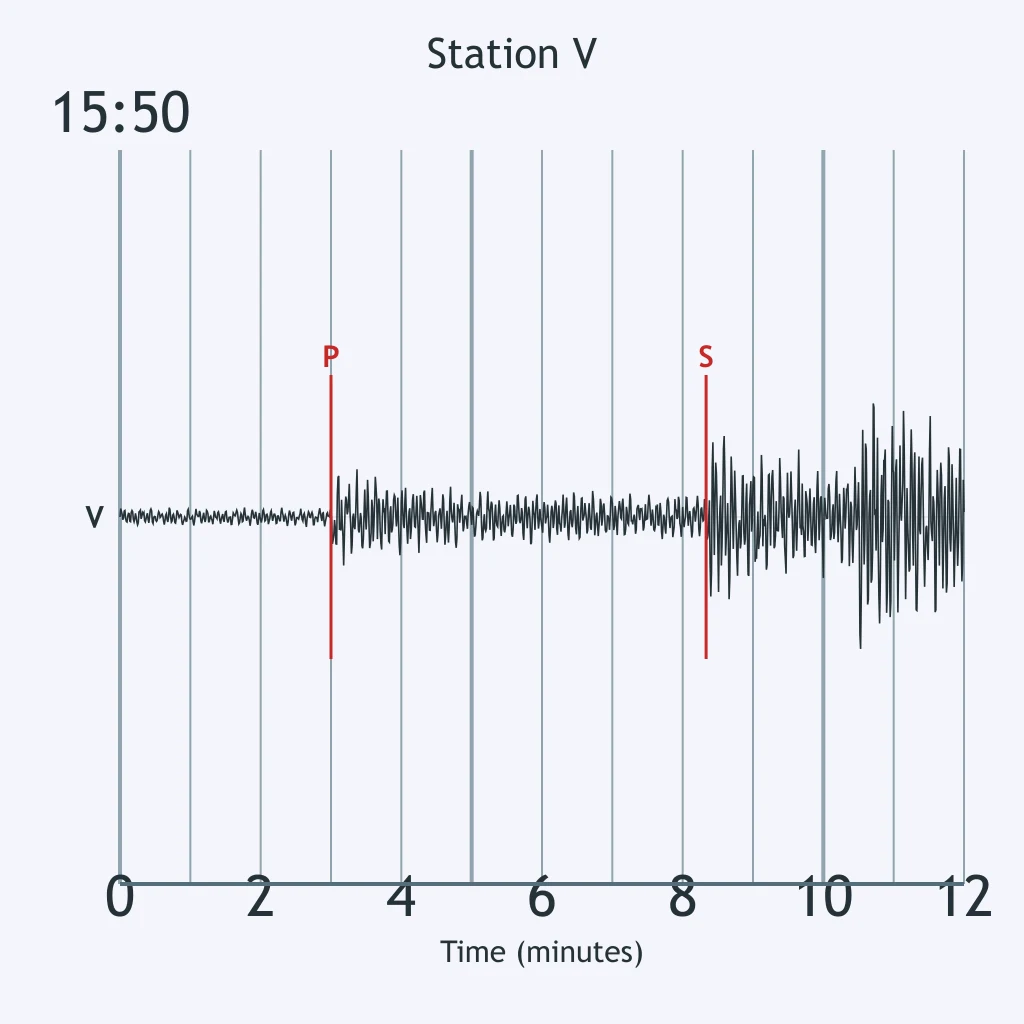
On the Station W seismogram, what time interval separates the P and S arrivals?
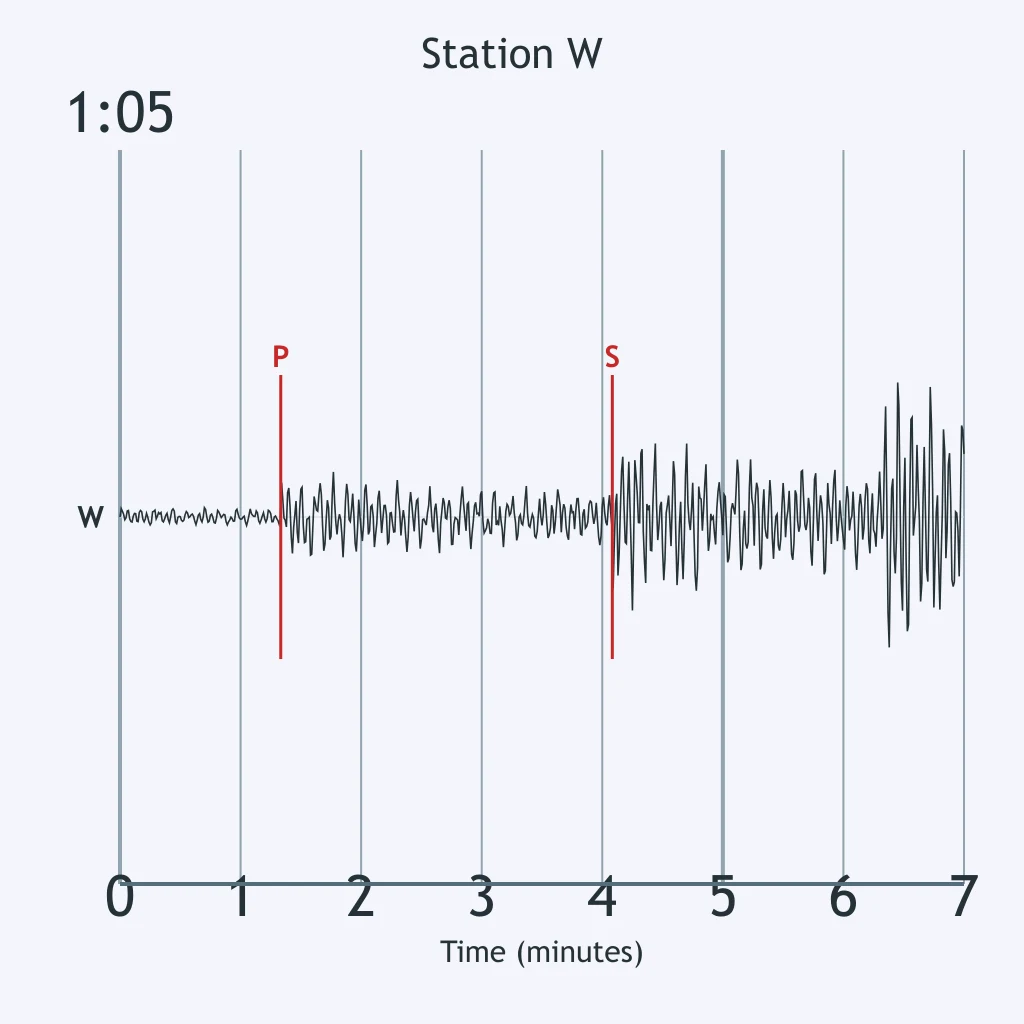
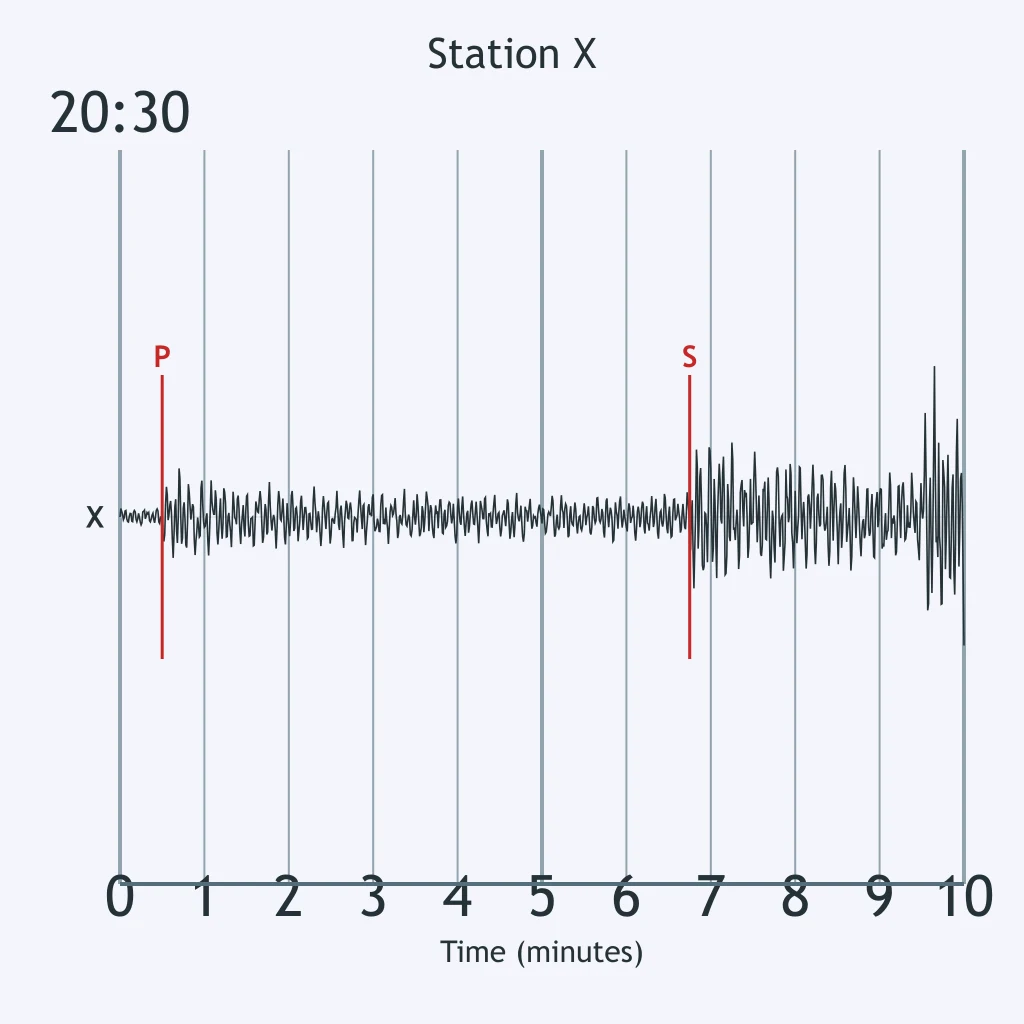
Read the Station X seismogram. What P-S interval would be converted to distance?
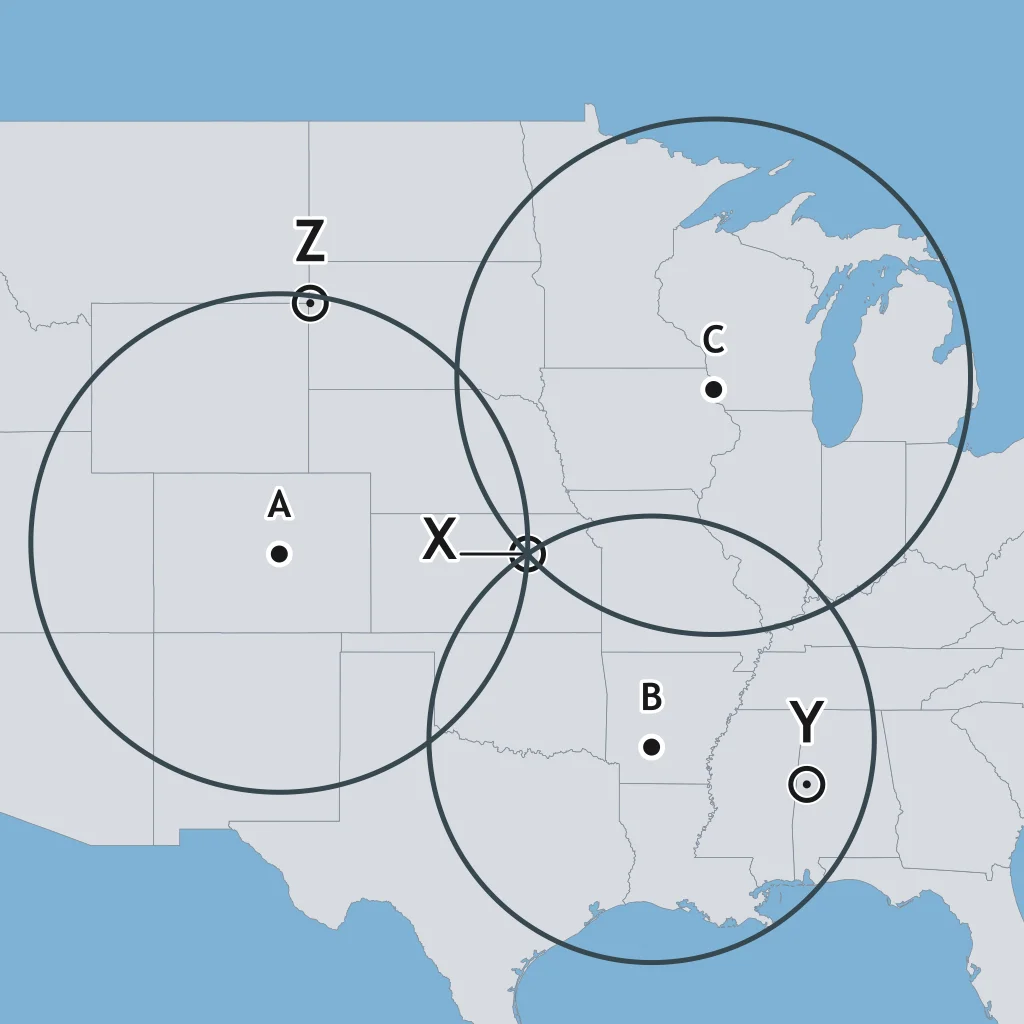
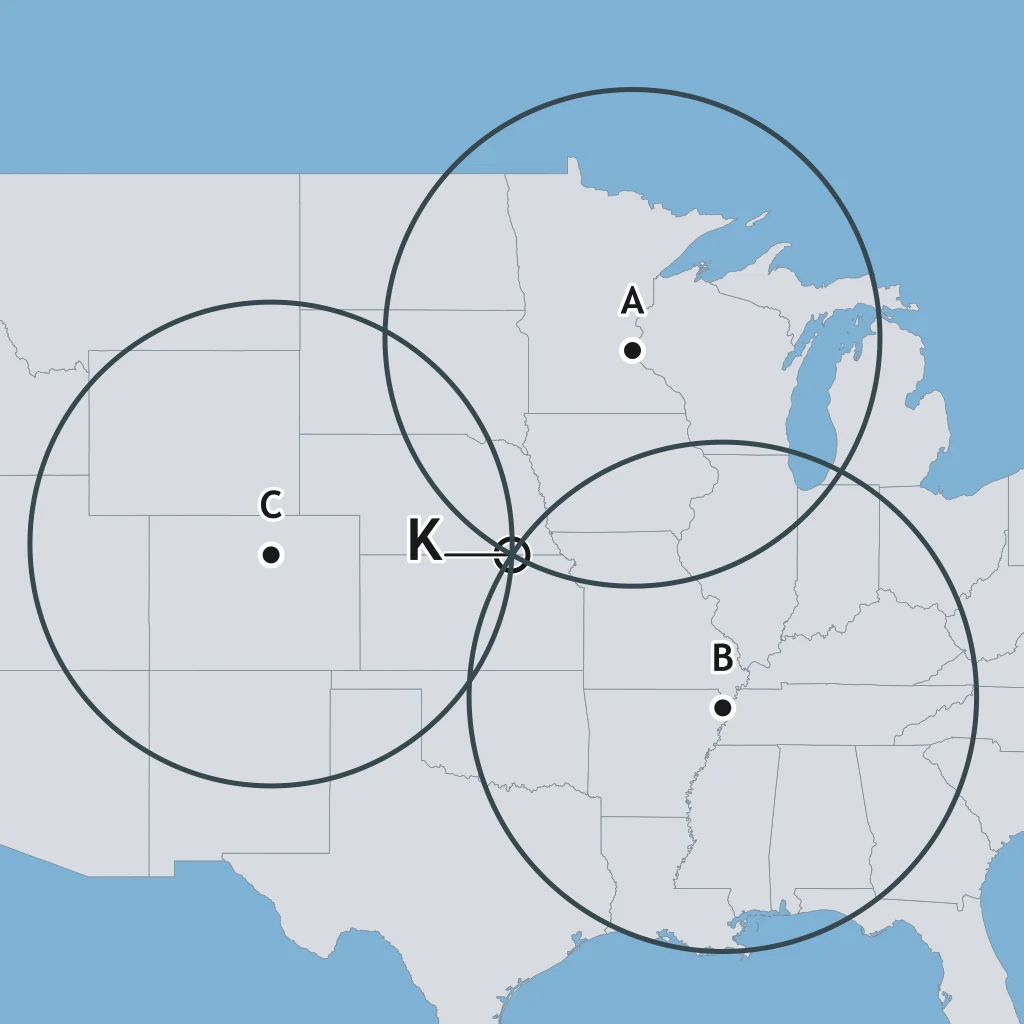
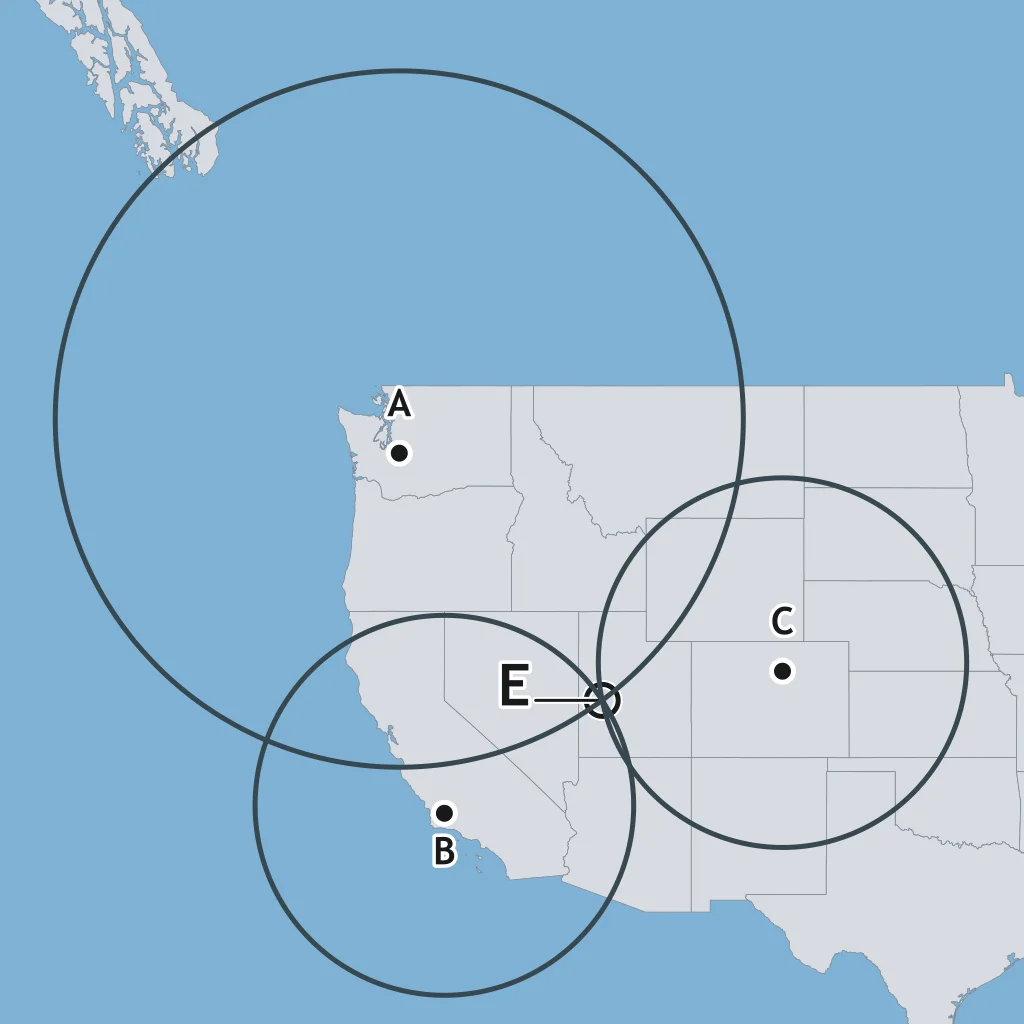
Use the map of three station distance circles. Which labeled point lies where all three circles intersect?
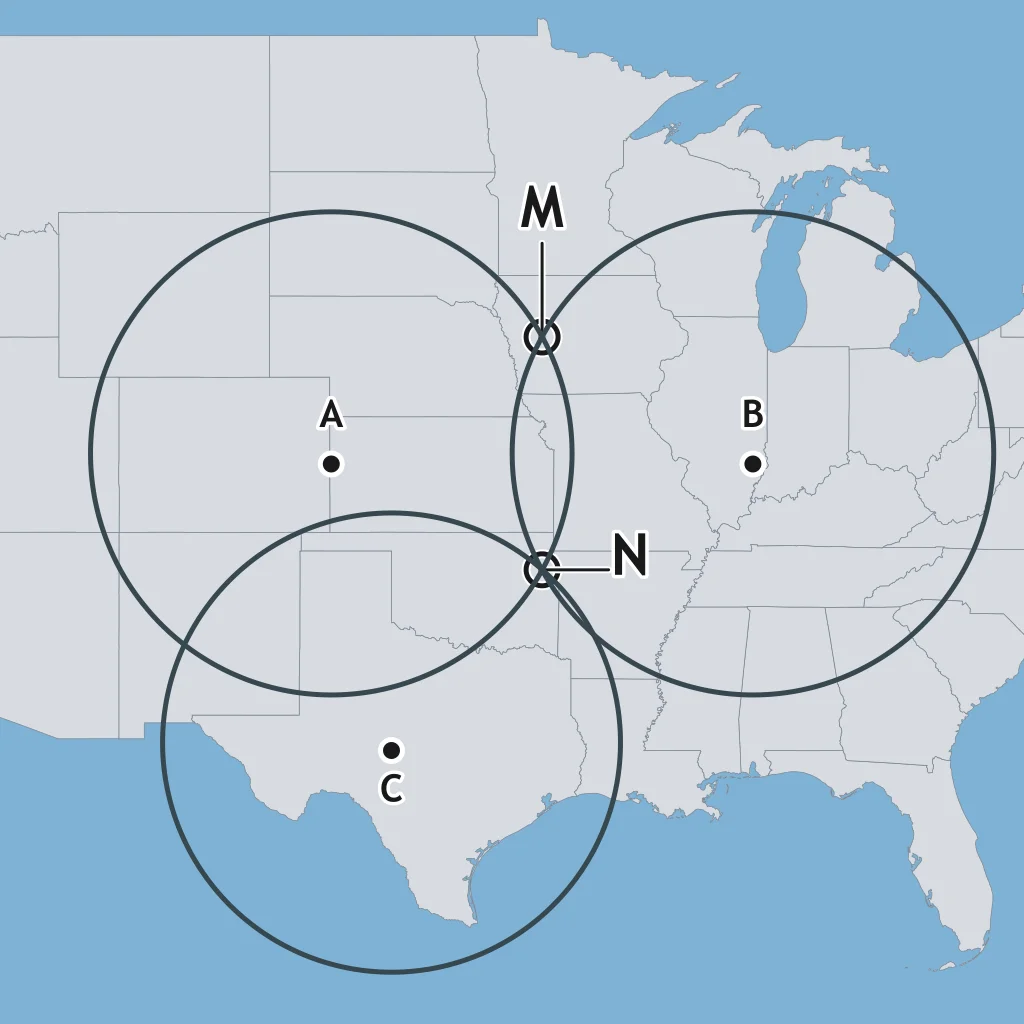
The map labels two possible crossings, M and N. Which point lies on all three station-distance circles?
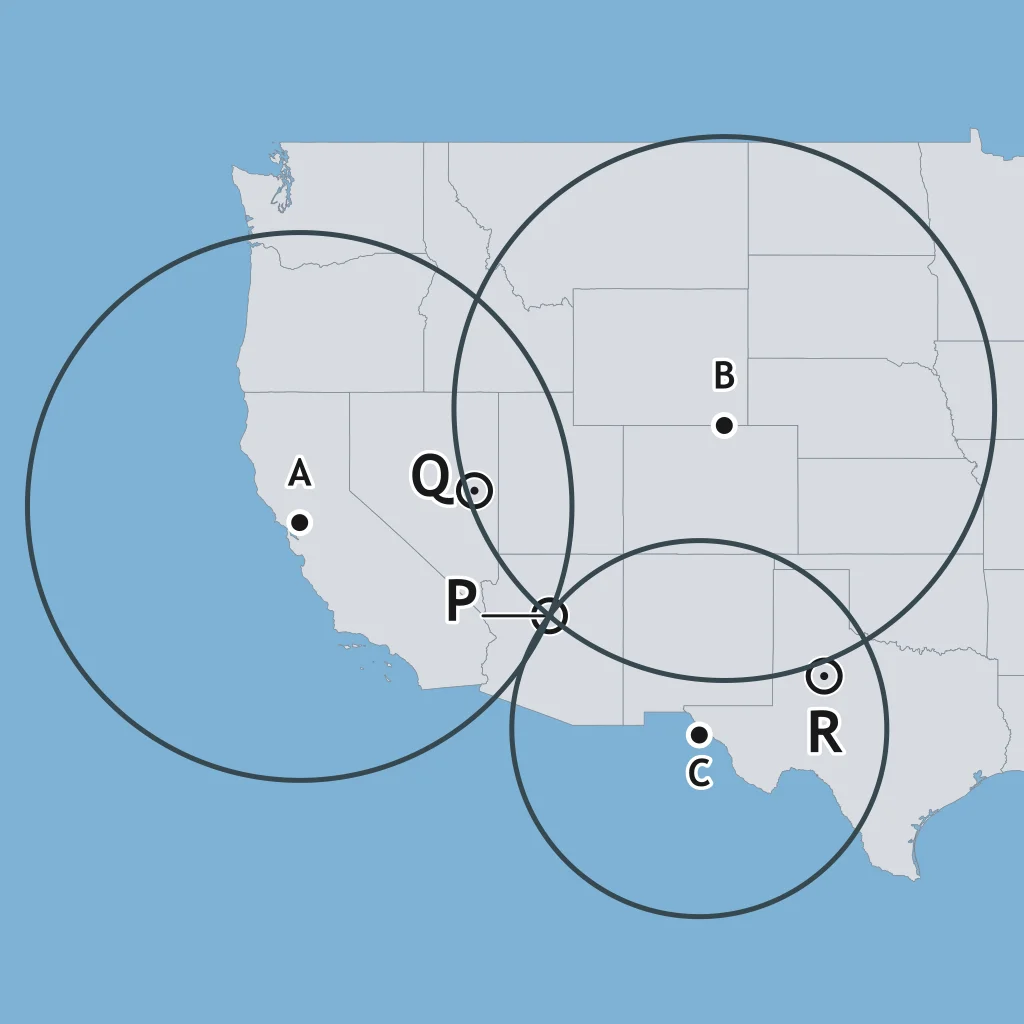
On the regional map, three distance circles are drawn from stations A, B, and C. Which labeled point marks the epicenter?
The map shows three station circles meeting at point K. What does point K locate?
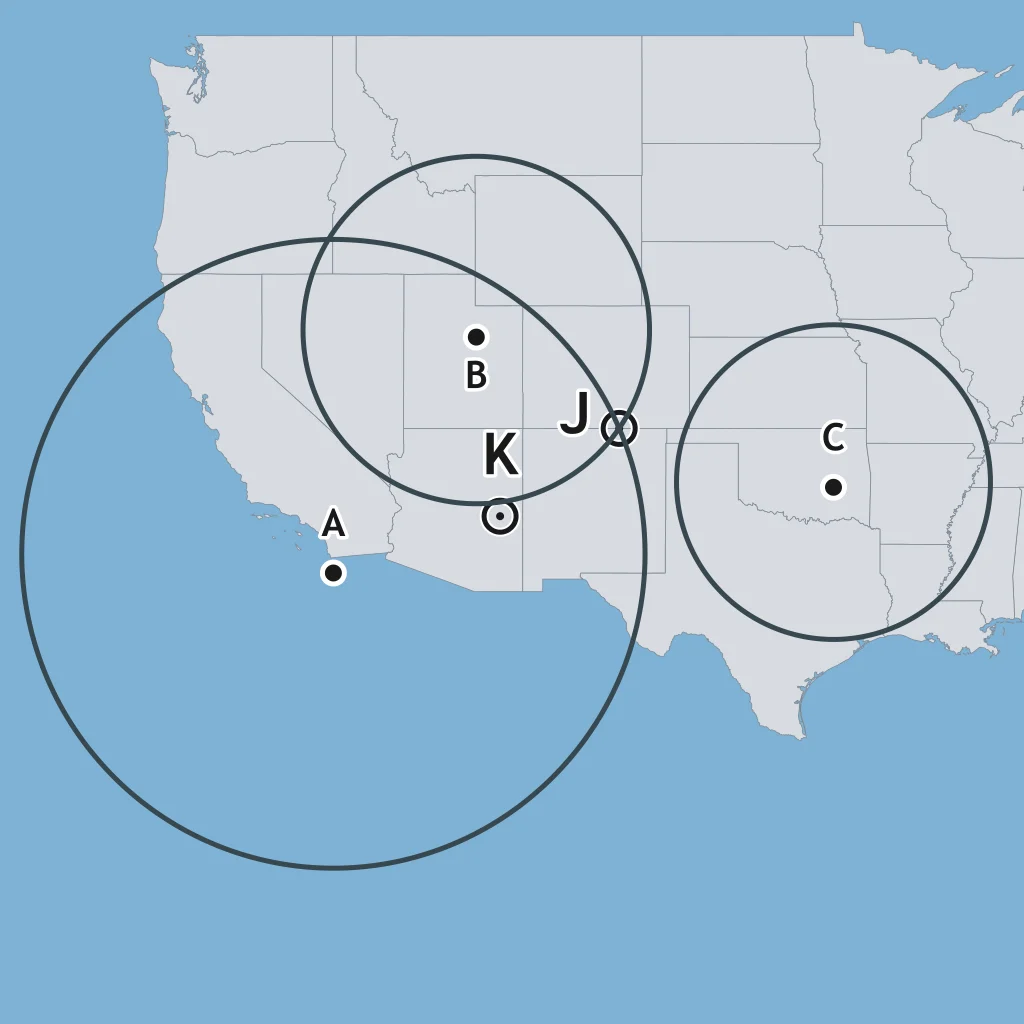
Point J is where two station circles cross, but it is outside the third station's circle. Why is J rejected as the epicenter?
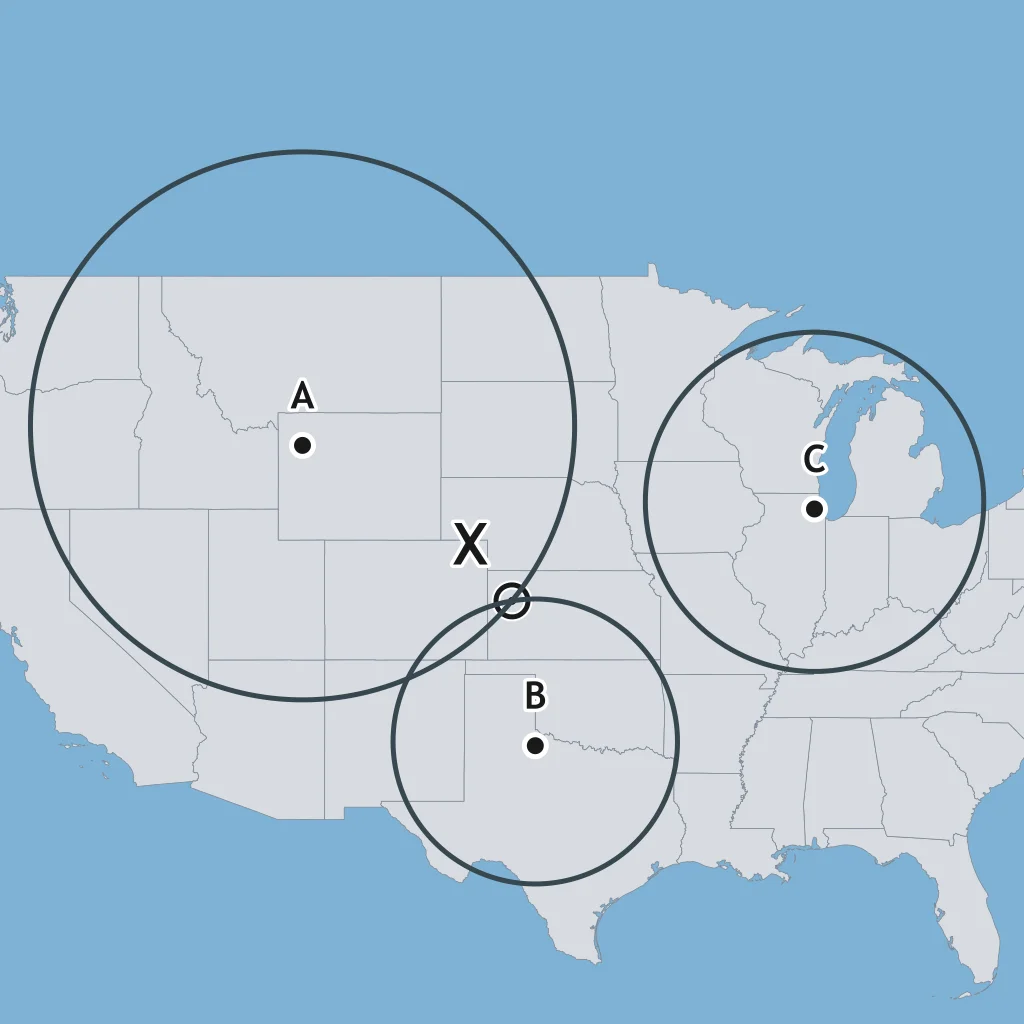
On the map, the circles from two stations meet at X. Which station's distance report does not fit that epicenter?
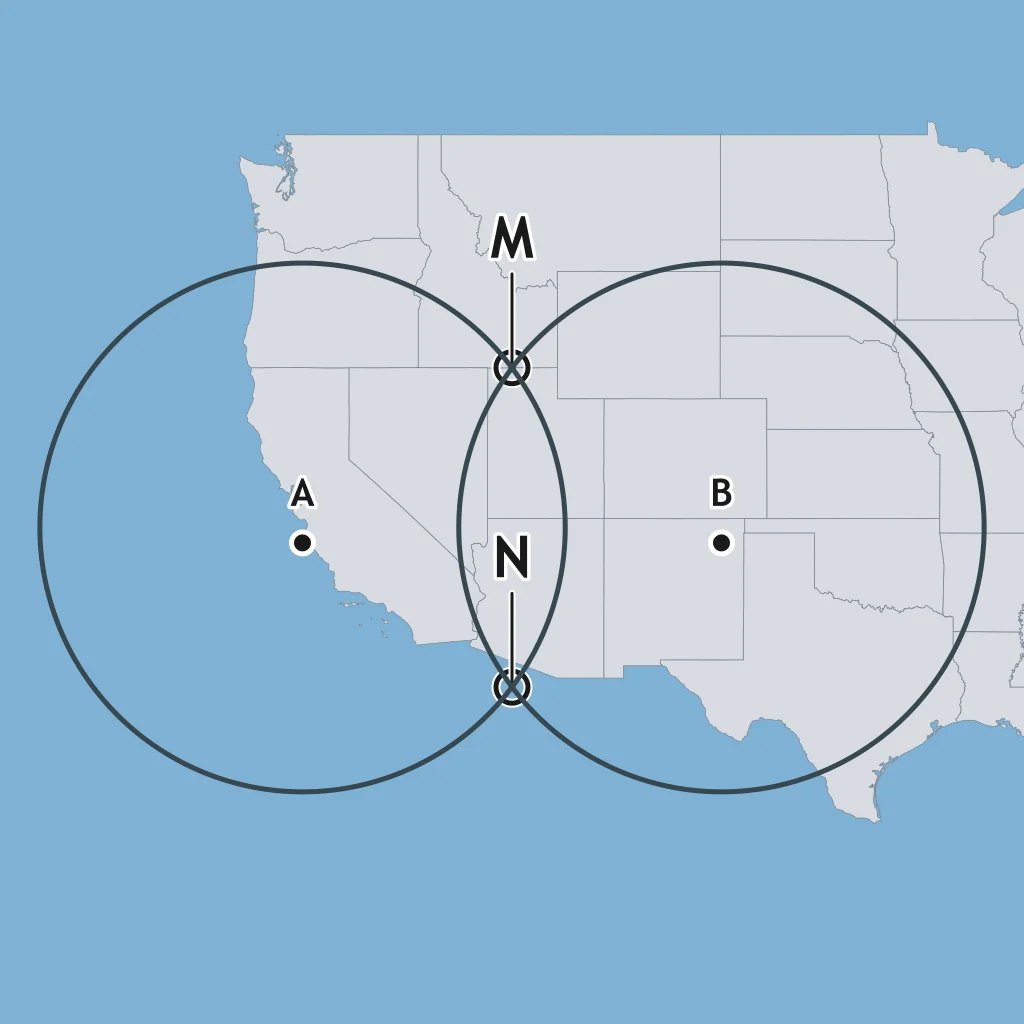
Two station circles on the map cross at M and N. Why is a third station needed before choosing the epicenter?
A correct three-station epicenter map should show what relationship among the three radius circles?
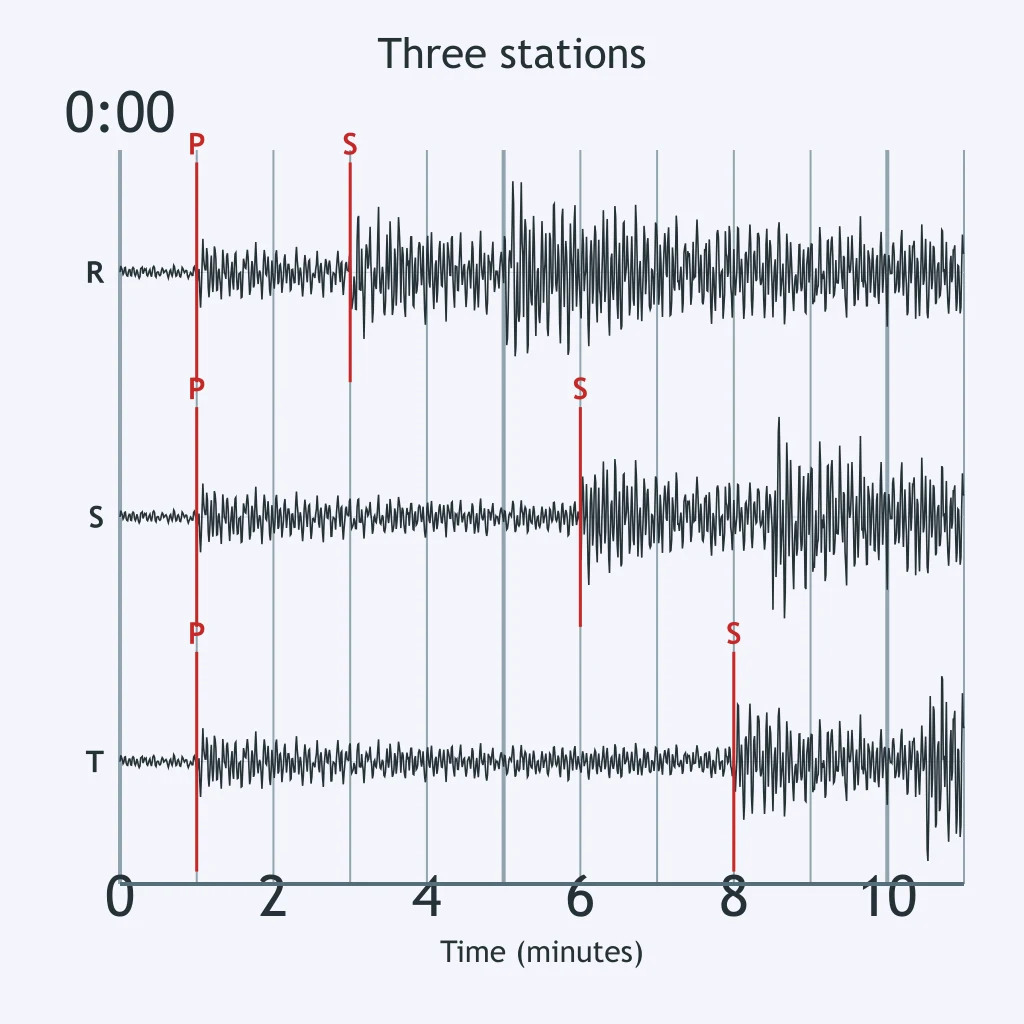
Compare the three seismogram traces. Which station is closest to the epicenter?
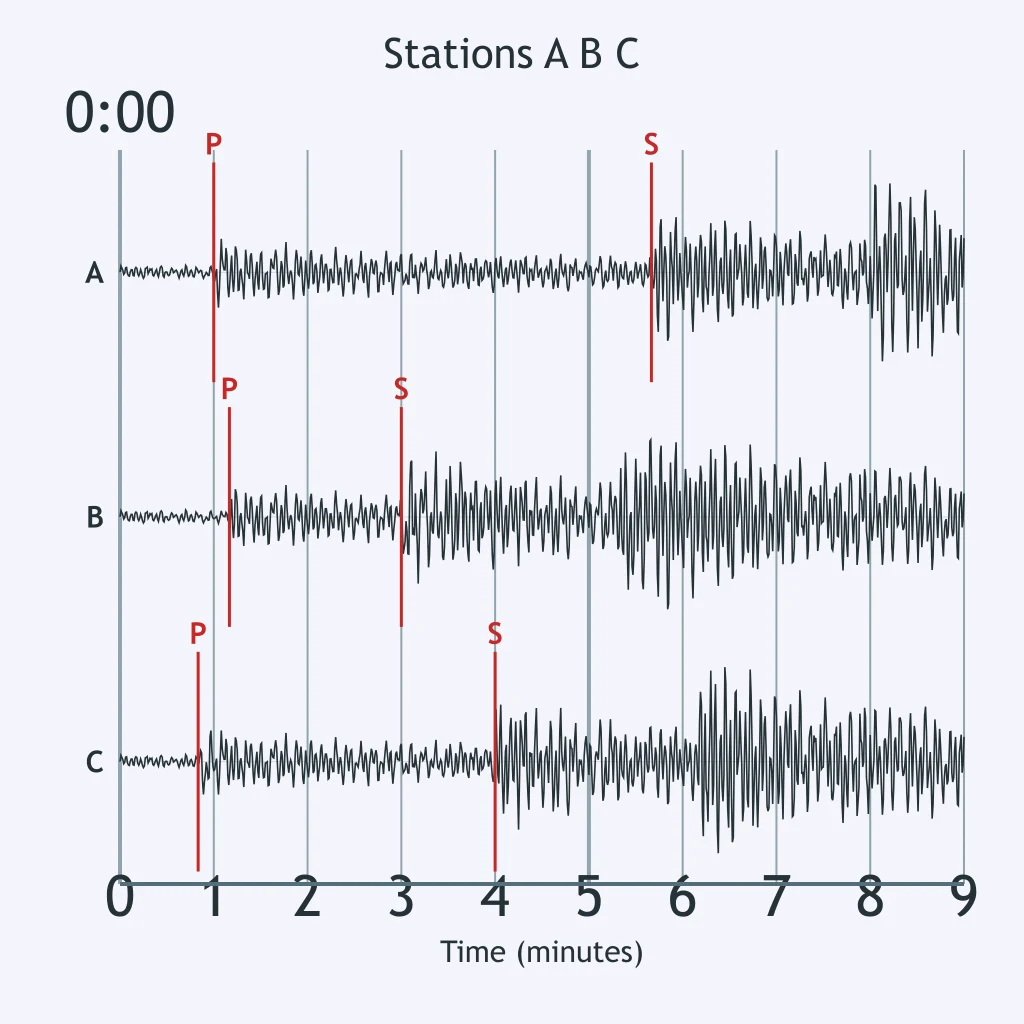
Stations A, B, and C recorded the same earthquake. Which trace indicates the shortest epicenter distance?
Using the three traces, which station is farthest from the epicenter?
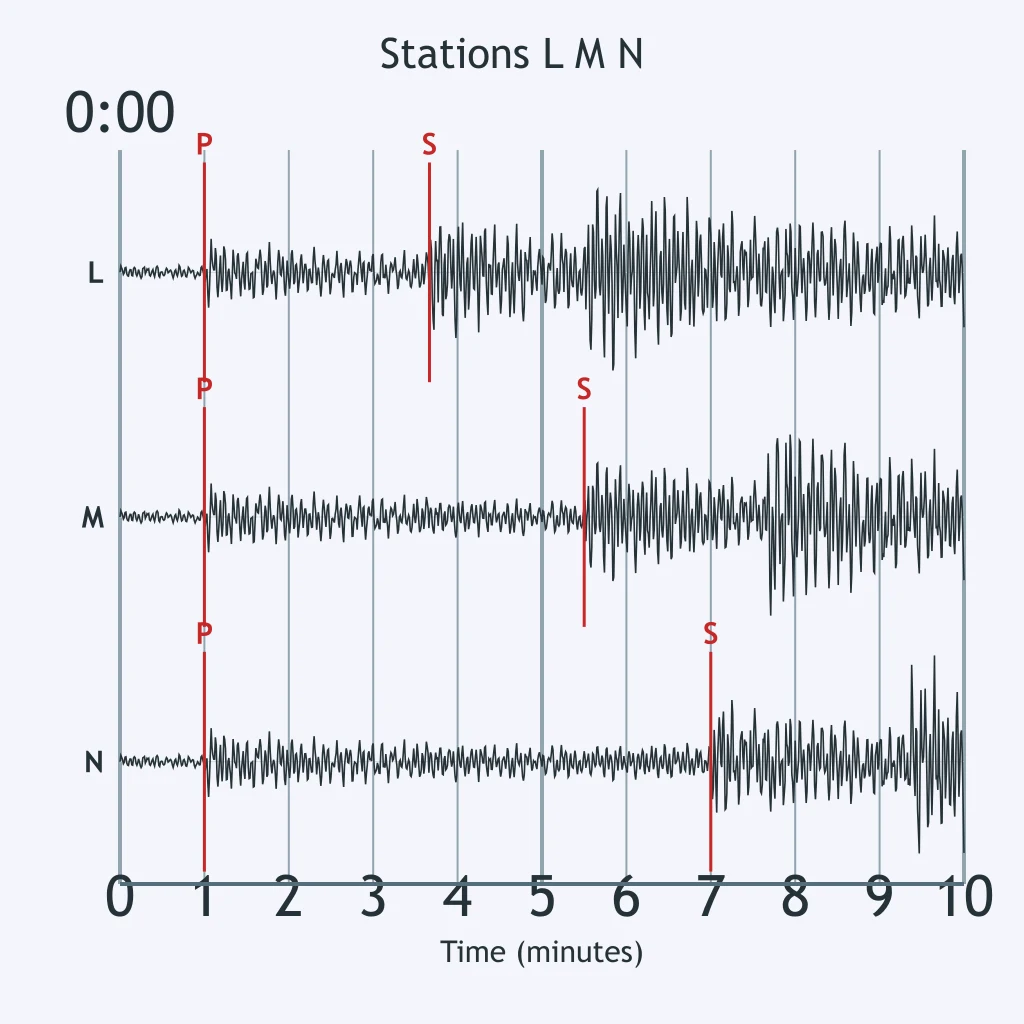
Order the stations from closest to farthest from the epicenter using their P-S intervals.
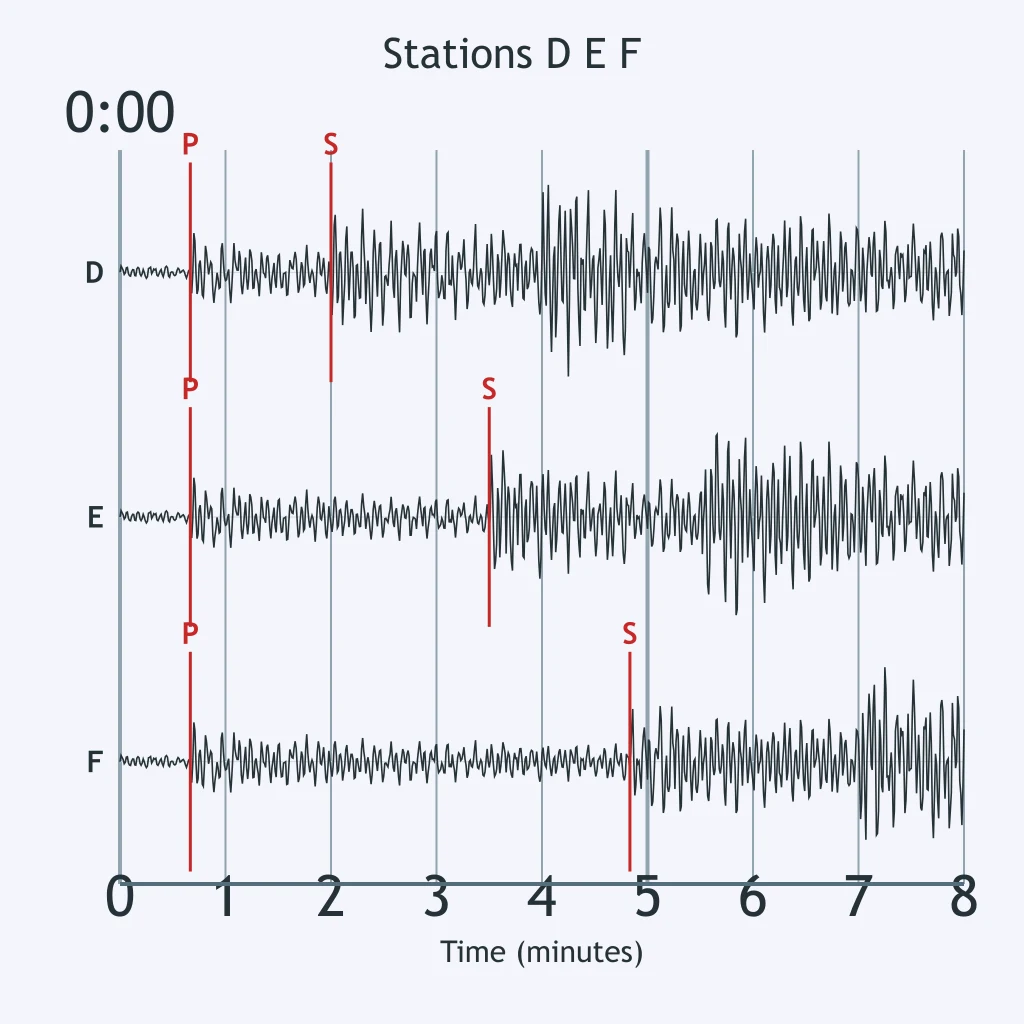
Which station's trace should be drawn with the largest radius on a triangulation map?
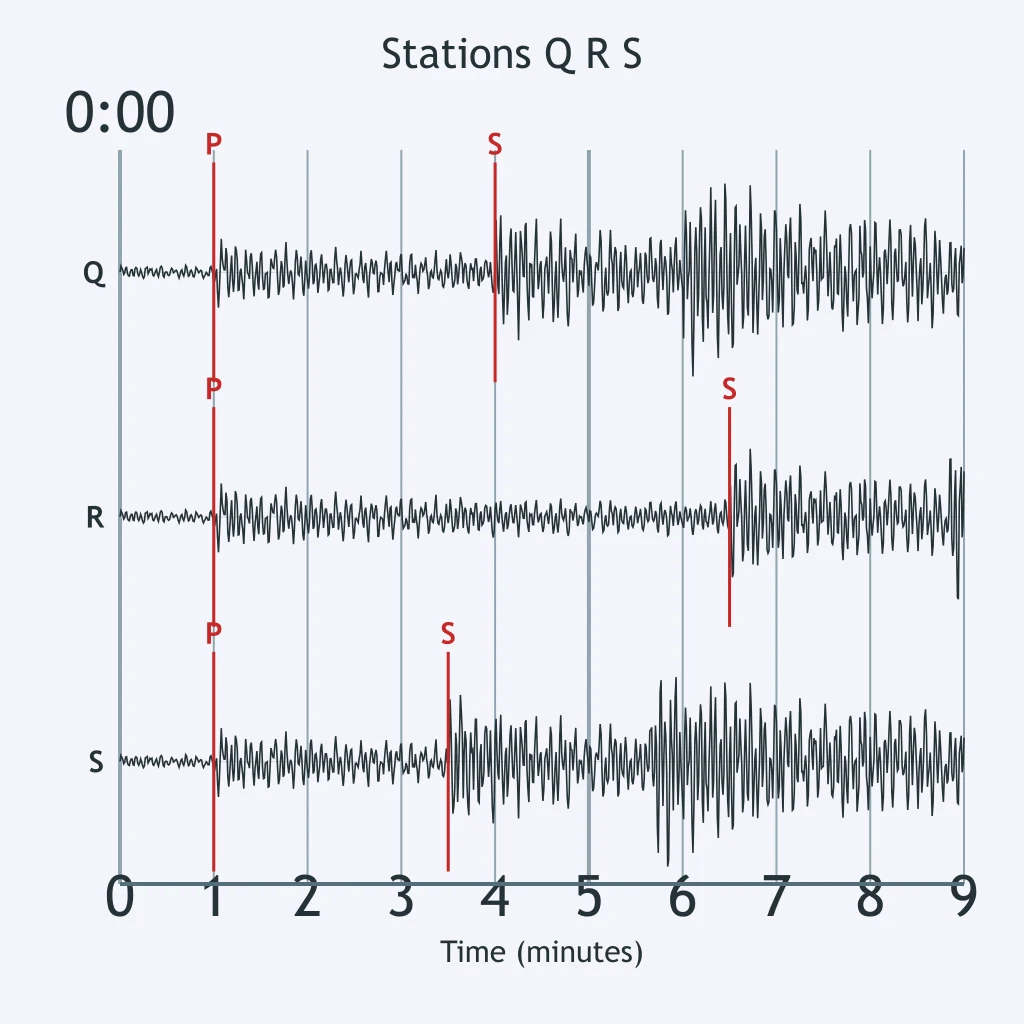
Which statement best compares the station distances shown by the seismograms?
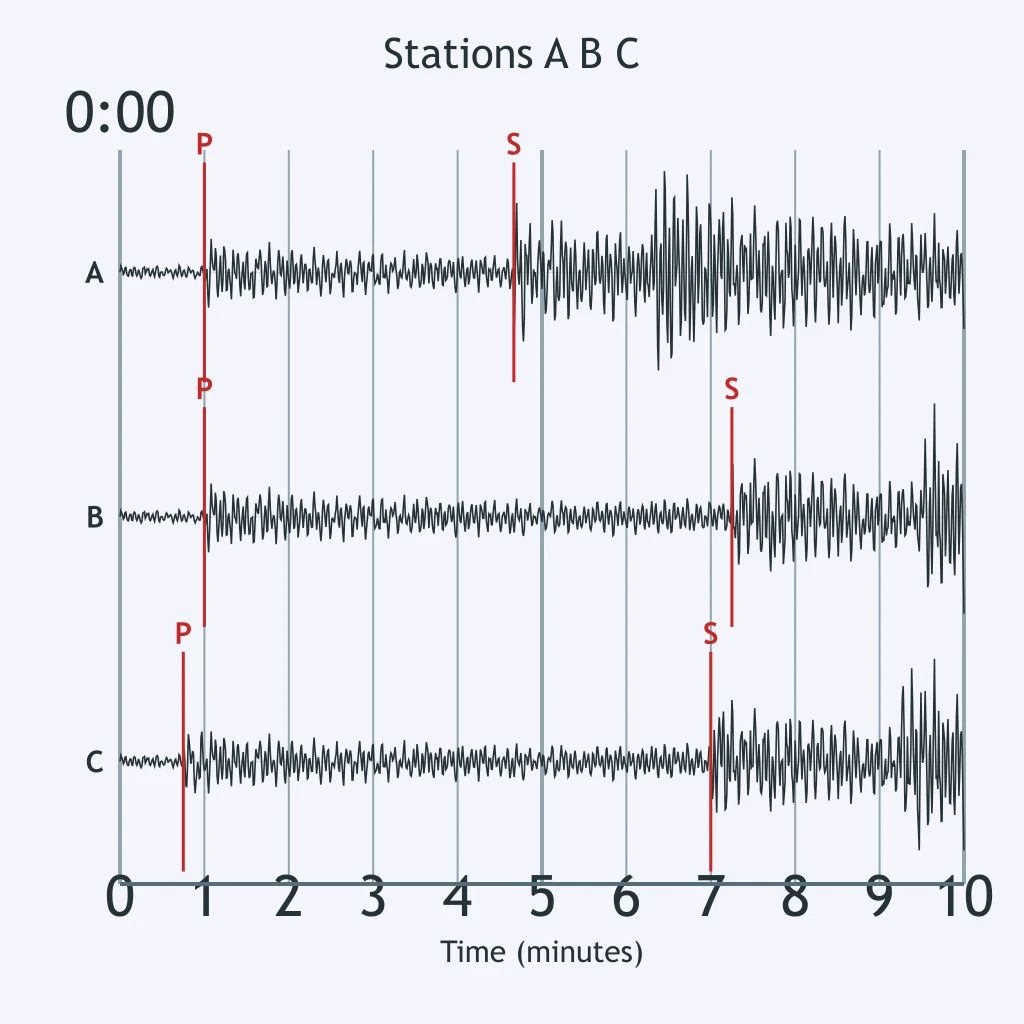
A map radius is smallest for the station whose P and S arrivals are closest together. Which station is that?
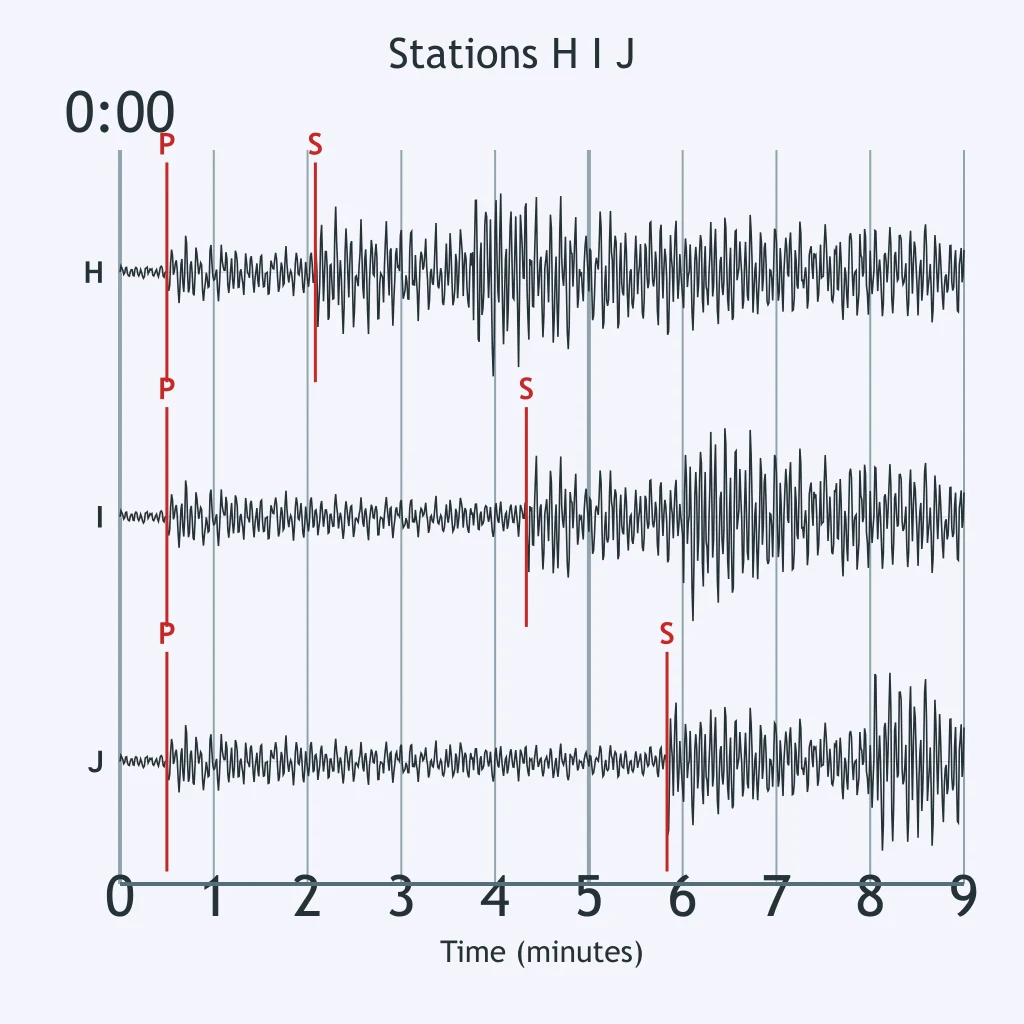
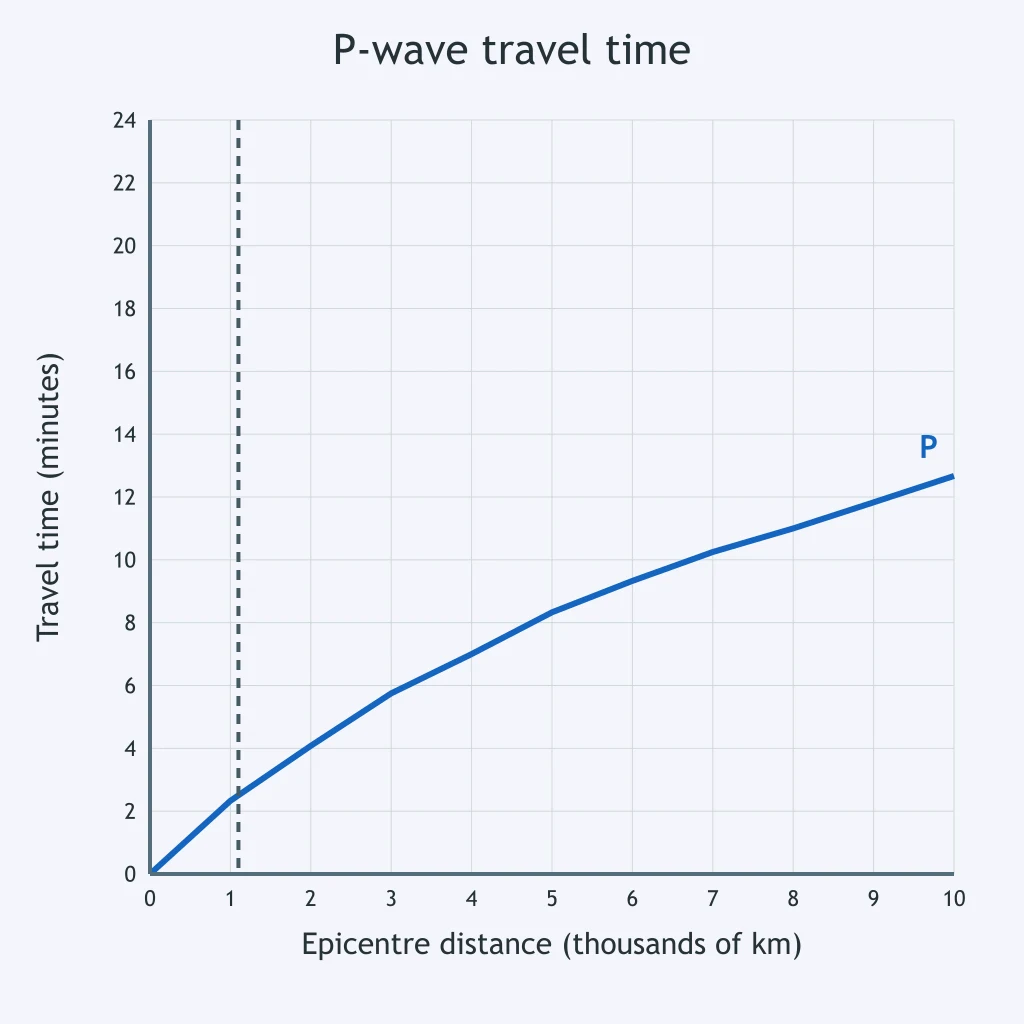
A station about 1,100 km from the epicenter records the P wave at 09:20:00. Use the P-wave travel-time graph to estimate the origin time.
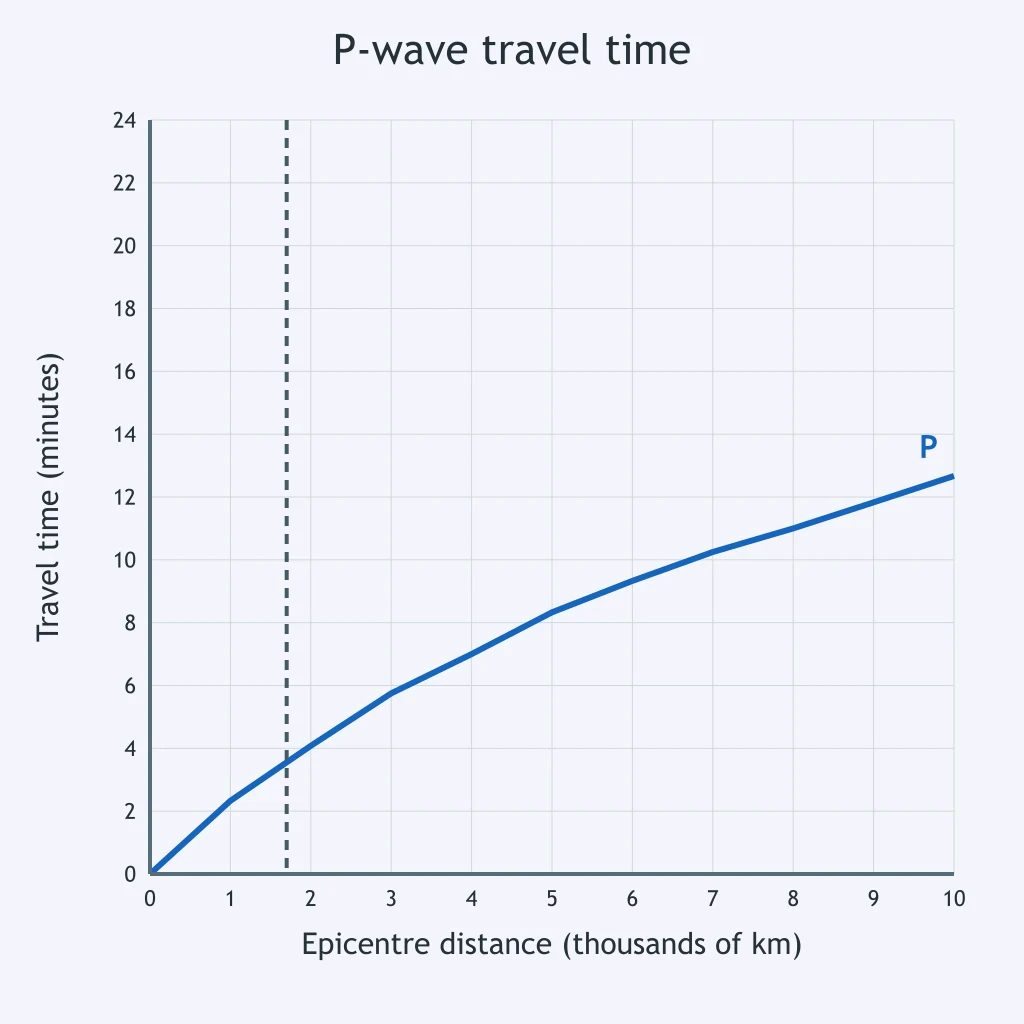
A station 1,700 km from an epicenter records the P wave at 16:12:00. What was the approximate earthquake origin time?
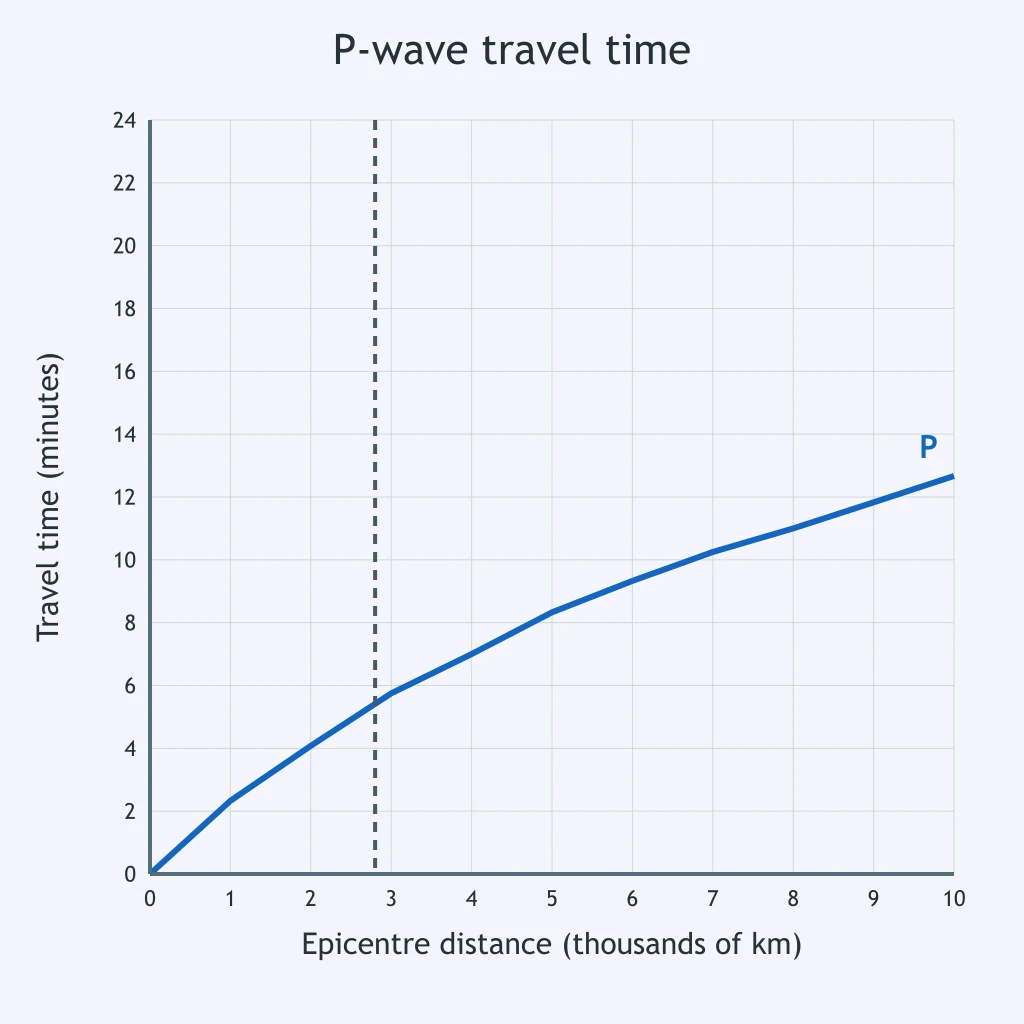
At a station 2,800 km from the epicenter, the first P wave arrives at 04:45:20. Use the graph to estimate when the earthquake occurred.
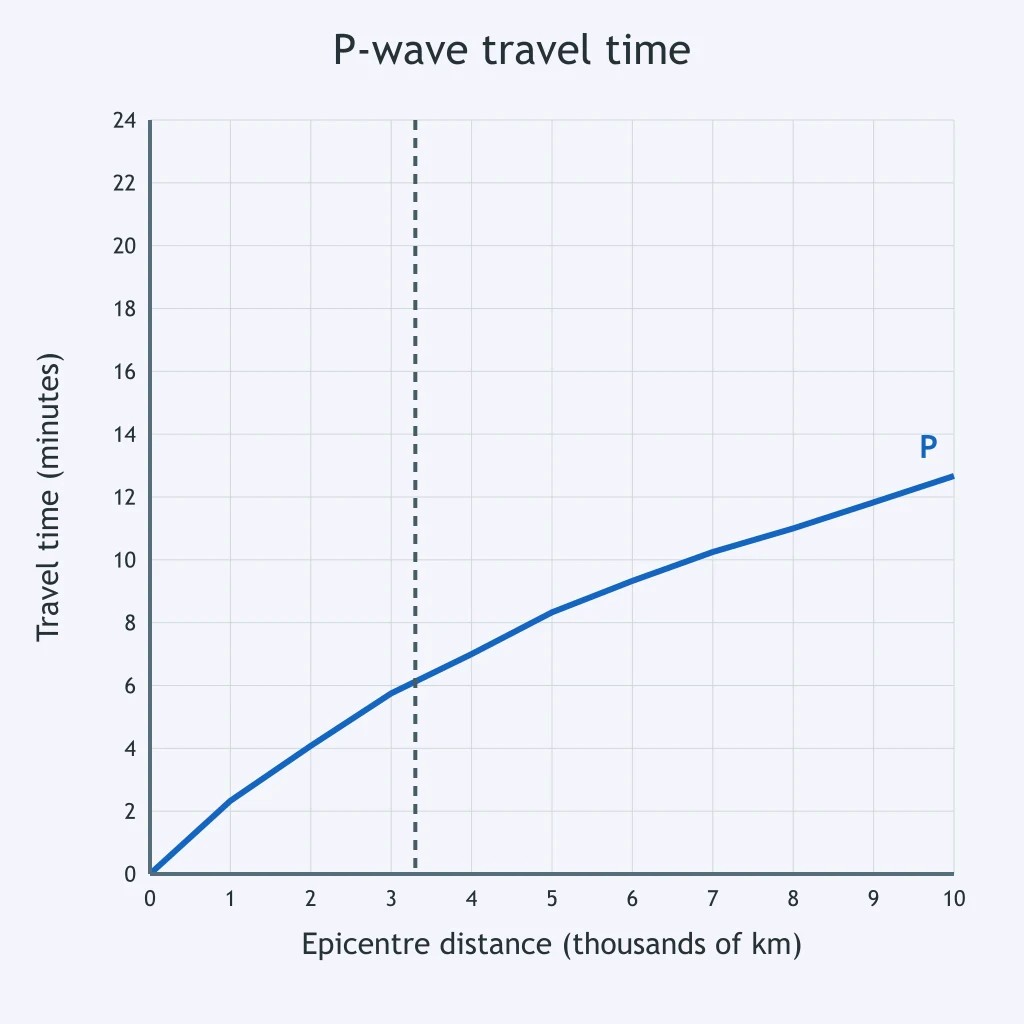
A station 3,300 km from the epicenter records the P wave at 21:10:30. What origin time is indicated by the P-wave graph?
A P wave reaches a station 4,400 km from the epicenter at 12:30:00. Use the graph to estimate the earthquake origin time.
Crack the passcode before the zombies get in.
Answer, then swat bugs for bonus points.
Race through questions at your own speed.
Same question on every screen. Fastest wins.

Pick a tile, answer, hit bonuses and steals.
Earthquakes Review
40 questions