Loading
by BlastRoom
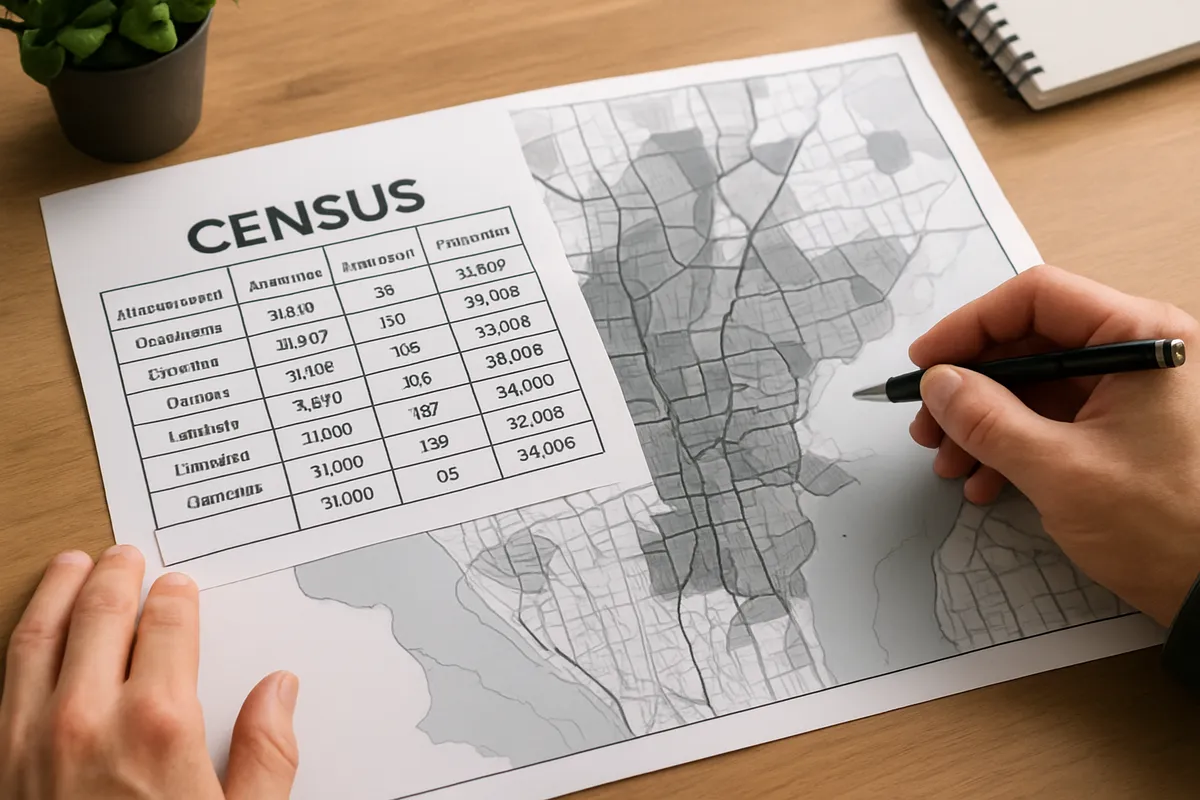
Taking a value or a trend off the tables and charts a city is described with.
#us_hs_human_geography
25 questions
One question set, multiple game modes. Tap any game to see it in action. Not sure which to pick?
Answer to place stones and capture territory.
Outrun the snow together.
Earn blasts, then hunt the other team.
Answer to earn energy, then climb.

The class blasts through walls together.
Bid on mystery lots. Most money wins.
Sell tours. Nice, standard, or a total scam.

Answer, restock, and serve the rush.
More correct answers pulls the rope your way.
Answer, then shoot down the alien wave.
Answer, then tap to leap the frozen ridge.
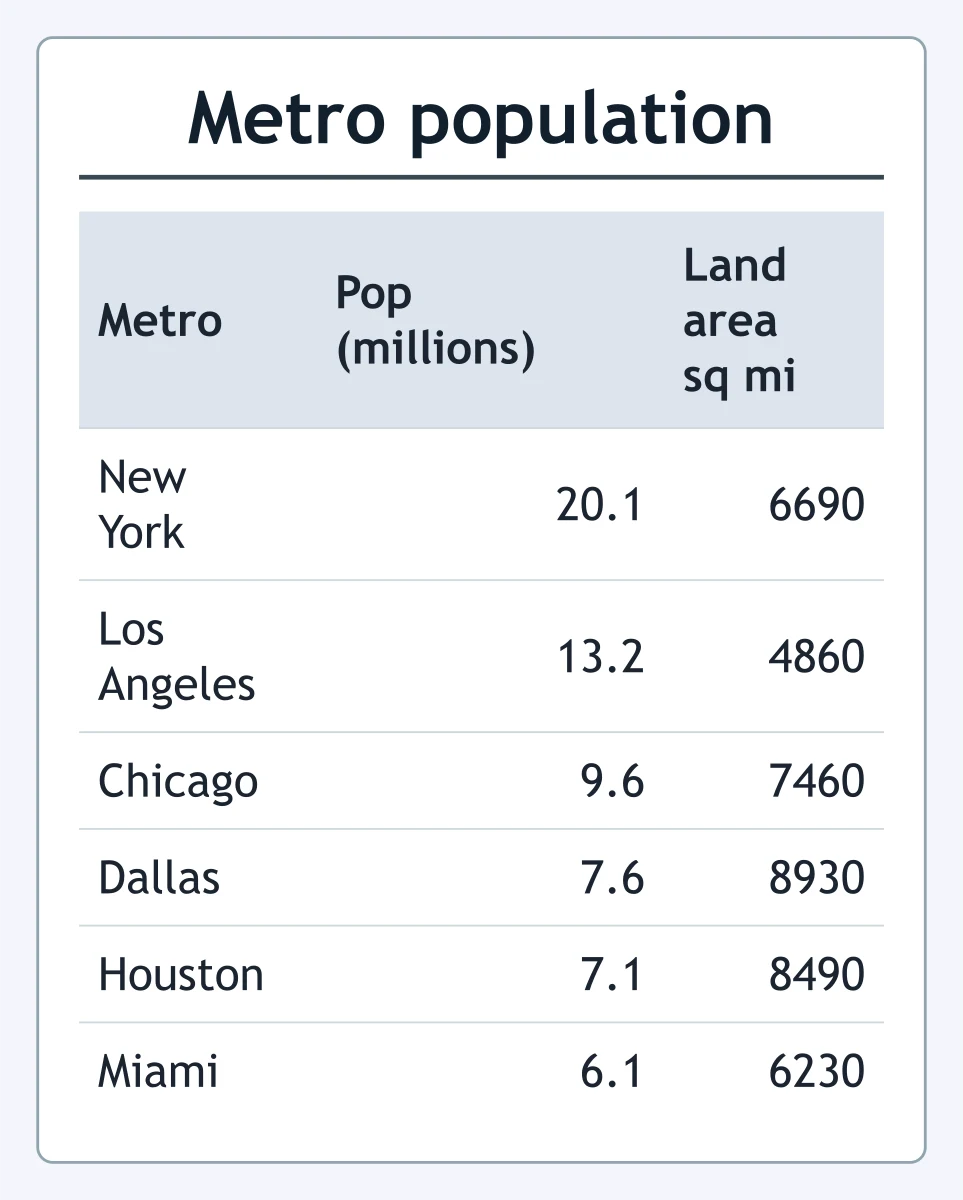
Use the table. Which metropolitan area had the second largest population in 2020?
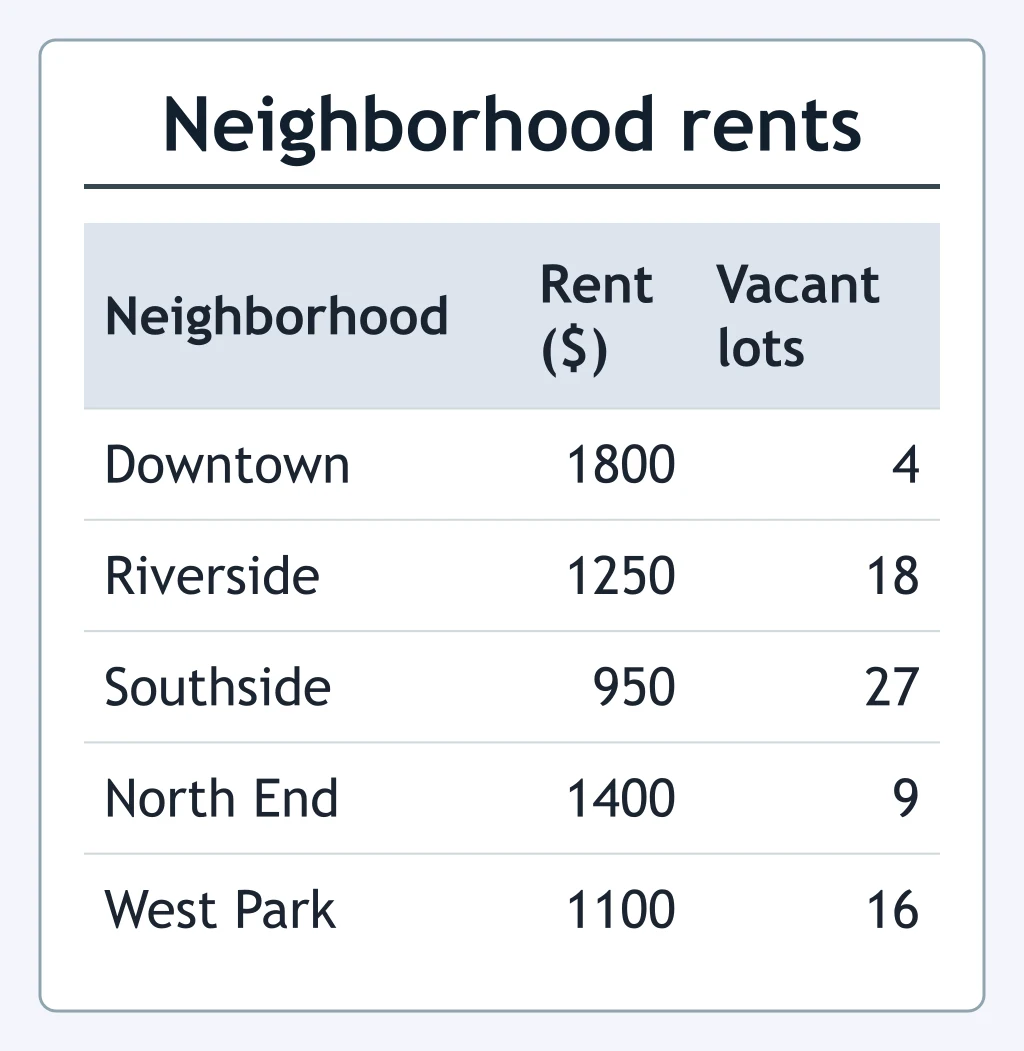
According to the table, which neighborhood had the lowest median monthly rent?
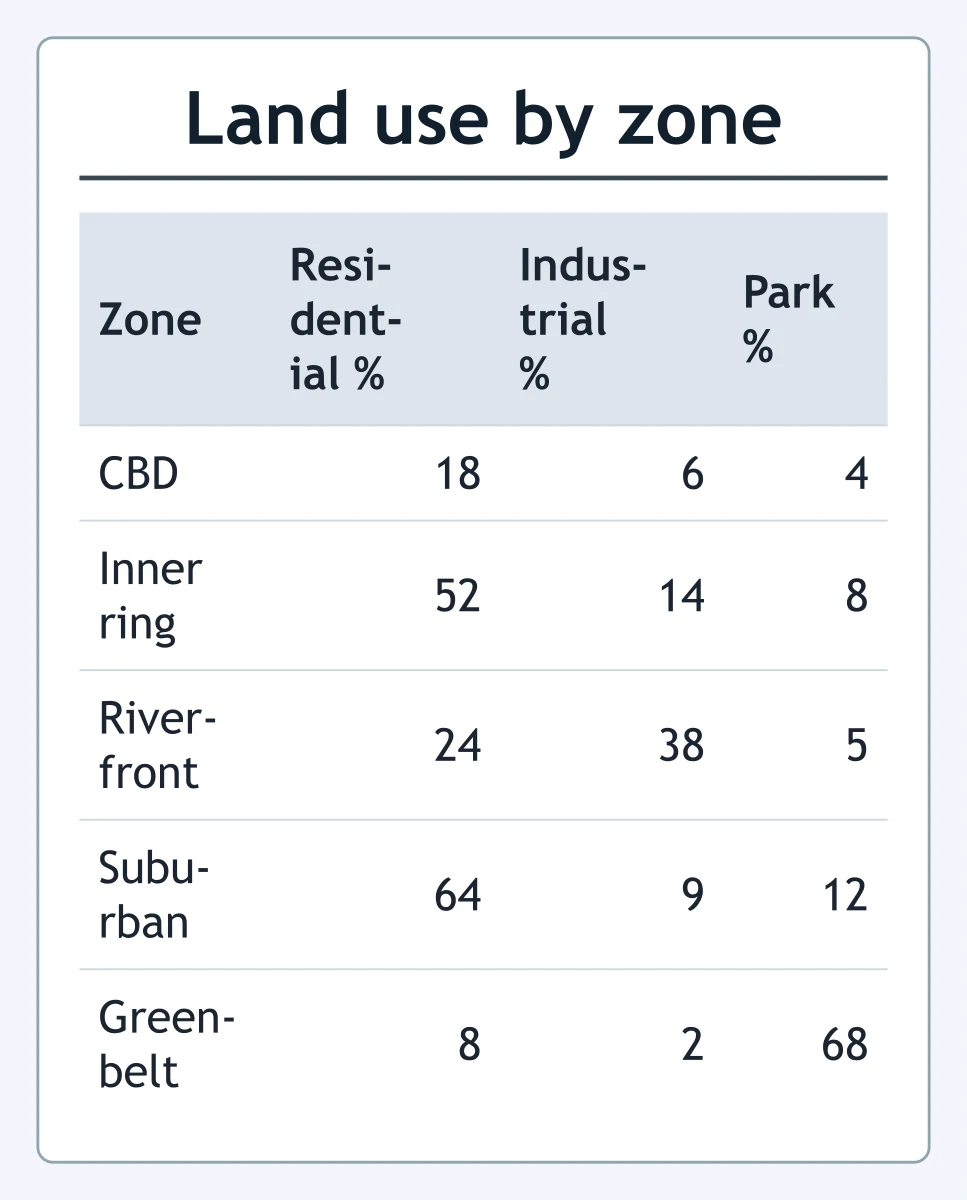
Use the land-use table. Which zone had the largest industrial share?
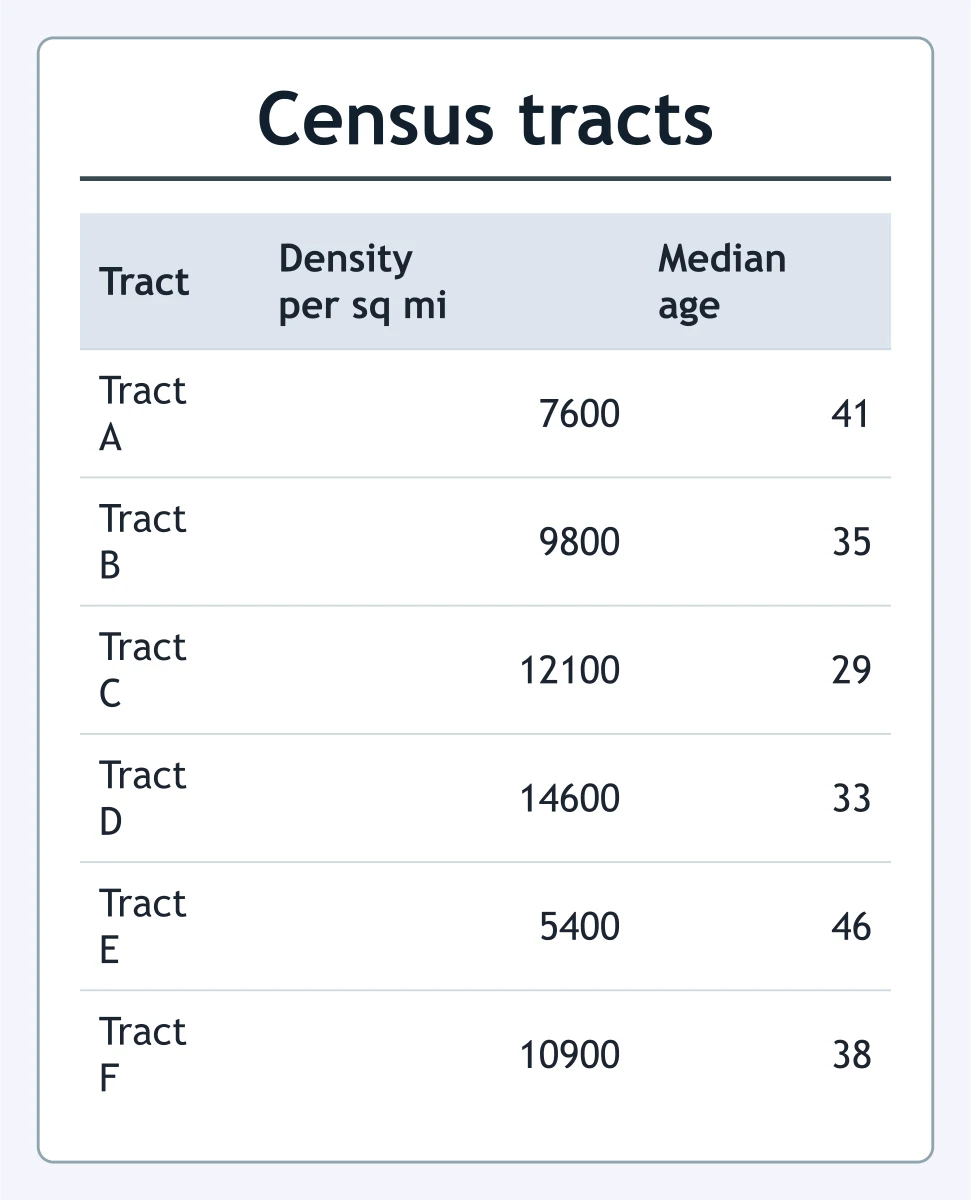
Use the table. Which tract had a population density closest to 12000 people per square mile?
According to the table, where was the average clinic wait shortest?
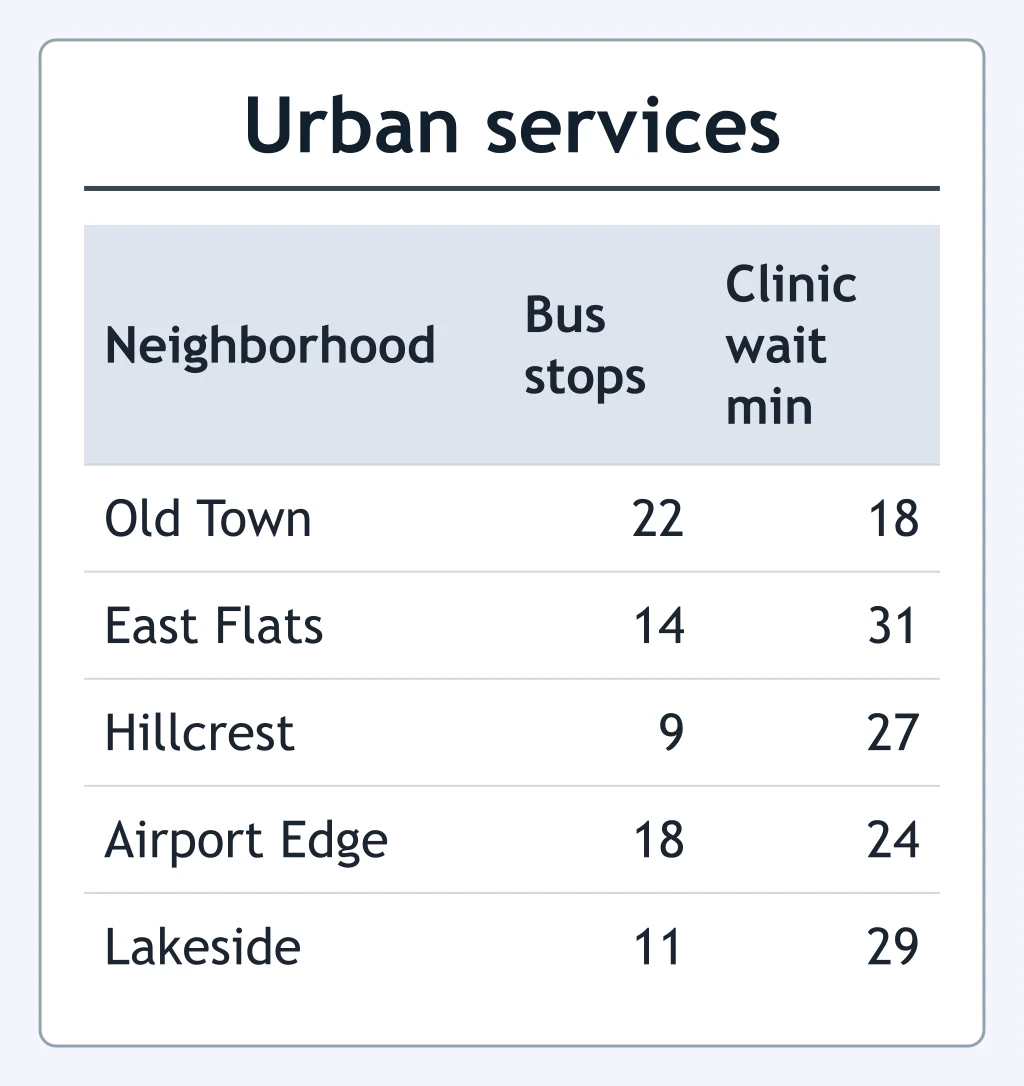
Use the commute table. Which district had the highest walk-or-bike share?
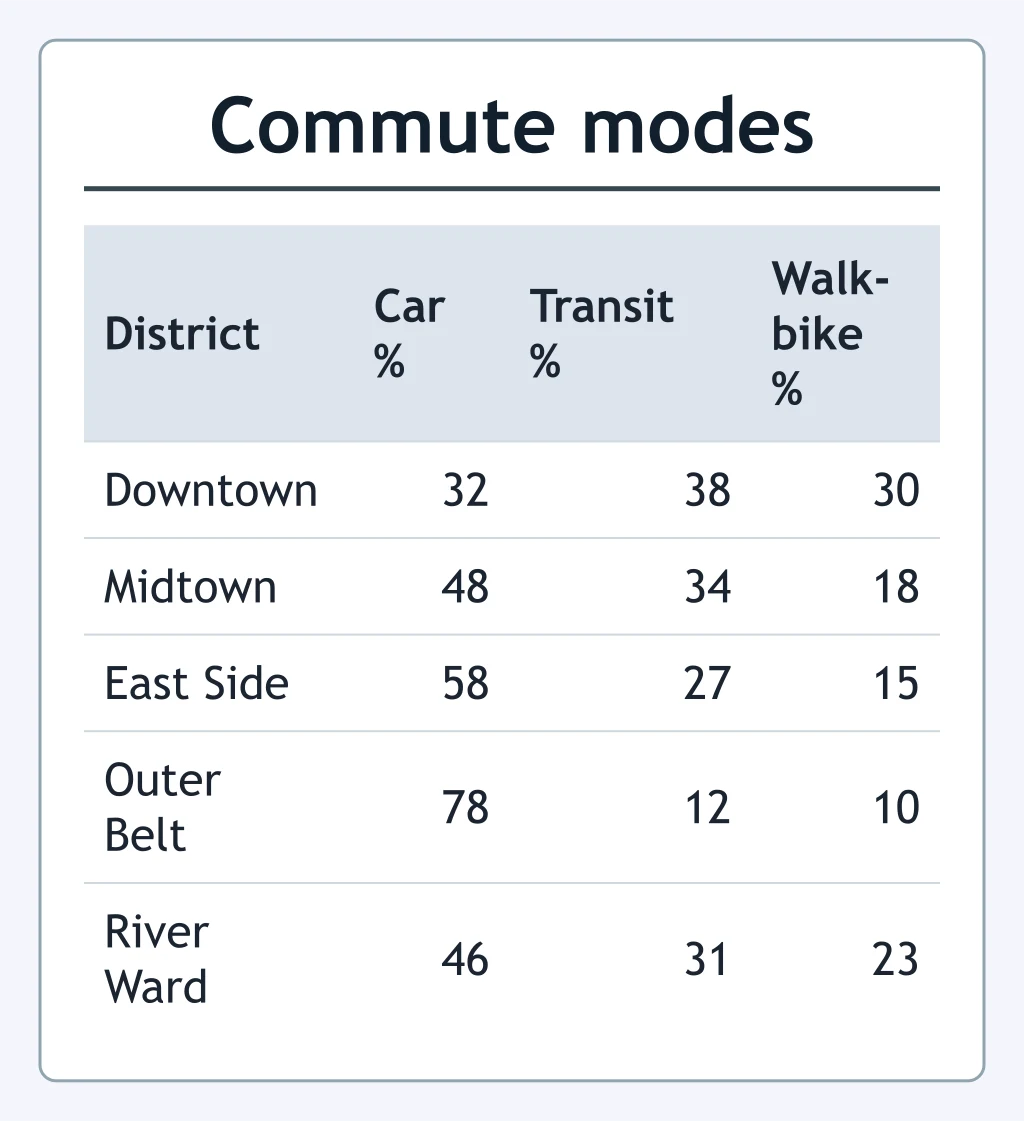
Use the line graph. What pattern best describes the central city's population?
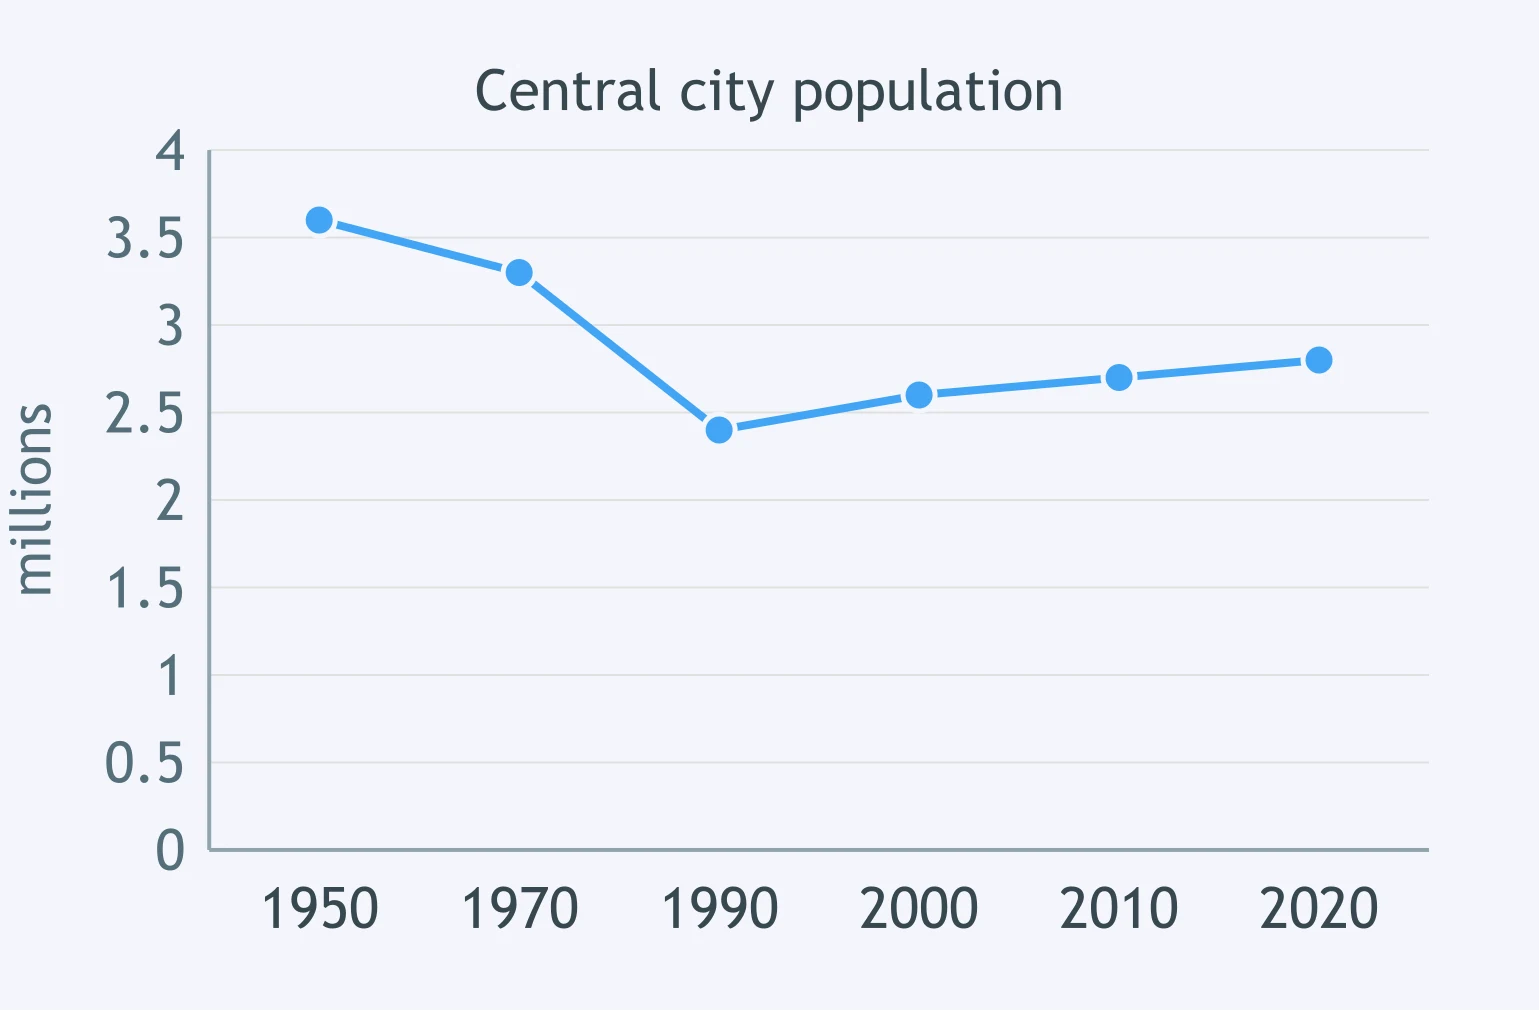
Use the line graph. Which statement describes the suburban ring's population trend?
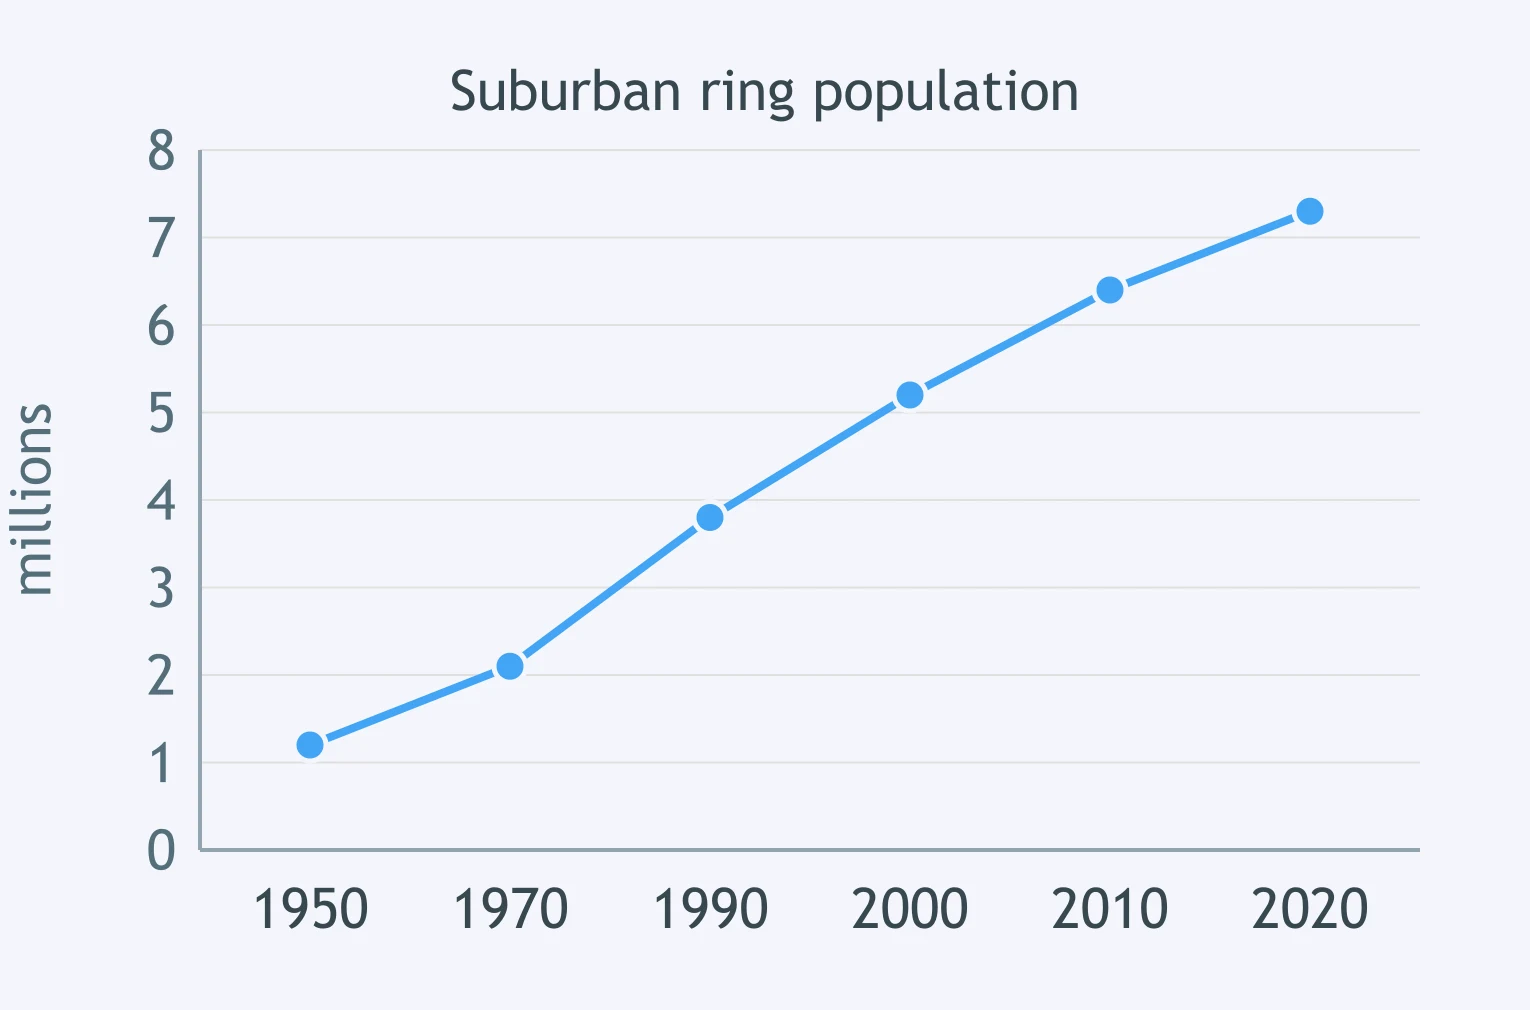
Use the line graph. What happened to the downtown office vacancy rate over the period shown?
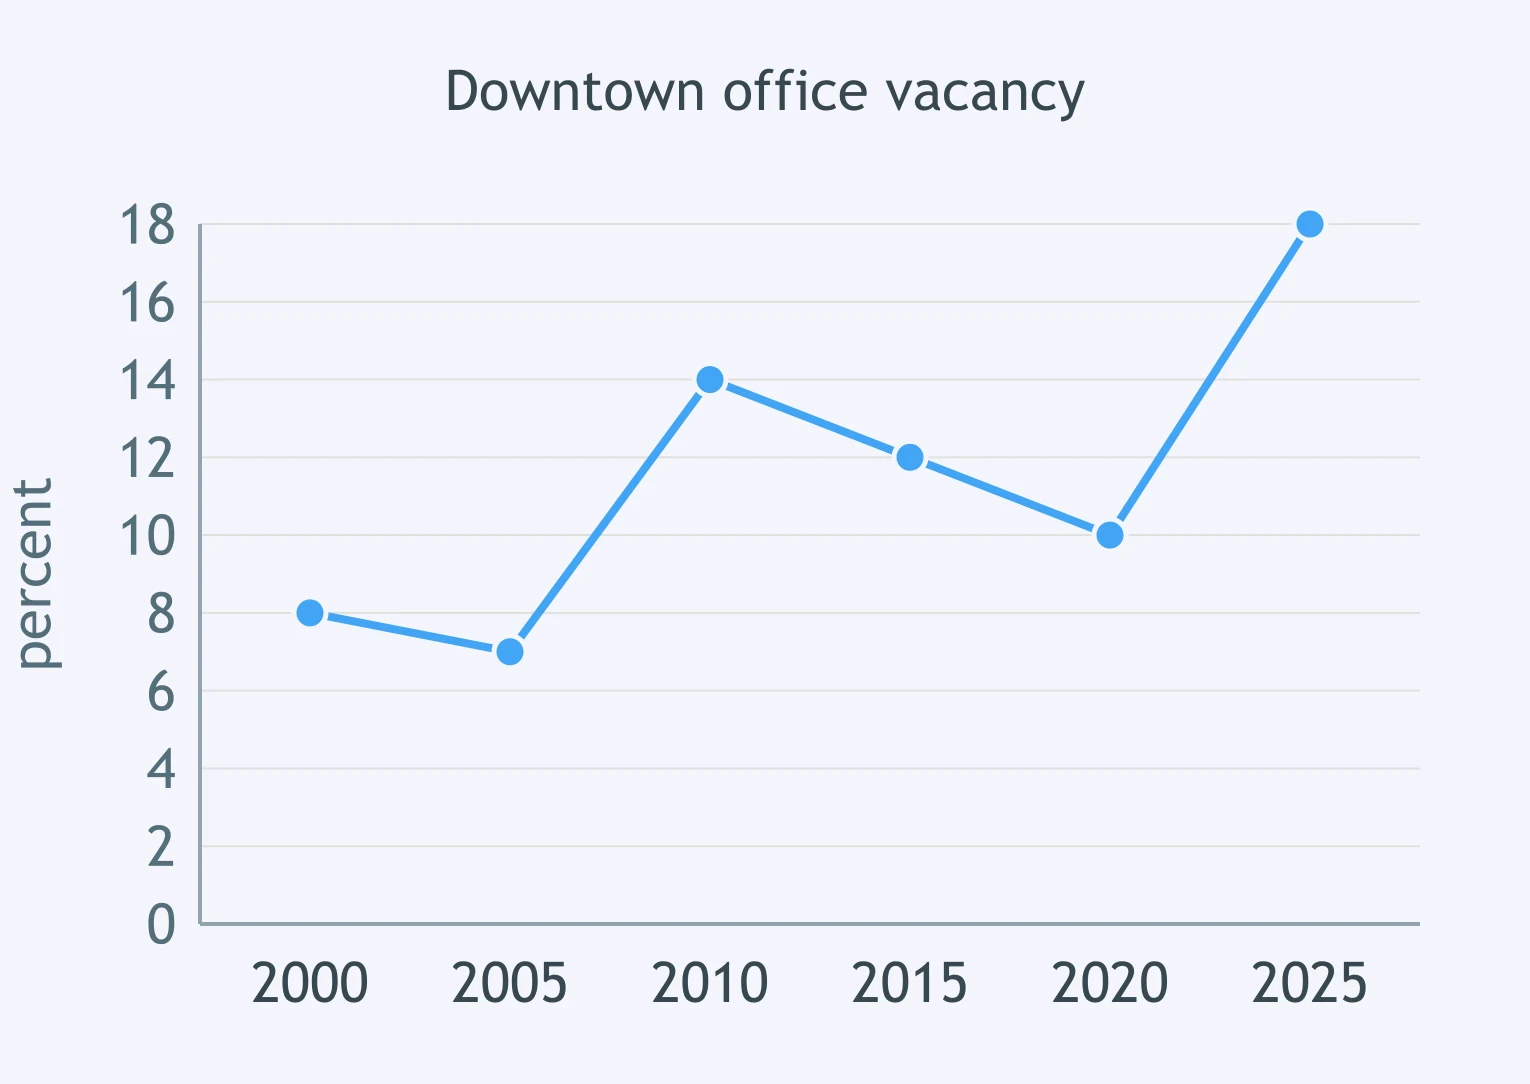
Use the line graph. Which statement best describes transit ridership?
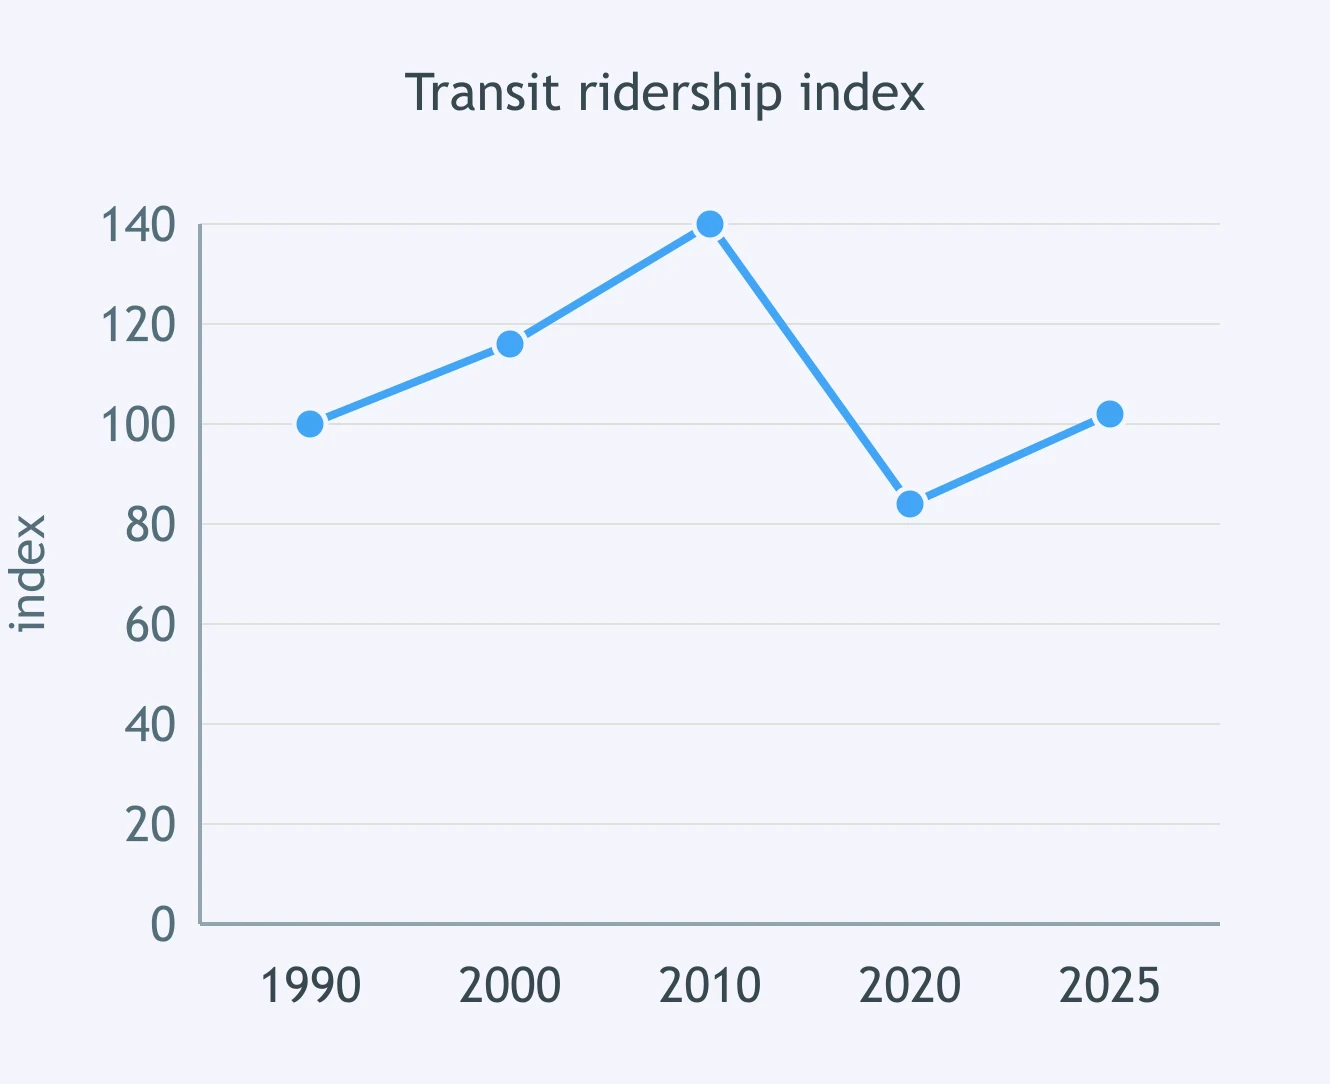
Use the line graph. How did farmland on the urban fringe change?
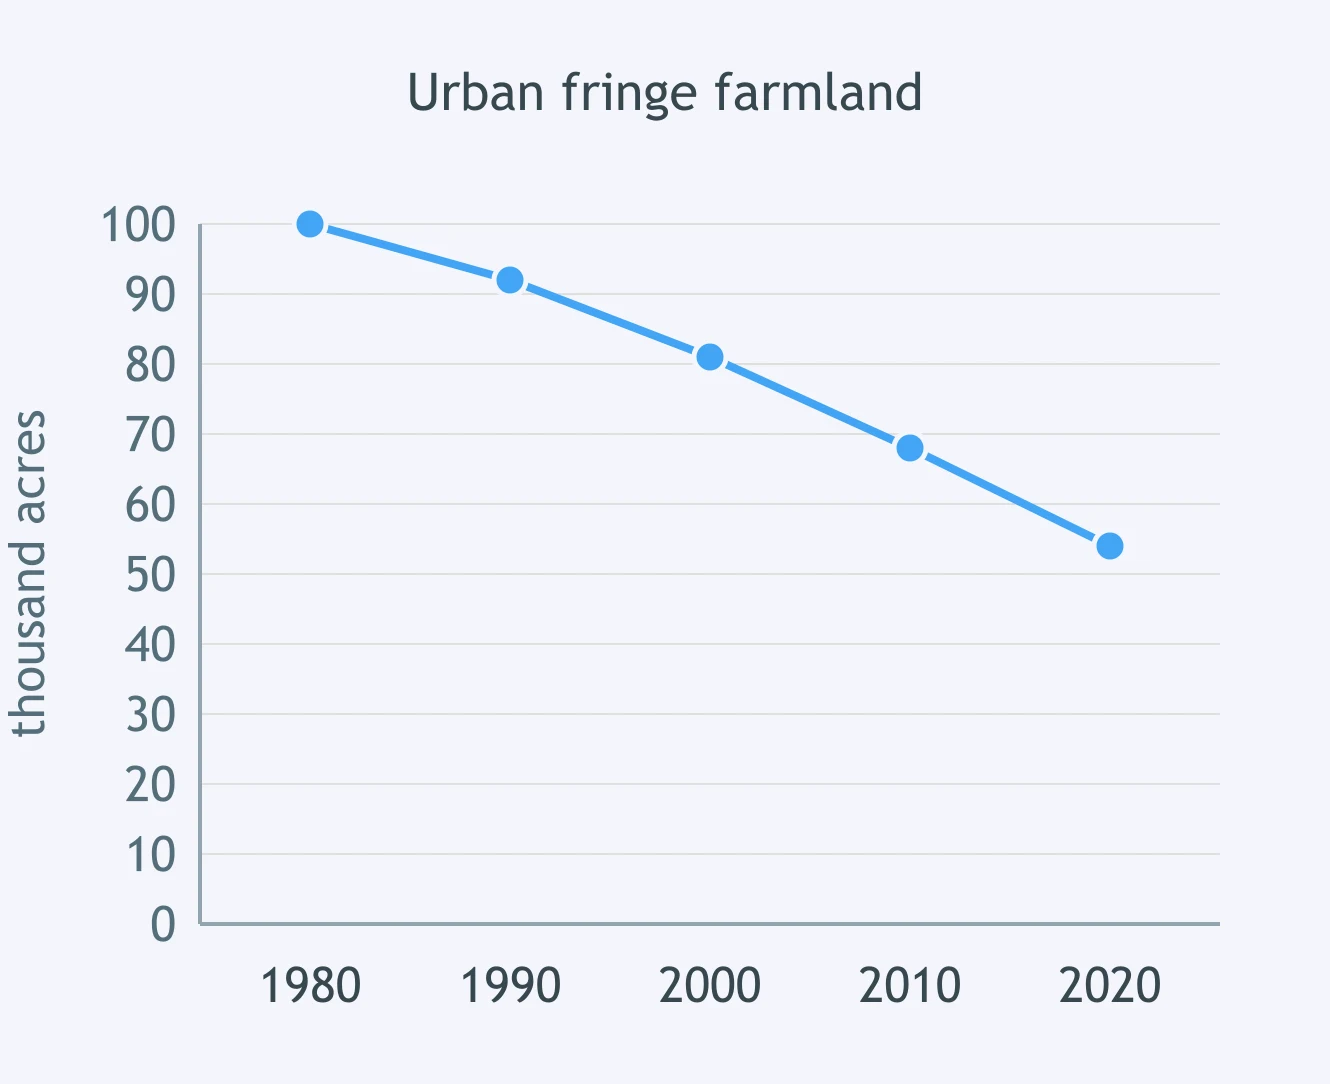
Use the line graph. What trend do the housing permits show?
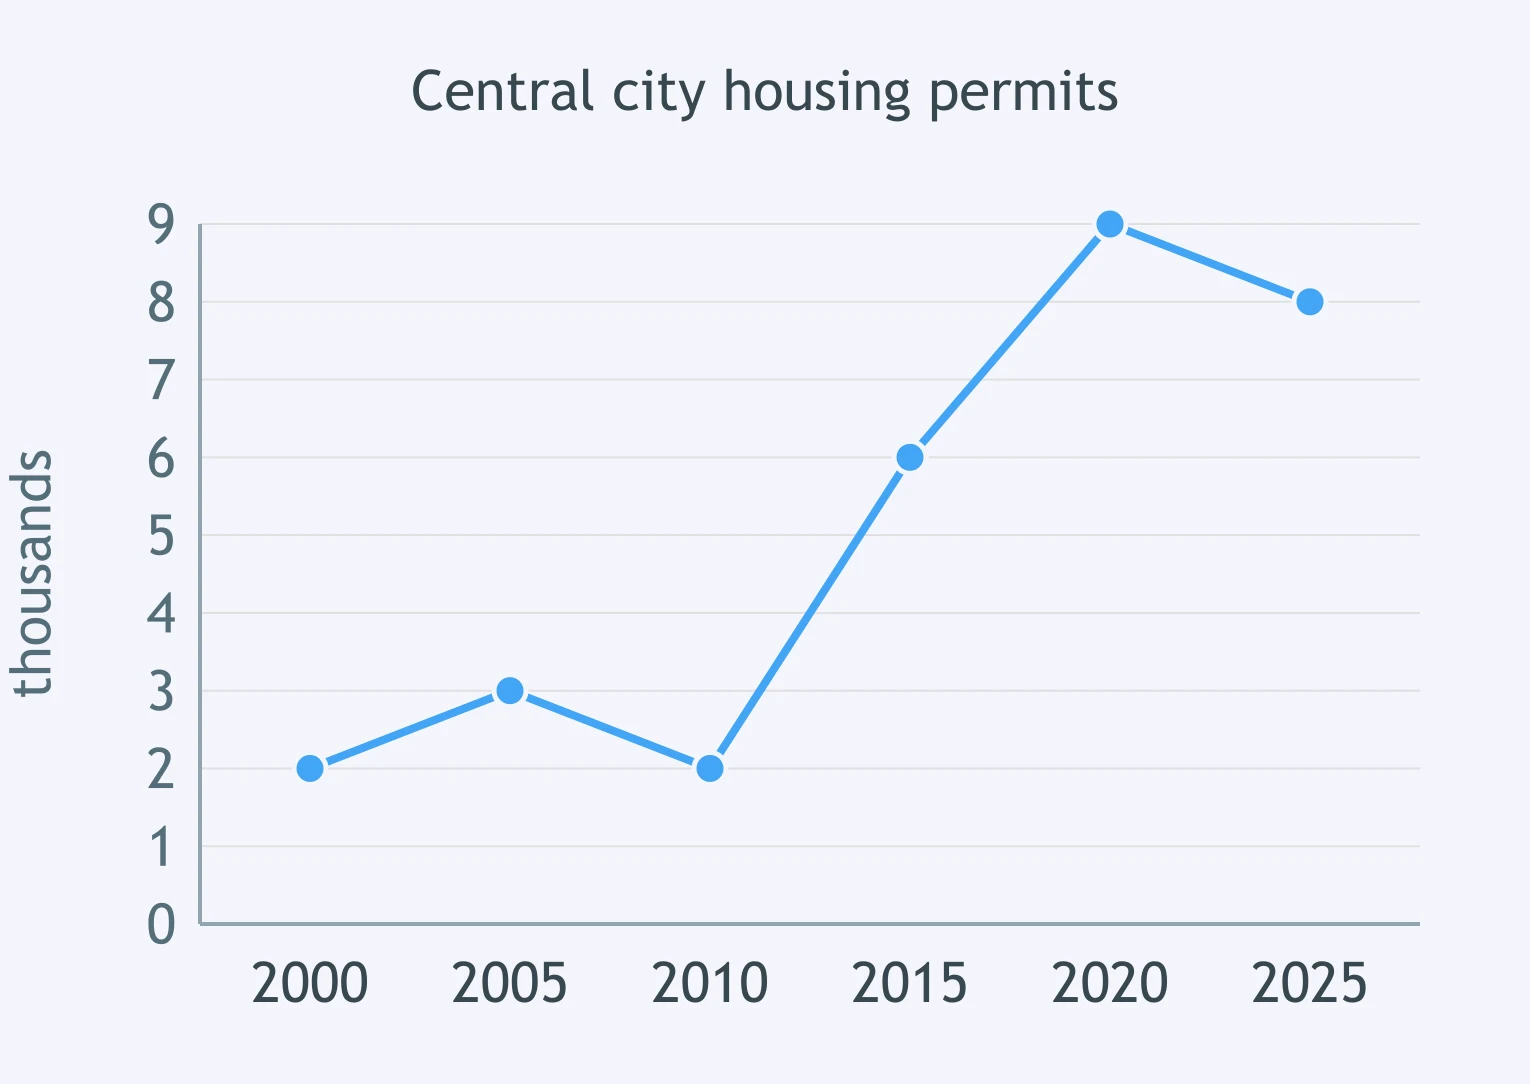
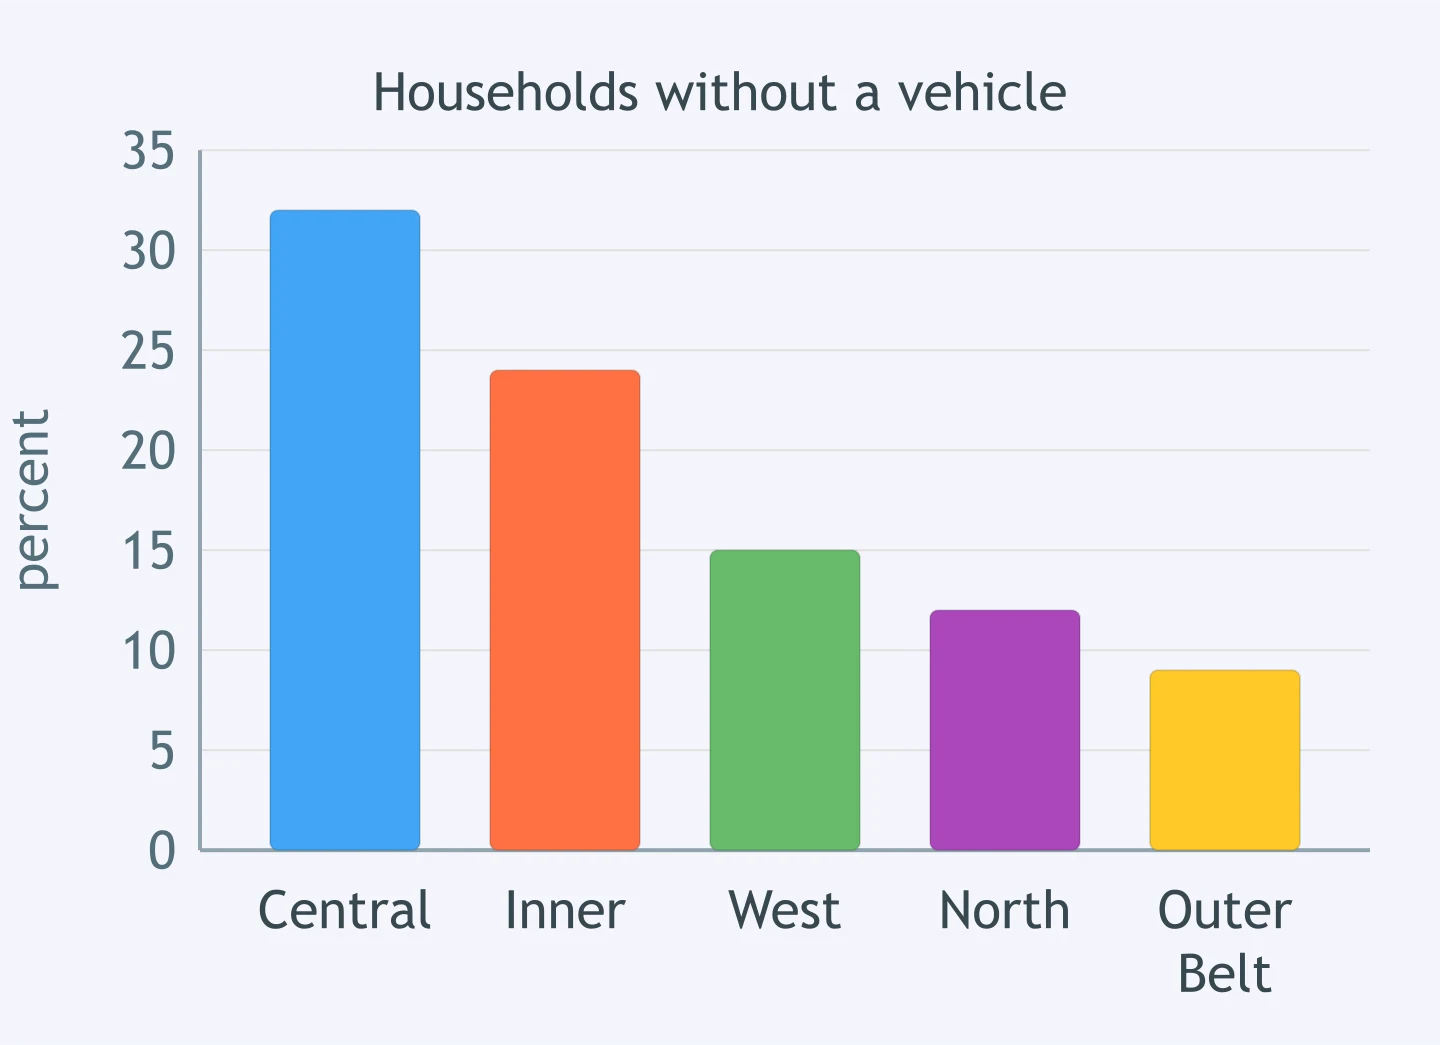
Use the bar graph. Which comparison is supported for households without a vehicle?
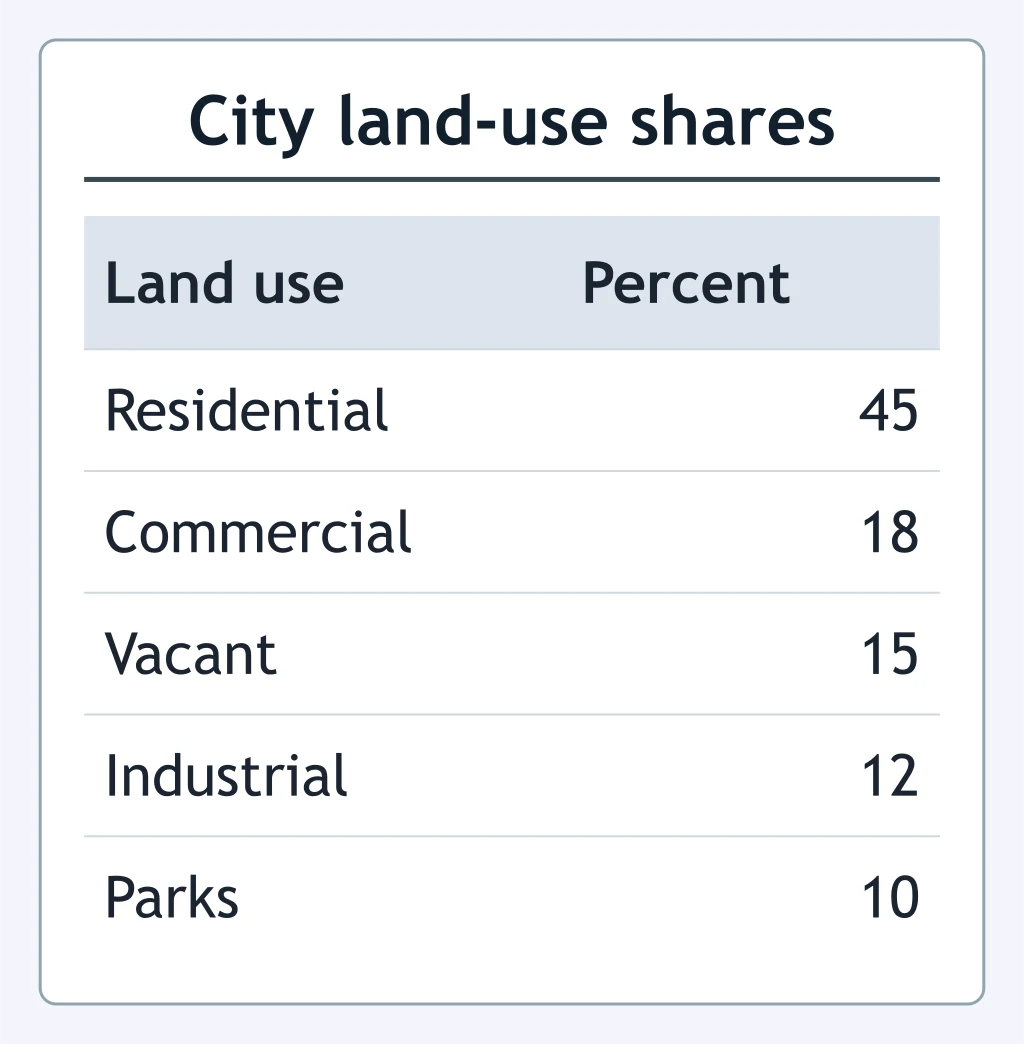
Use the table. Which land-use comparison is correct?
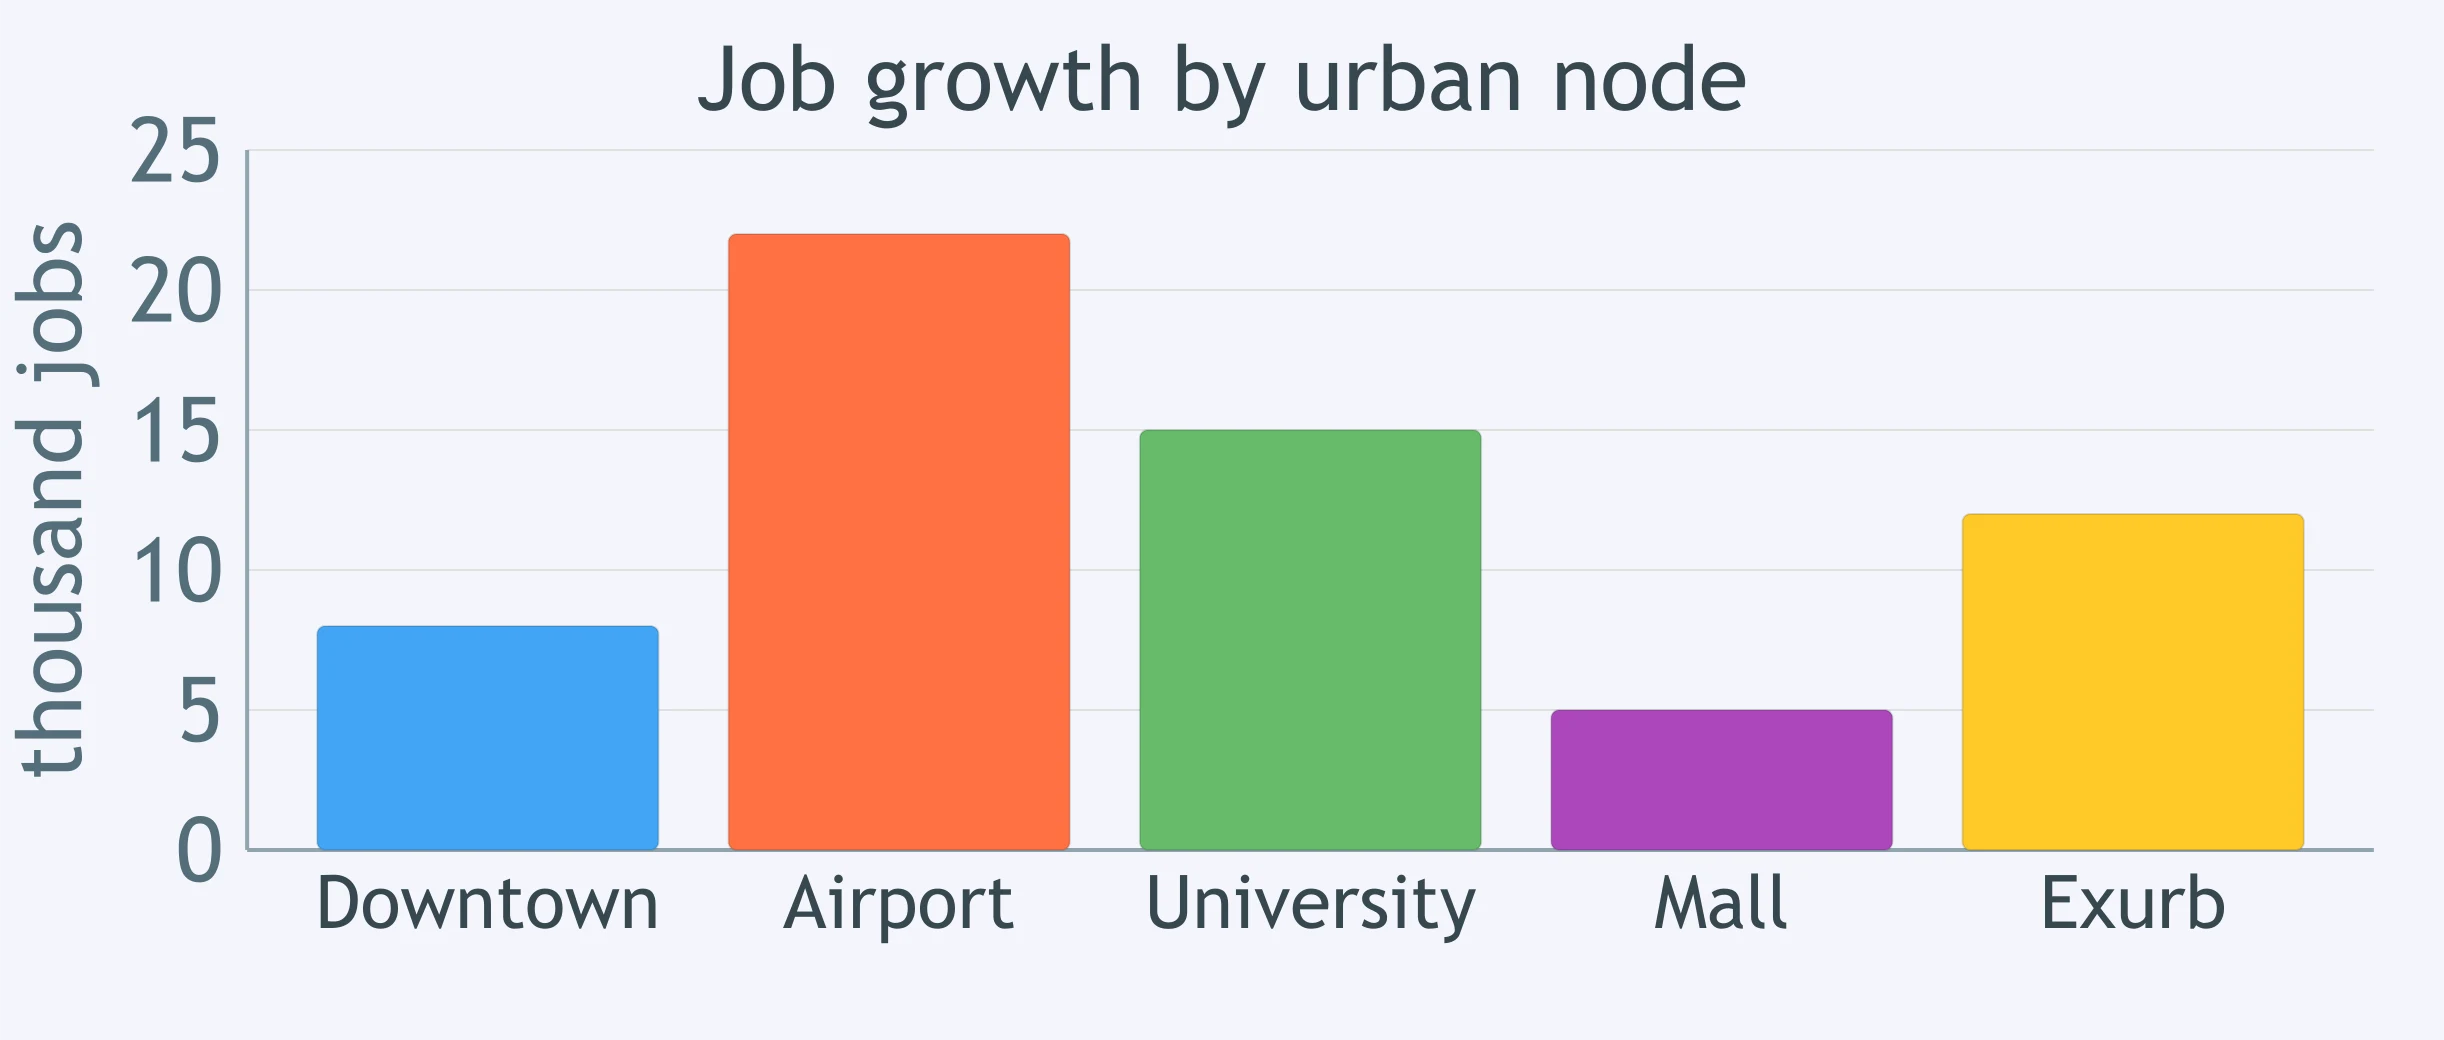
Use the bar graph. Which job-growth comparison does the graph support?
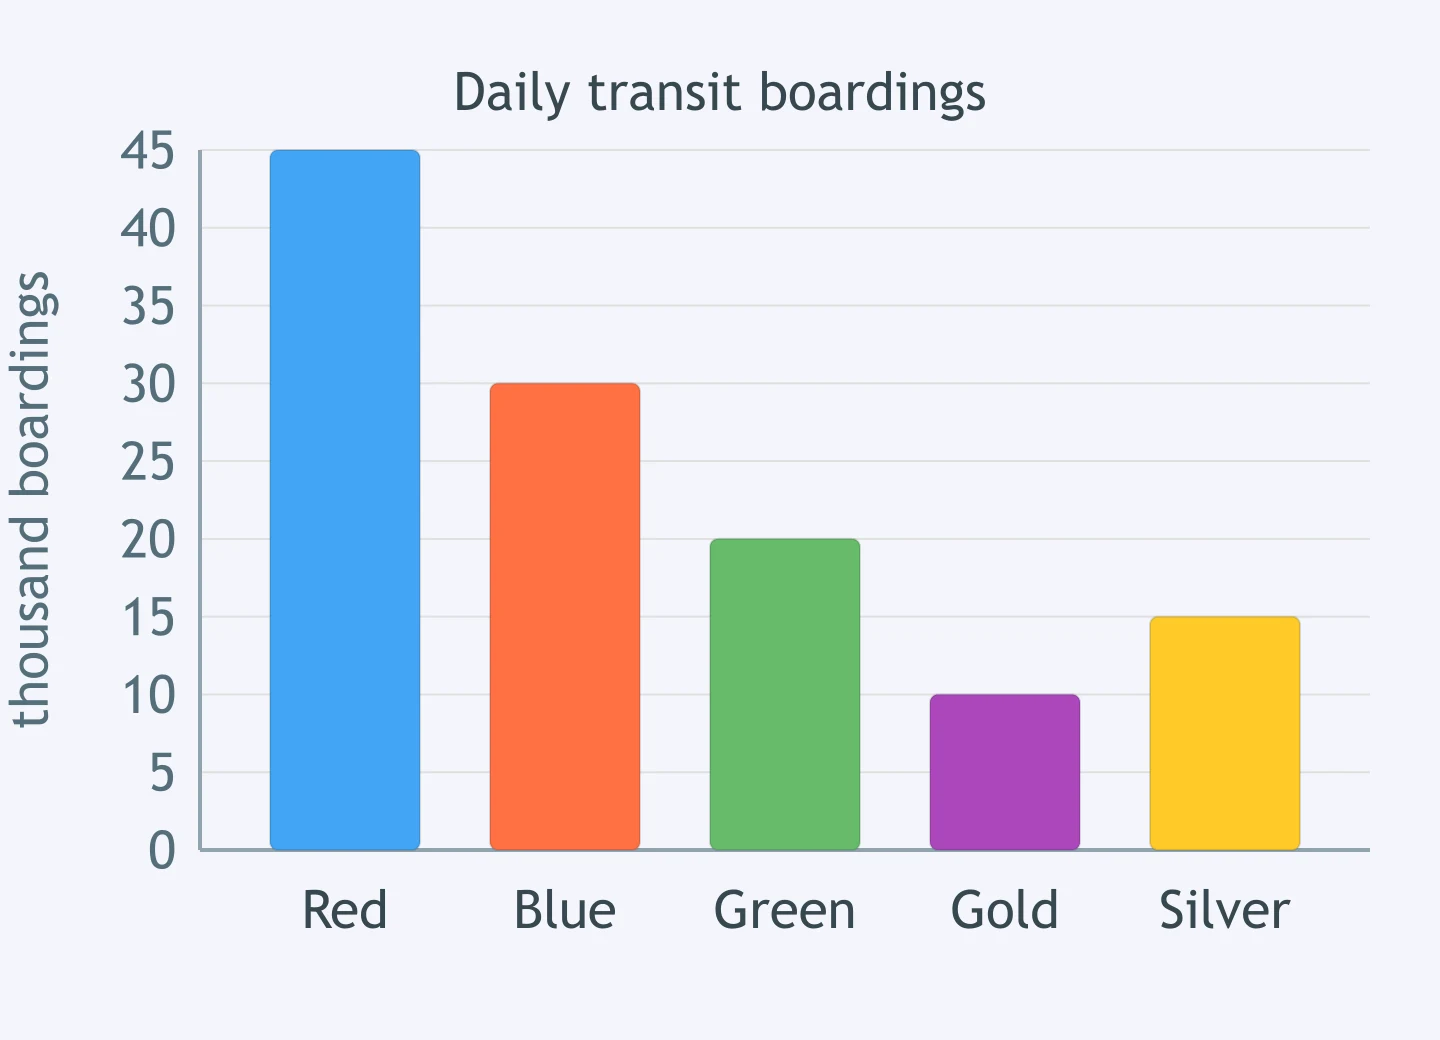
Use the bar graph. Which comparison is supported for transit boardings by corridor?
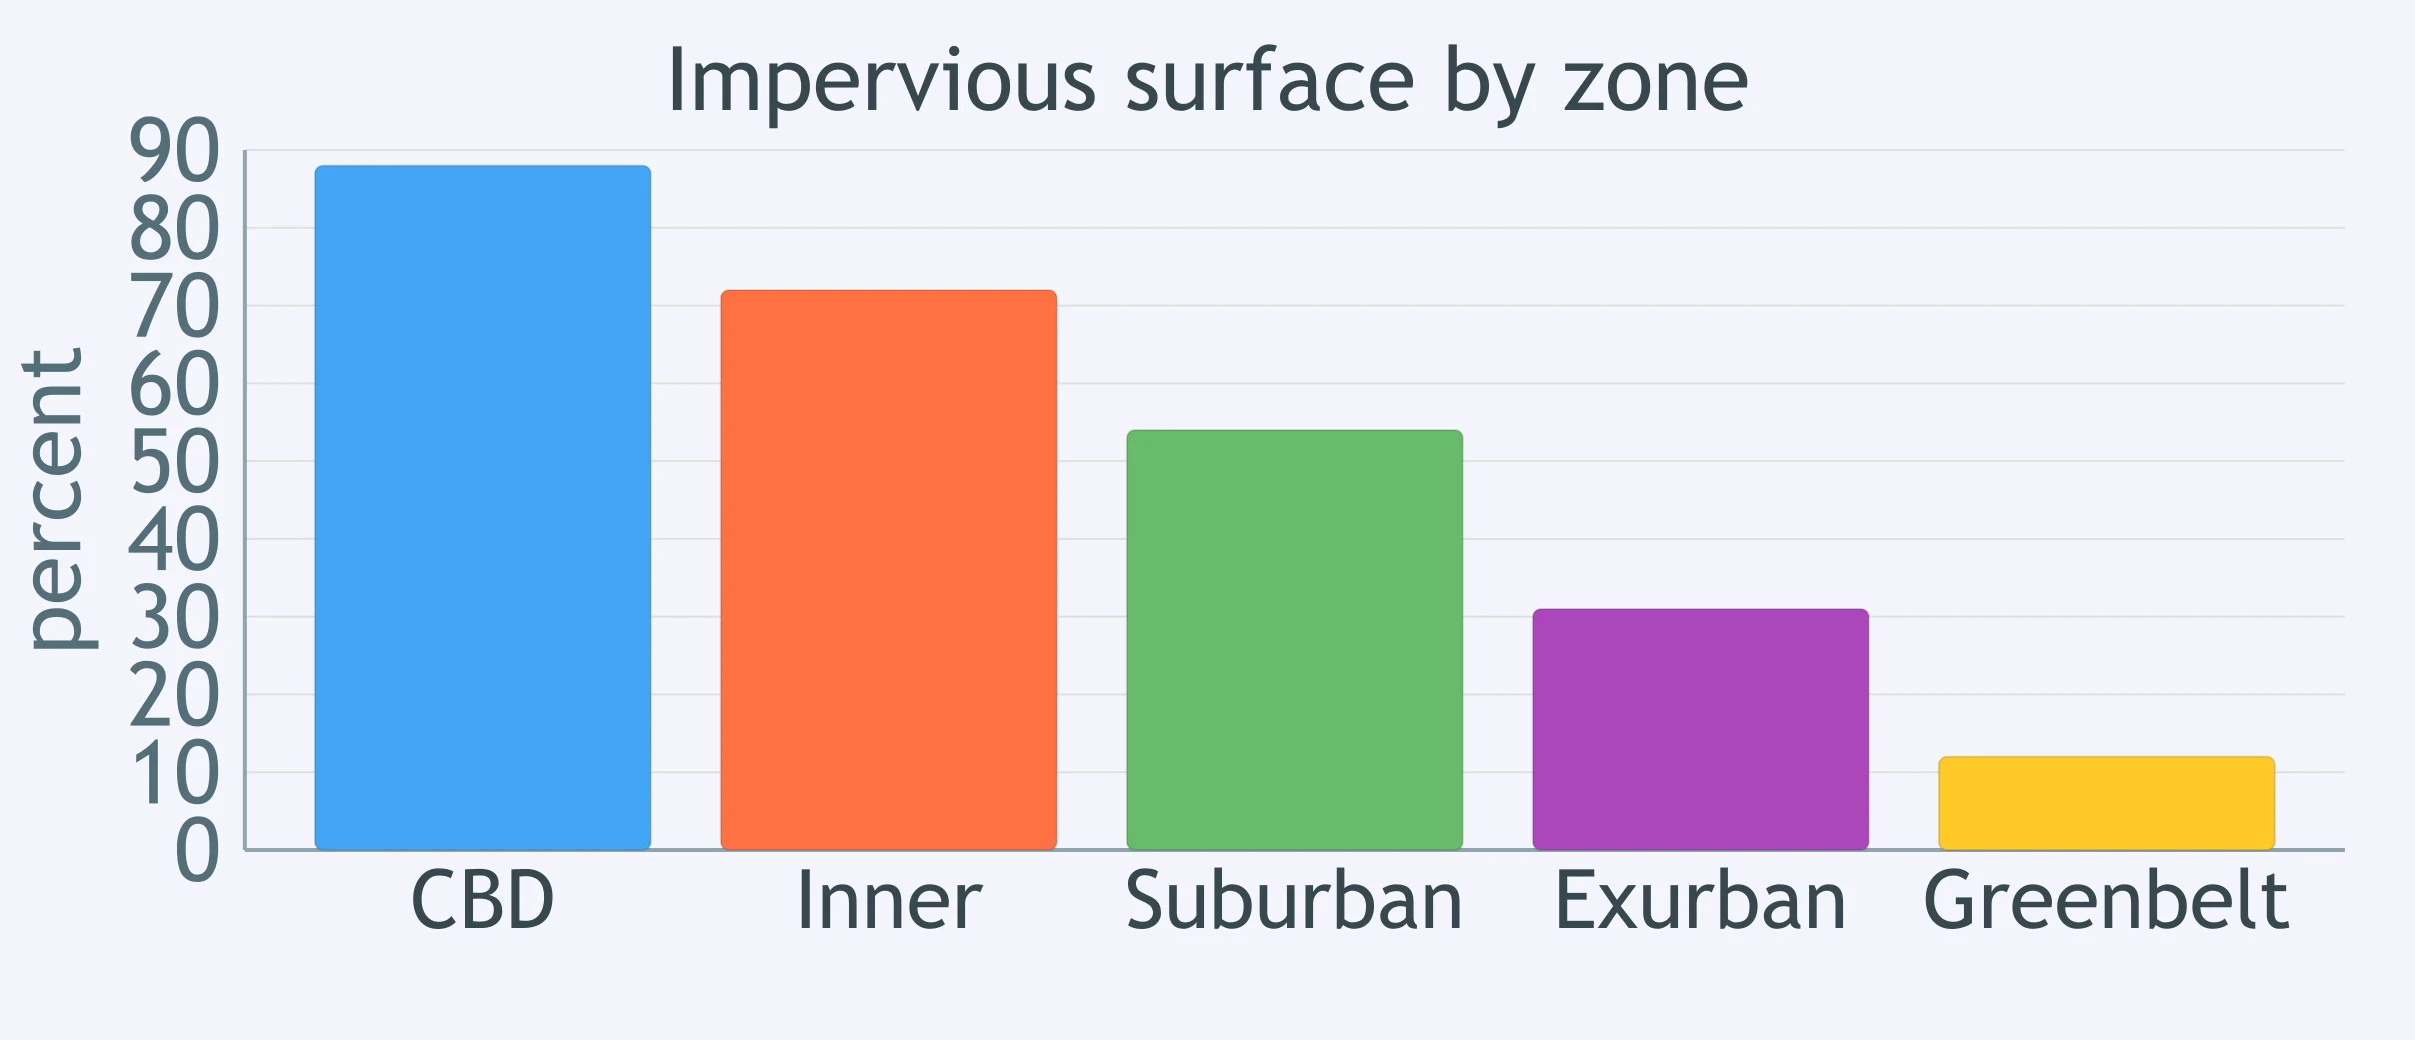
Use the bar graph. Which comparison best describes impervious surface by zone?
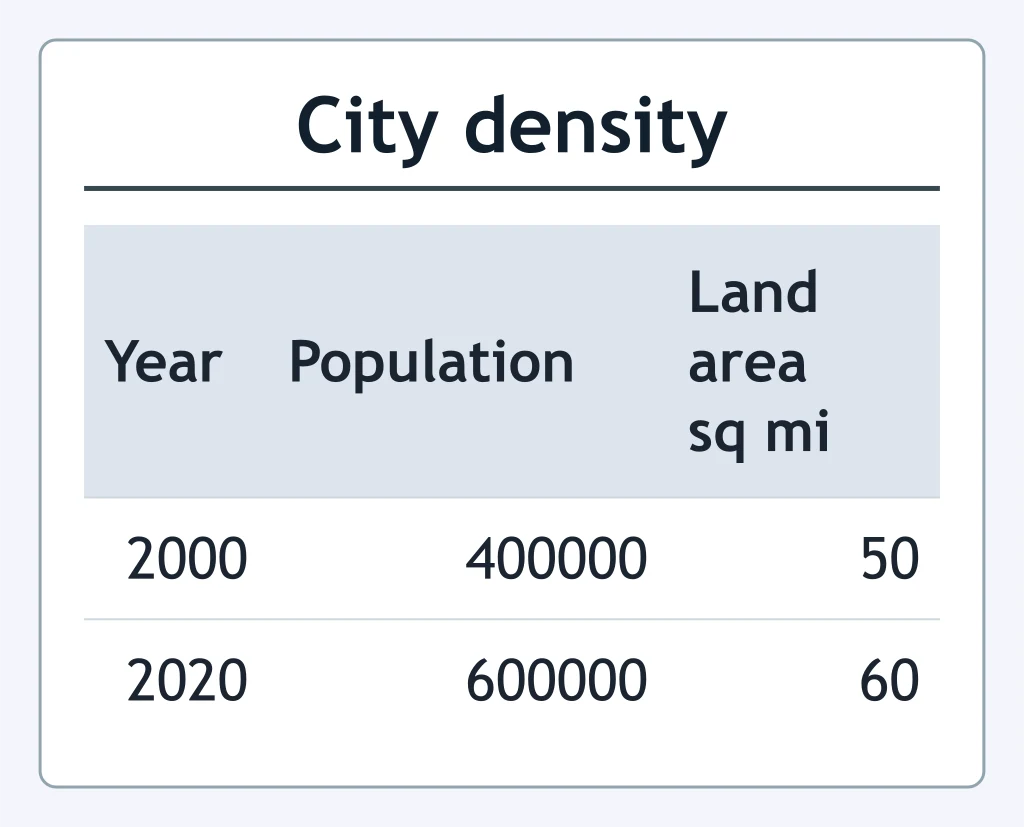
Use the table. By about what percent did population density change from 2000 to 2020?
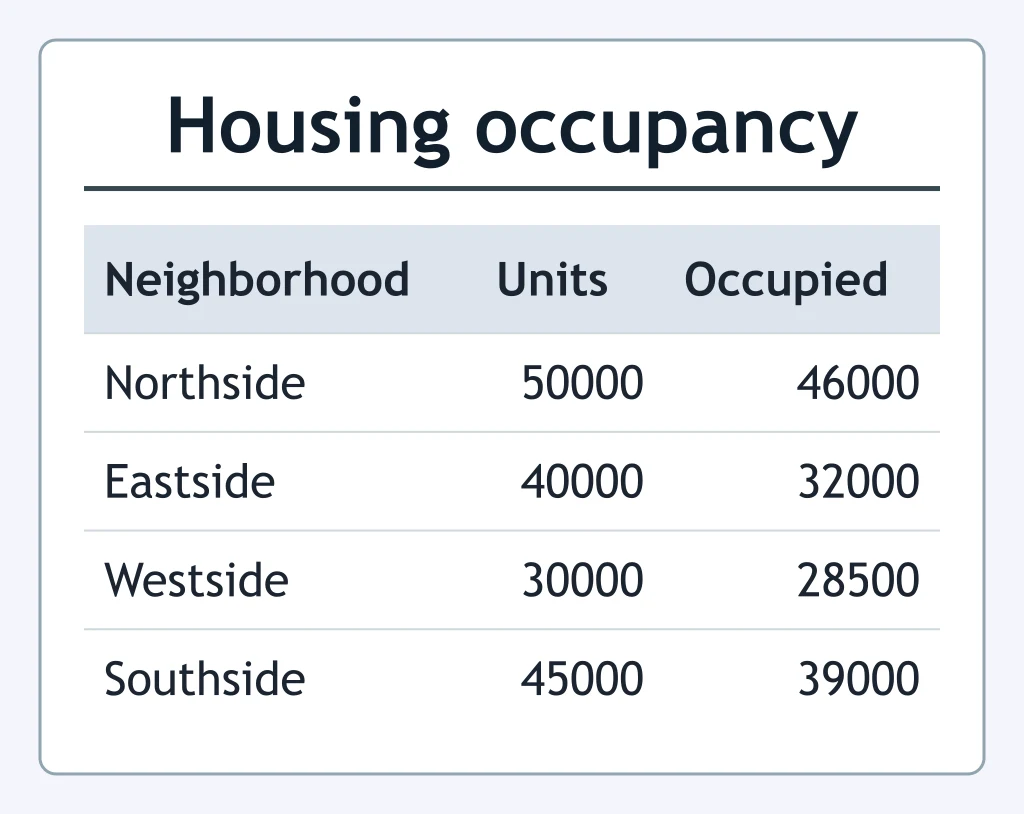
Use the table. Which neighborhood had the highest vacancy rate?
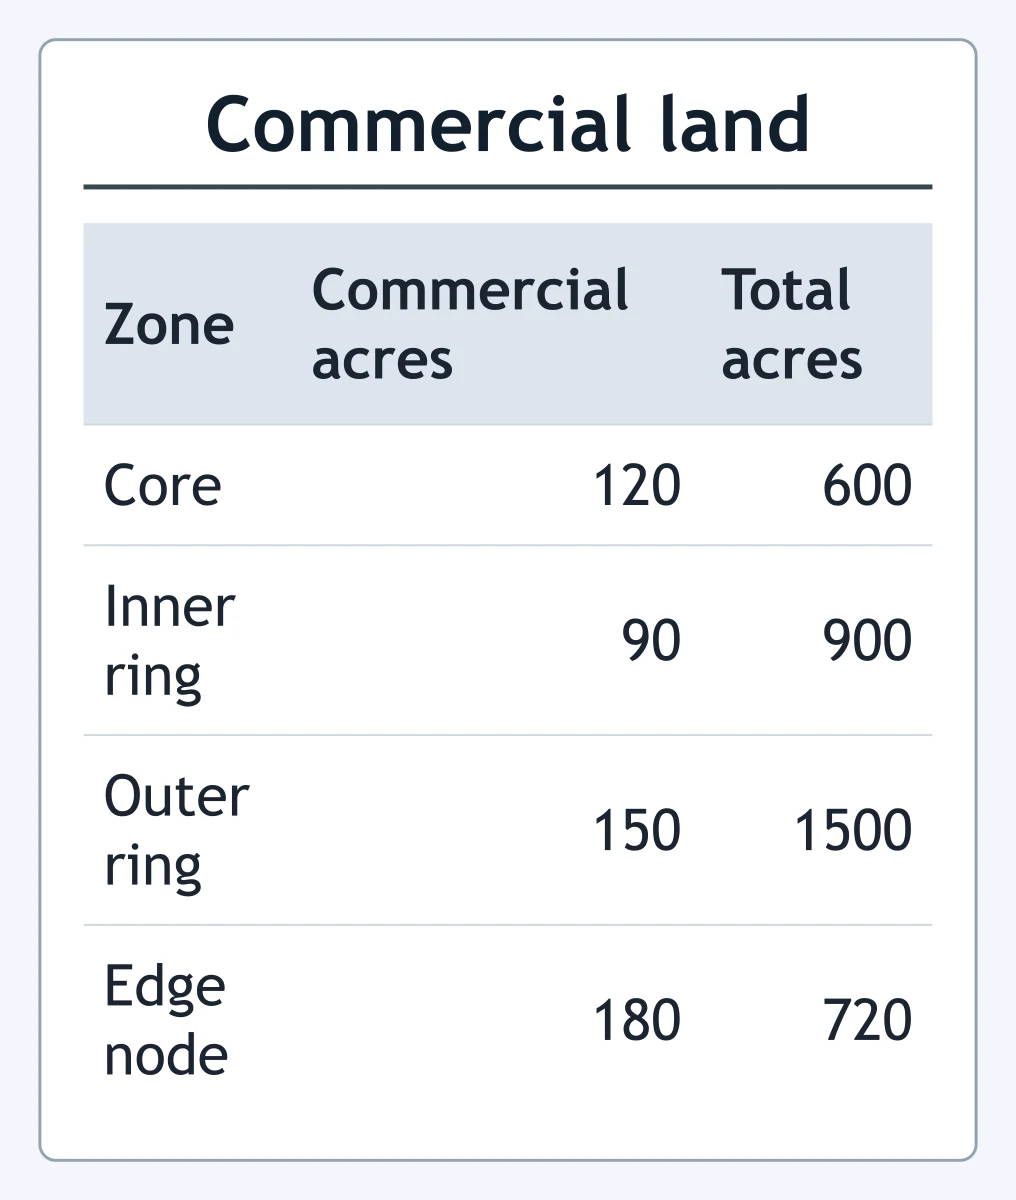
Use the table. Which zone had the greatest commercial share of its total land?
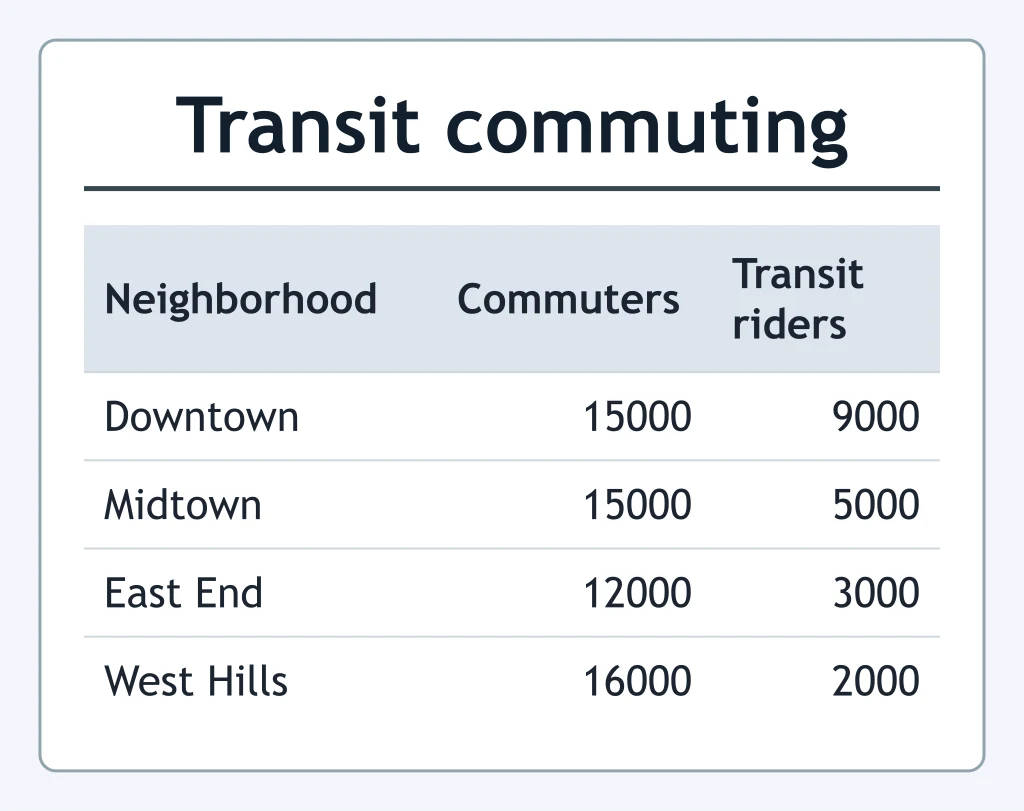
Use the table. Which neighborhood's transit-commuter share is closest to one-third?
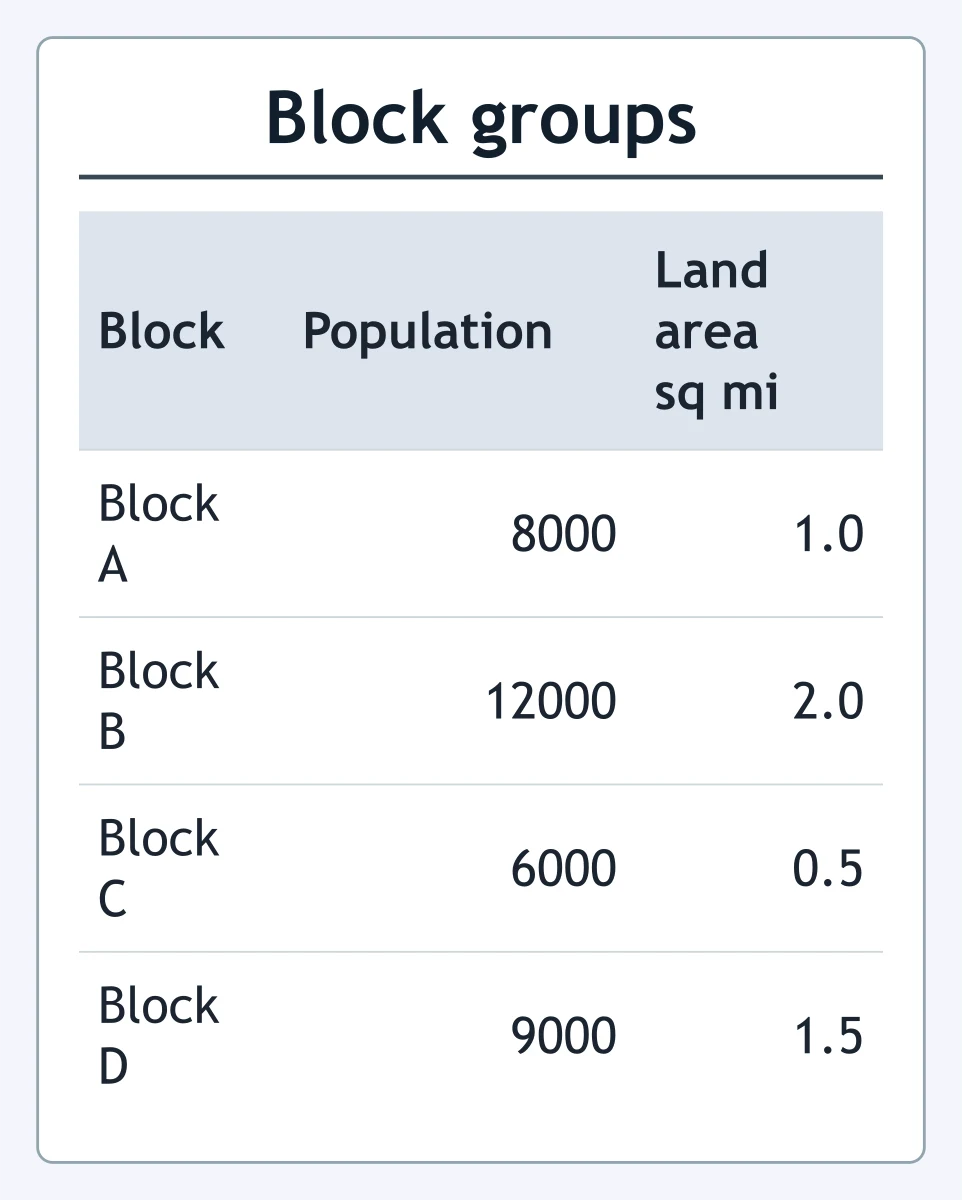
Use the table. Which block group had the highest population density?
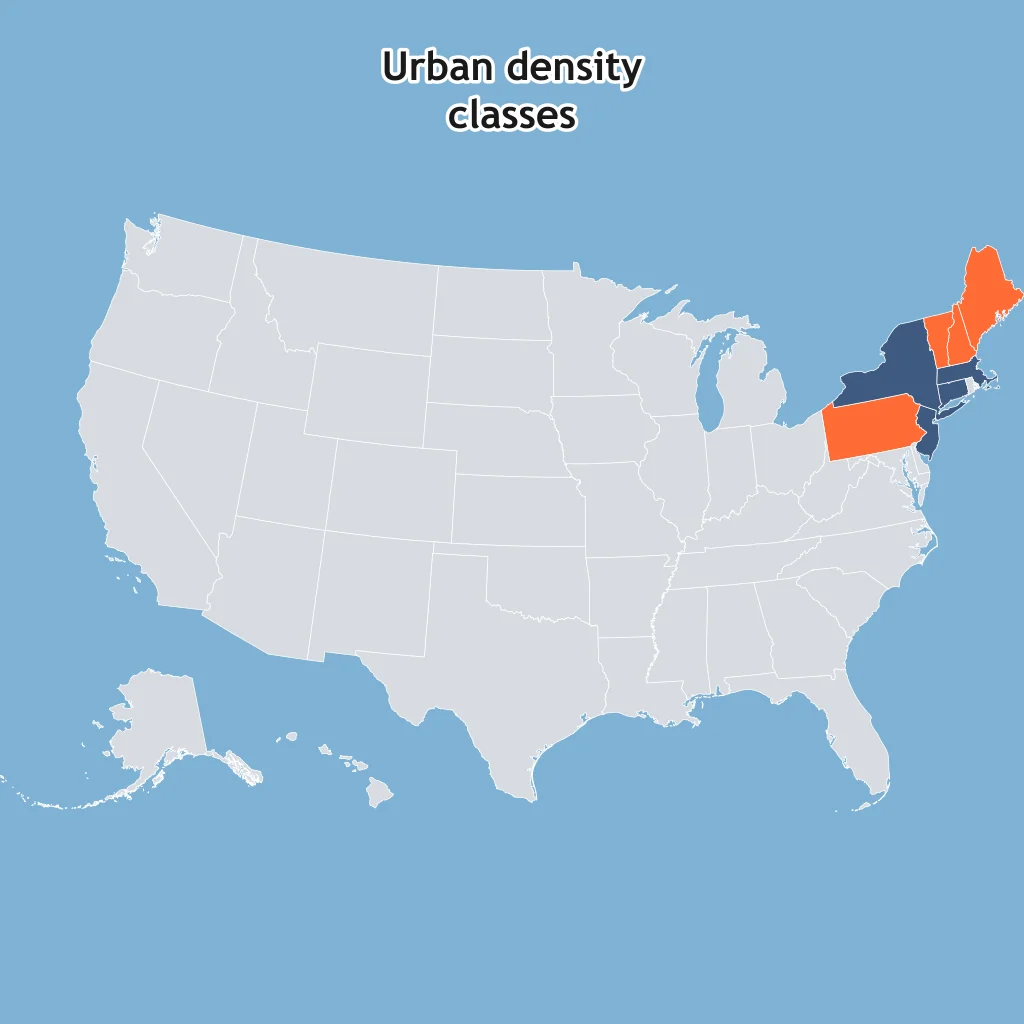
On the choropleth, darker shading marks the higher urban-density class. What spatial pattern is shown?
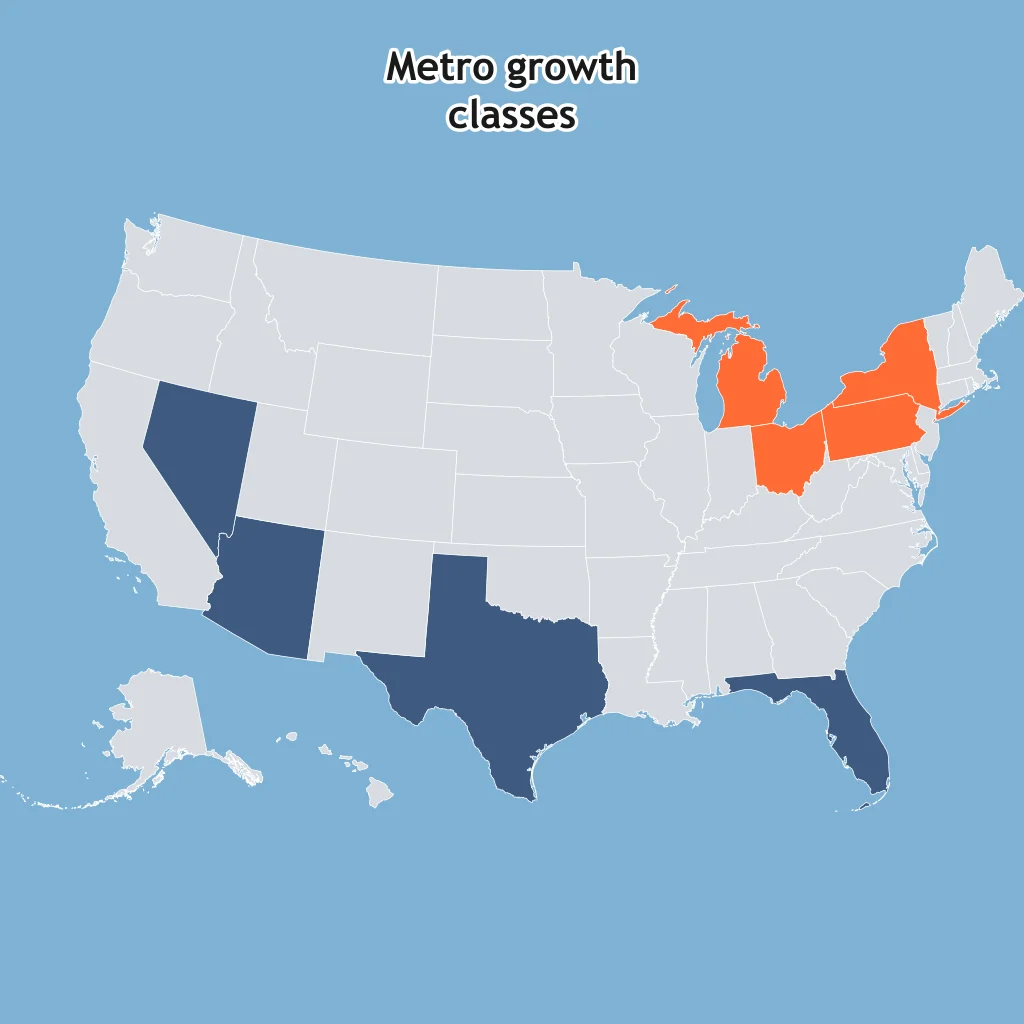
On the choropleth, darker shading marks the higher metro-growth class. What pattern does the map support?
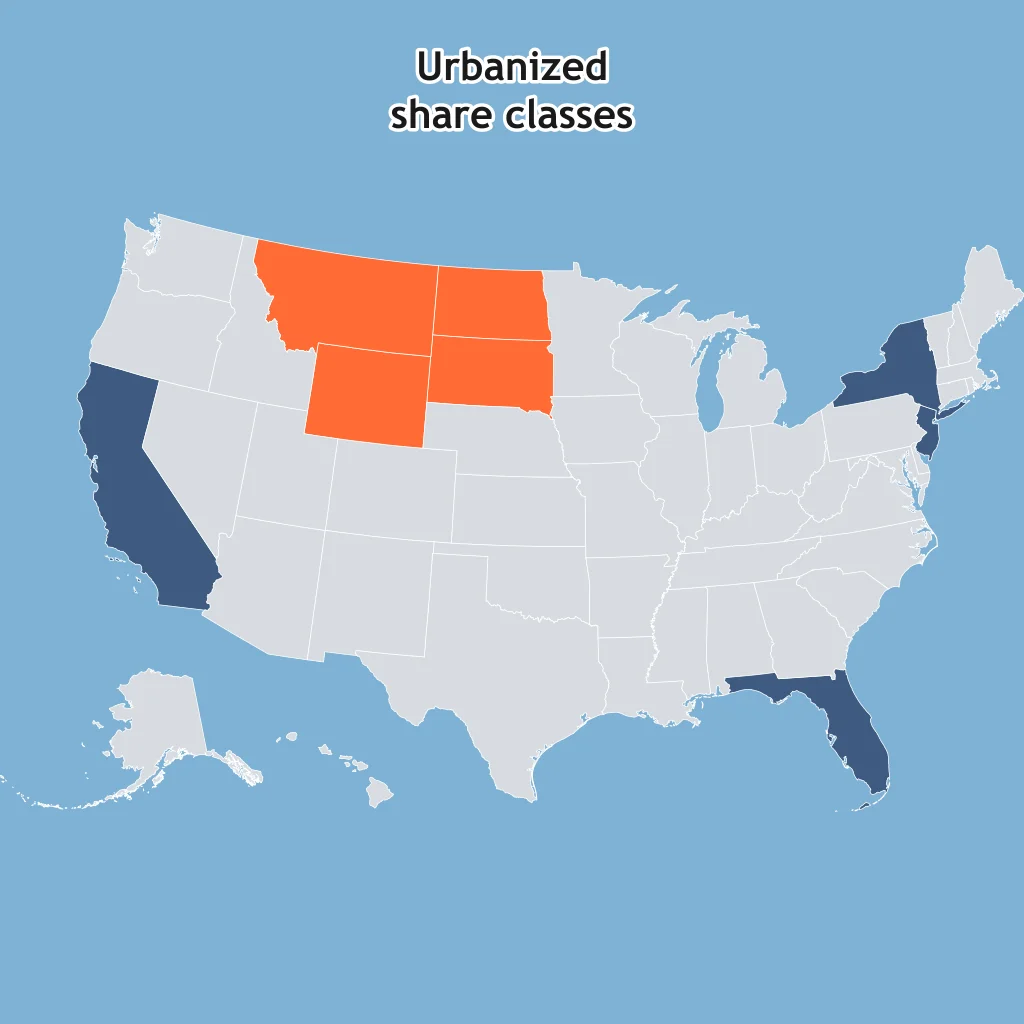
On the choropleth, darker shading marks the higher urbanized-share class. Which spatial pattern is supported?
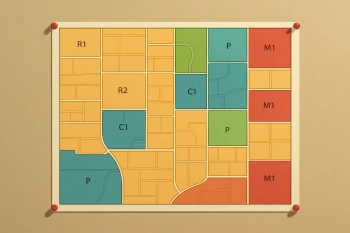
Density, Land Use and Zoning
30 questions
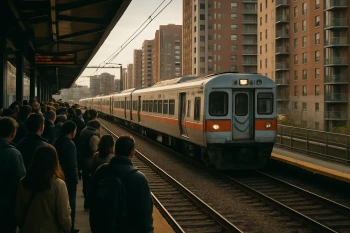
Urban Infrastructure and Transportation
25 questions
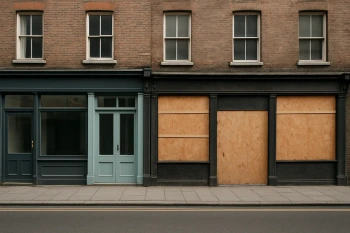
Challenges of Urban Change: Gentrification, Segregation, Housing and Squatter Settlements
40 questions

Urban Sustainability: Smart Growth, New Urbanism and Greenbelts
30 questions

Cities and Urban Land Use: Mixed Review
70 questions
Crack the passcode before the zombies get in.
Answer, then swat bugs for bonus points.
Race through questions at your own speed.
Same question on every screen. Fastest wins.

Pick a tile, answer, hit bonuses and steals.