Loading
by BlastRoom
IELTS Academic Writing Task 1. Proportion language for pie charts.
#writing_task_1#ielts_5_0

40 questions
One question set, multiple game modes. Tap any game to see it in action. Not sure which to pick?
Answer to place stones and capture territory.
Outrun the snow together.
Earn blasts, then hunt the other team.
Answer to earn energy, then climb.

The class blasts through walls together.
Bid on mystery lots. Most money wins.
Sell tours. Nice, standard, or a total scam.

Answer, restock, and serve the rush.
More correct answers pulls the rope your way.
Answer, then shoot down the alien wave.
Answer, then tap to leap the frozen ridge.
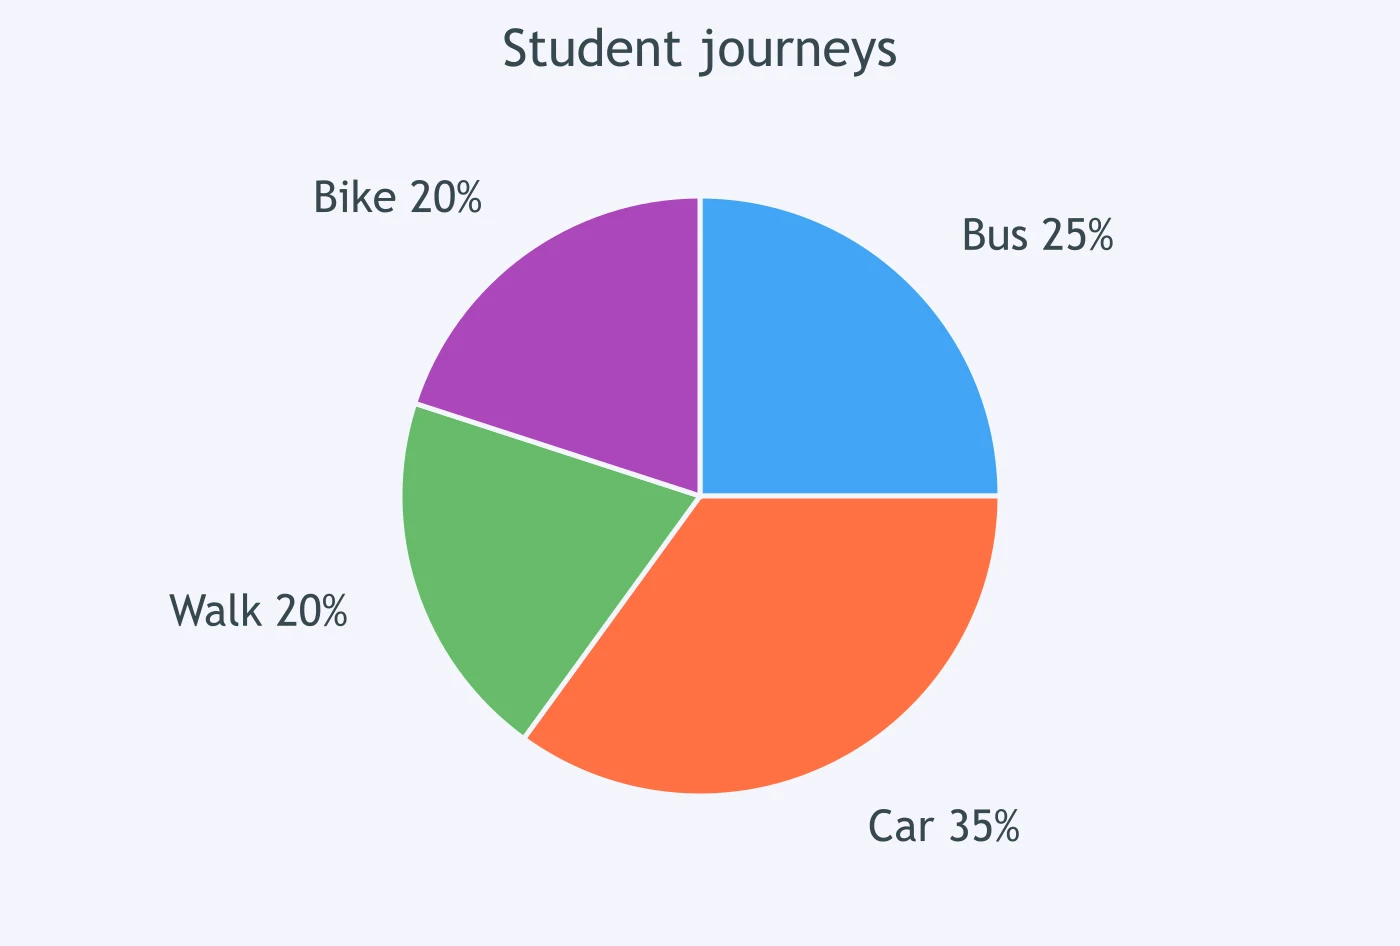
The chart shows that ___ of student journeys were by bus.
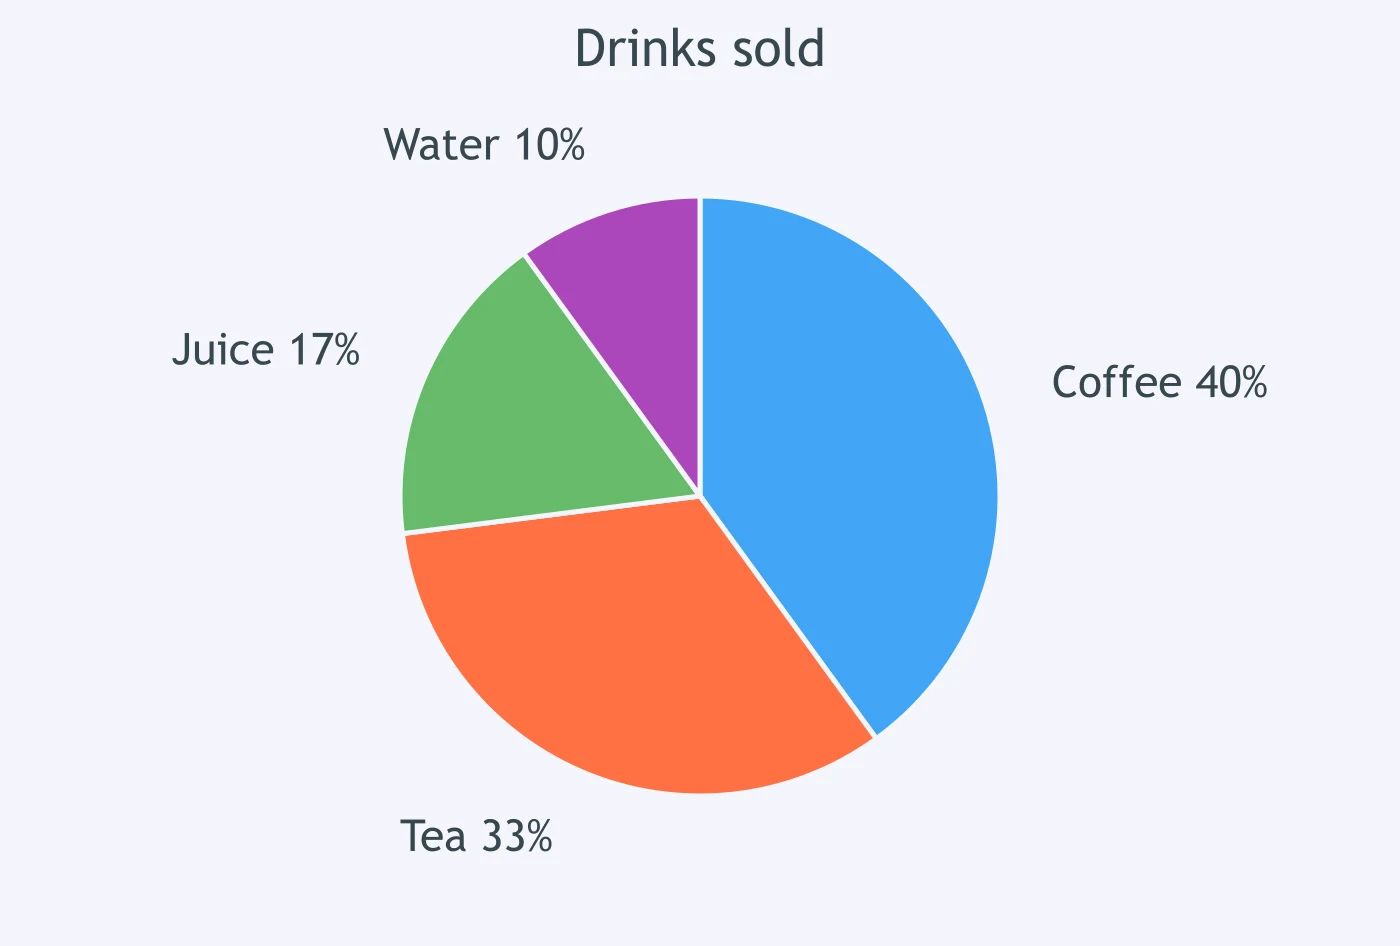
The chart shows that ___ of drinks sold were tea.
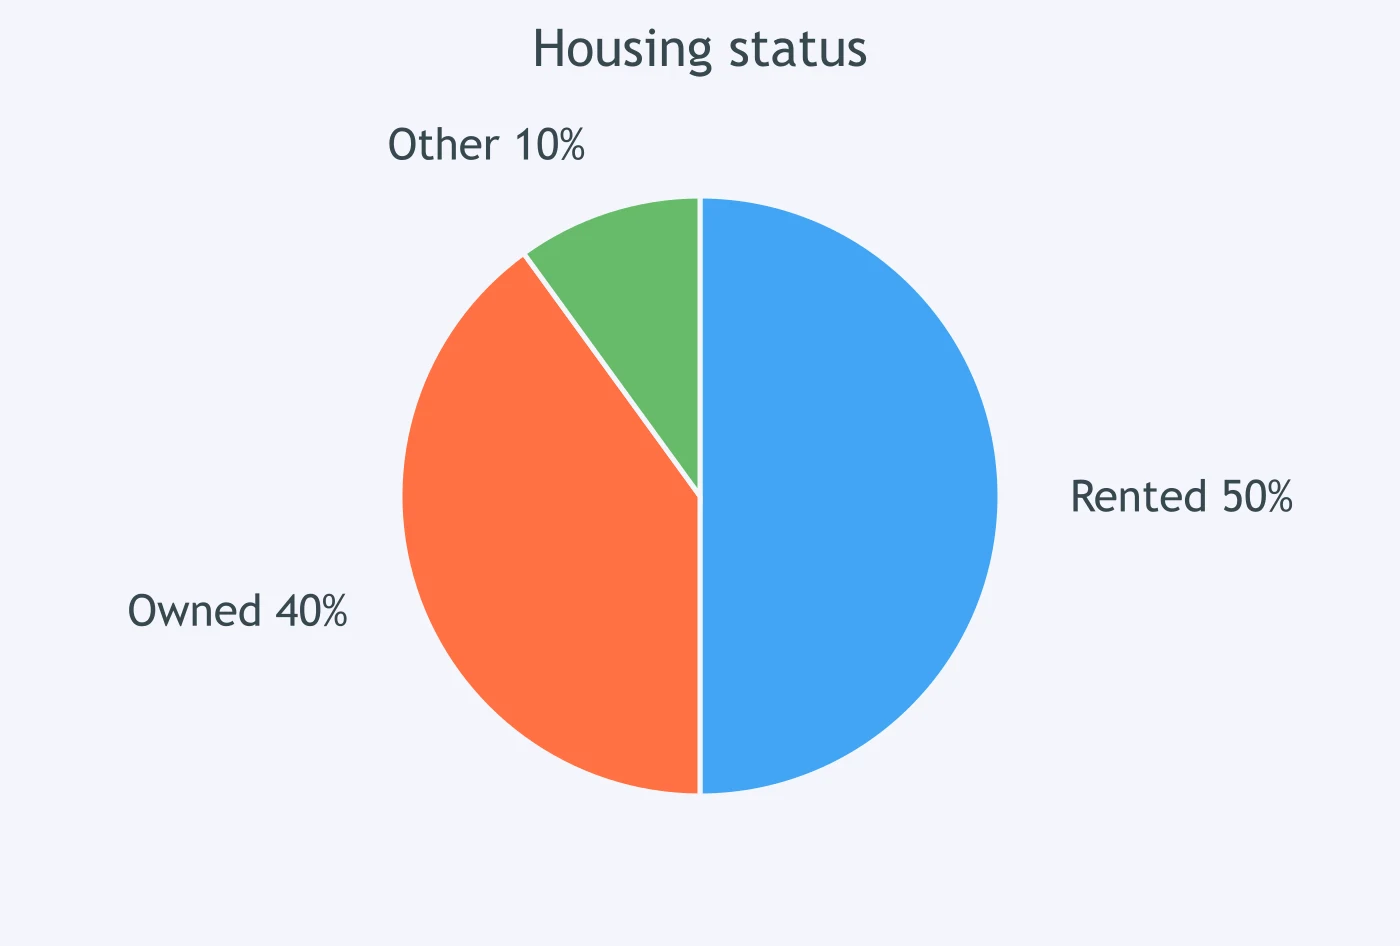
The chart shows that ___ of households rented their home.
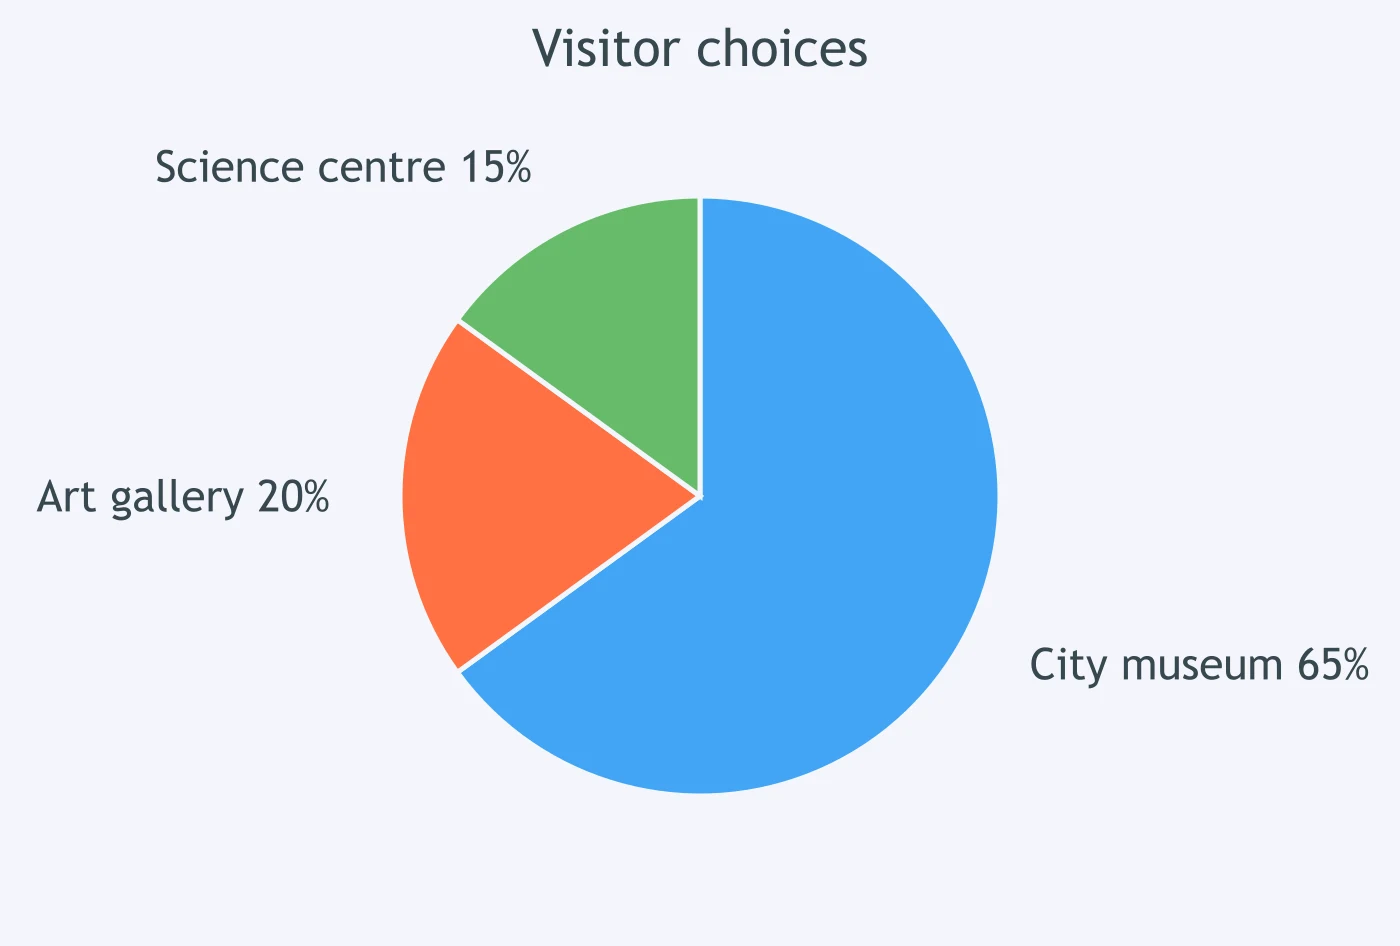
The chart shows that ___ of visitors chose the city museum.
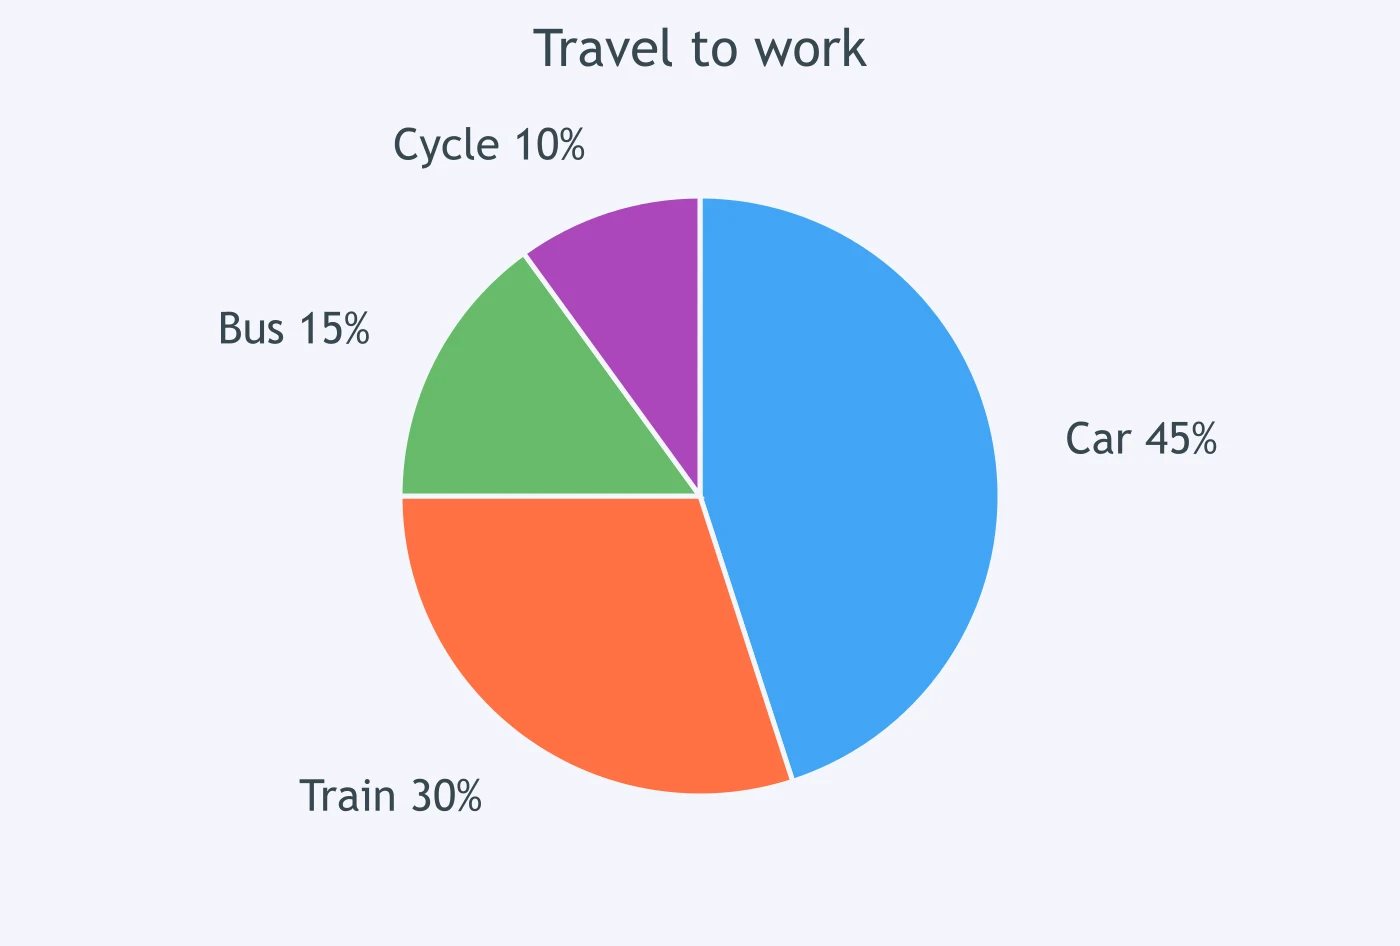
The chart shows that ___ of commuters cycled to work.
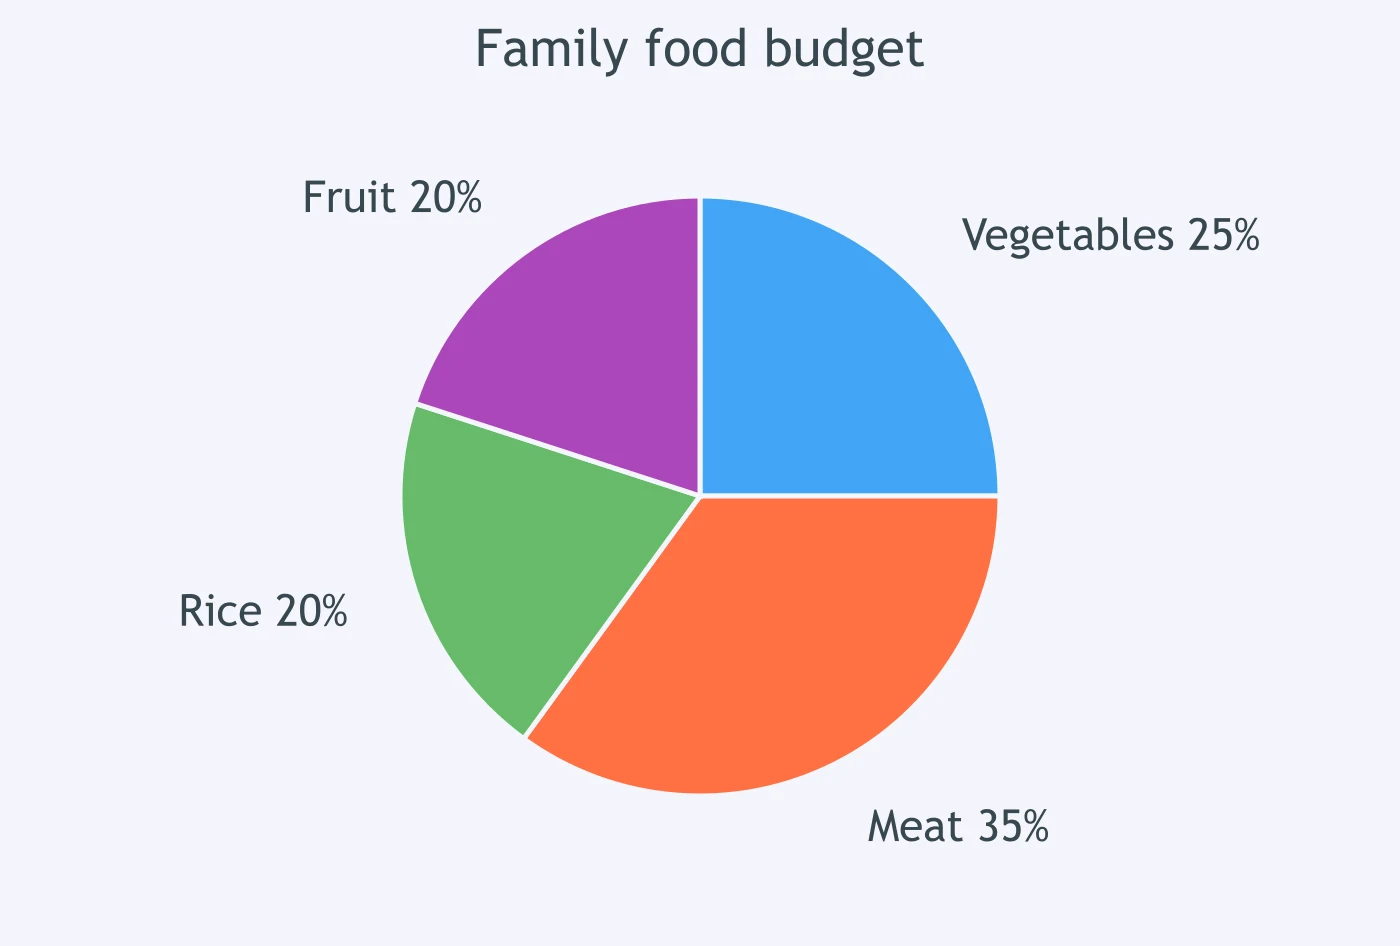
The chart shows that ___ of the food budget was spent on vegetables.
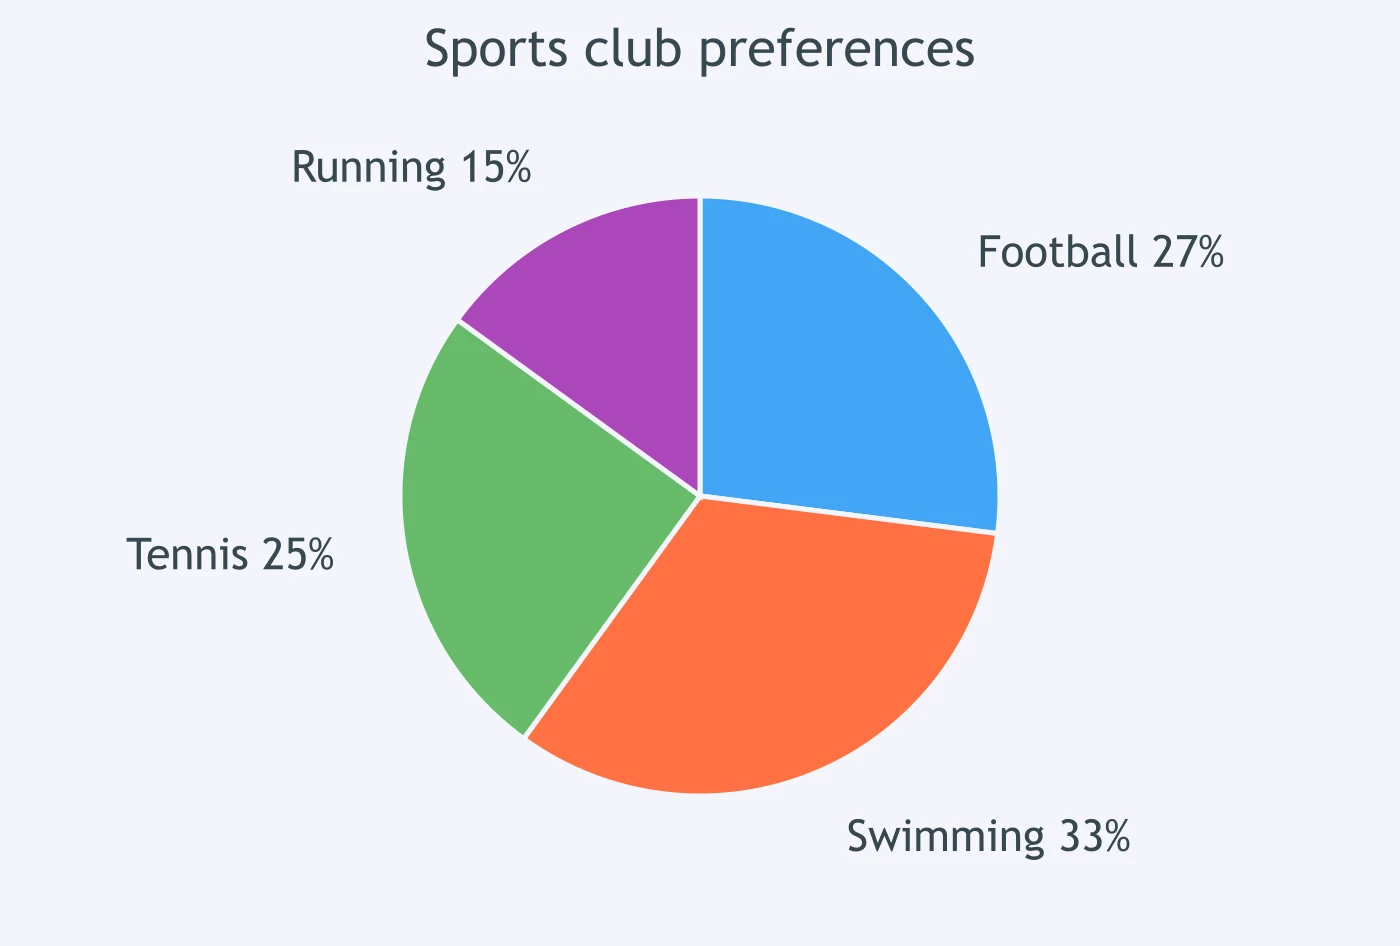
The chart shows that ___ of club members preferred swimming.
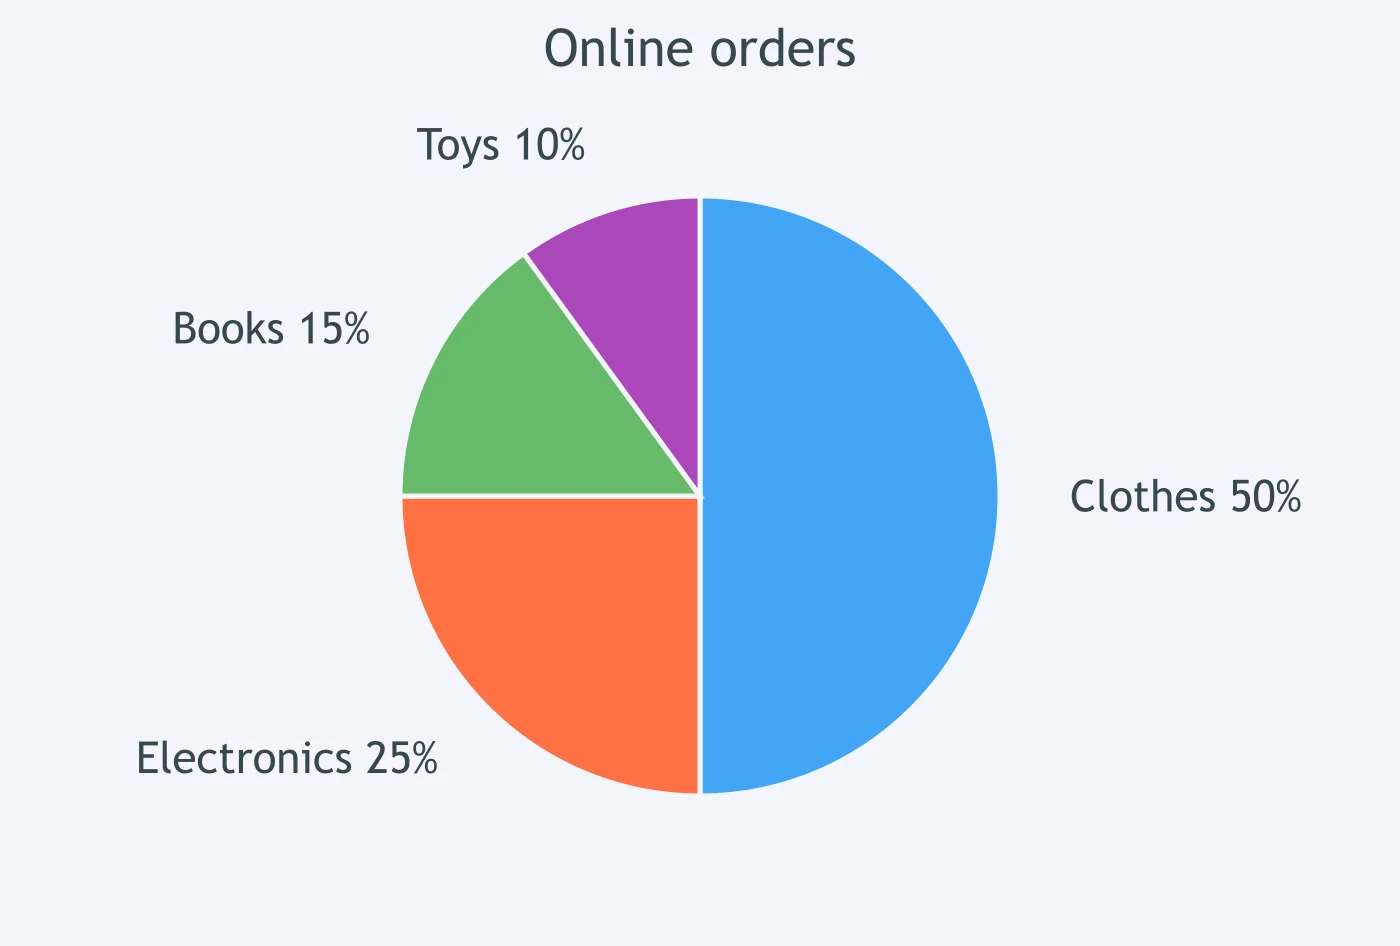
The chart shows that ___ of online orders were for clothes.
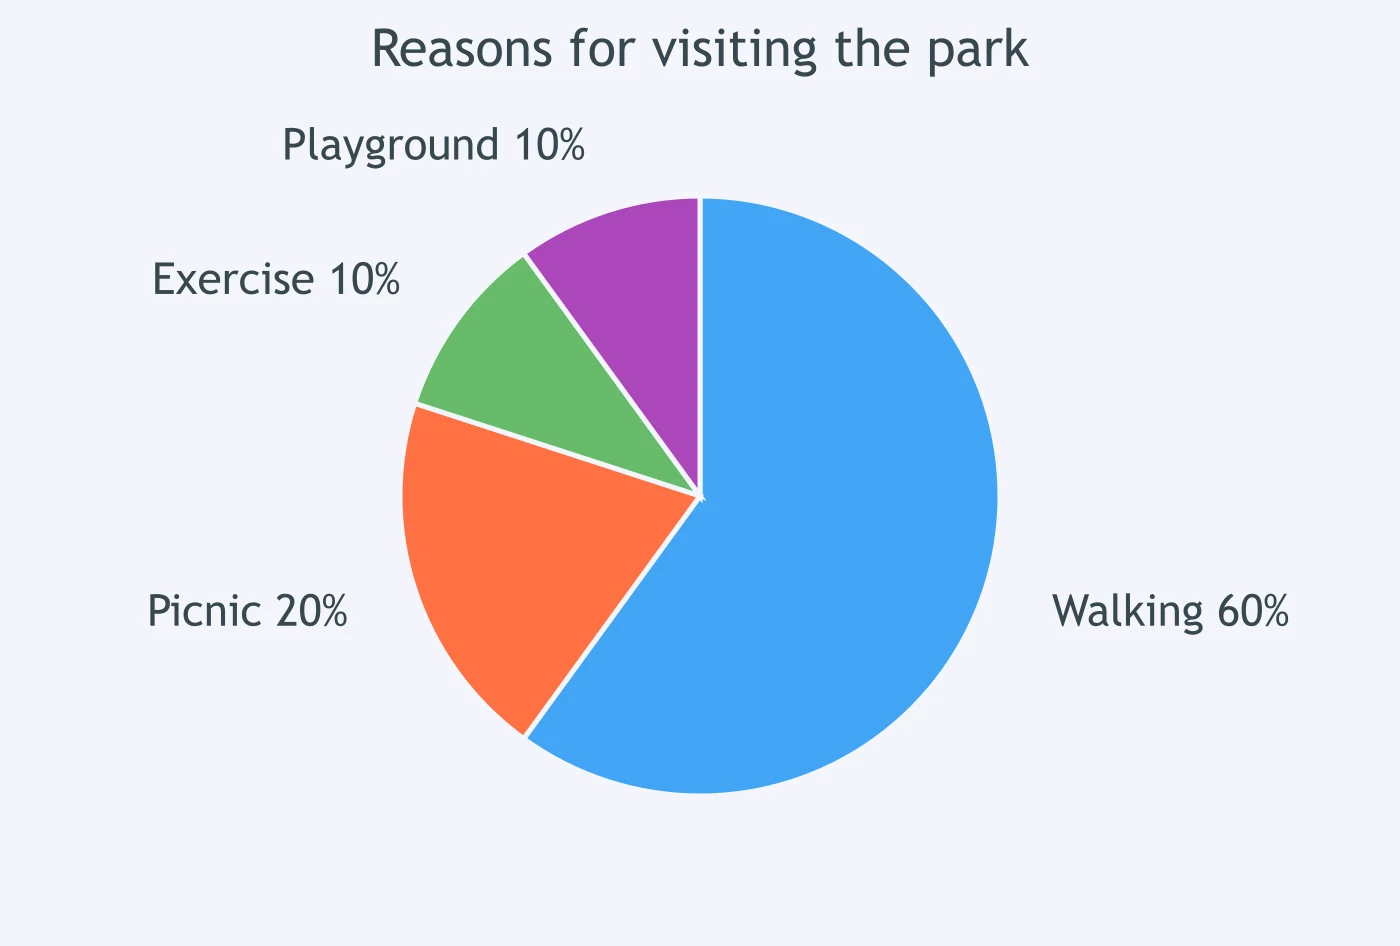
The chart shows that ___ of park visitors came for walking.
The chart shows that ___ of students chose art club.
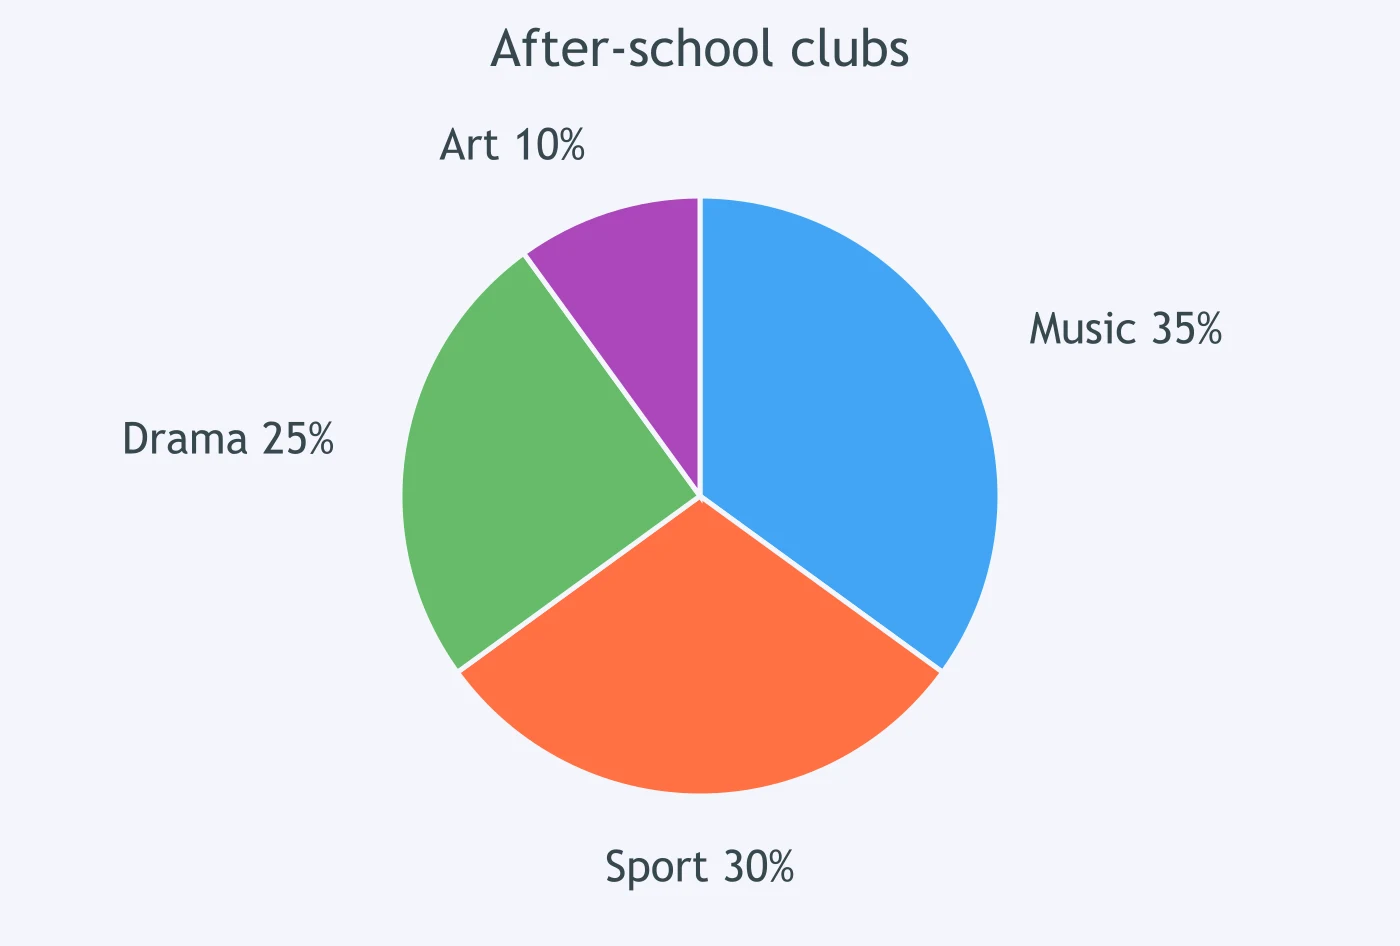
The chart shows that ___ of household energy was used for heating.
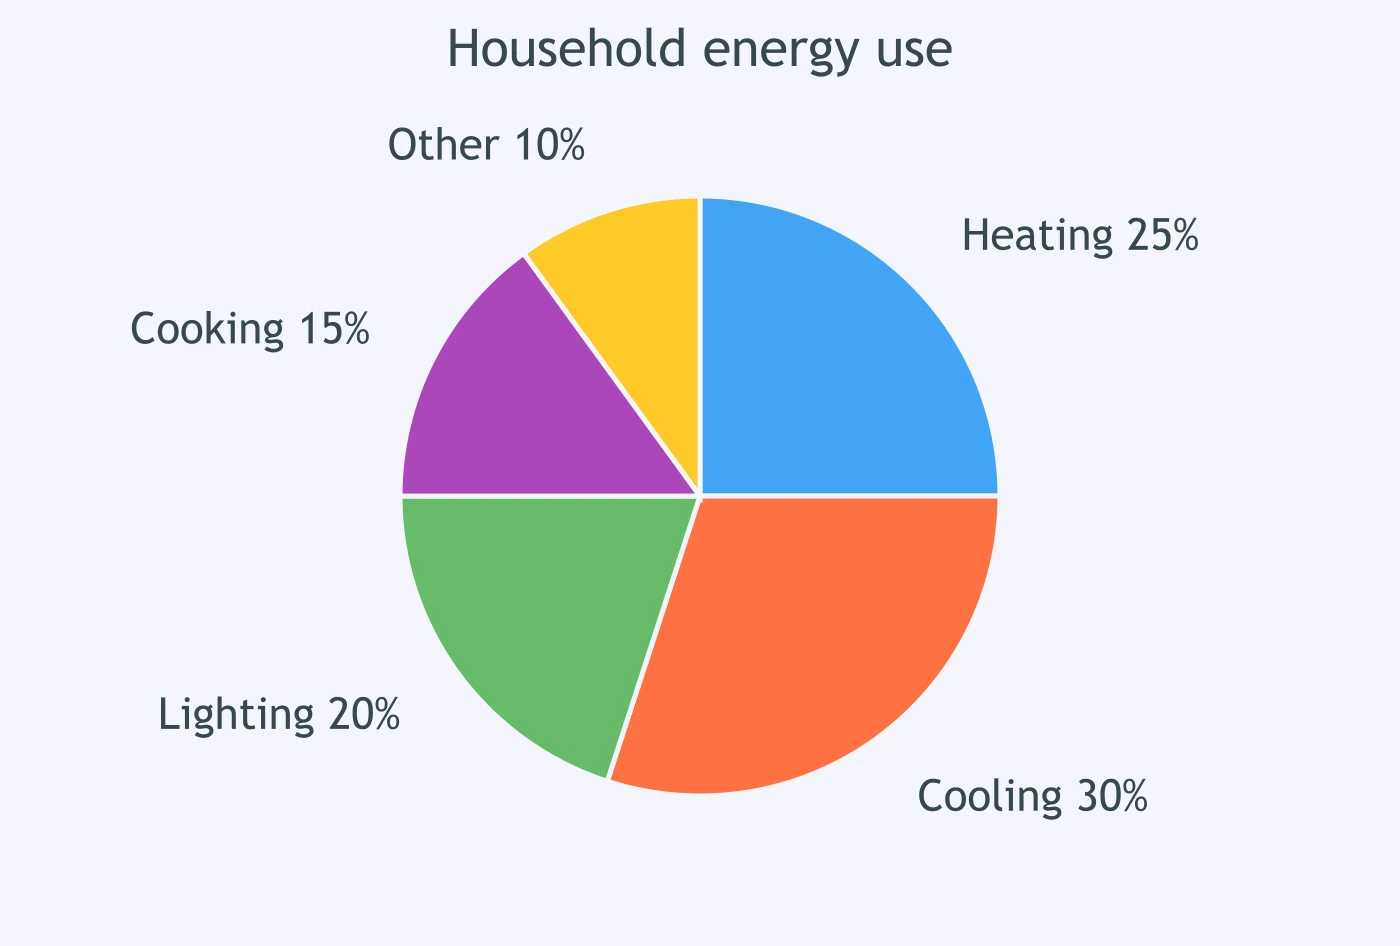
The chart shows that ___ of library users borrowed novels.
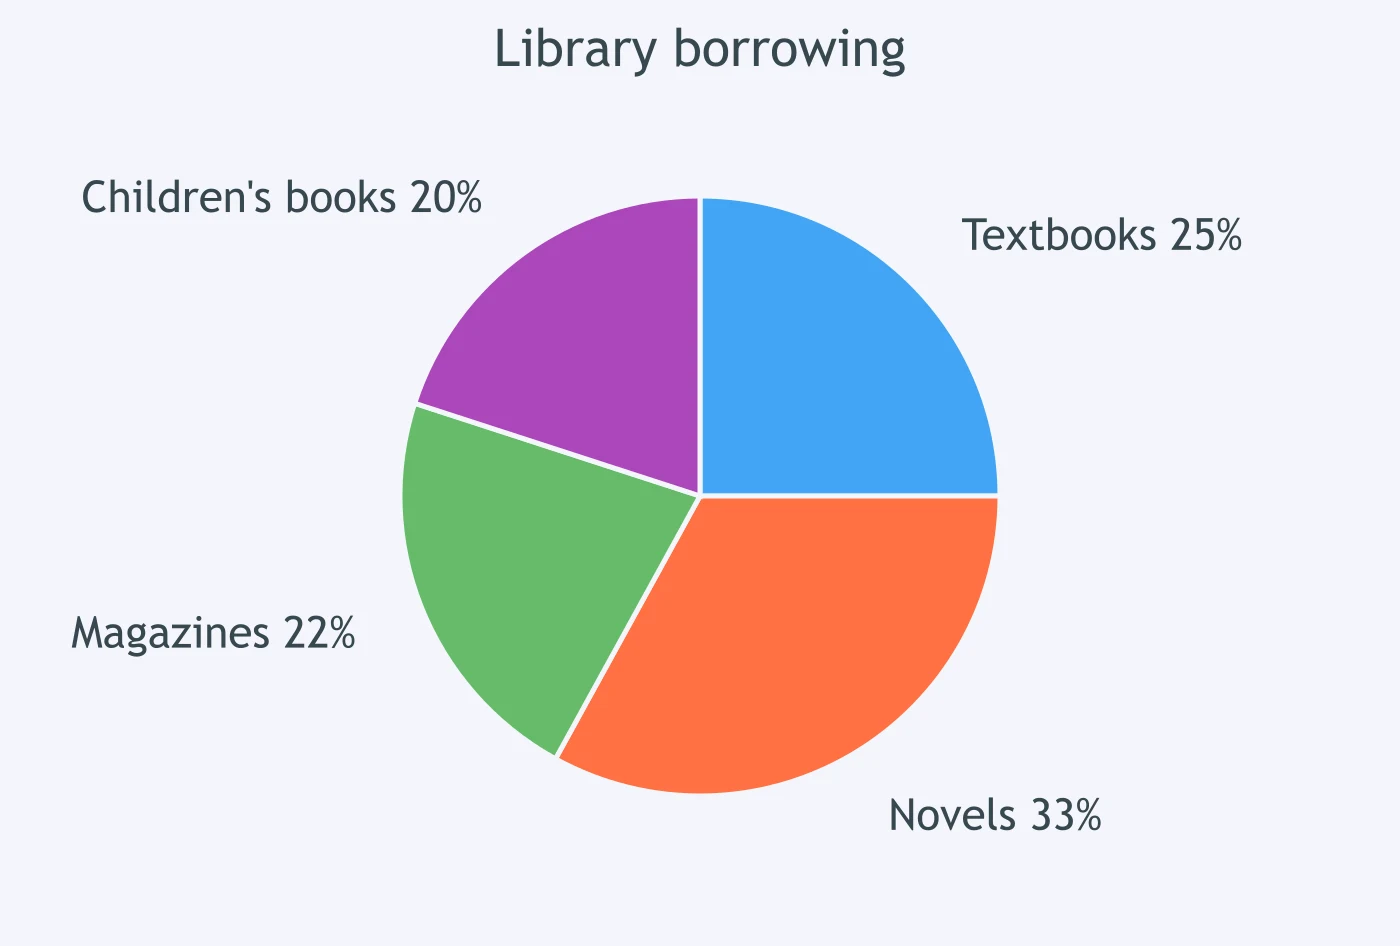
The chart shows that ___ of employees travelled by train.
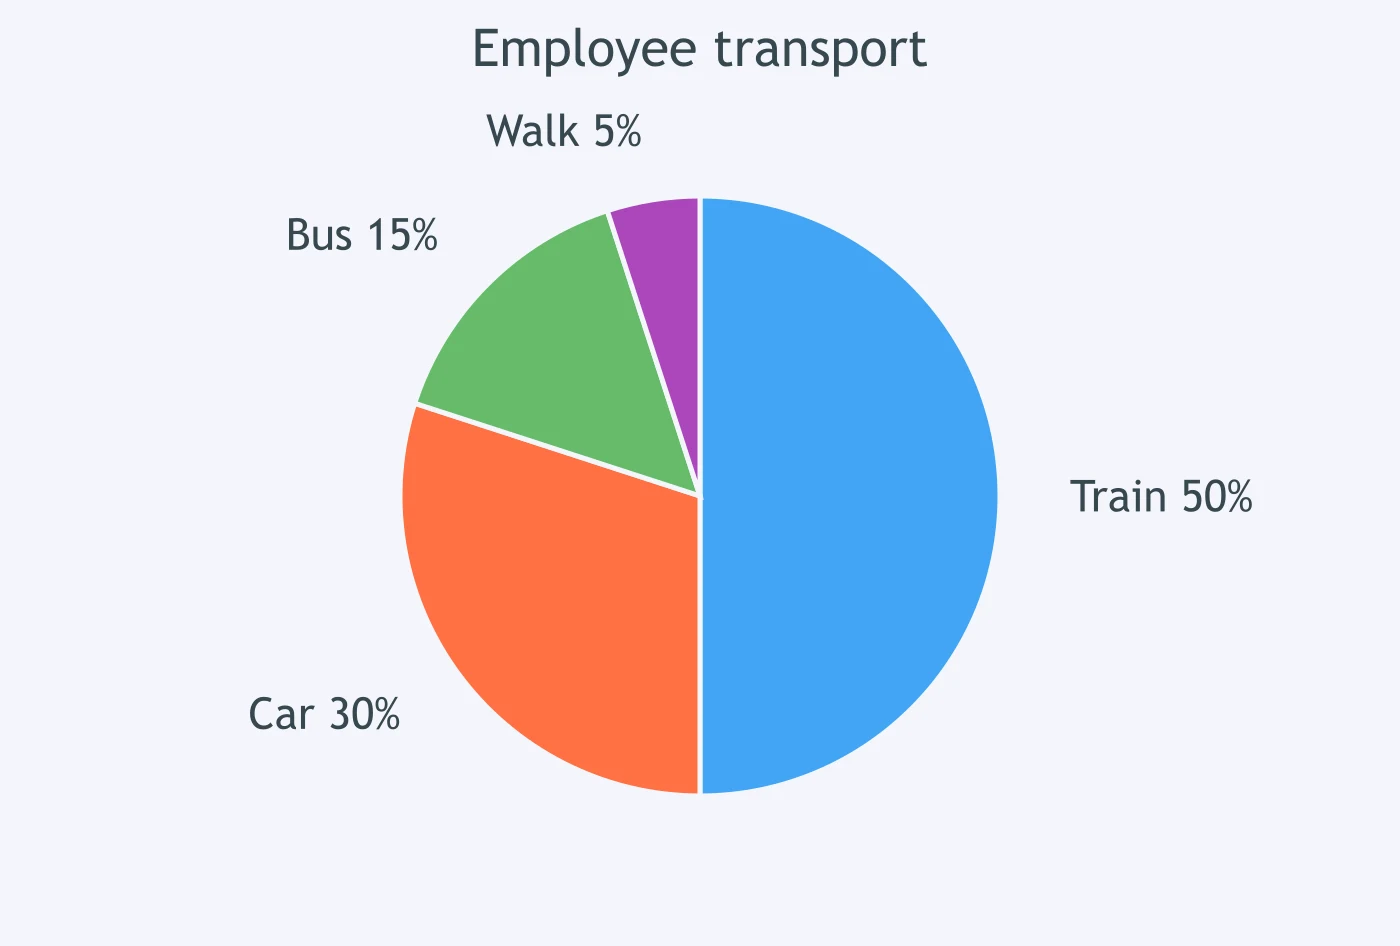
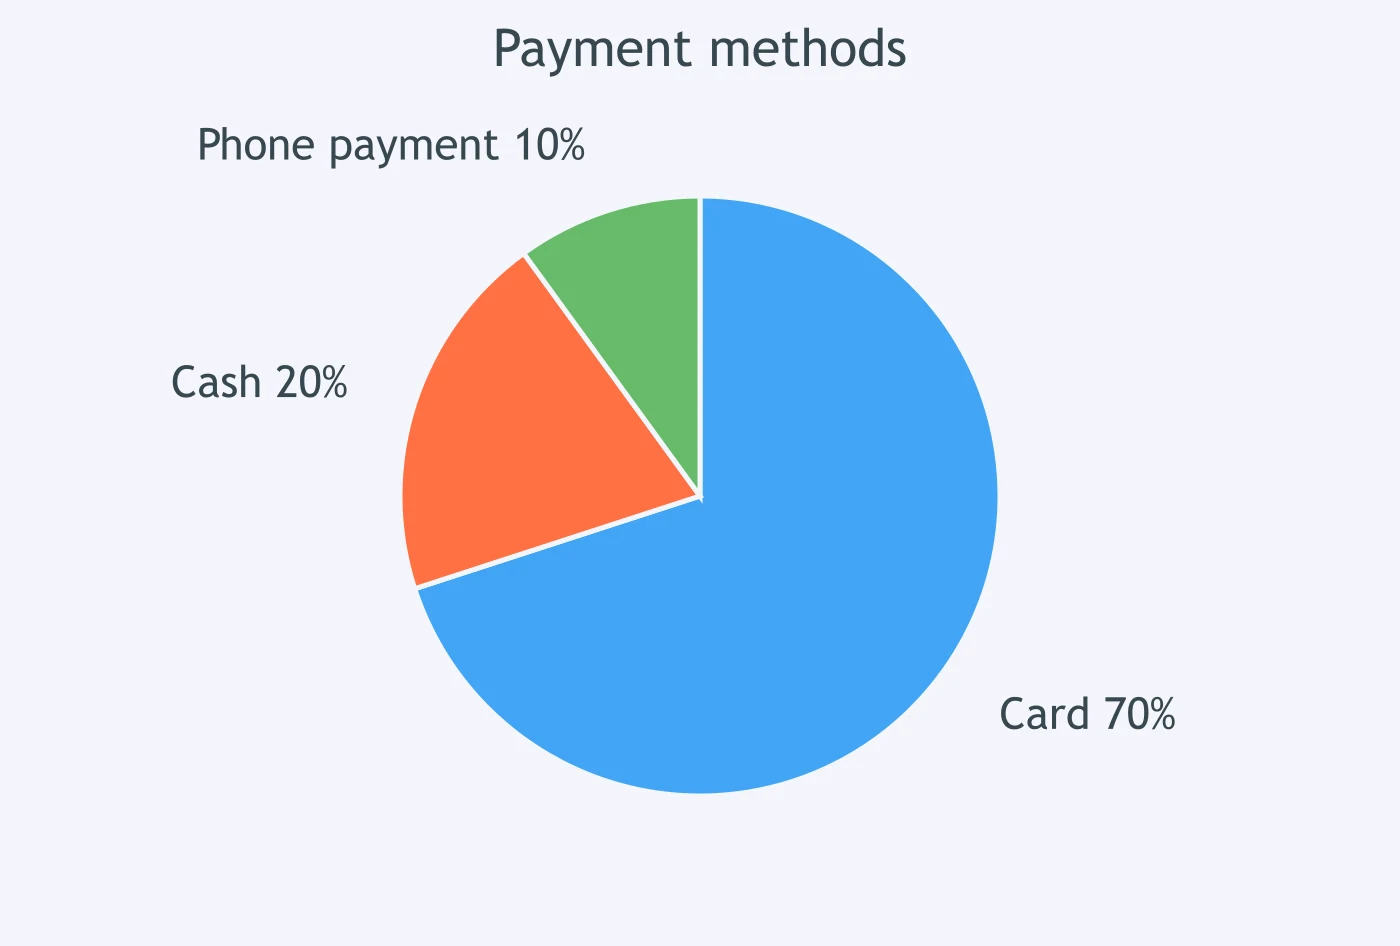
The chart shows that ___ of shoppers paid by card.
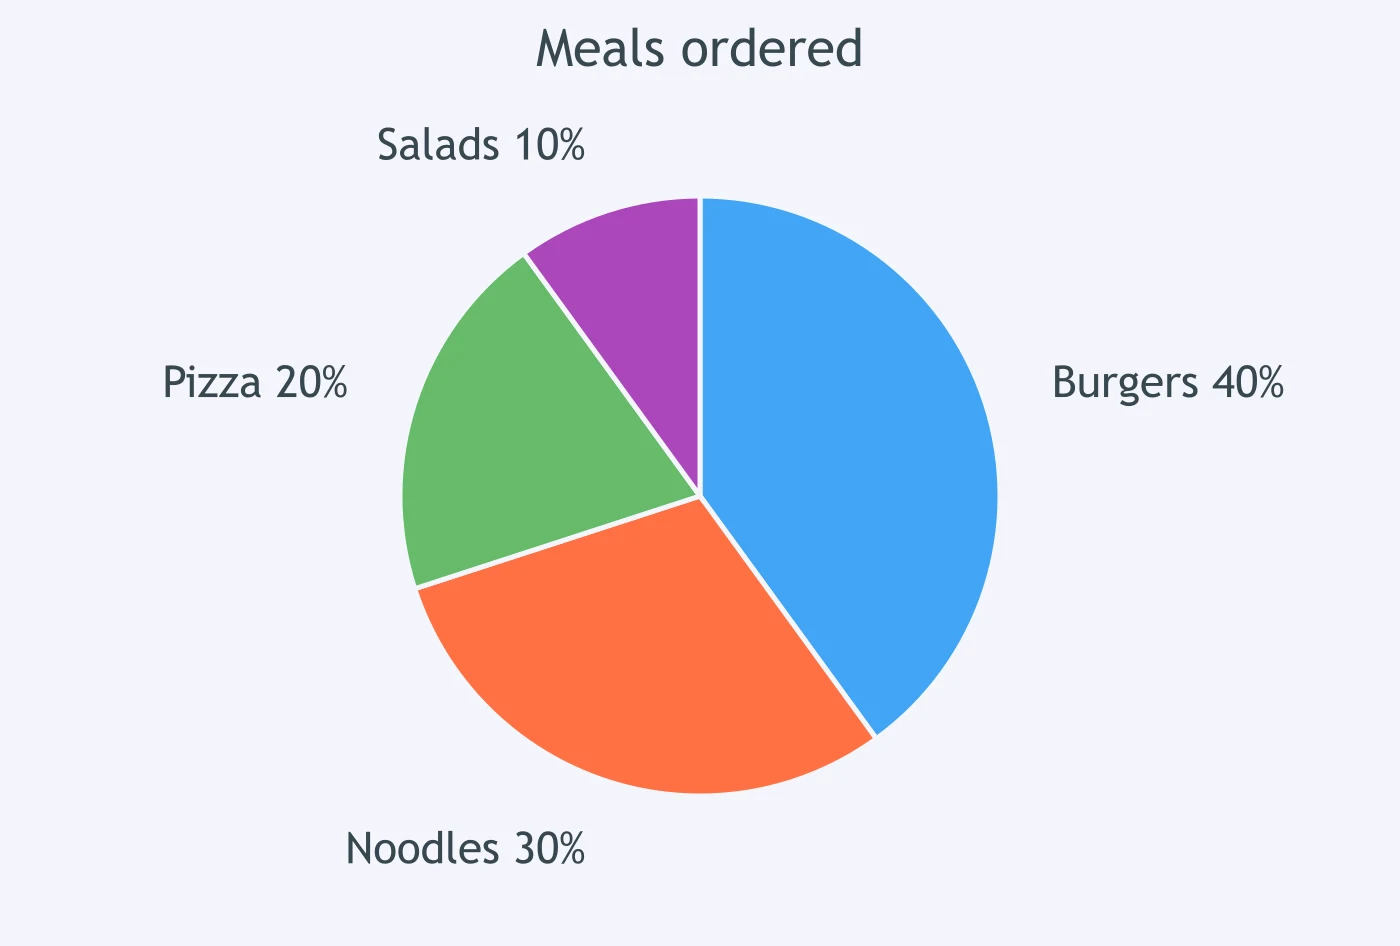
The chart shows that ___ of meals ordered were salads.
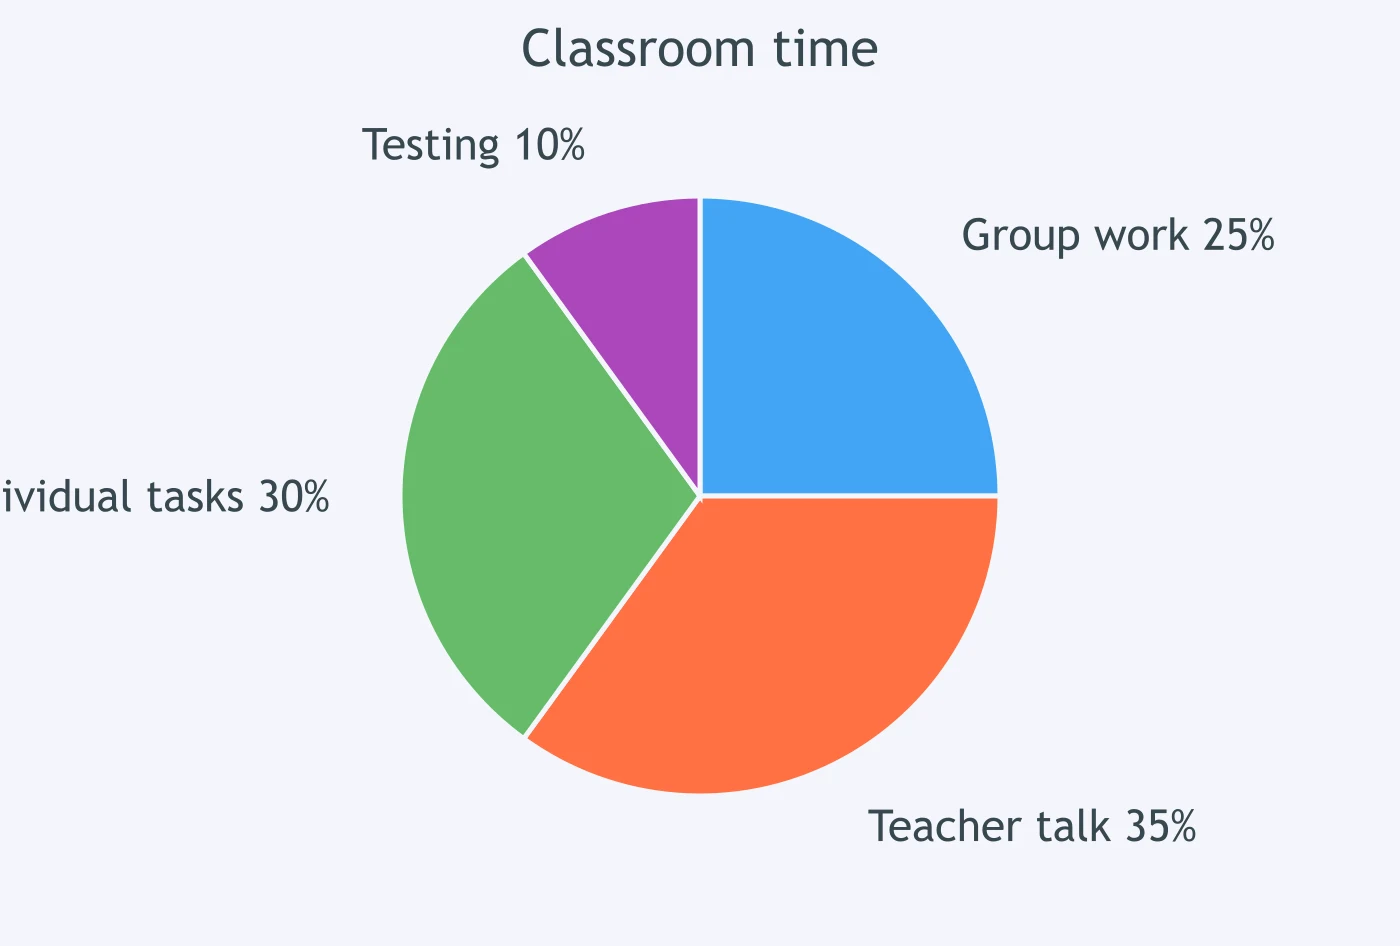
The chart shows that ___ of classroom time was used for group work.
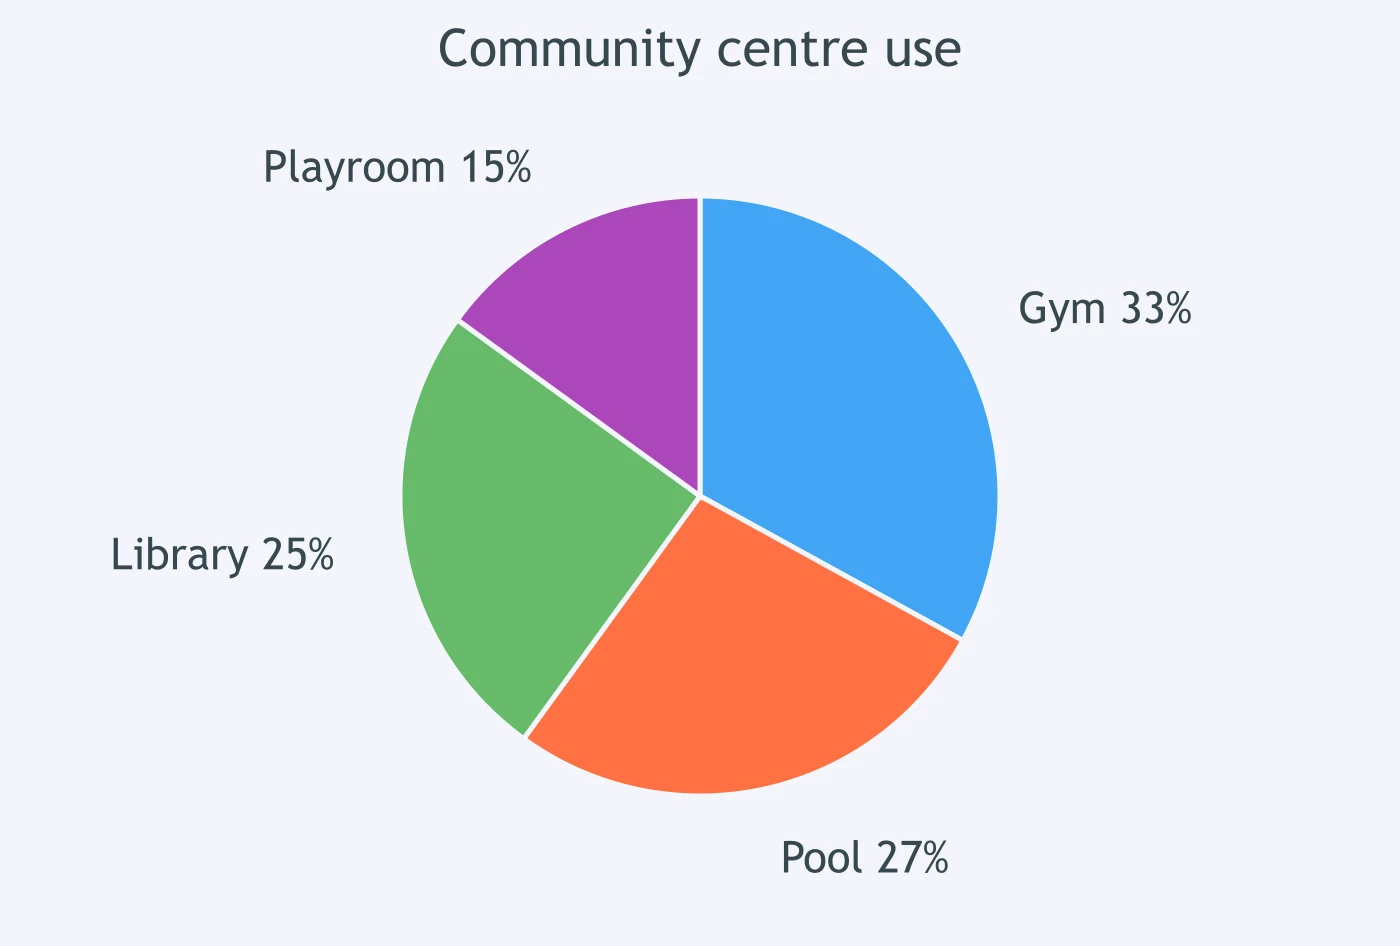
The chart shows that ___ of residents used the community gym.
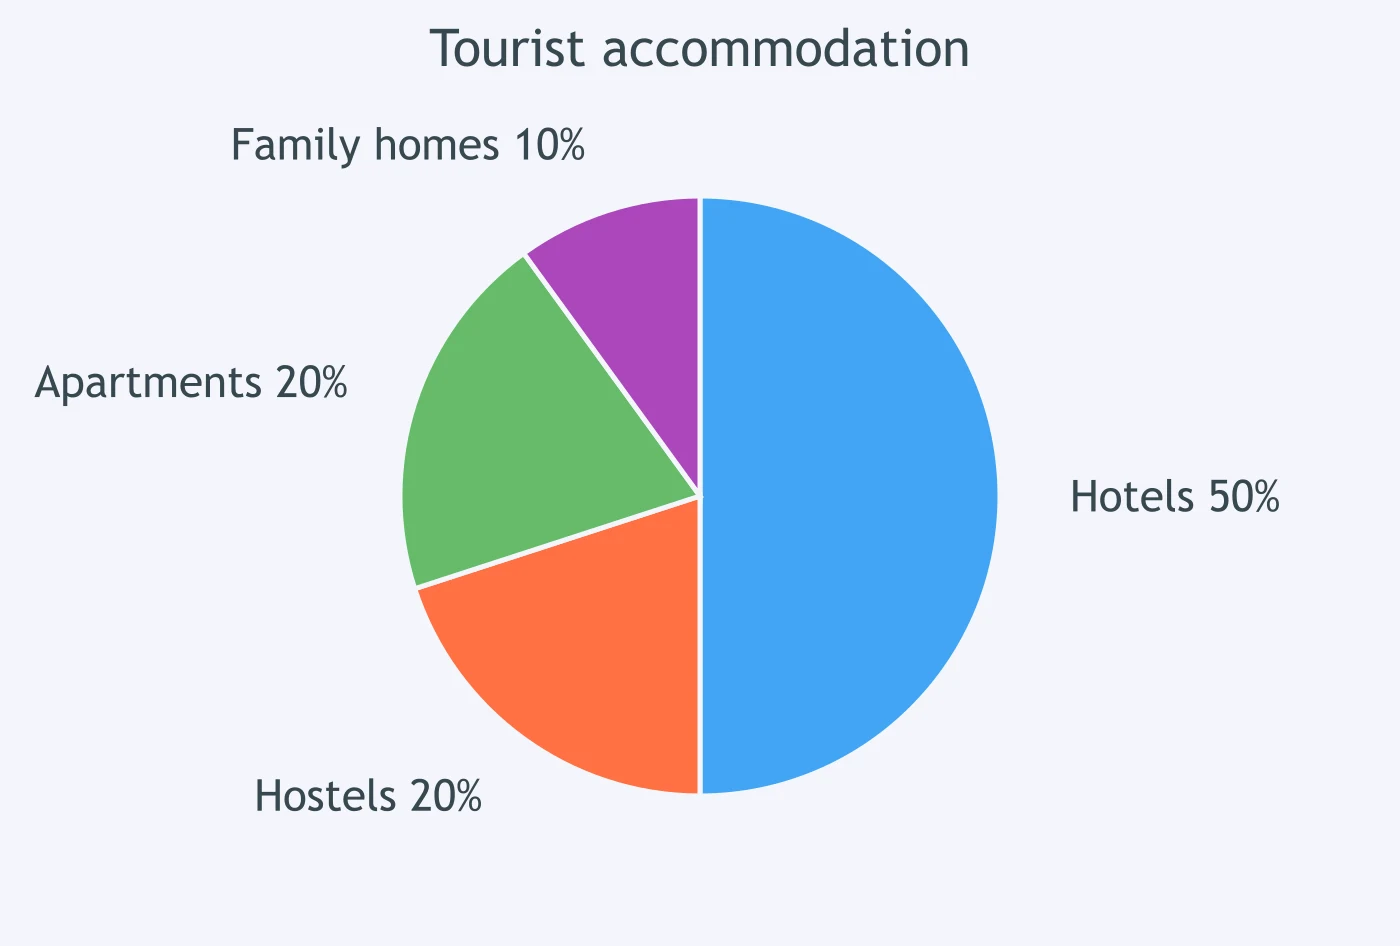
The chart shows that ___ of tourists stayed in hotels.
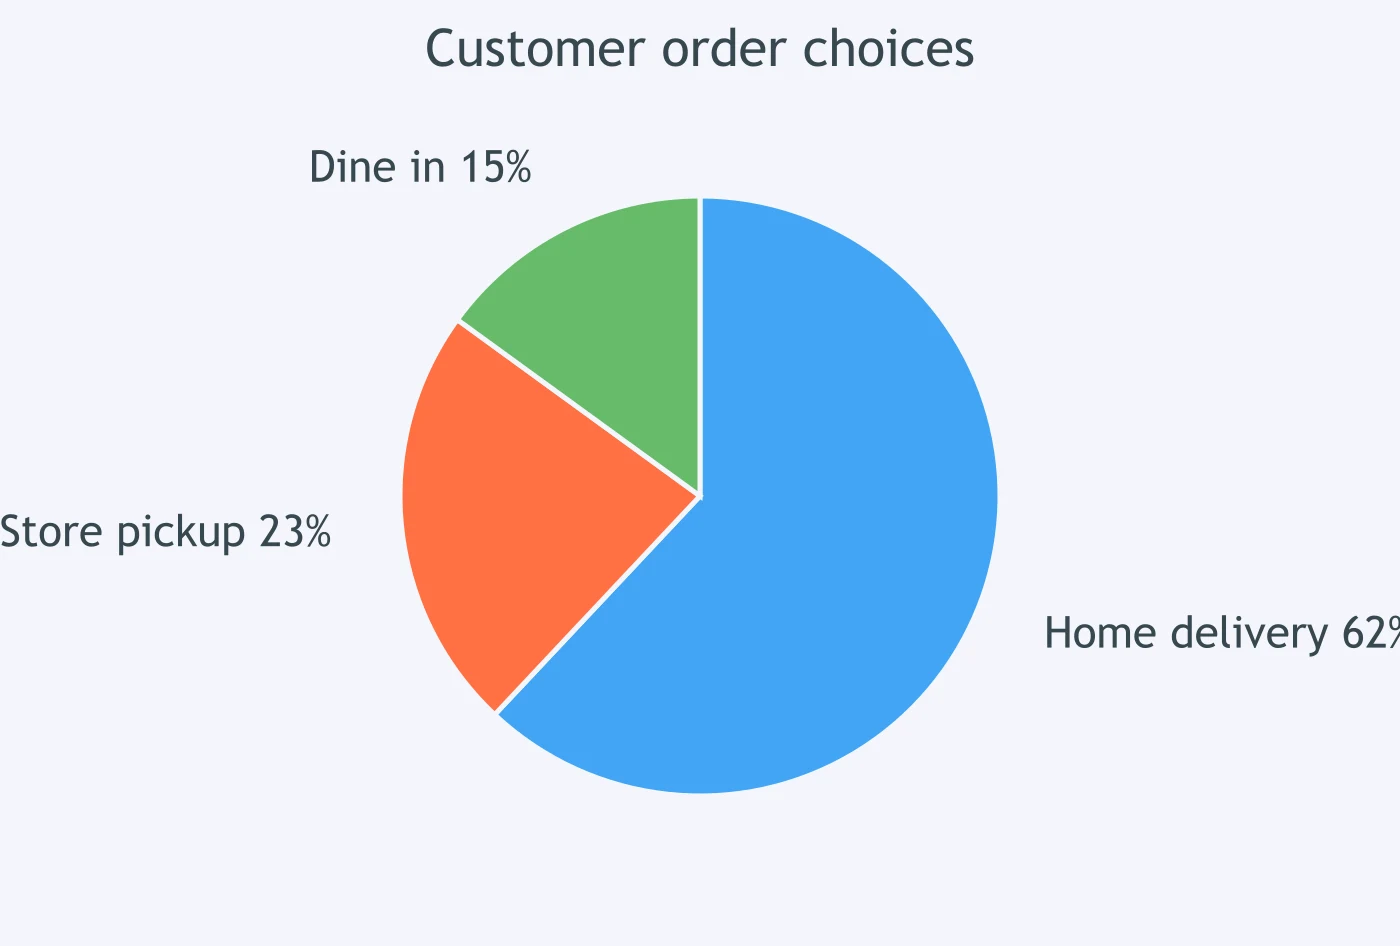
The chart shows that ___ of customers chose home delivery.
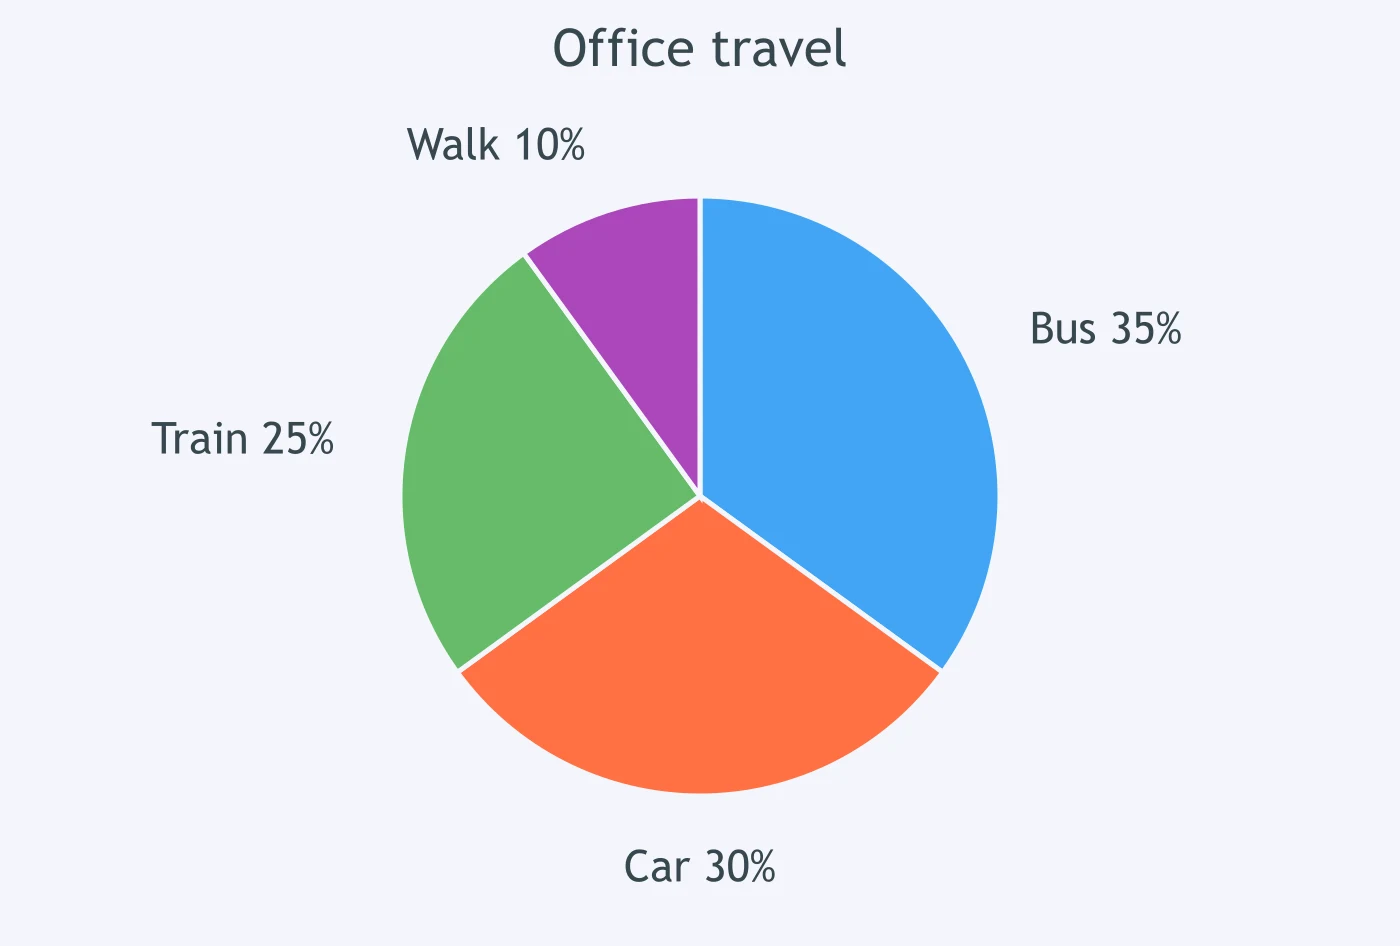
The chart shows that ___ of workers walked to the office.
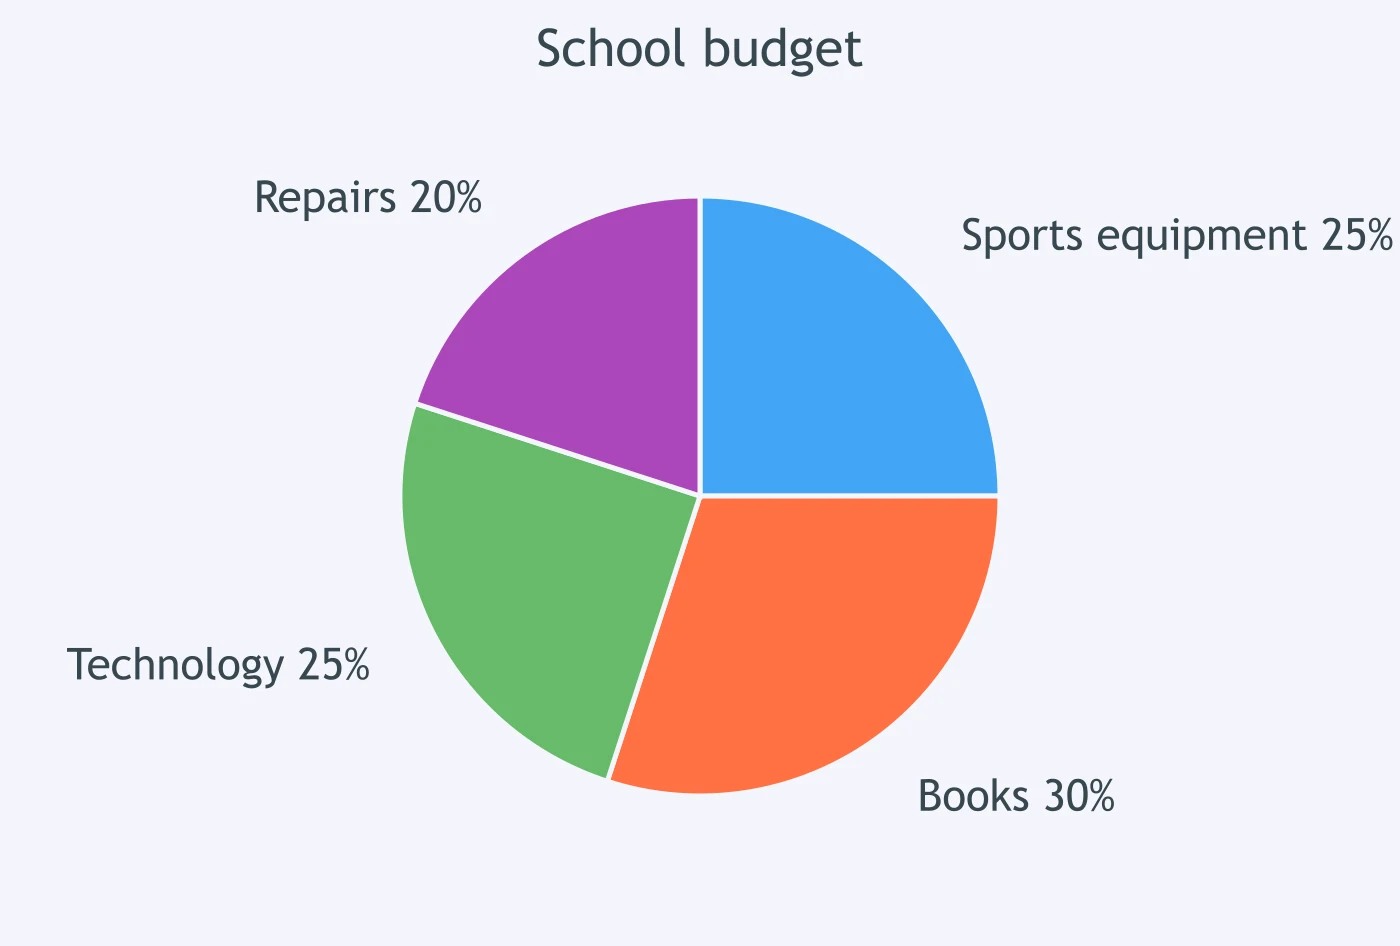
The chart shows that ___ of the school budget went to sports equipment.
The chart shows that ___ of residents preferred the evening class.
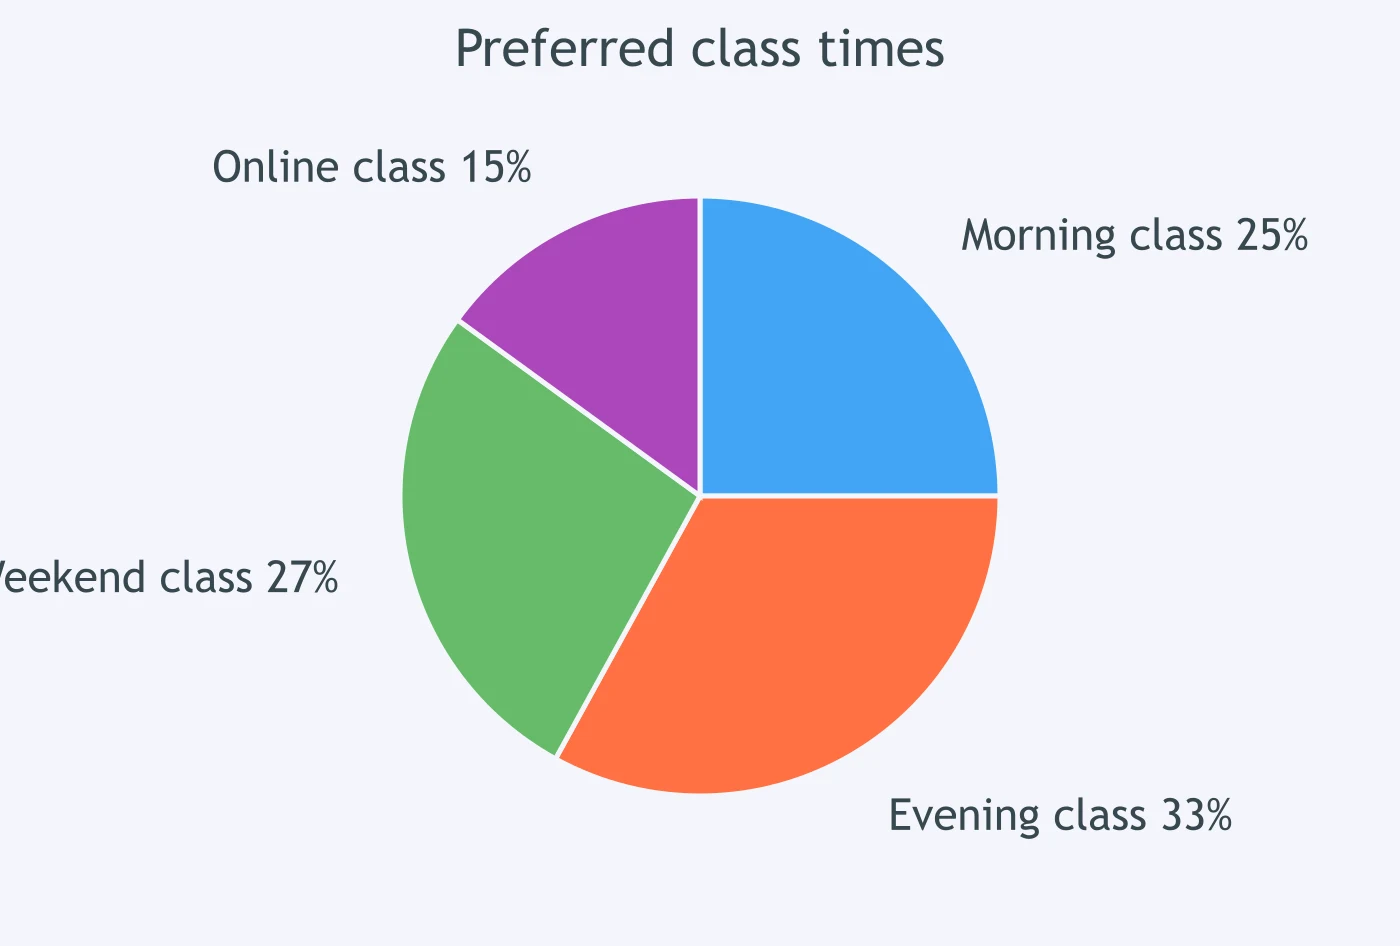
The chart shows that ___ of waste collected was paper.
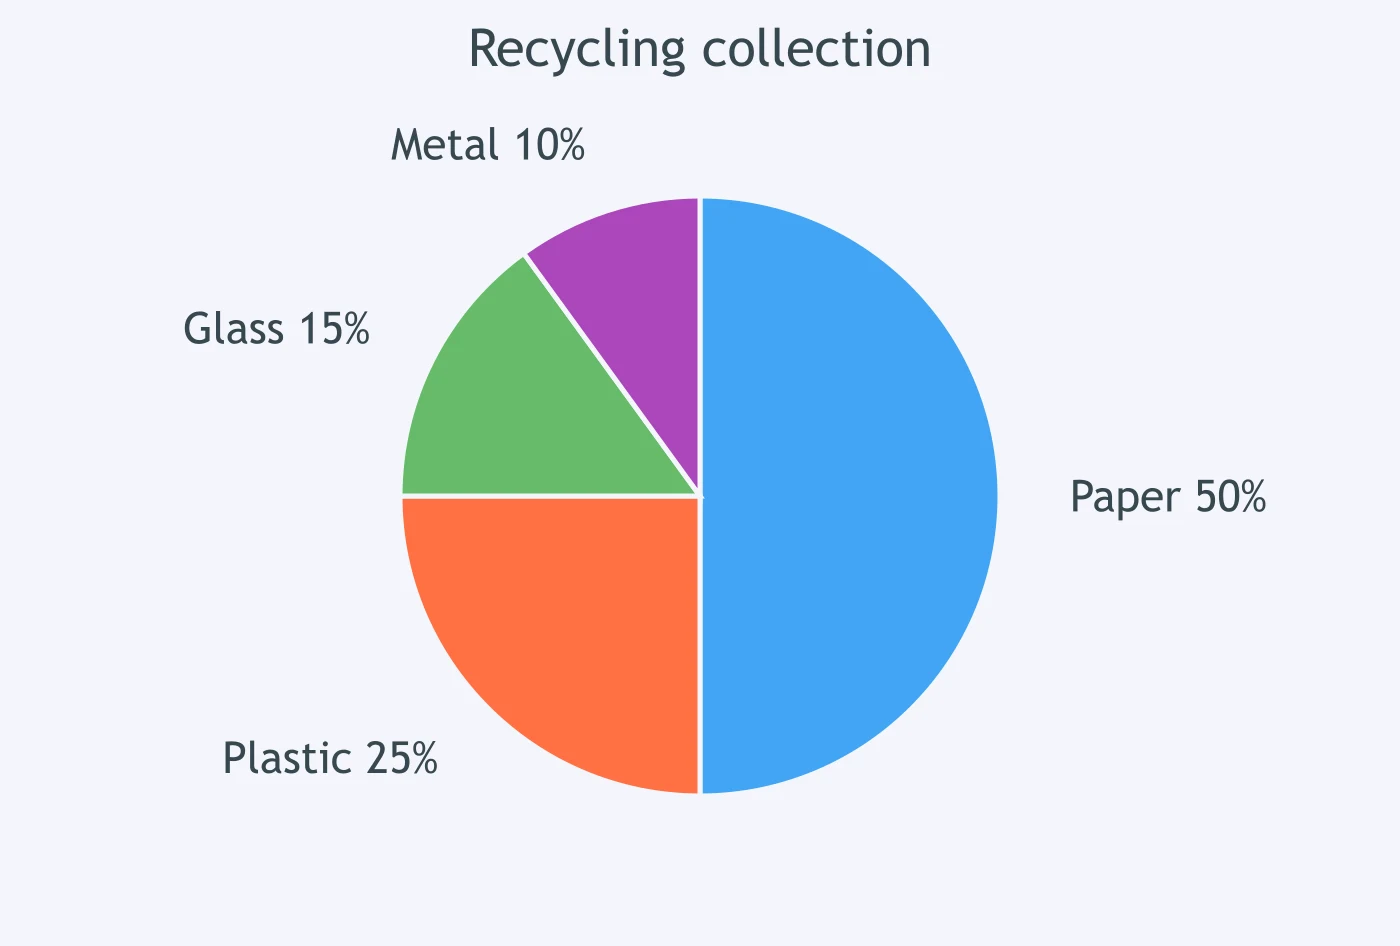
The chart shows that ___ of students used smartphones for homework.
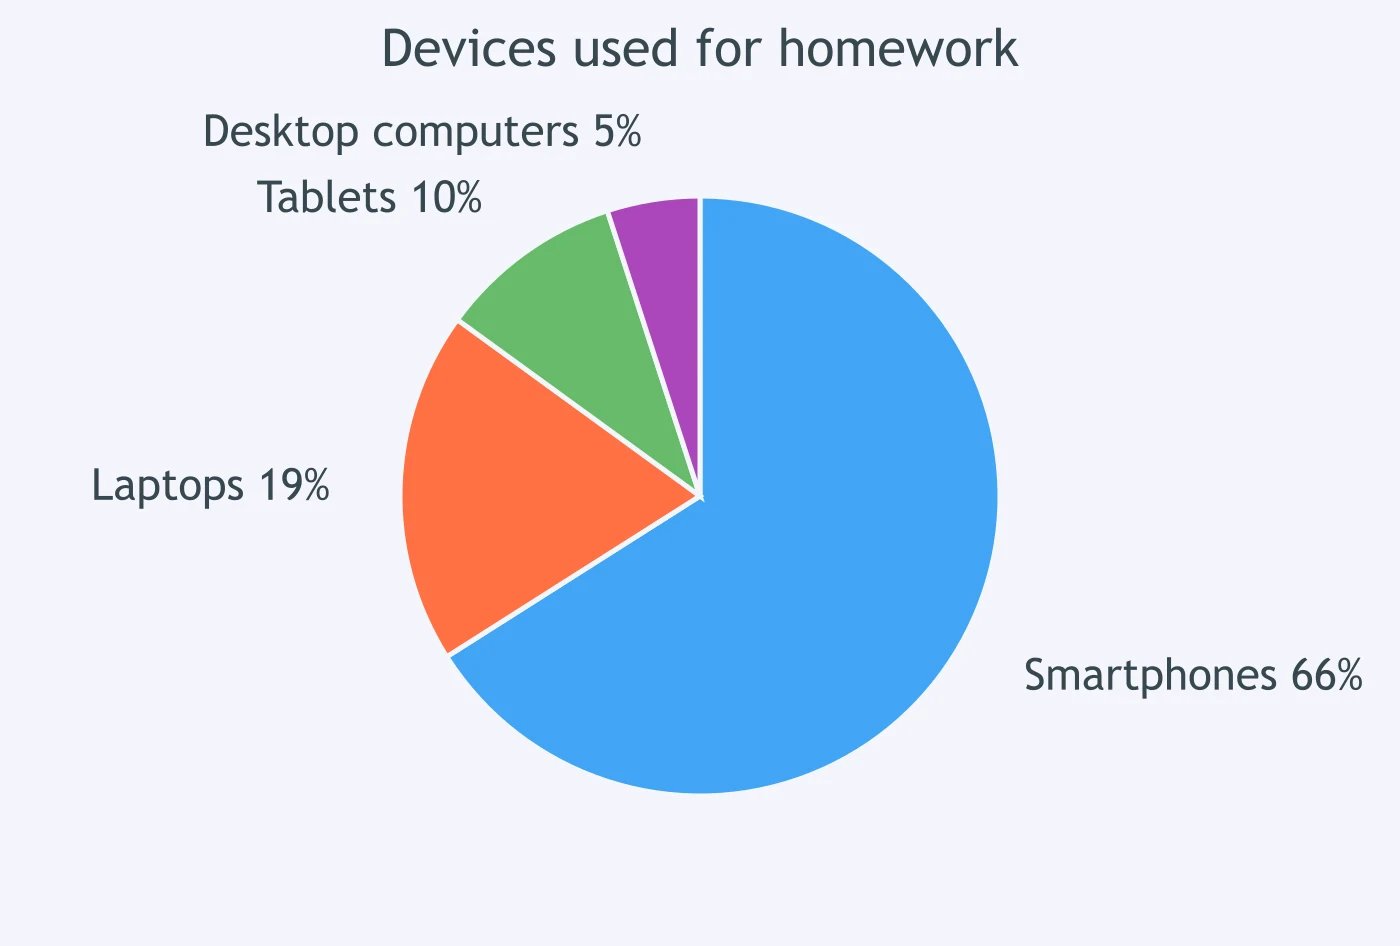
The chart shows that ___ of people chose the taxi option.
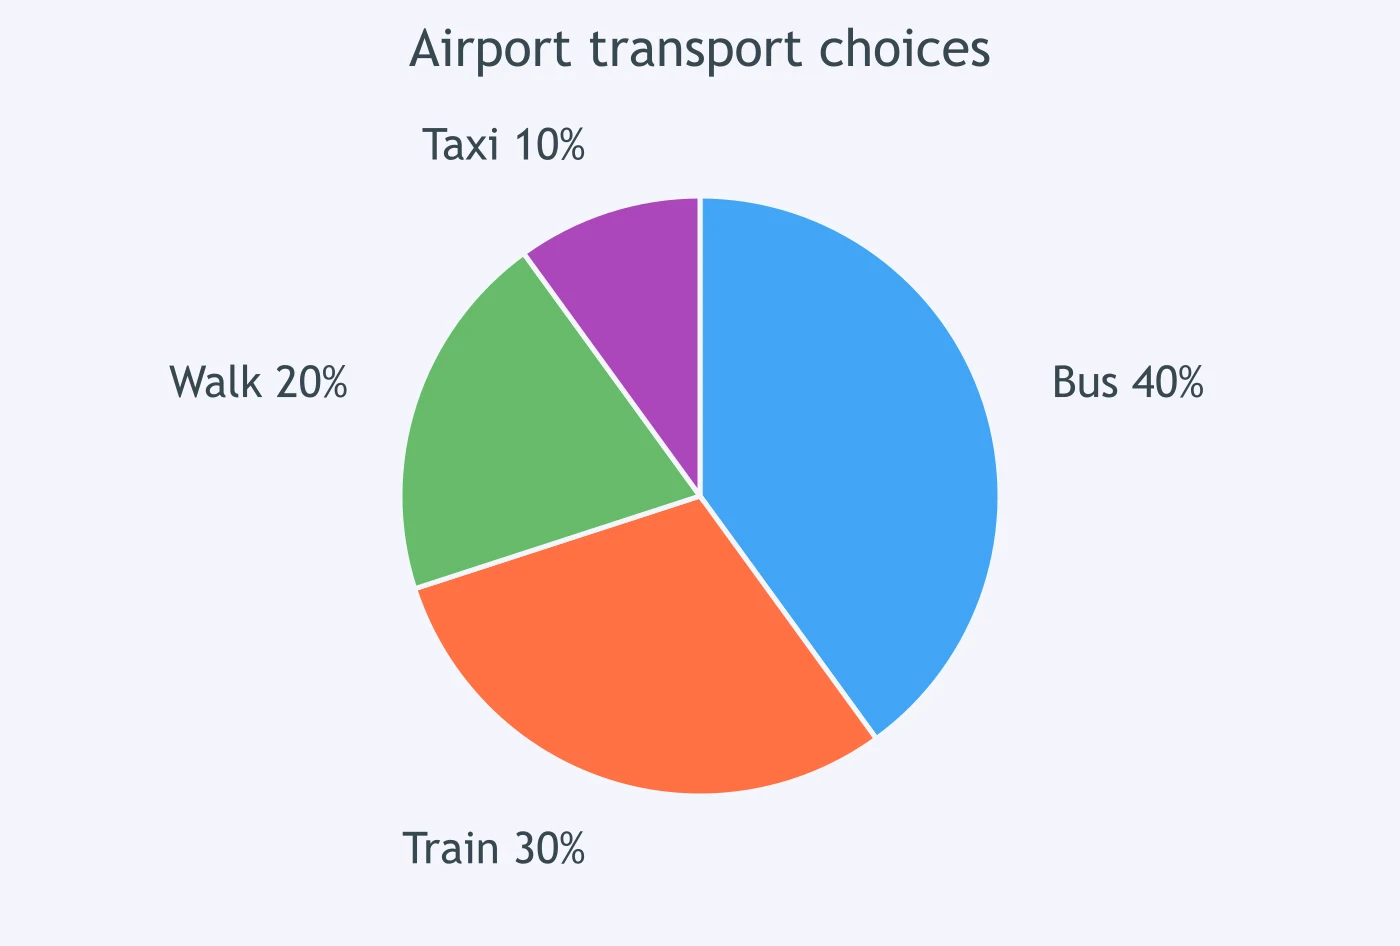
The chart shows that ___ of café sales were sandwiches.
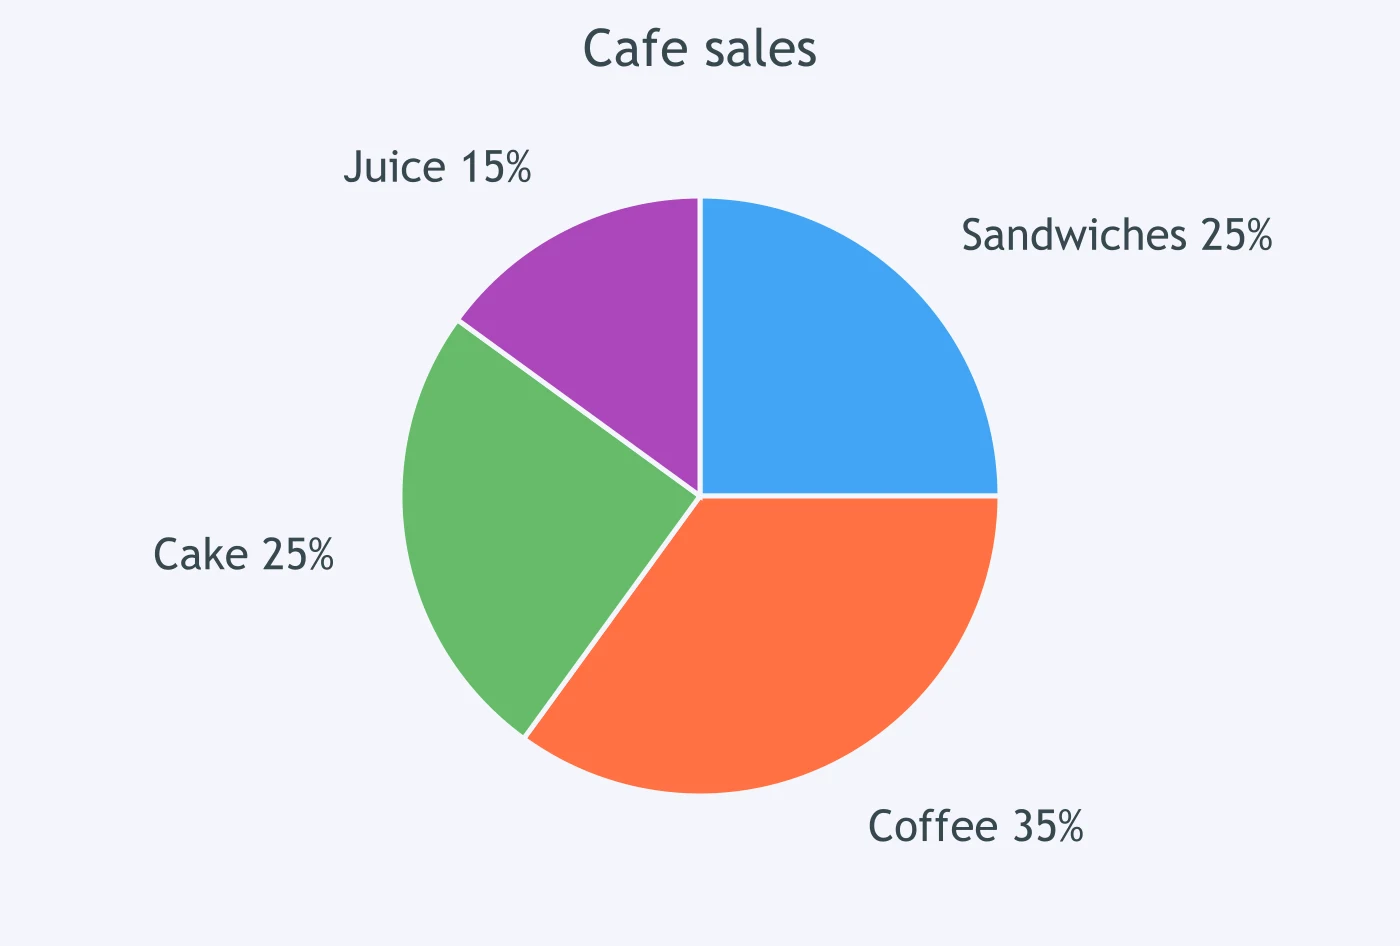
The chart shows that ___ of parents wanted more music lessons.
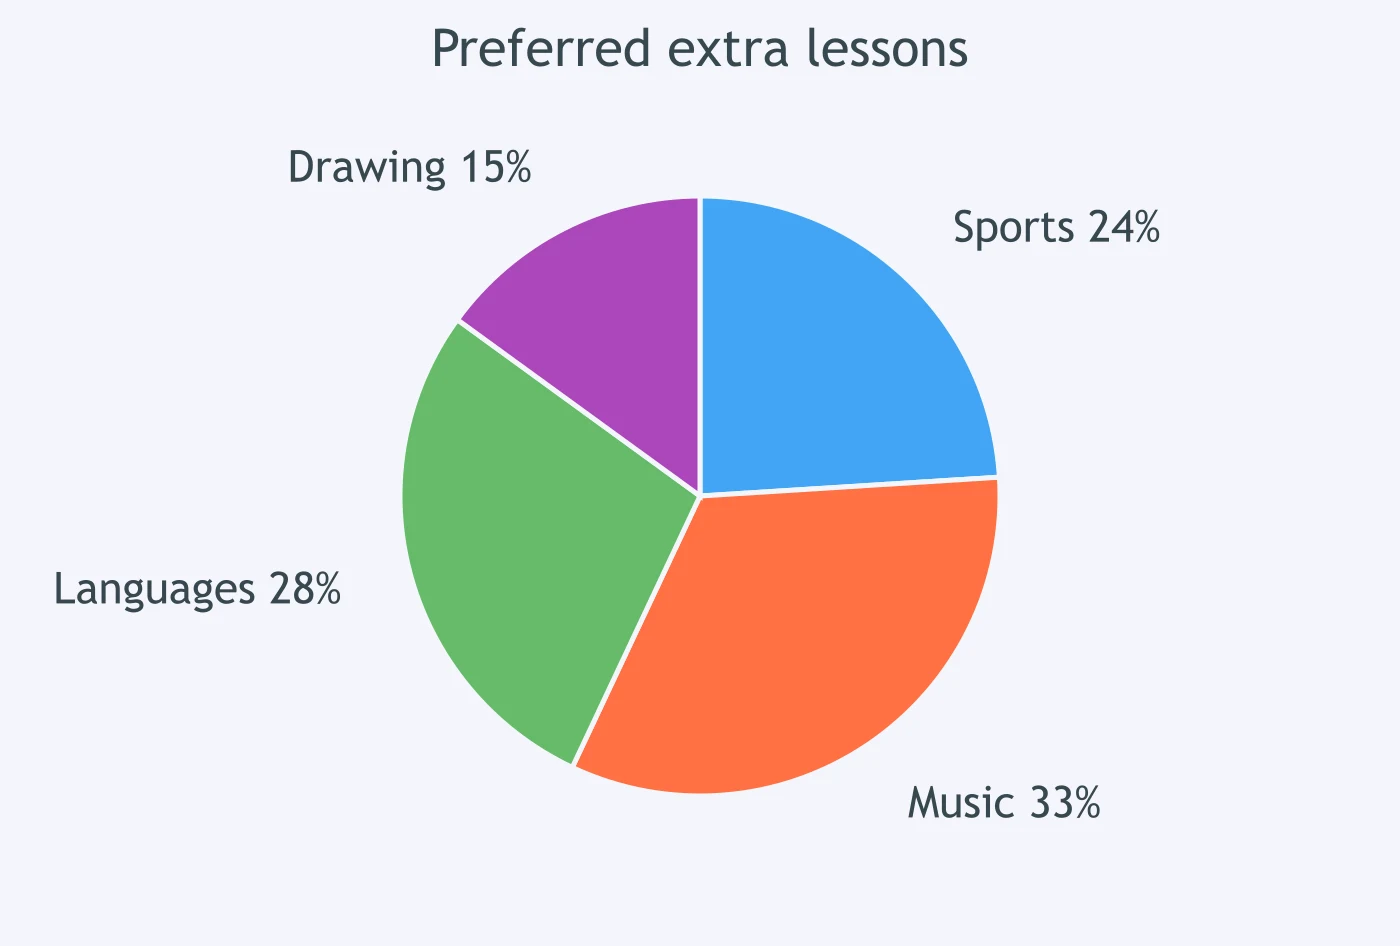
The chart shows that ___ of students spent their free time online.
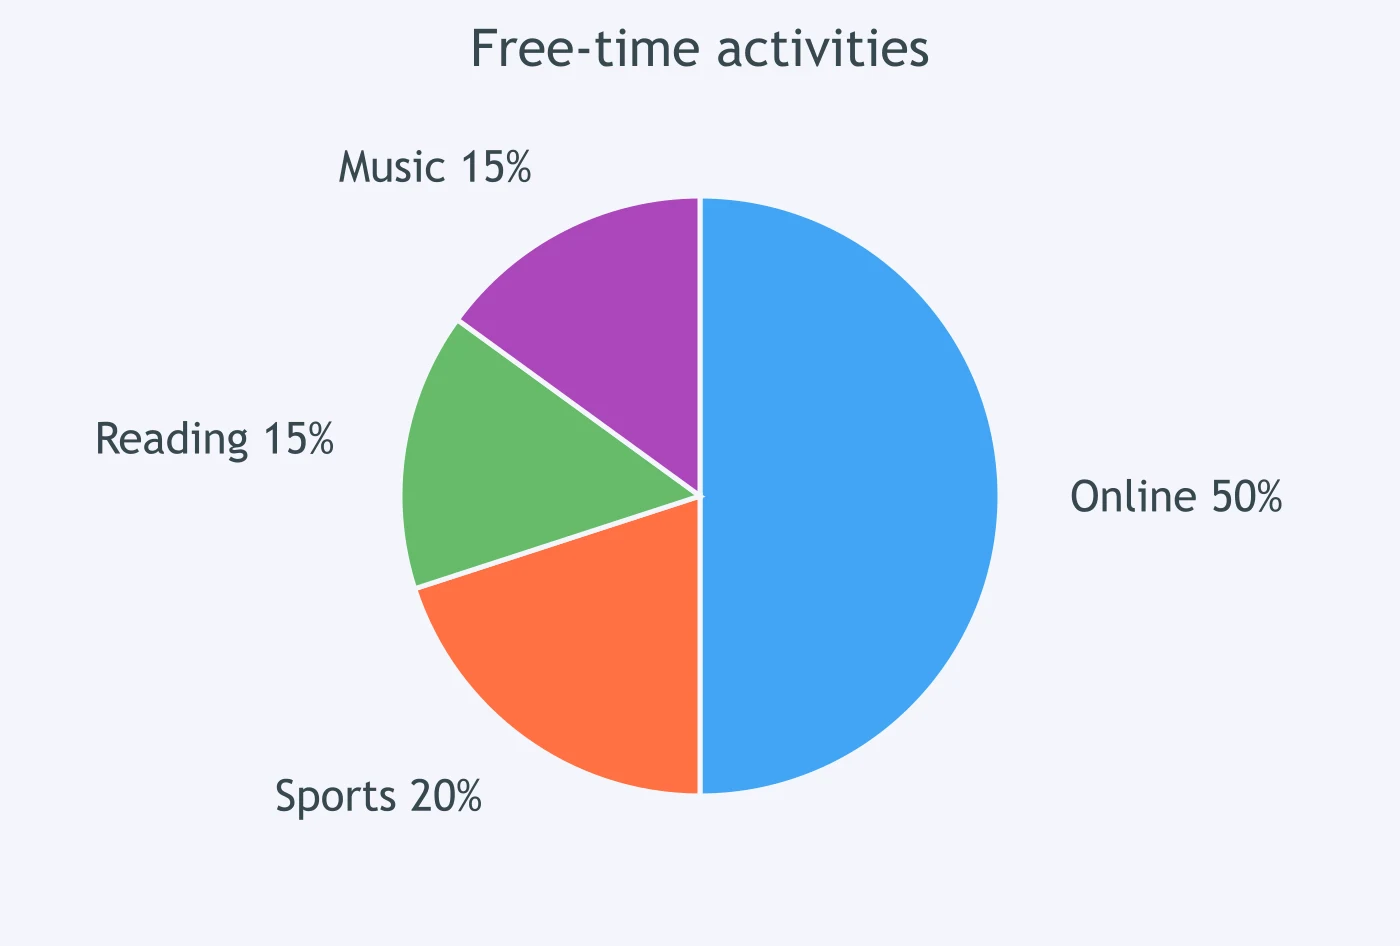
The chart shows that ___ of adults got news from social media.
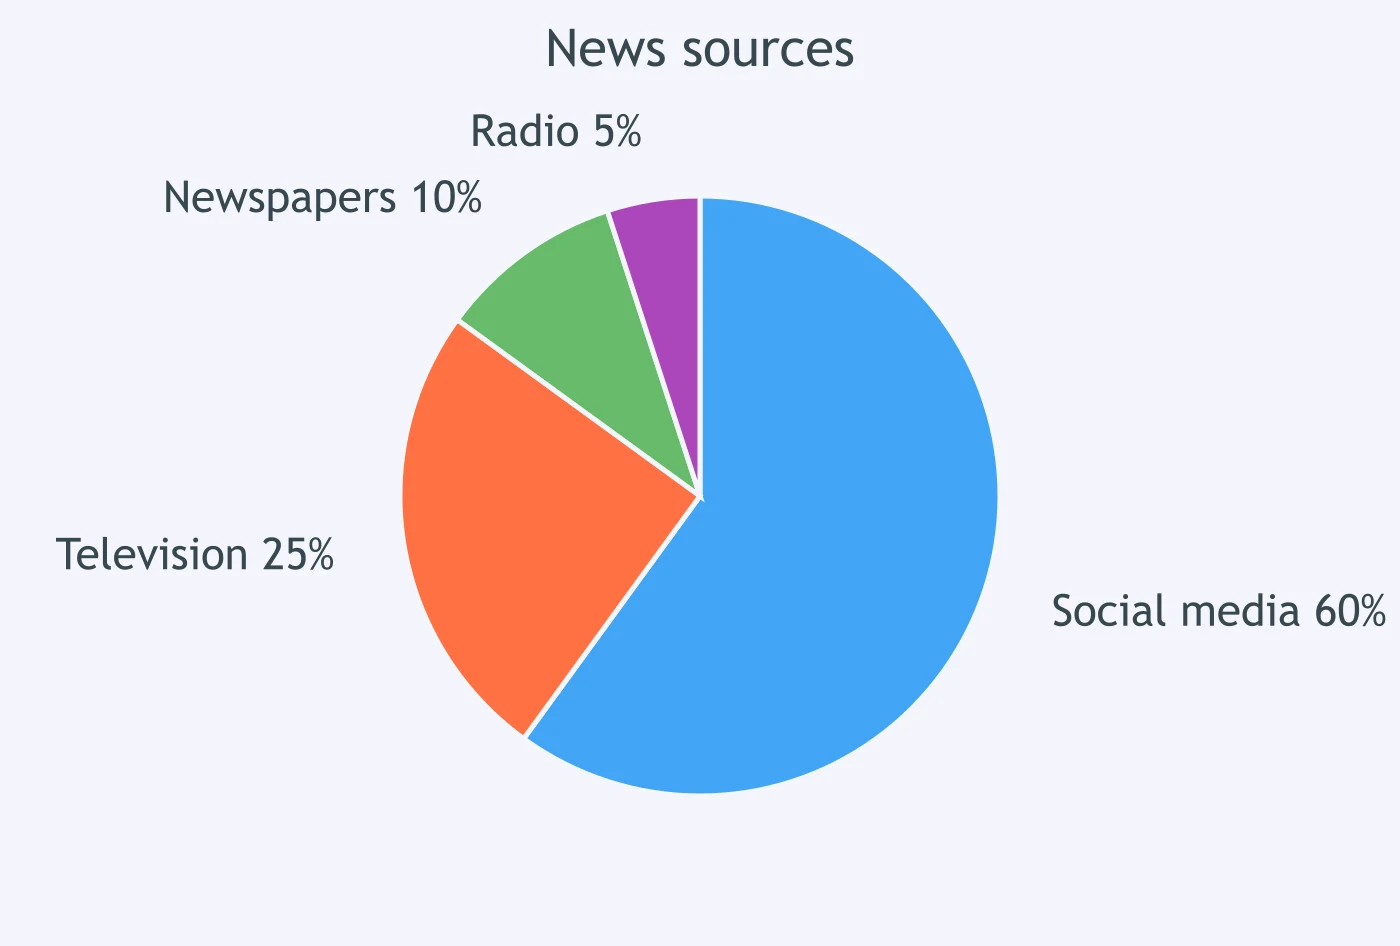
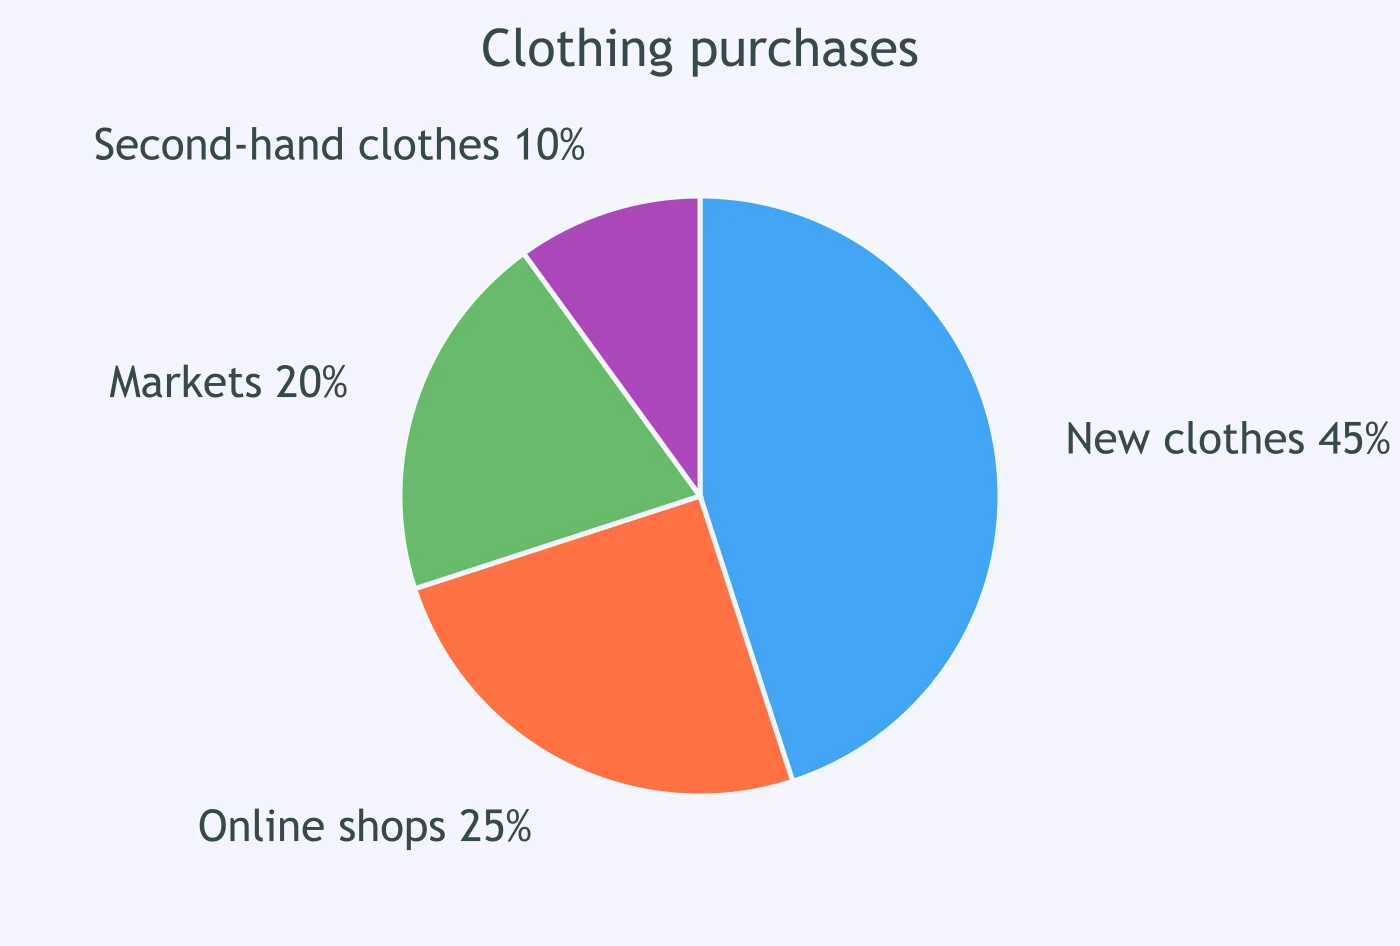
The chart shows that ___ of families bought second-hand clothes.
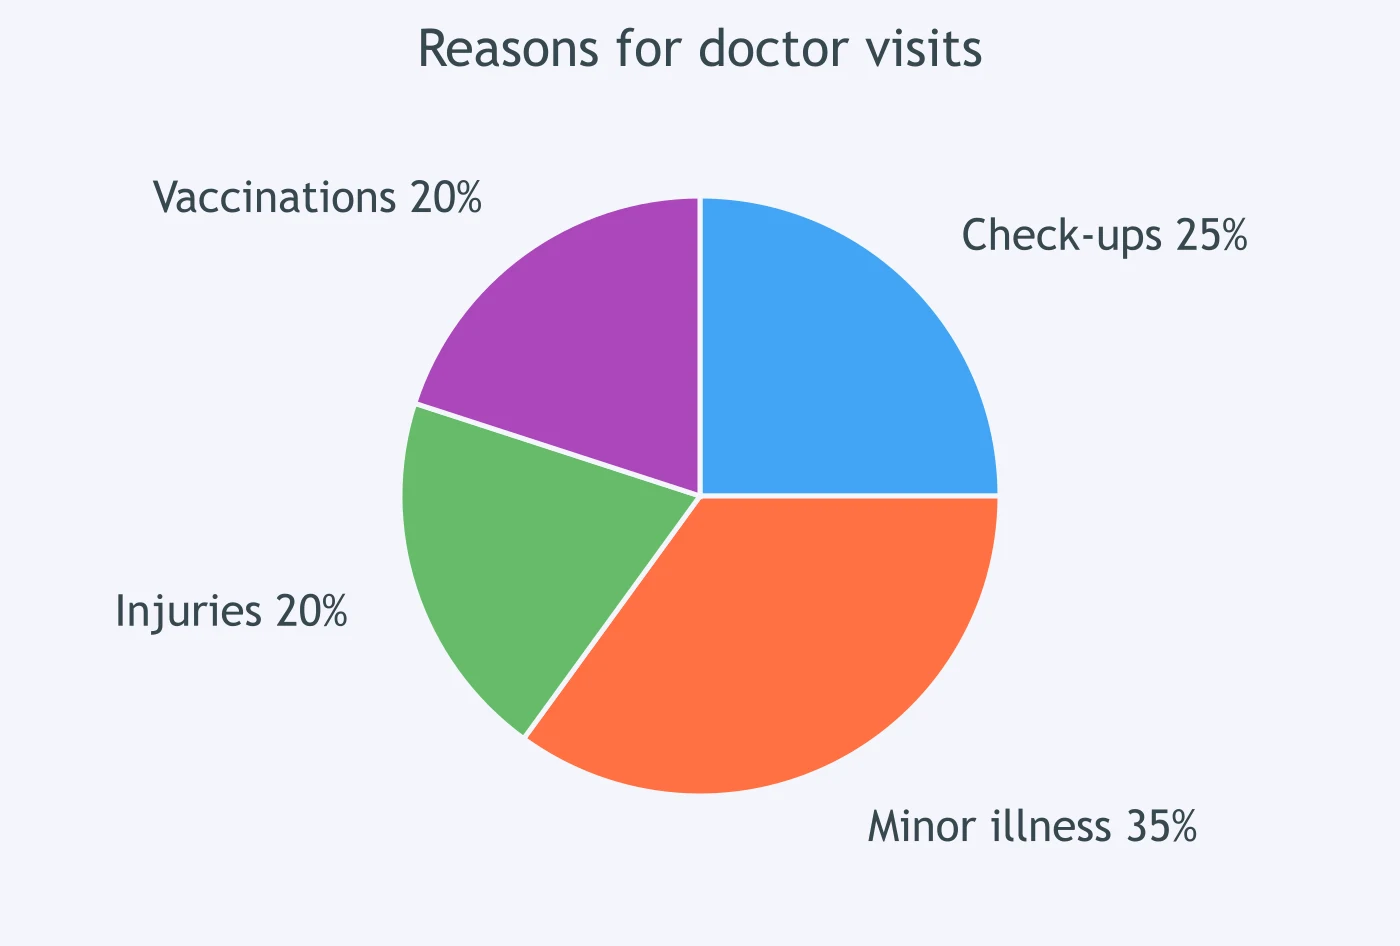
The chart shows that ___ of trips to the doctor were for check-ups.
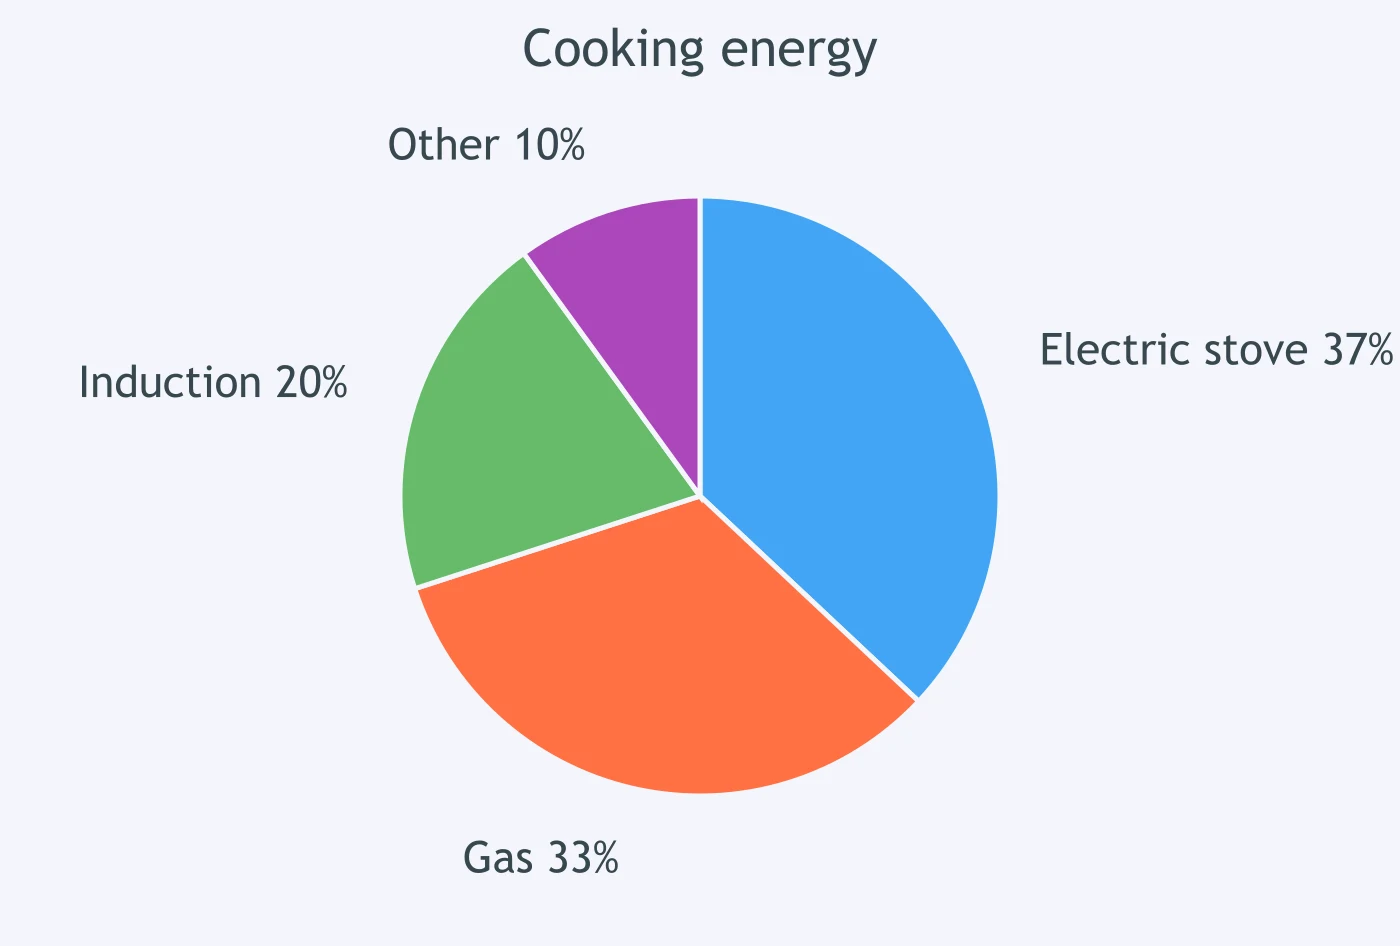
The chart shows that ___ of households used gas for cooking.
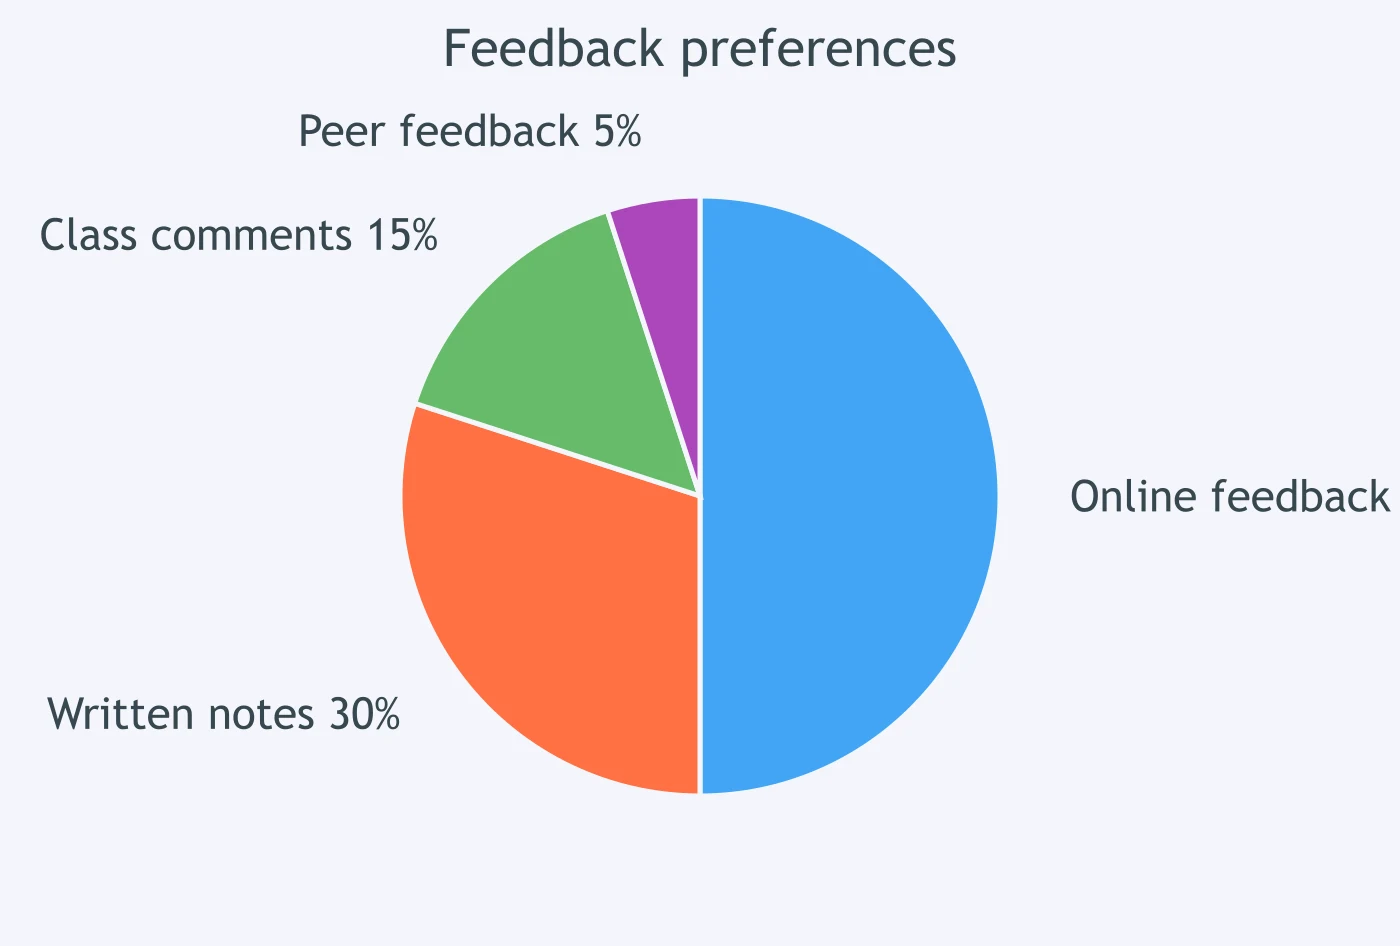
The chart shows that ___ of students preferred online feedback.
The chart shows that ___ of customers chose the basic plan.
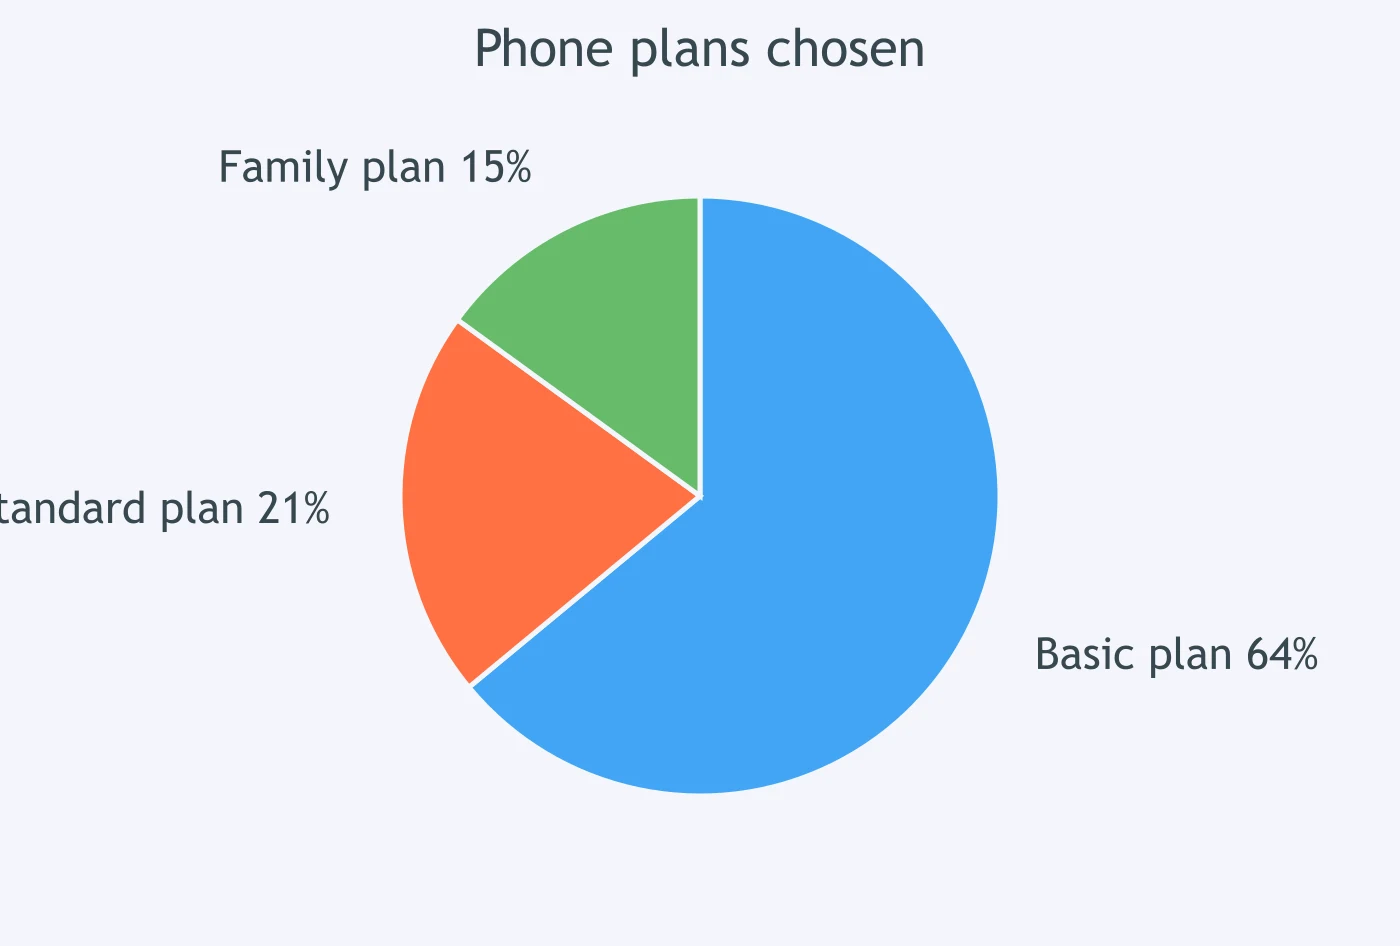
The chart shows that ___ of visitors bought souvenirs.
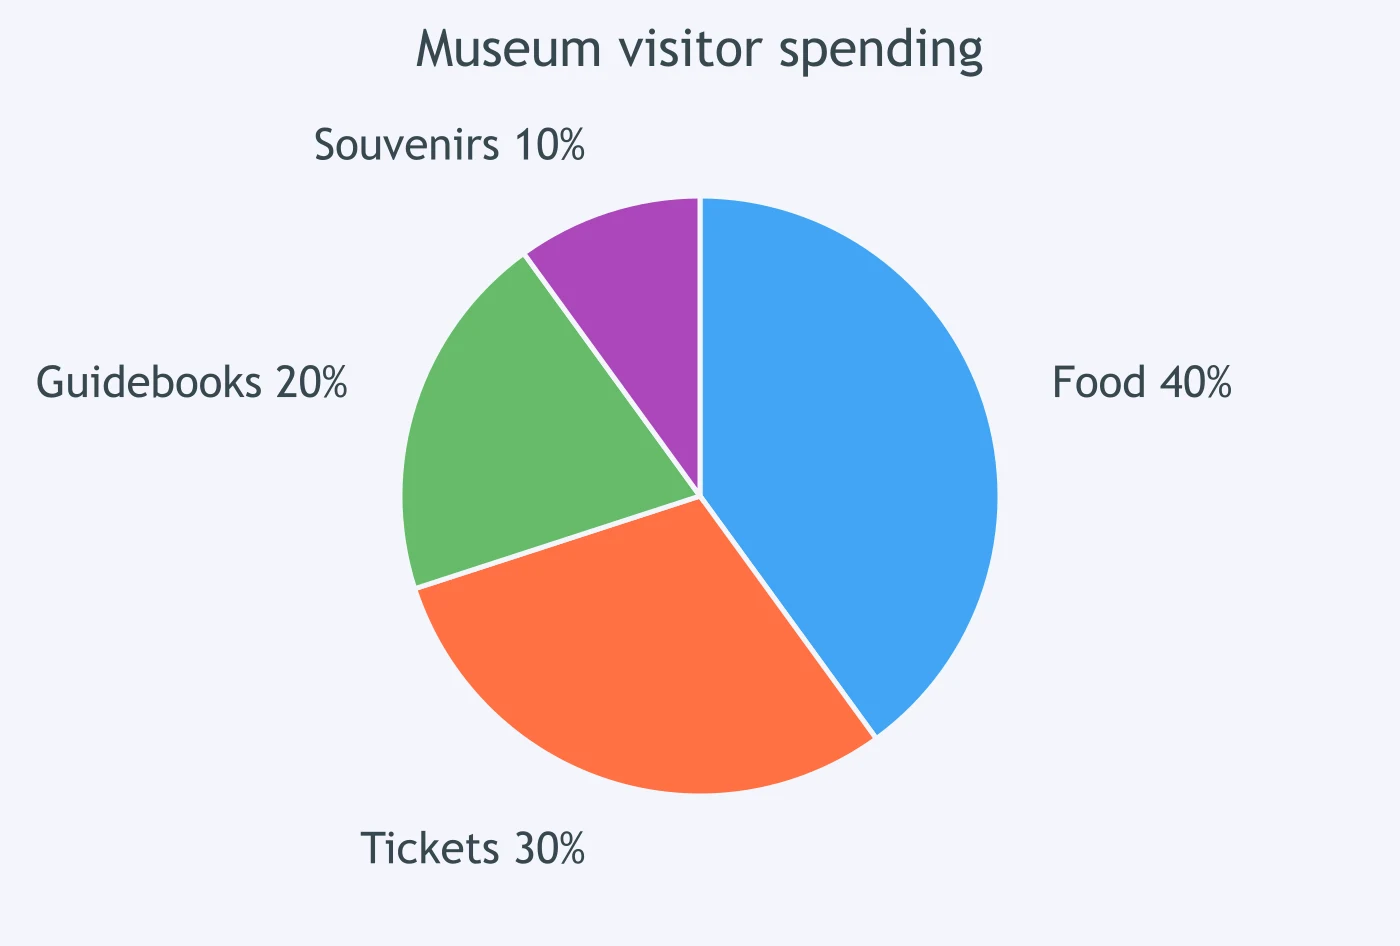
The chart shows that ___ of the town's water use was for gardens.
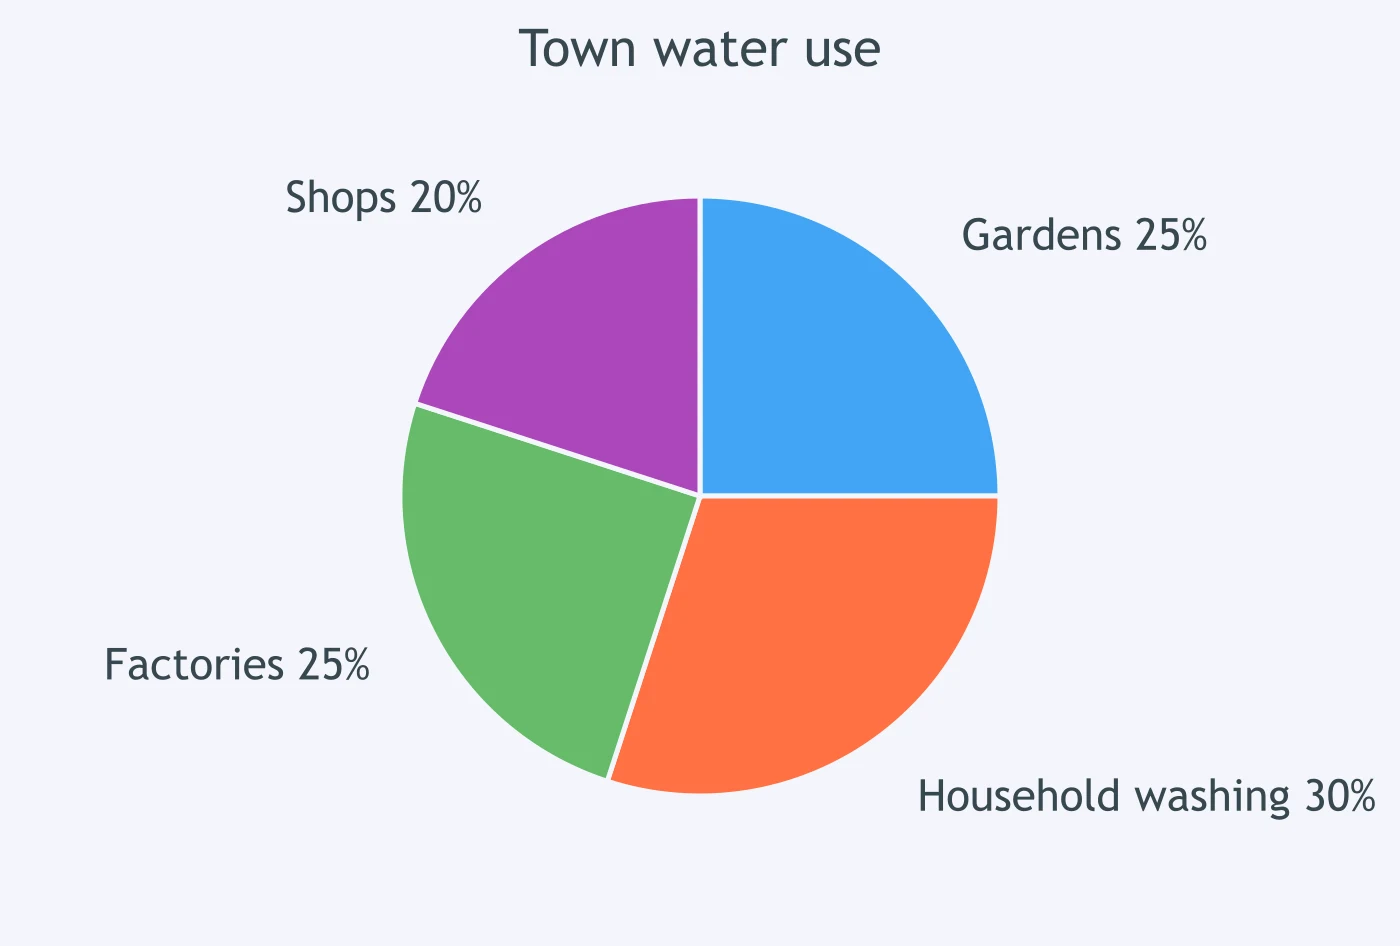
The chart shows that ___ of people preferred email reminders.
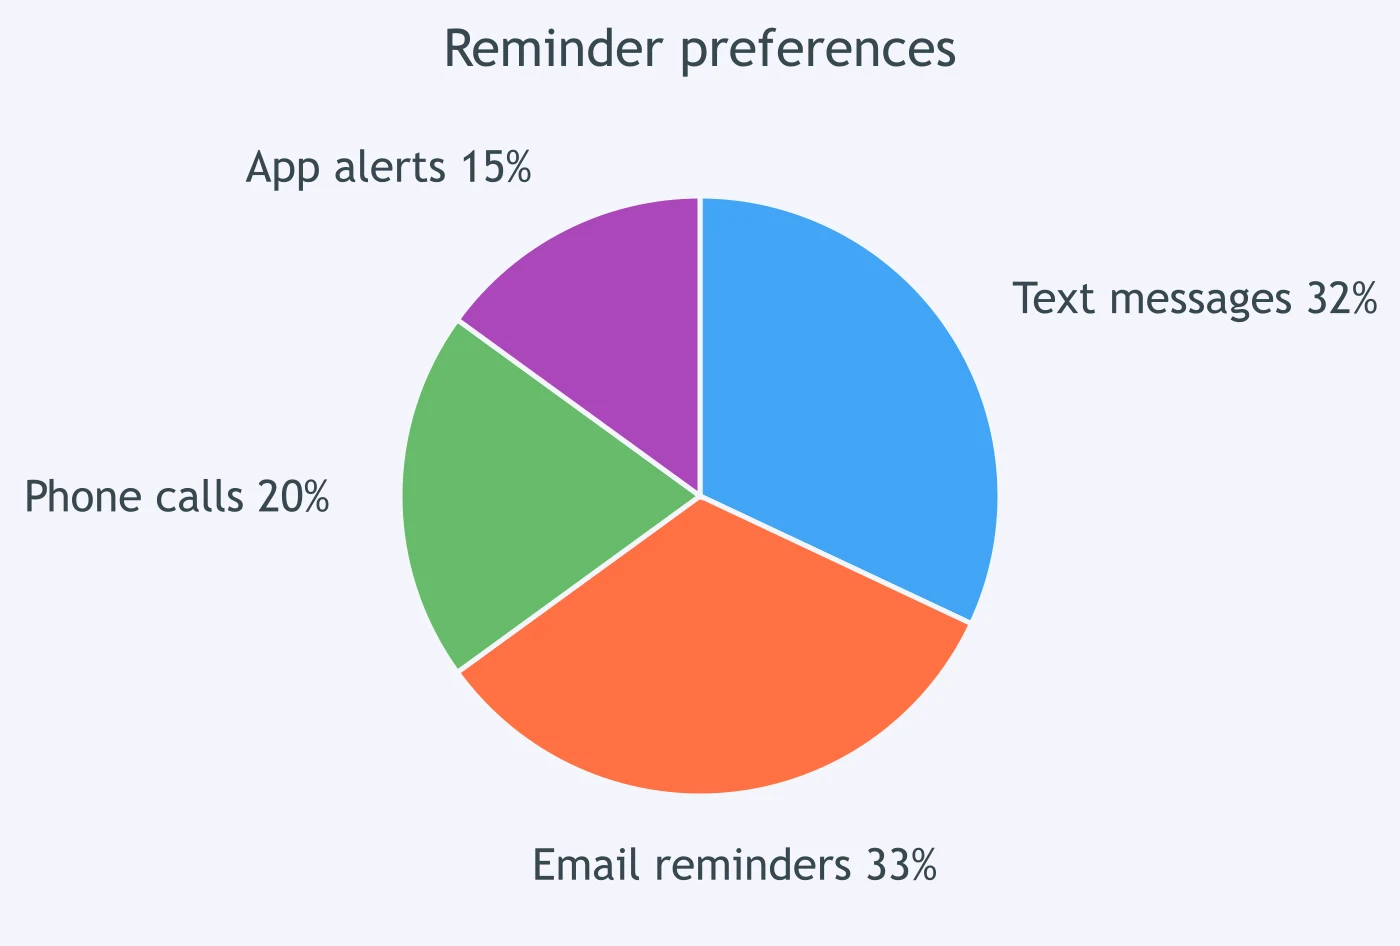
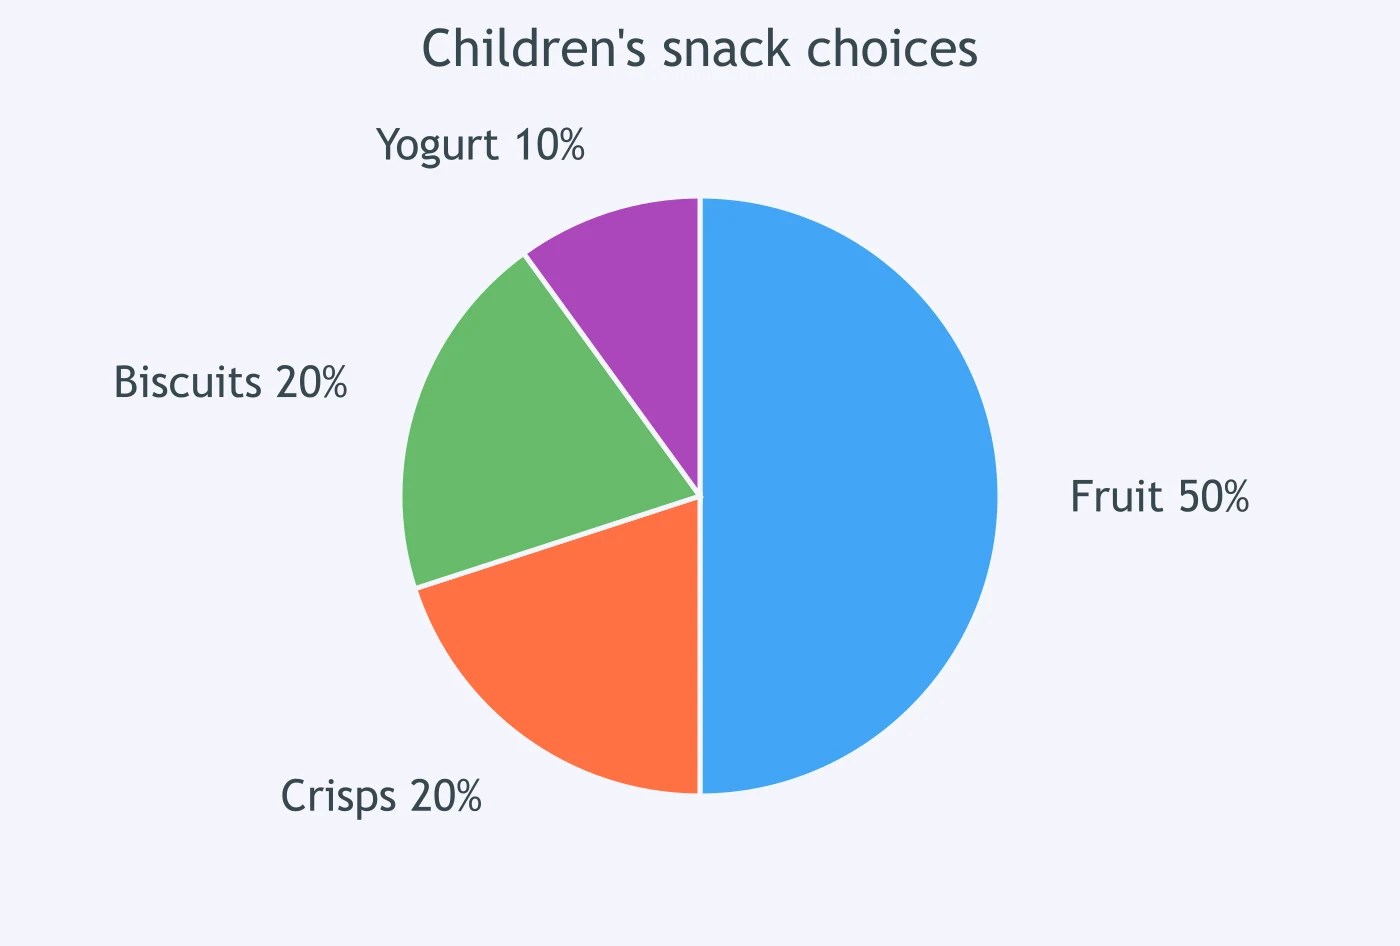
The chart shows that ___ of children chose fruit as a snack.
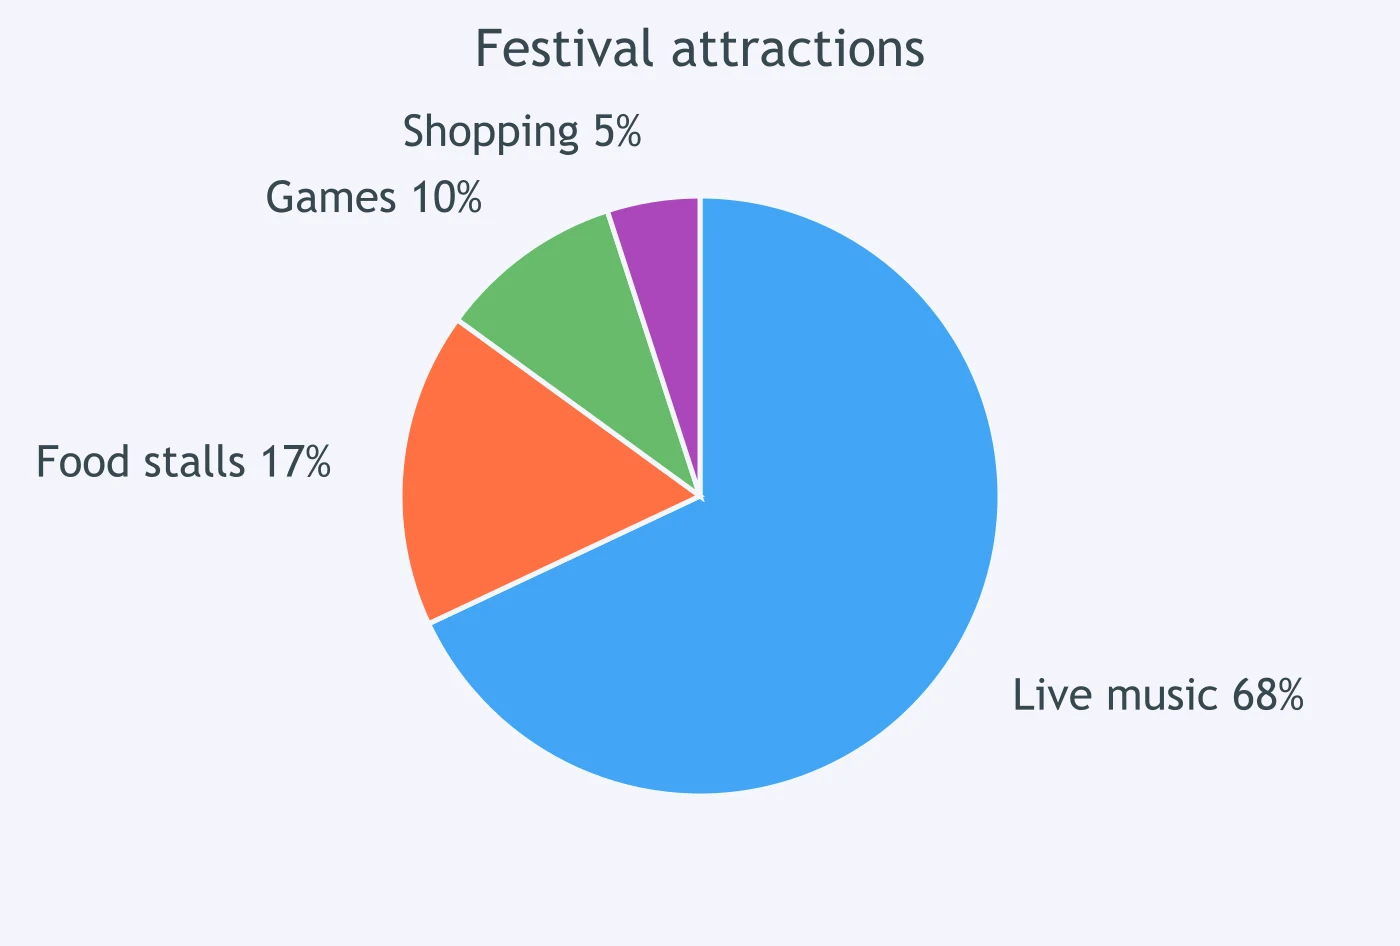
The chart shows that ___ of festival visitors came for live music.
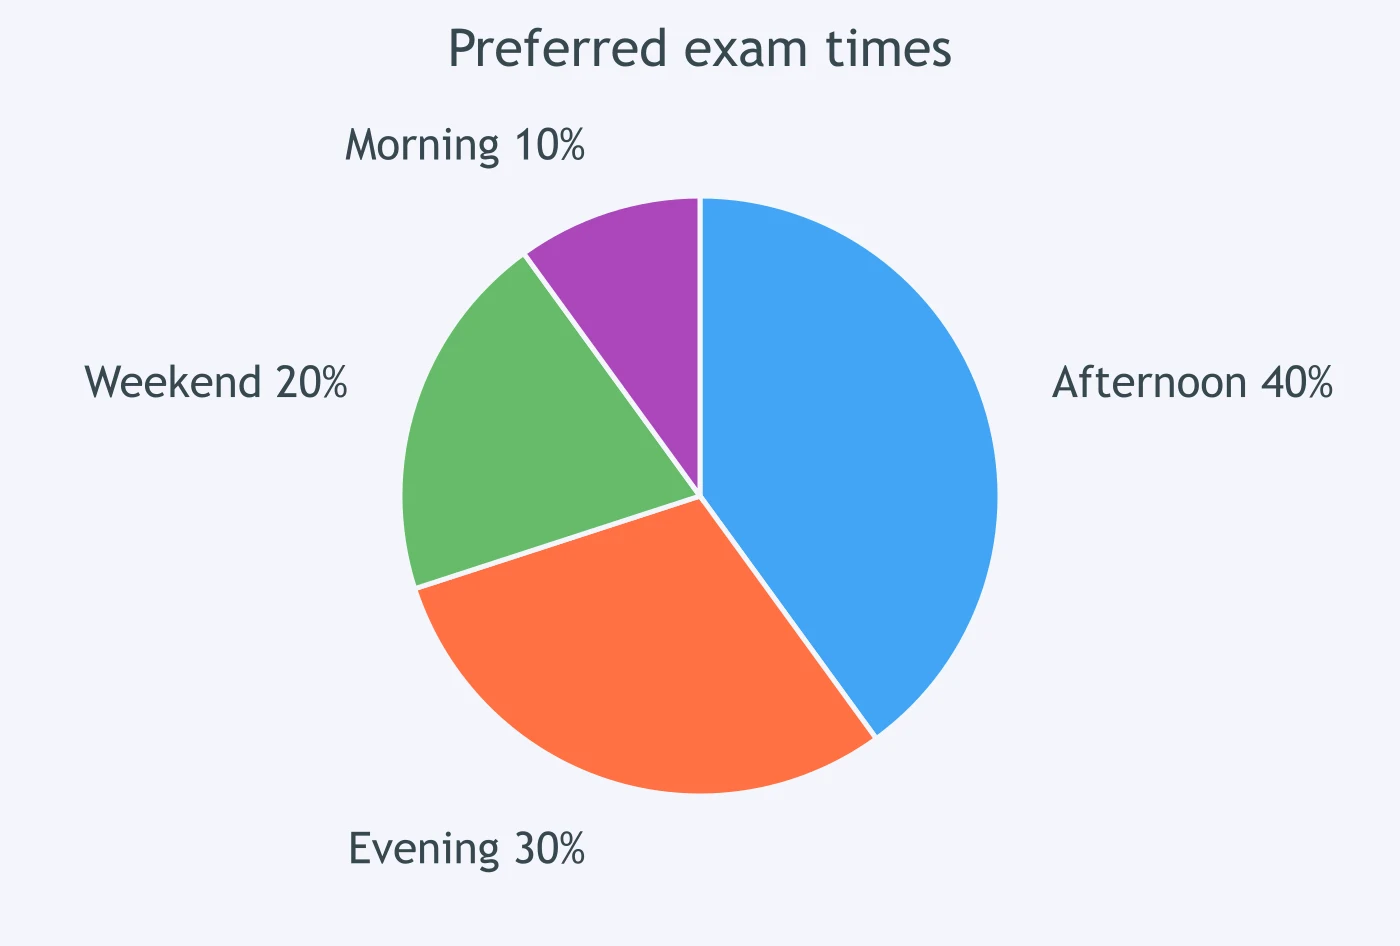
The chart shows that ___ of students selected the morning exam time.
Crack the passcode before the zombies get in.
Answer, then swat bugs for bonus points.
Race through questions at your own speed.
Same question on every screen. Fastest wins.

Pick a tile, answer, hit bonuses and steals.

Up, Down or Flat: Basic Trend Verbs - IELTS 5.0 W T1
40 questions