Loading
by BlastRoom
Practice interpreting line graphs for IELTS Writing Task 1.
#writing_task_1#ielts_5_0

30 questions
One question set, multiple game modes. Tap any game to see it in action. Not sure which to pick?
Answer to place stones and capture territory.
Outrun the snow together.
Earn blasts, then hunt the other team.
Answer to earn energy, then climb.

The class blasts through walls together.
Bid on mystery lots. Most money wins.
Sell tours. Nice, standard, or a total scam.

Answer, restock, and serve the rush.
More correct answers pulls the rope your way.
Answer, then shoot down the alien wave.
Answer, then tap to leap the frozen ridge.
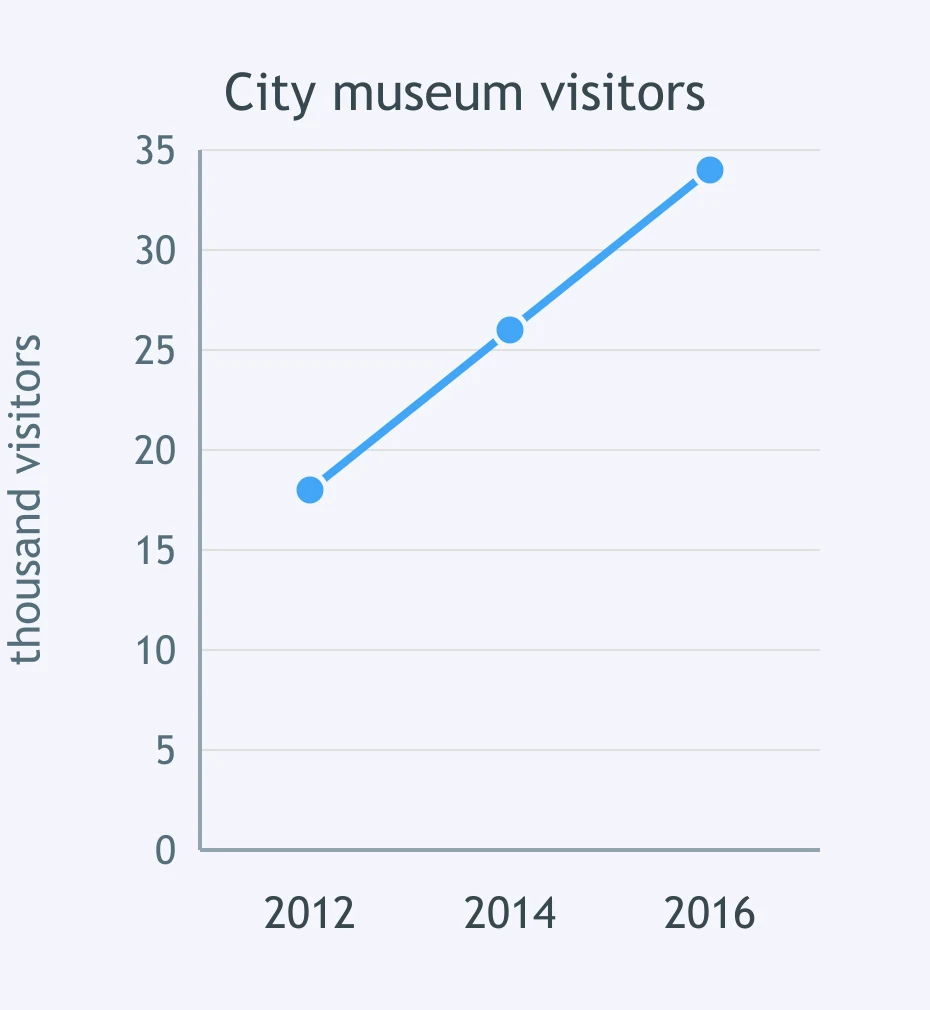
The graph shows city museum visitors. What did the visitor line do between 2012 and 2016?
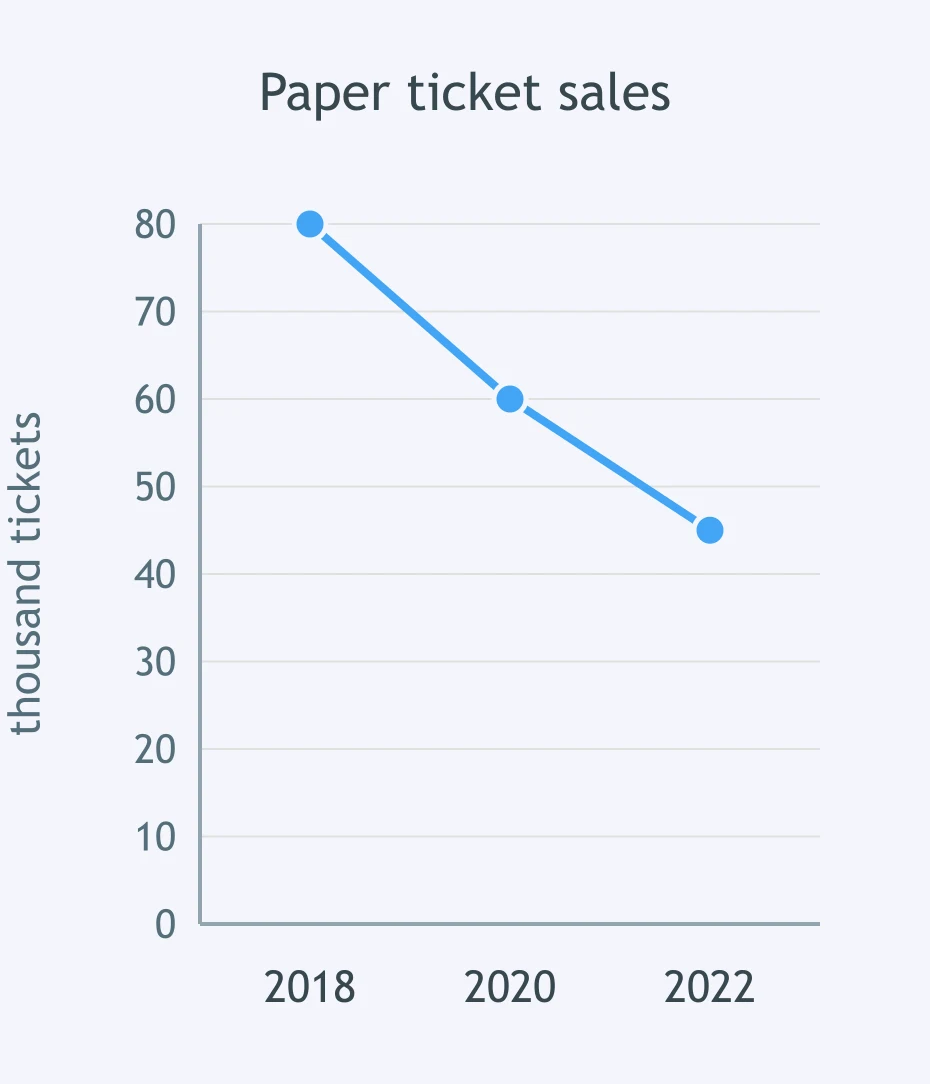
The graph shows paper ticket sales. How did the ticket line change from 2018 to 2022?
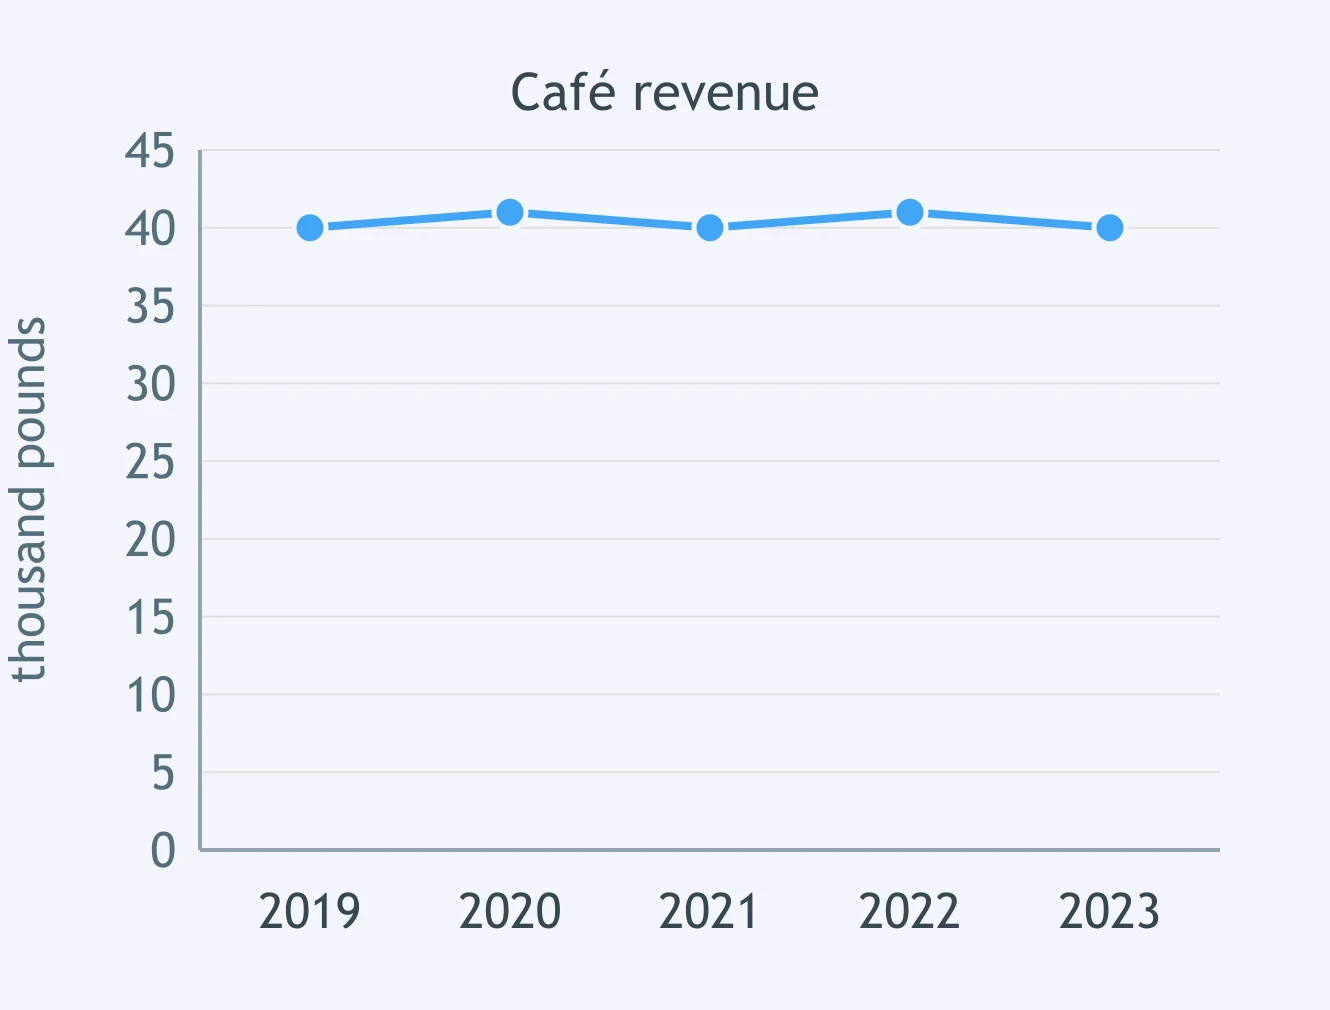
The graph shows café revenue. Which sentence describes the revenue line between 2019 and 2023?
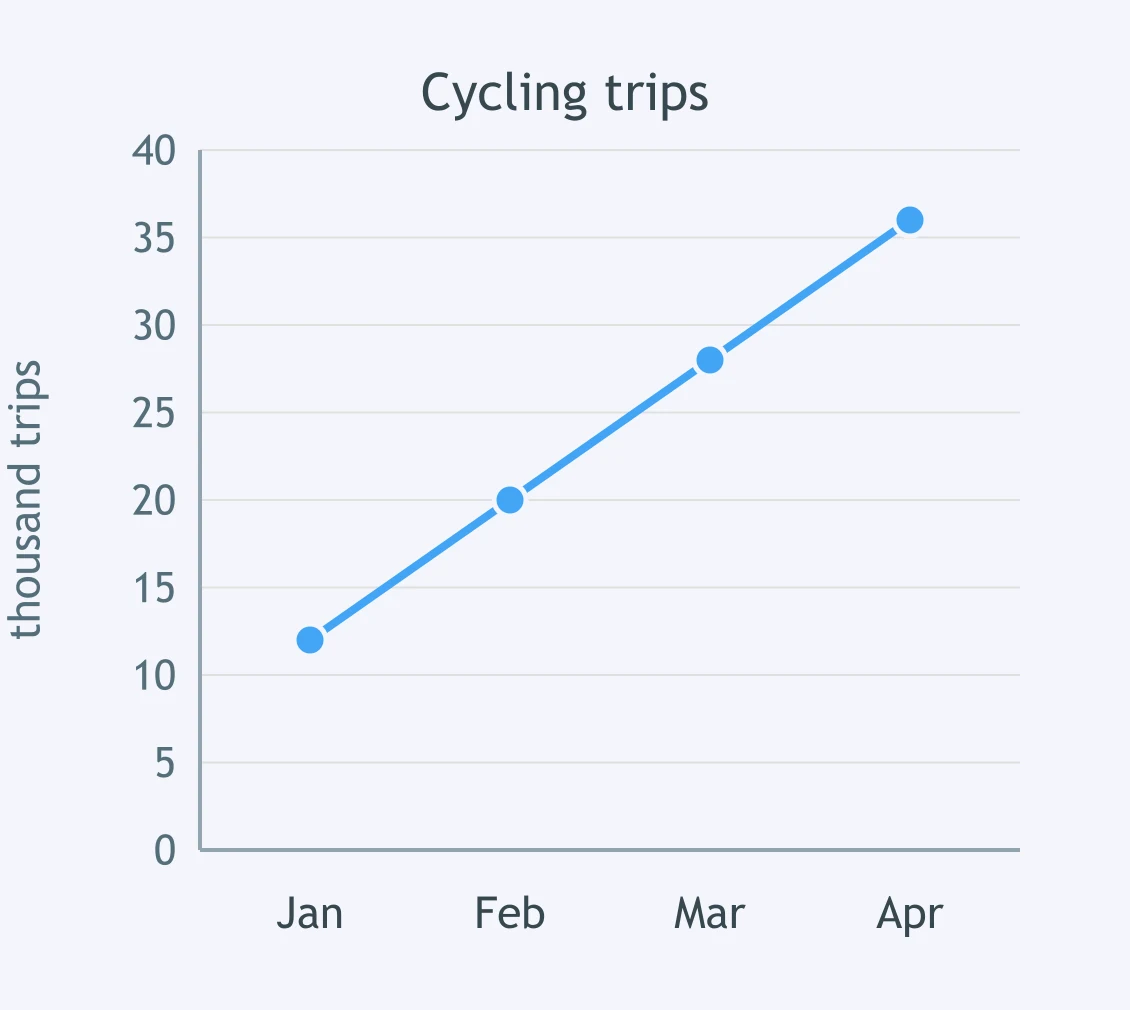
The graph shows cycling trips in a town. What happened to the cycling line from January to April?
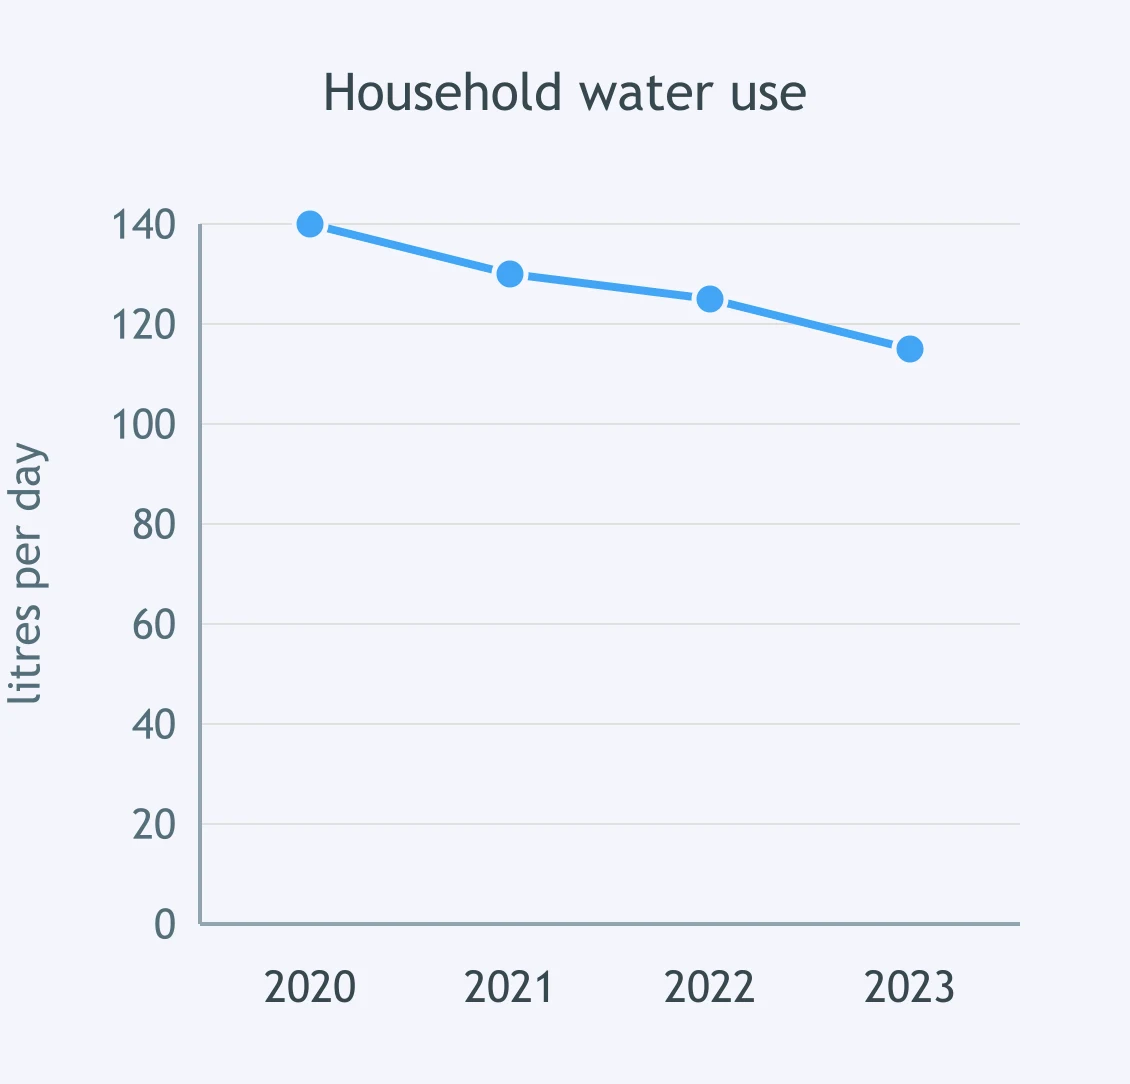
The graph shows household water use. How did the water-use line change from 2020 to 2023?
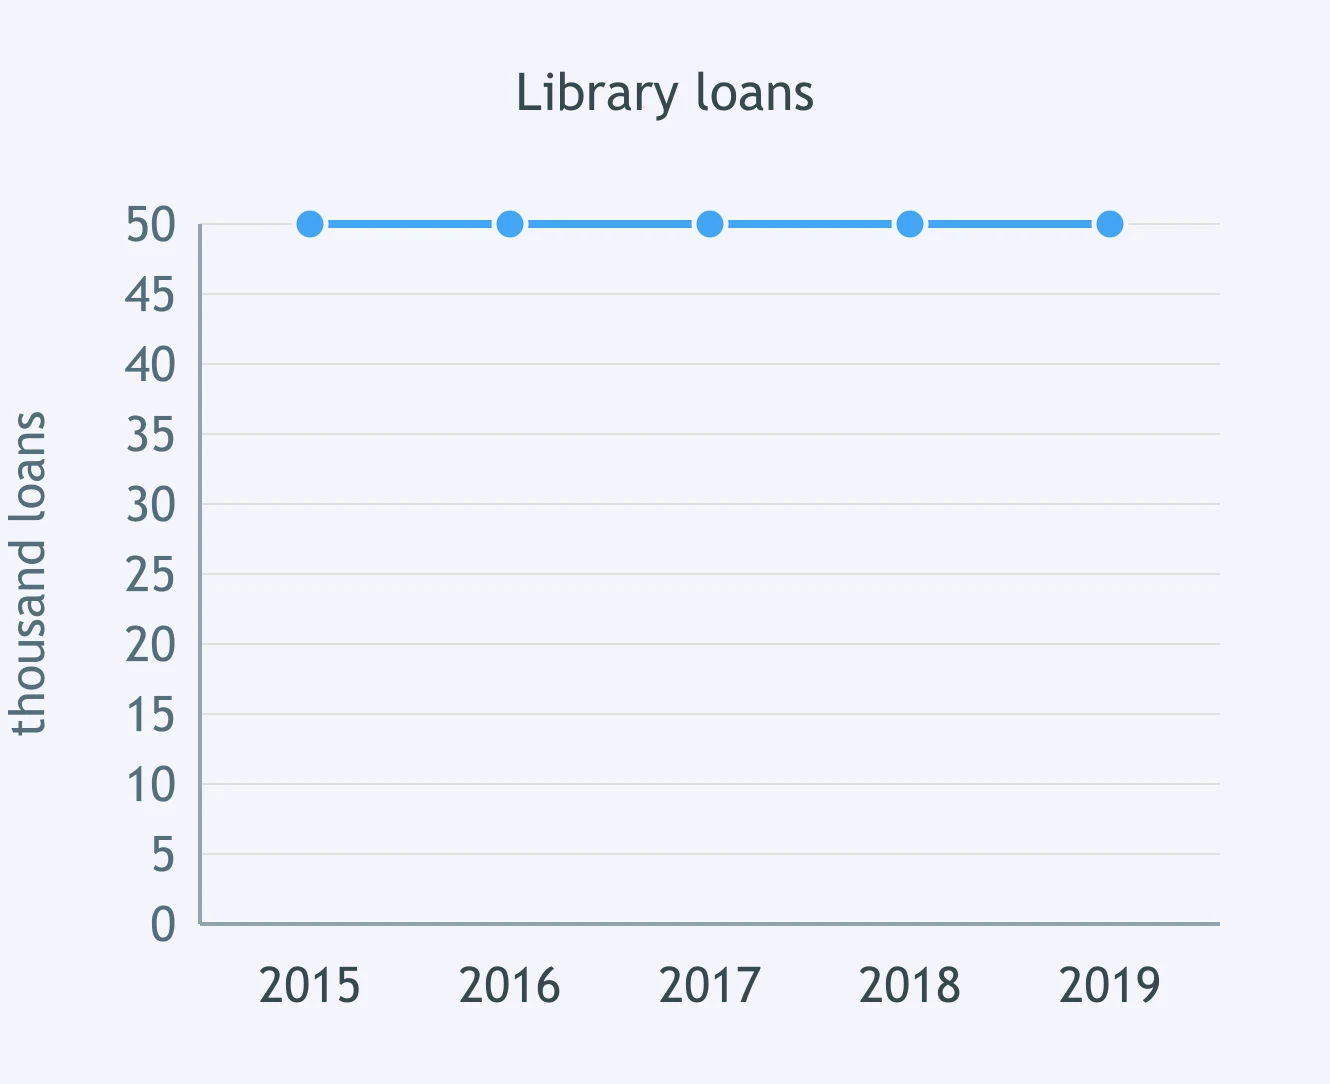
The graph shows library loans. Which sentence describes the loan line from 2015 to 2019?
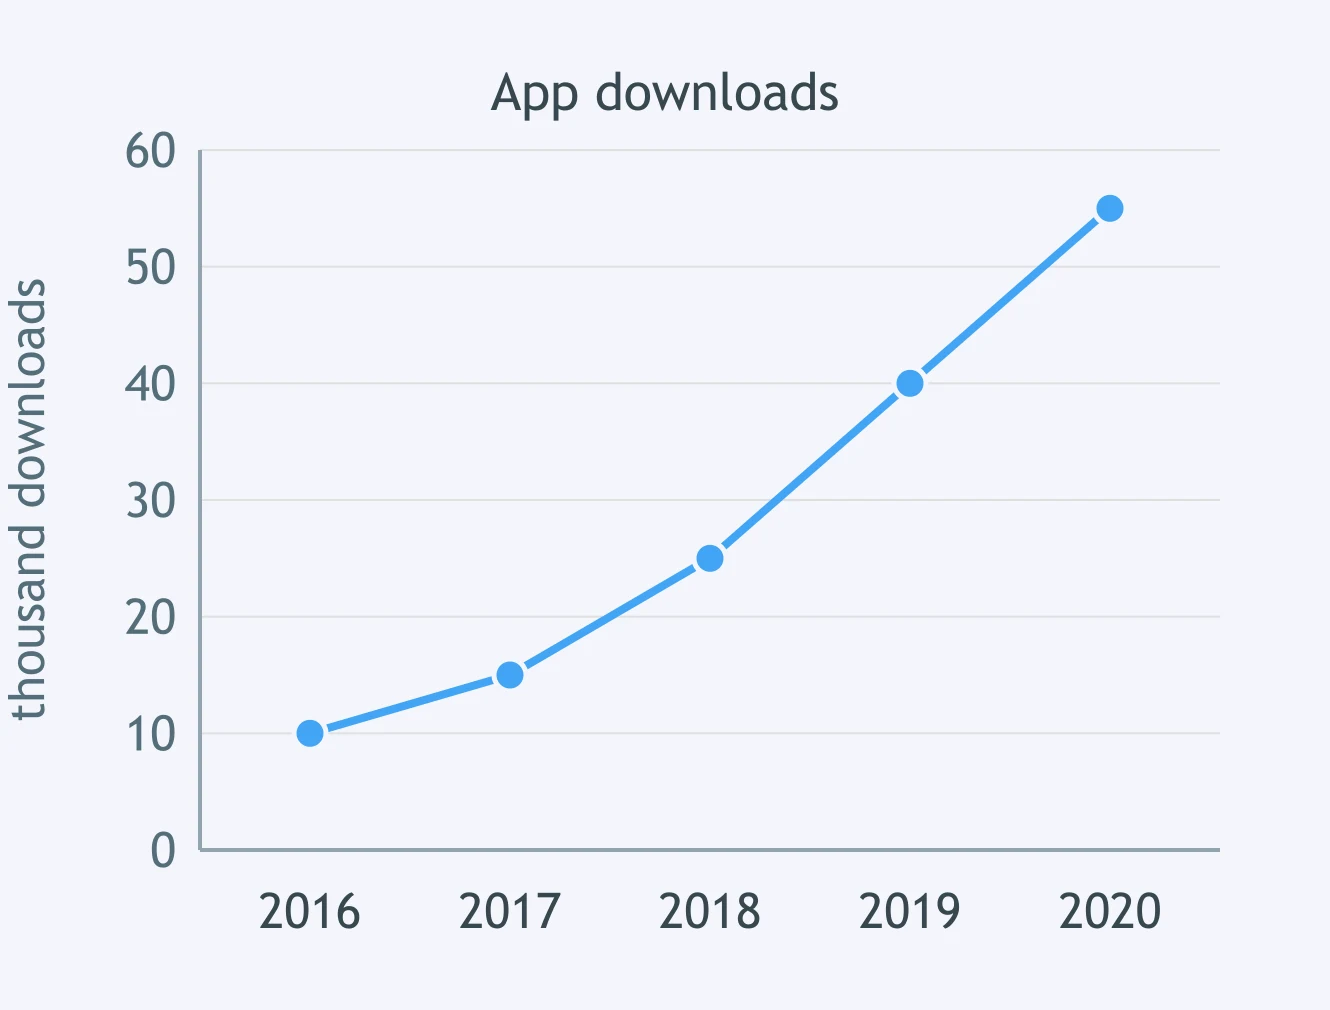
The graph shows app downloads. What did the download line do between 2016 and 2020?
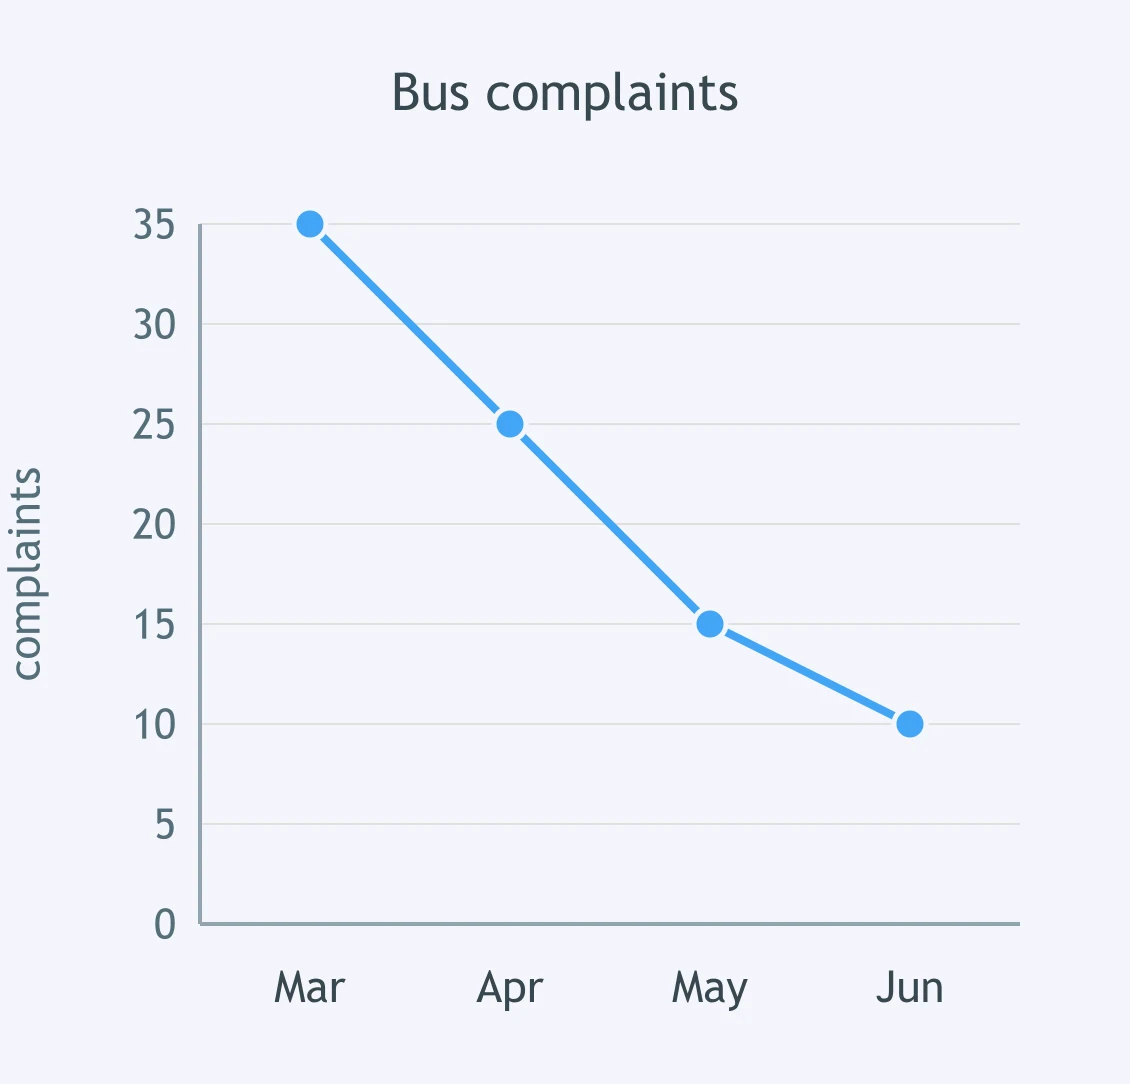
The graph shows bus complaints. How did the complaint line change from March to June?
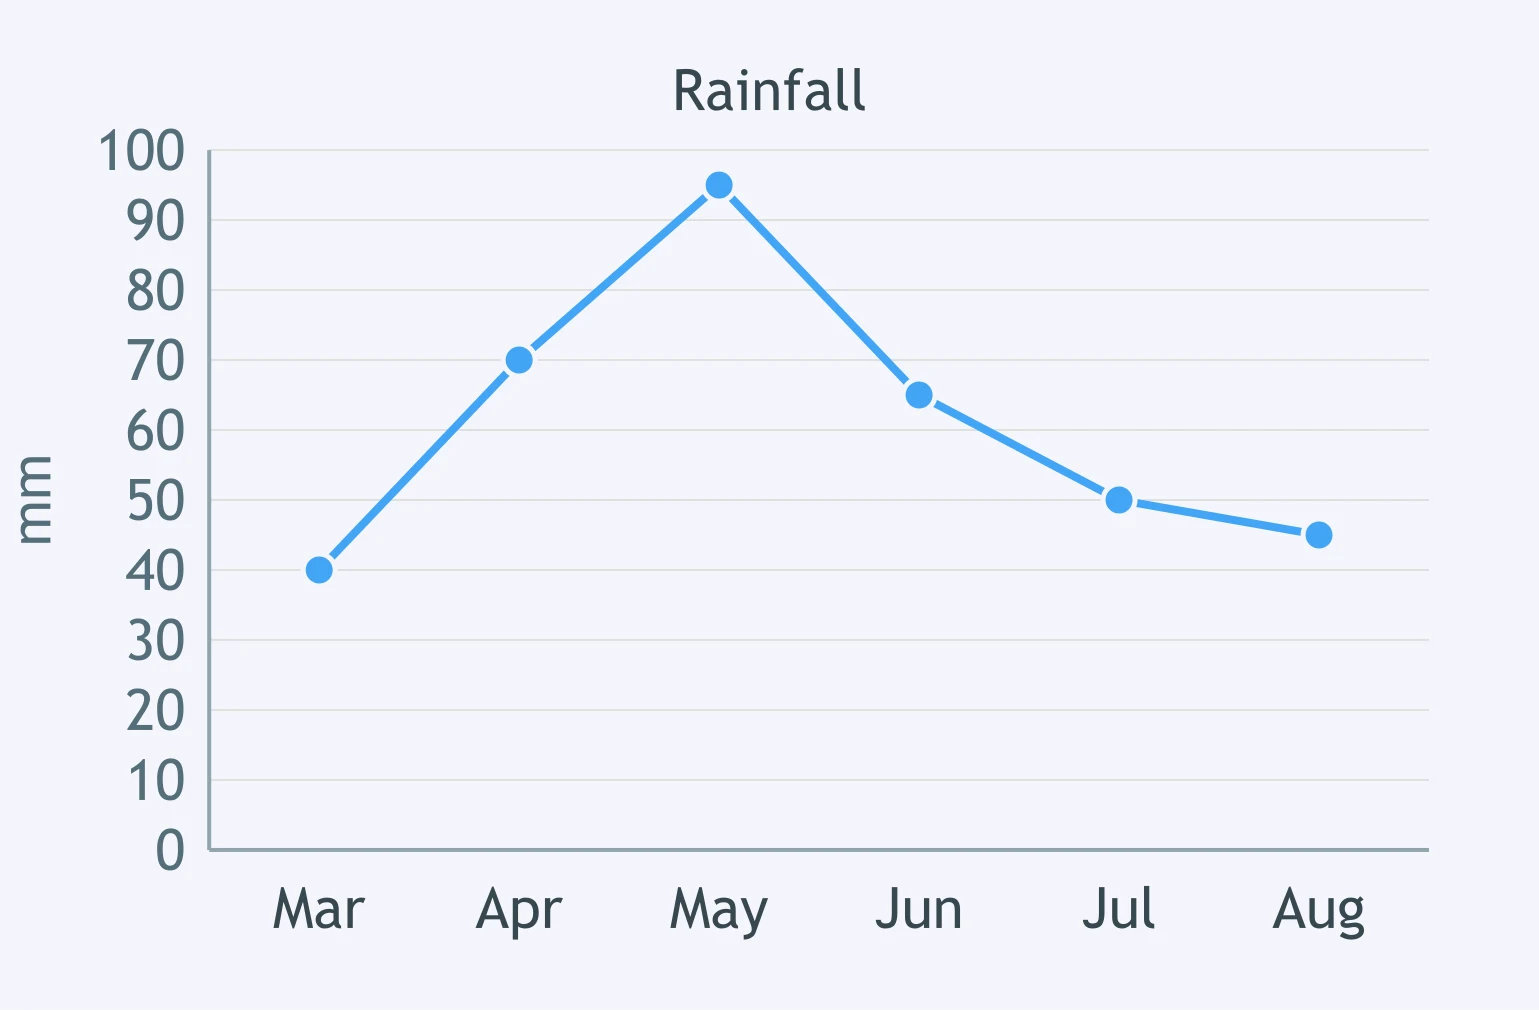
The graph shows rainfall from March to August. Which sentence best describes the rainfall line?
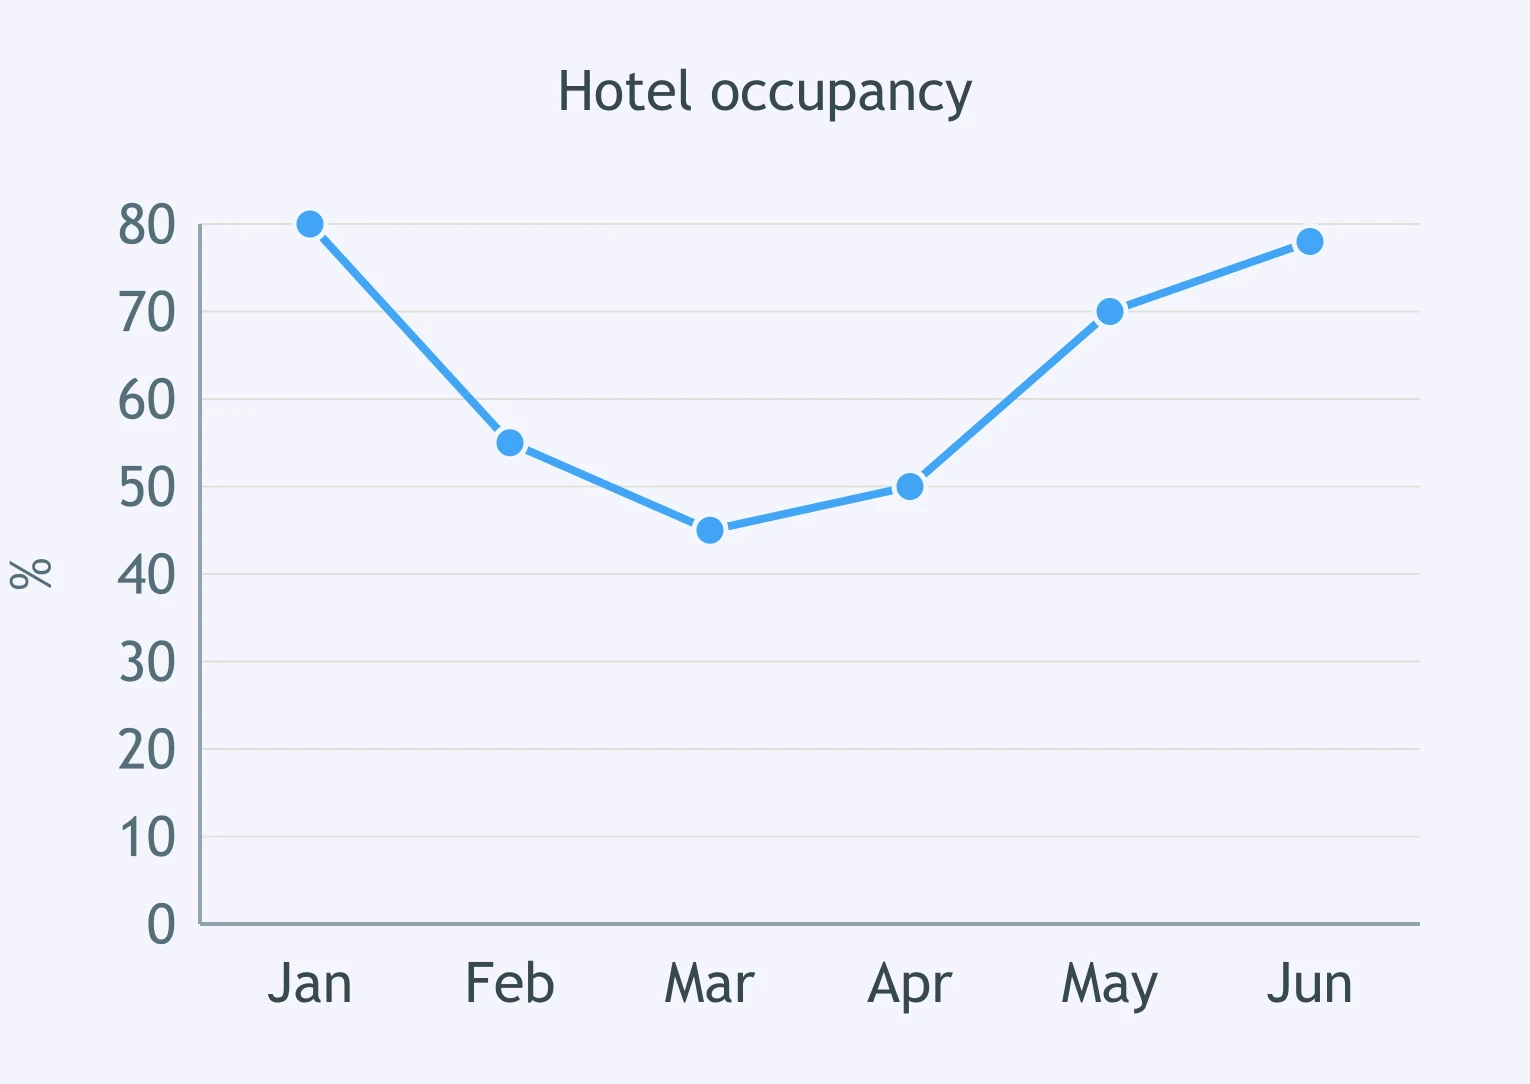
The graph shows hotel occupancy from January to June. Which sentence describes the line?
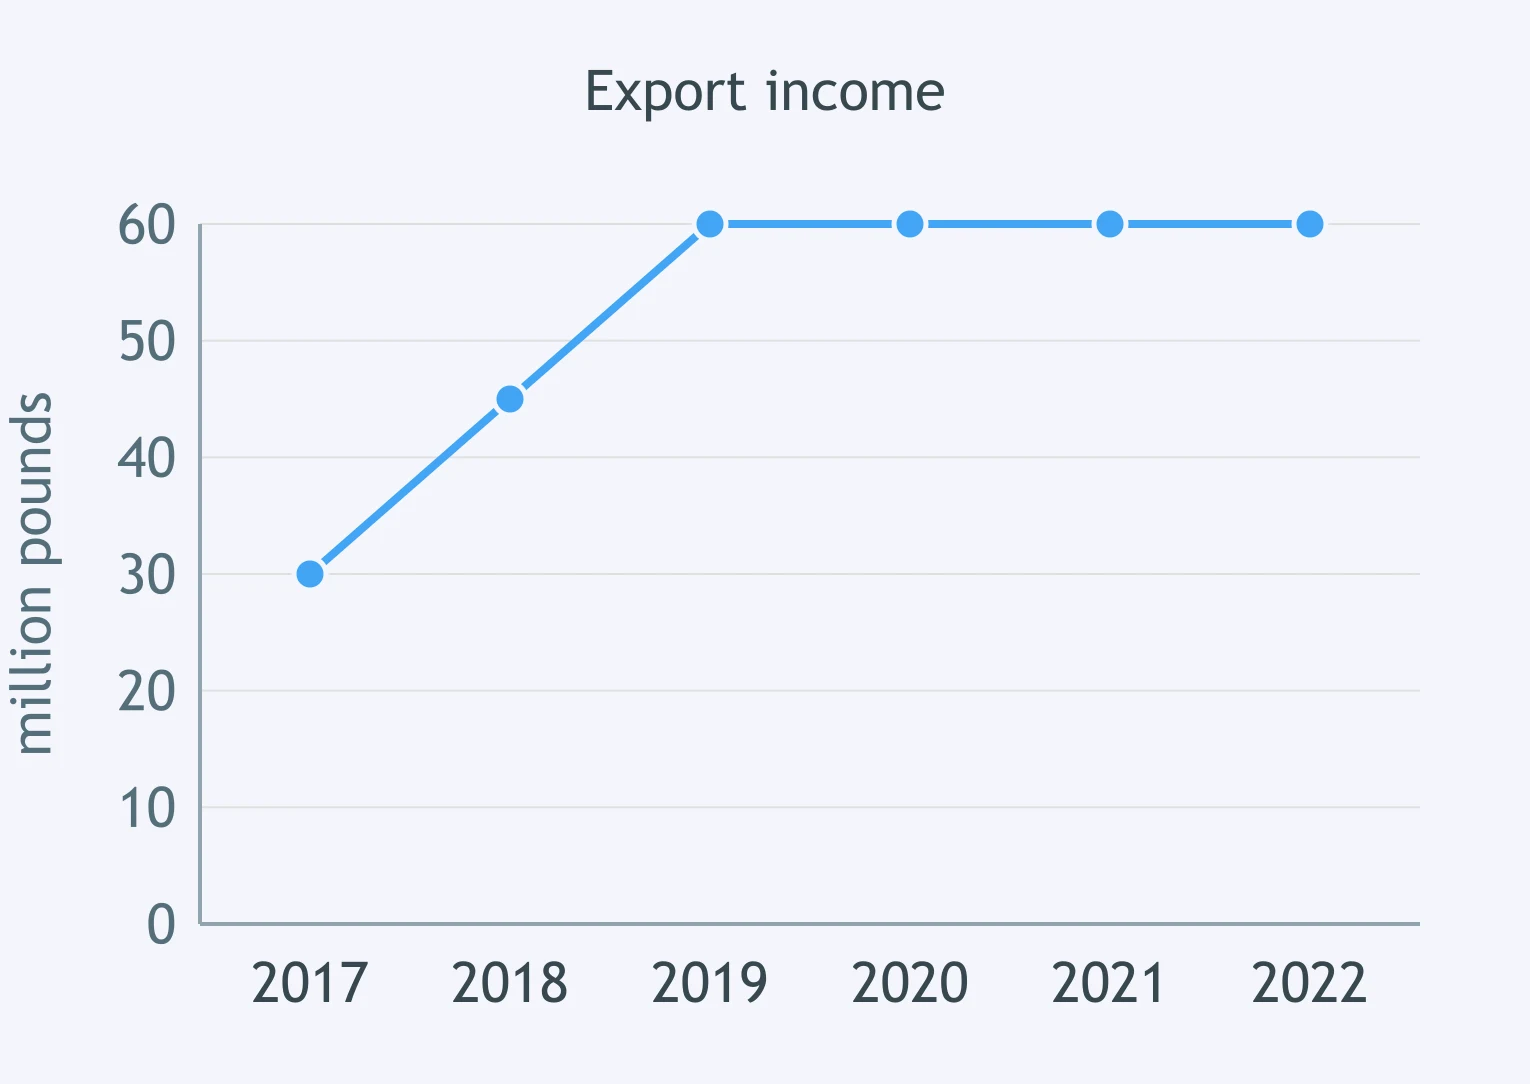
The graph shows export income from 2017 to 2022. Which sentence describes the main pattern?
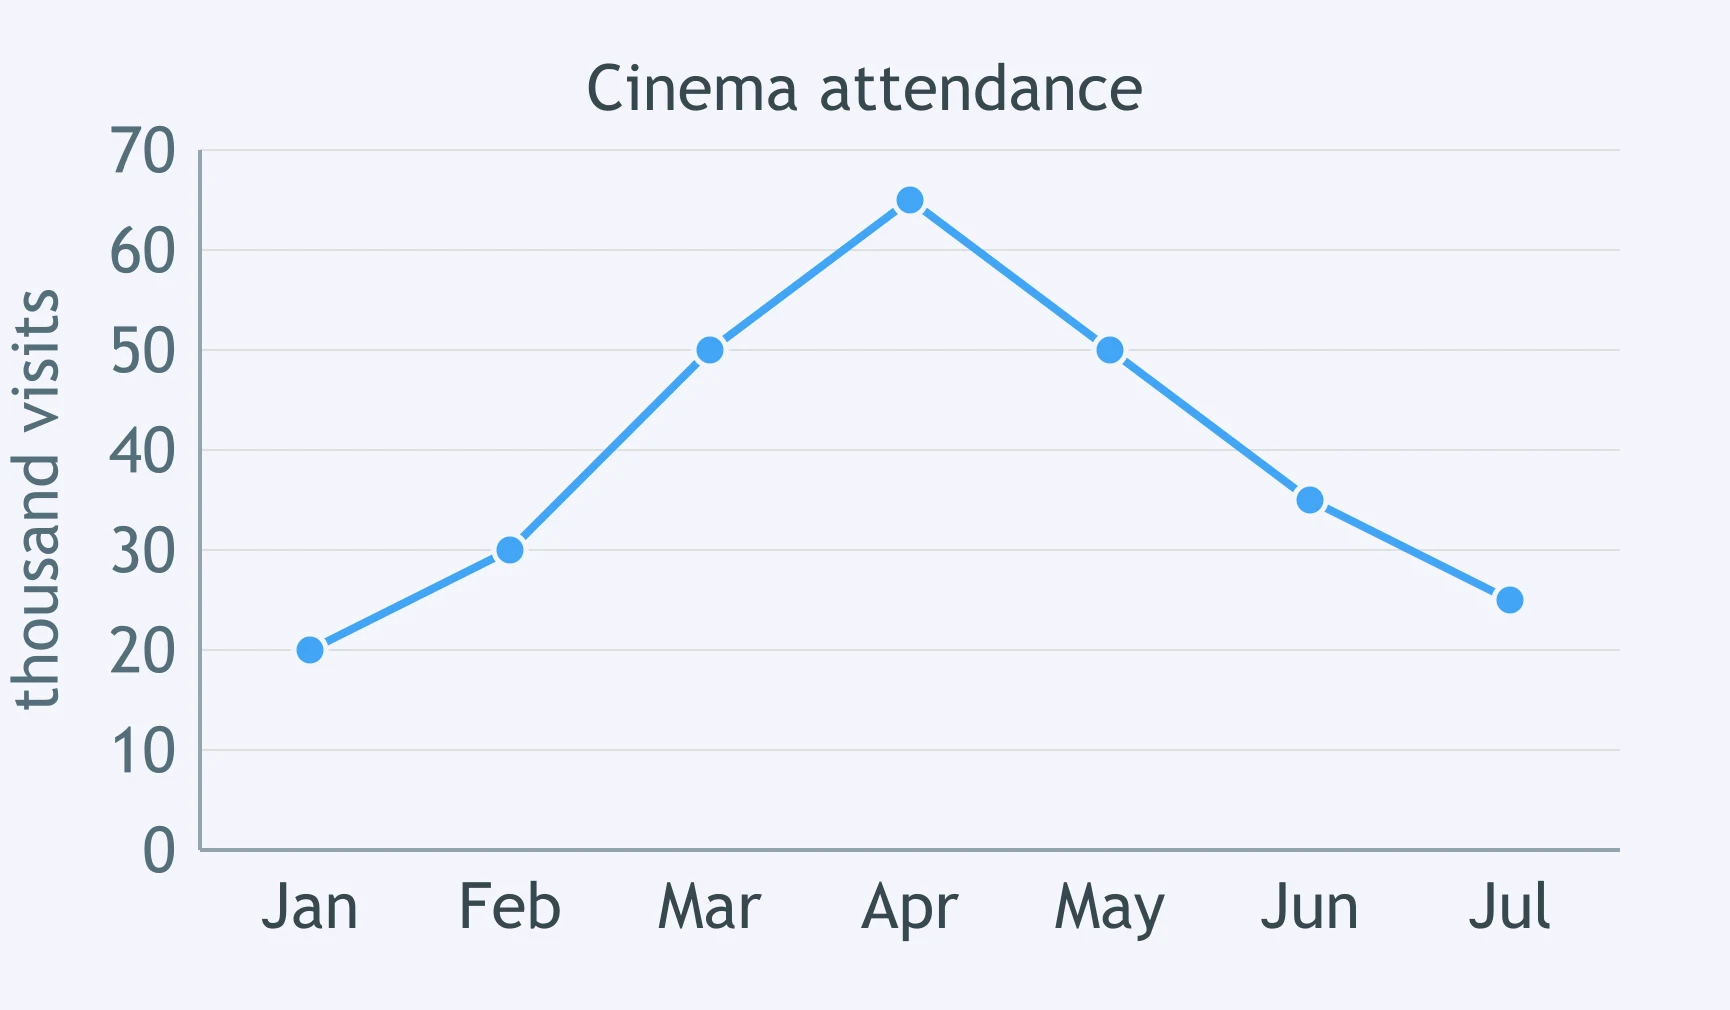
The graph shows cinema attendance from January to July. Which sentence reports the key feature?
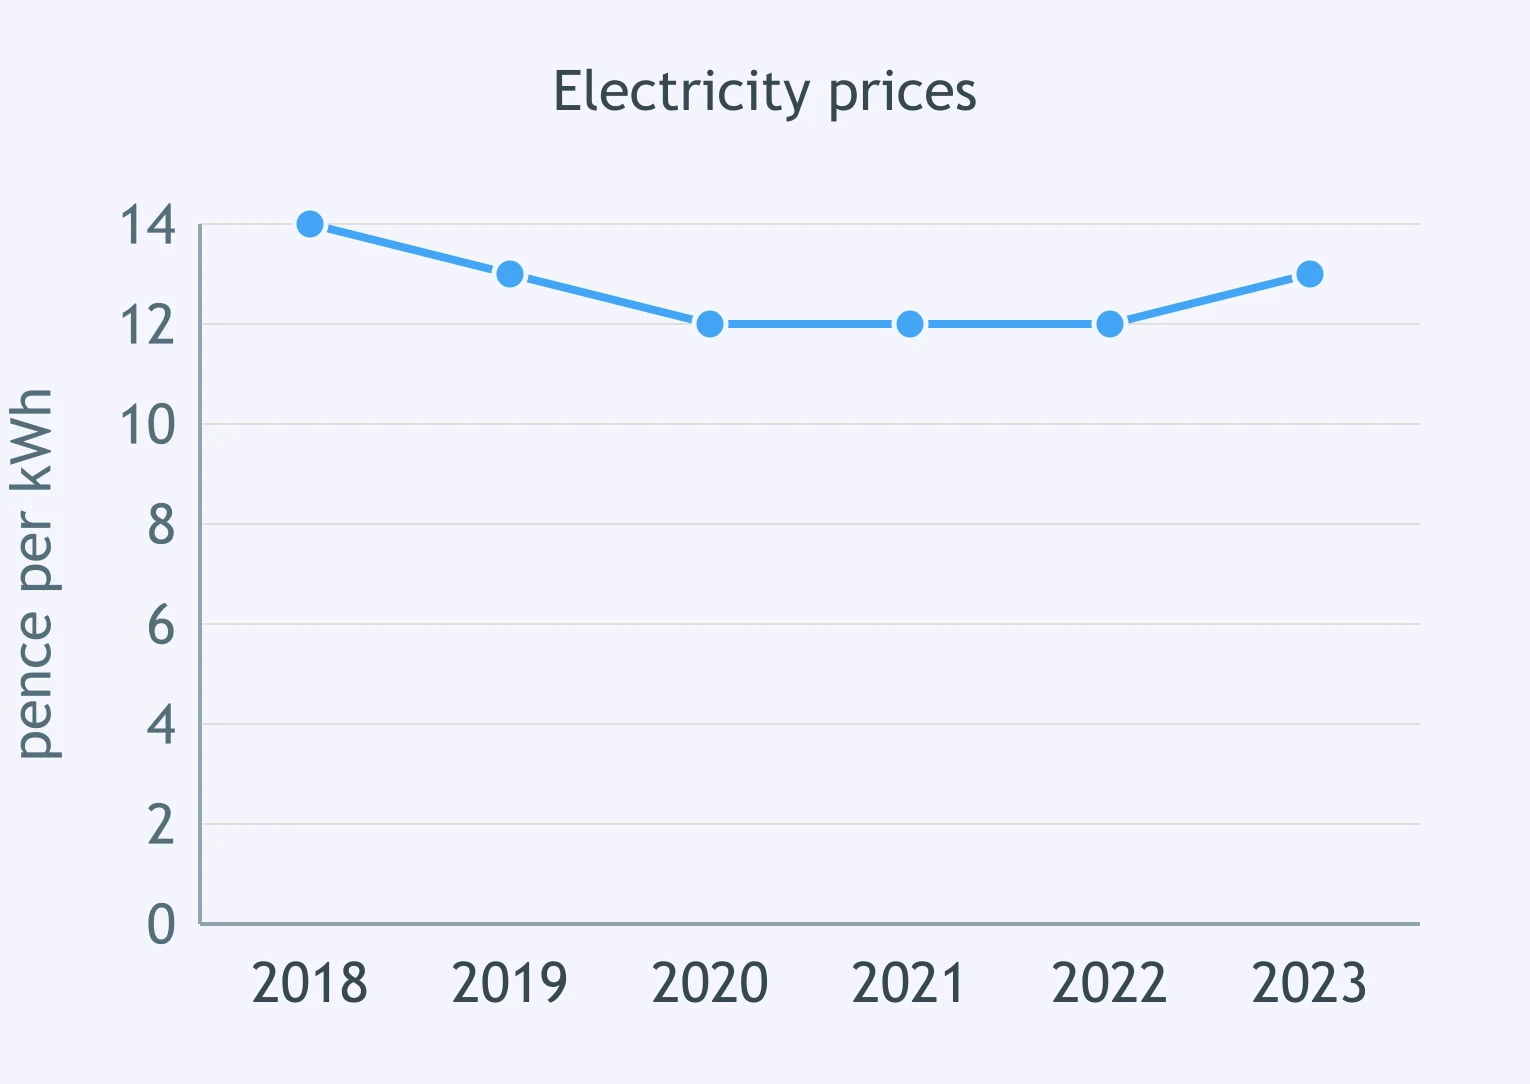
The graph shows electricity prices. Which sentence describes the line from 2018 to 2022?
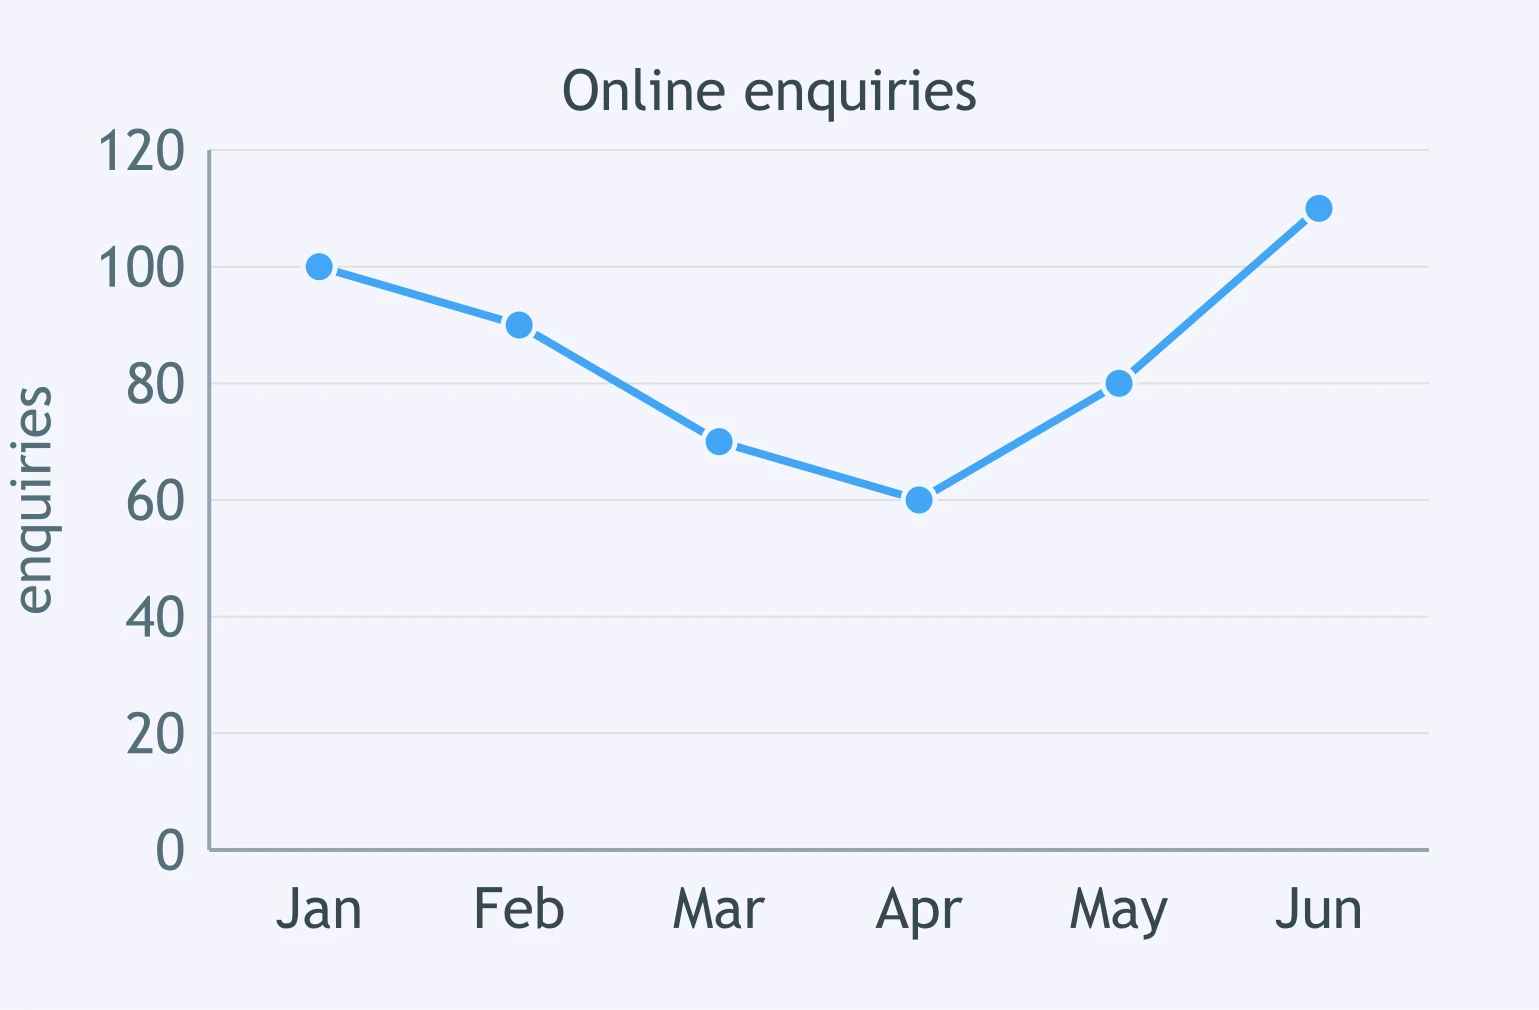
The graph shows online enquiries from January to June. Which sentence describes the shape of the line?
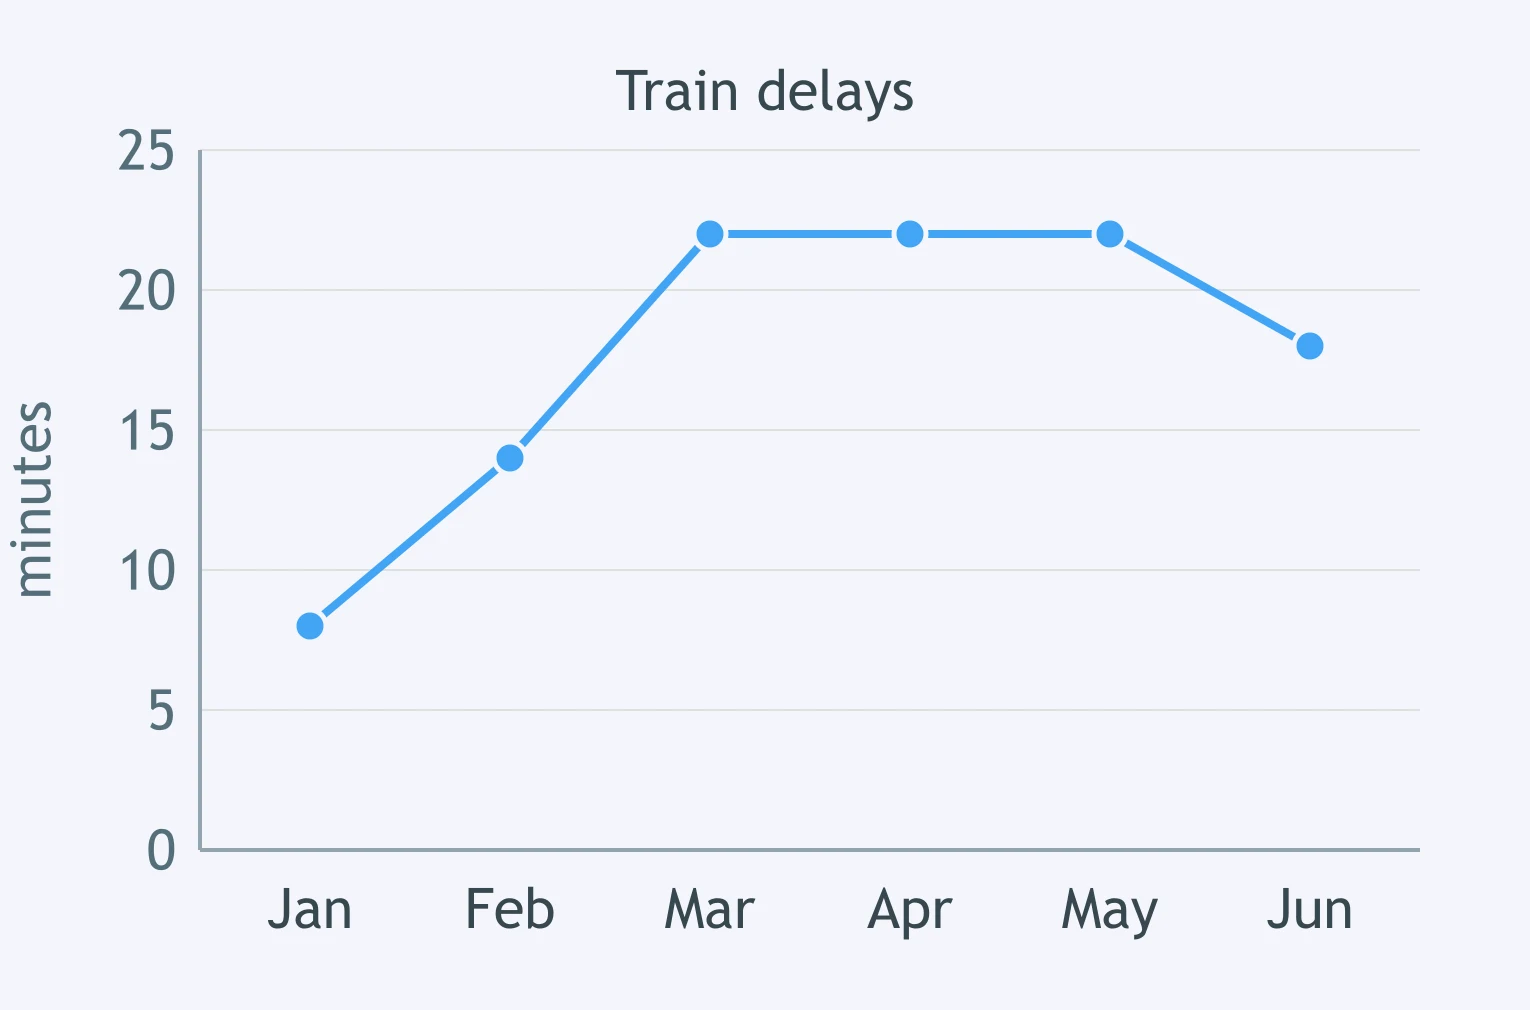
The graph shows train delays. Which sentence describes the delay line from January to May?
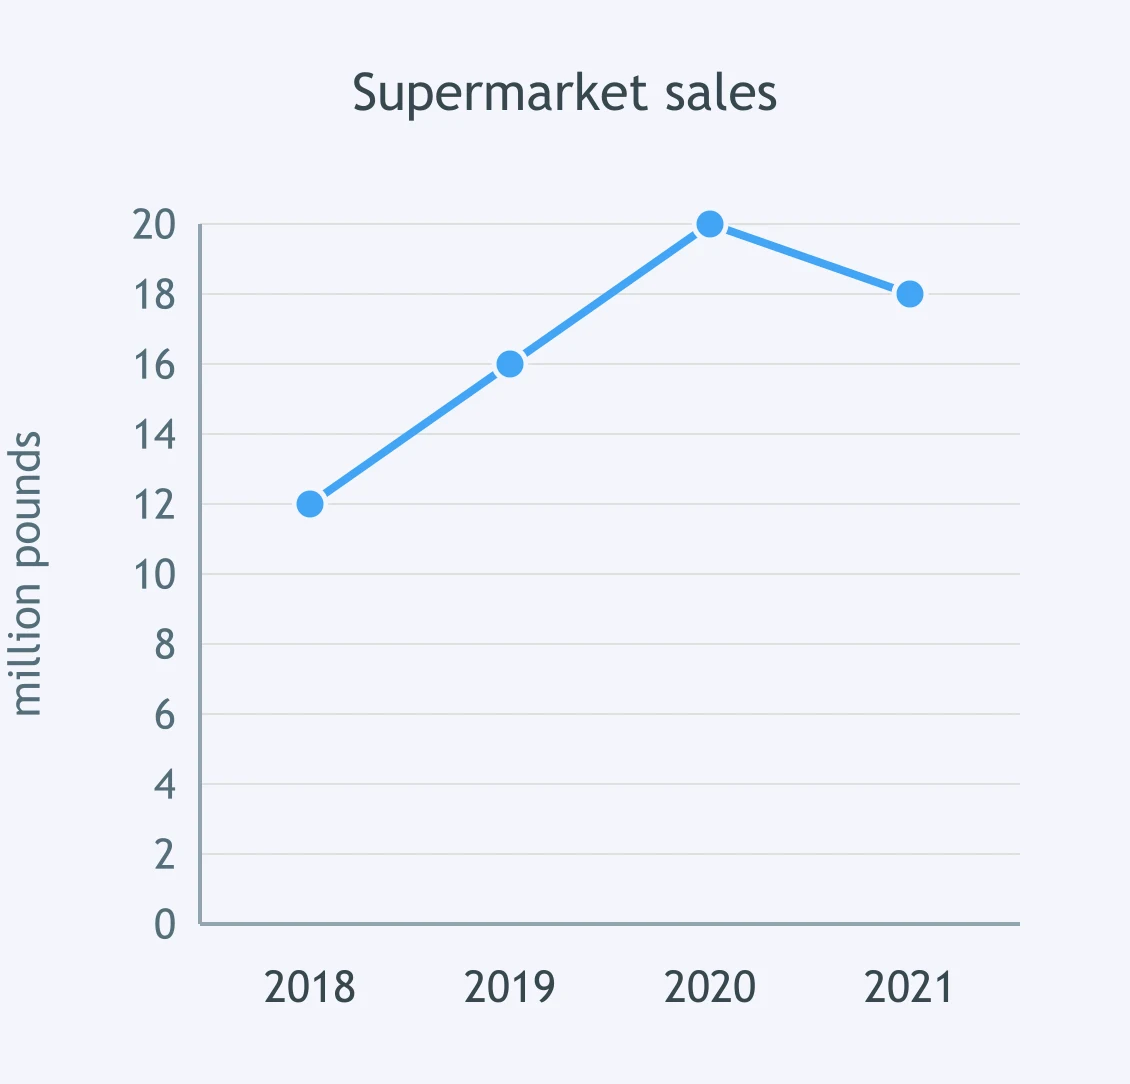
The graph shows supermarket sales. What was the value in 2020?
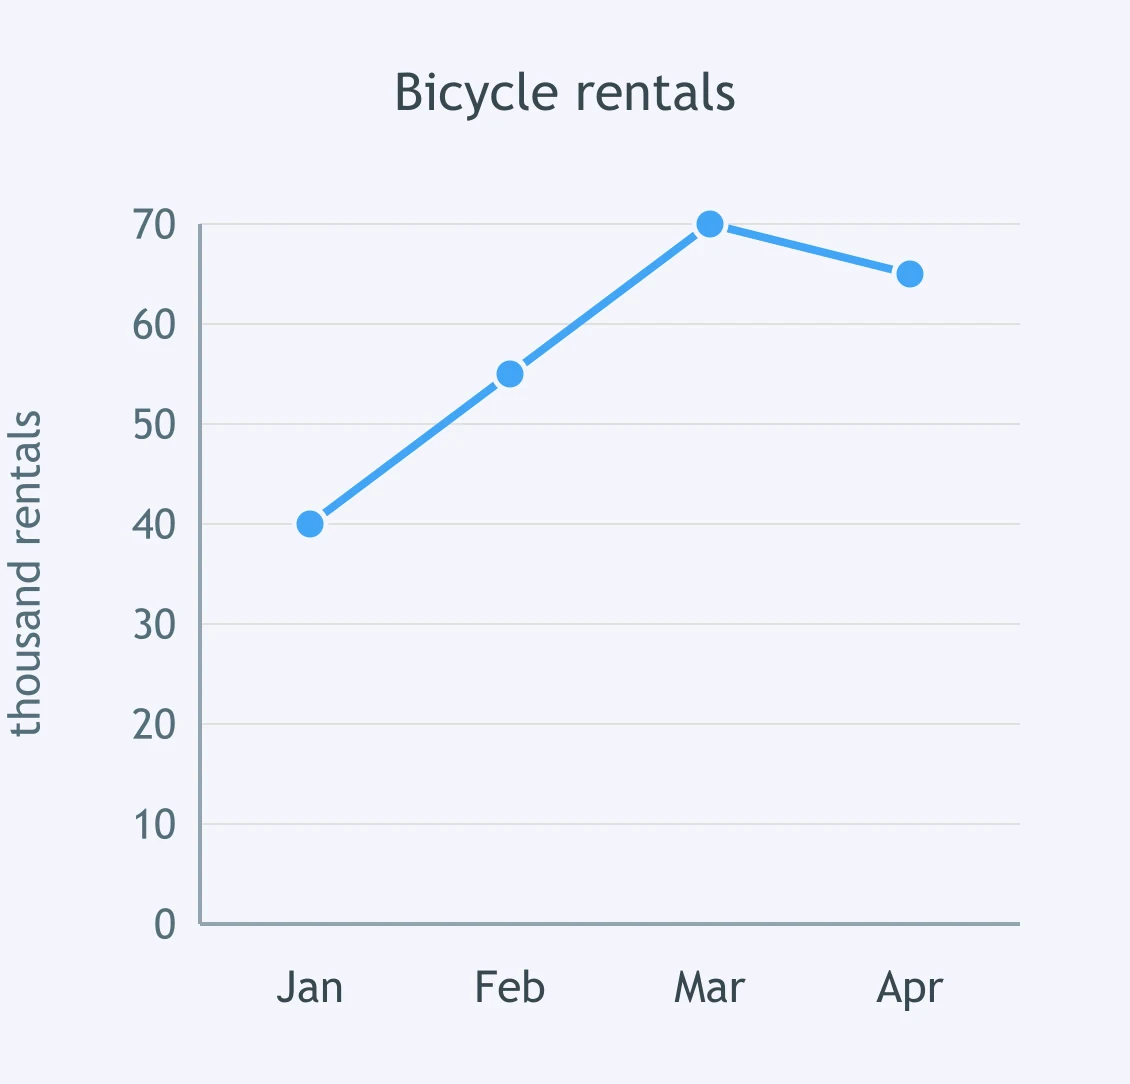
The graph shows bicycle rentals. In which month did rentals first reach 70 thousand?
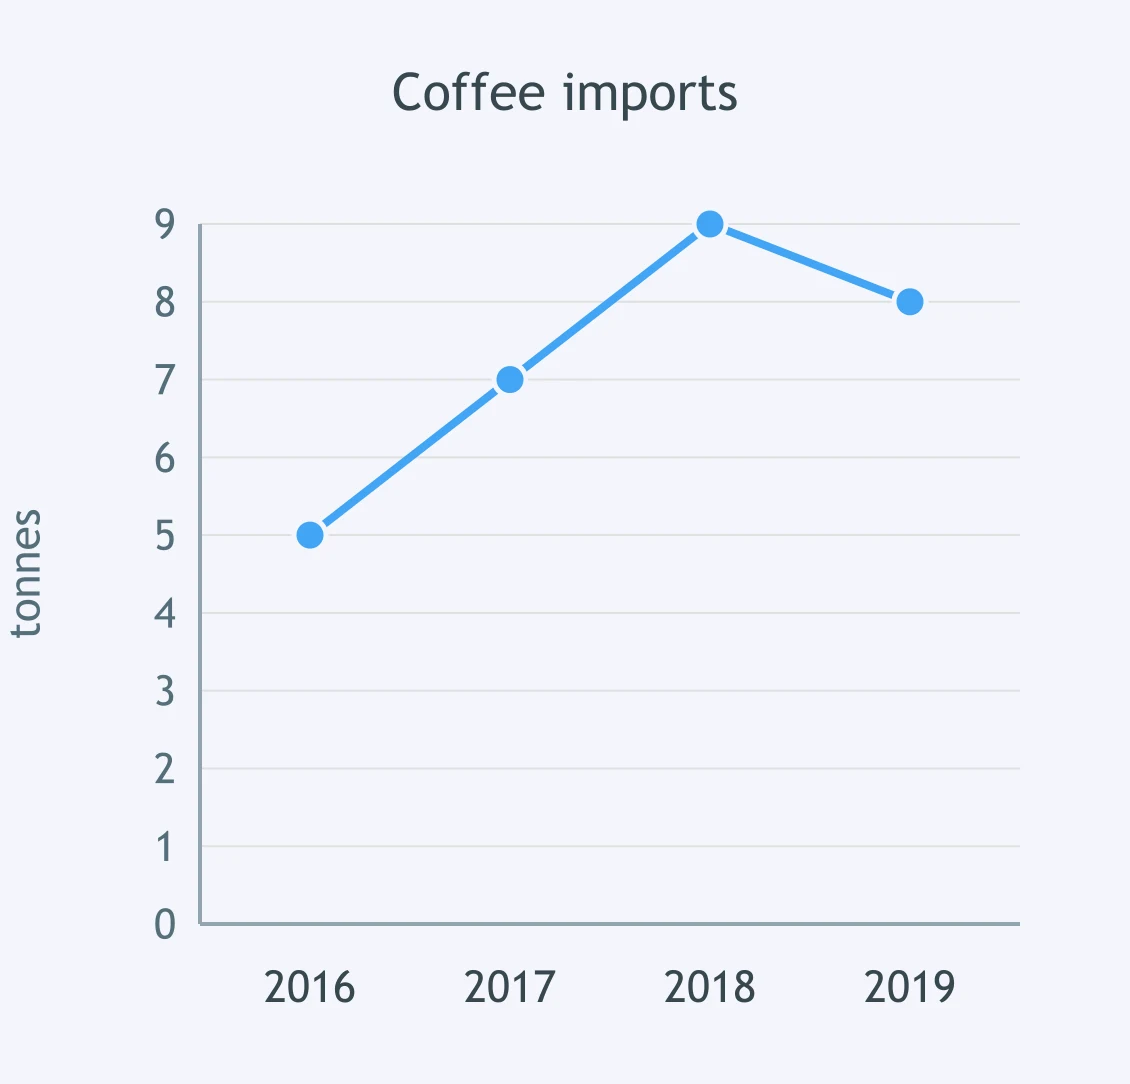
The graph shows coffee imports. What was the value in 2017?
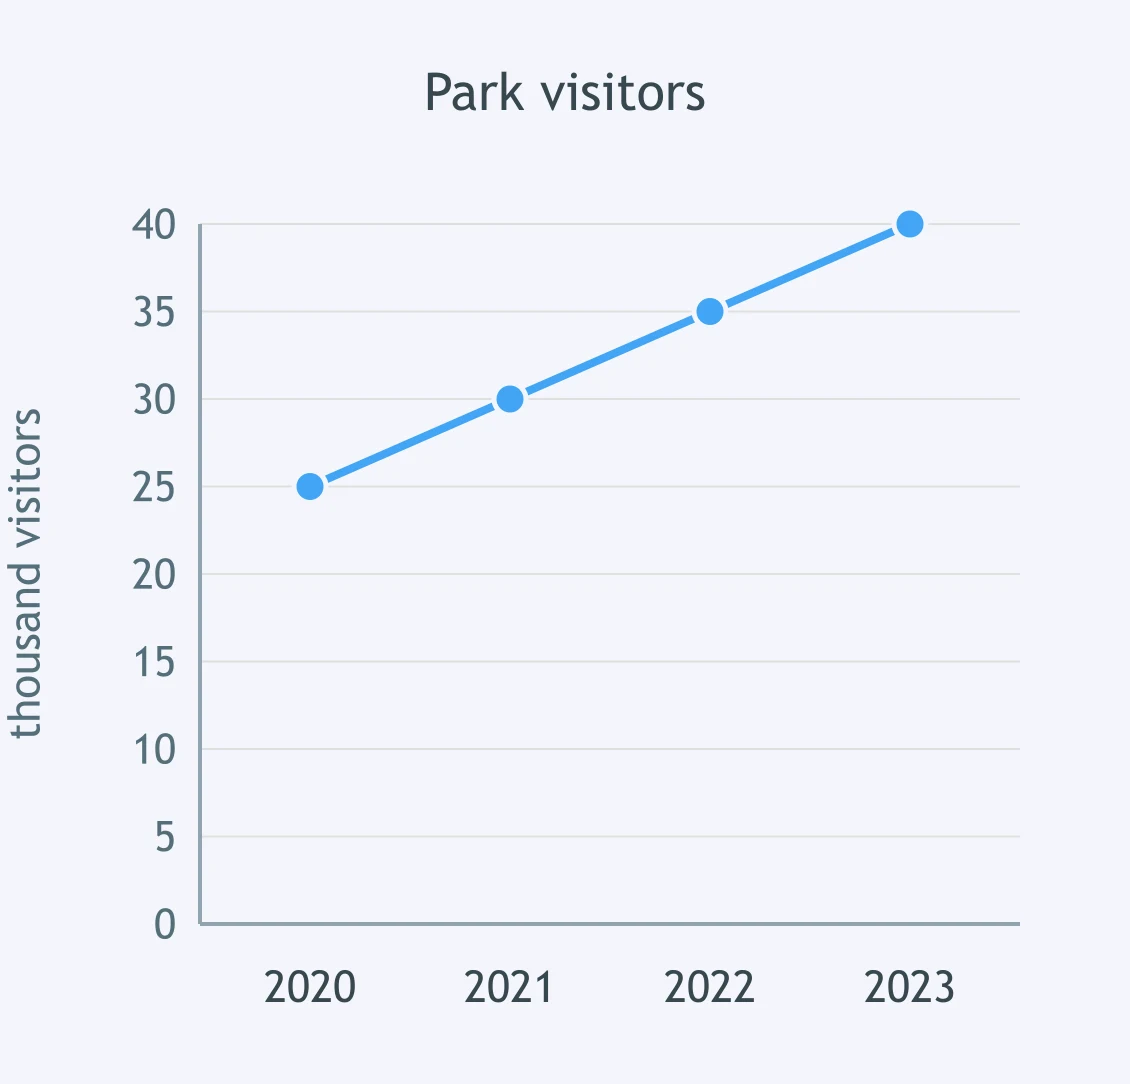
The graph shows park visitors. In which year did the line reach 35 thousand visitors?
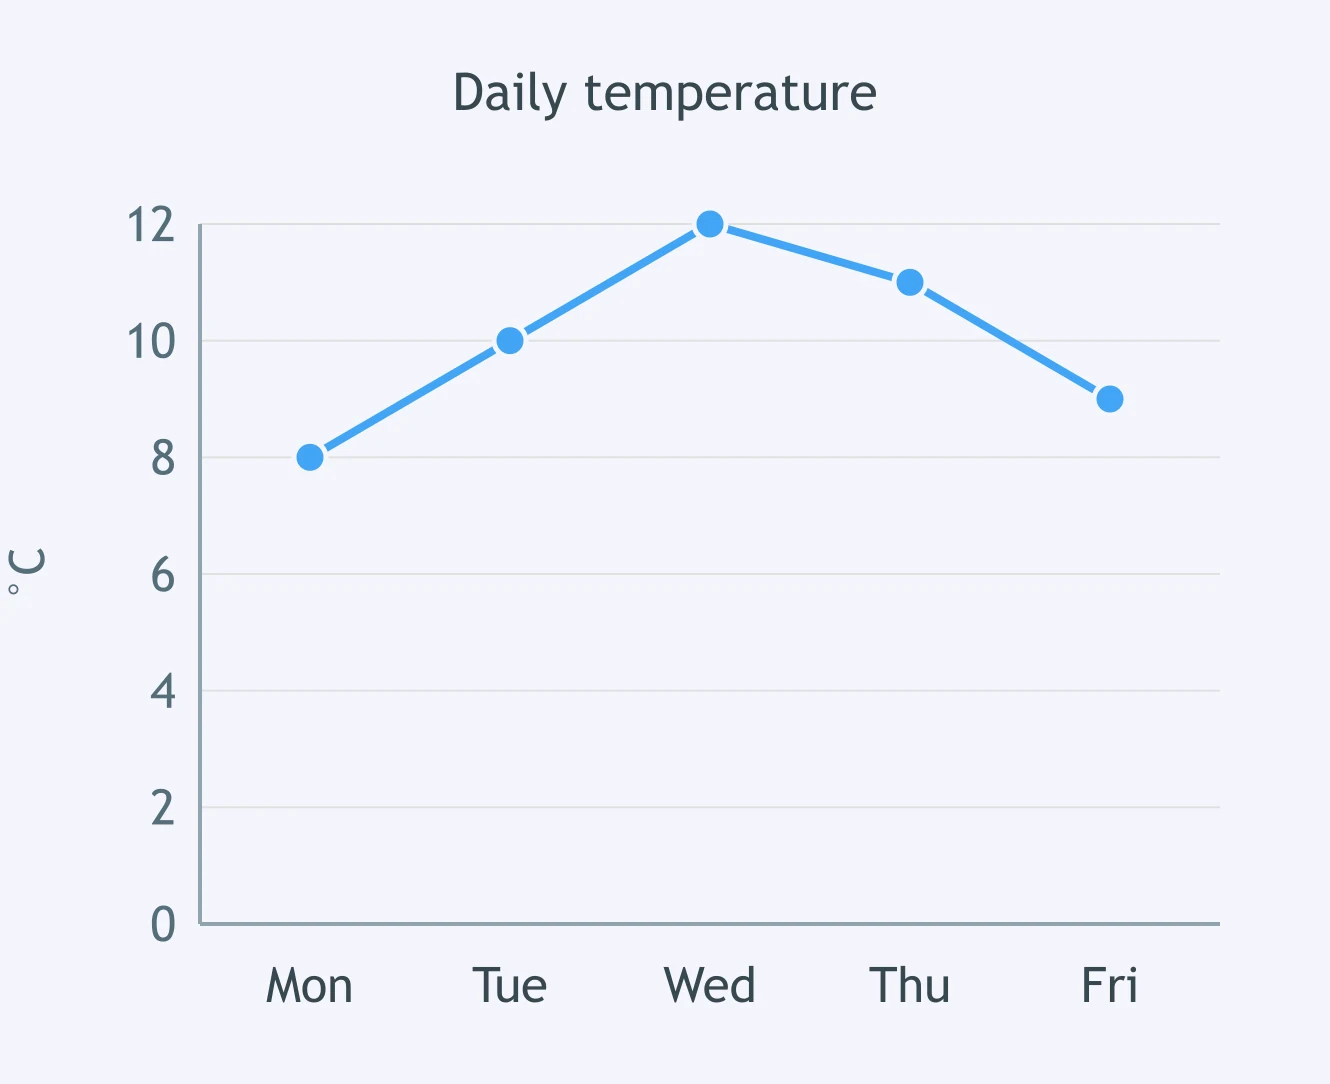
The graph shows daily temperature. What was the temperature on Wednesday?
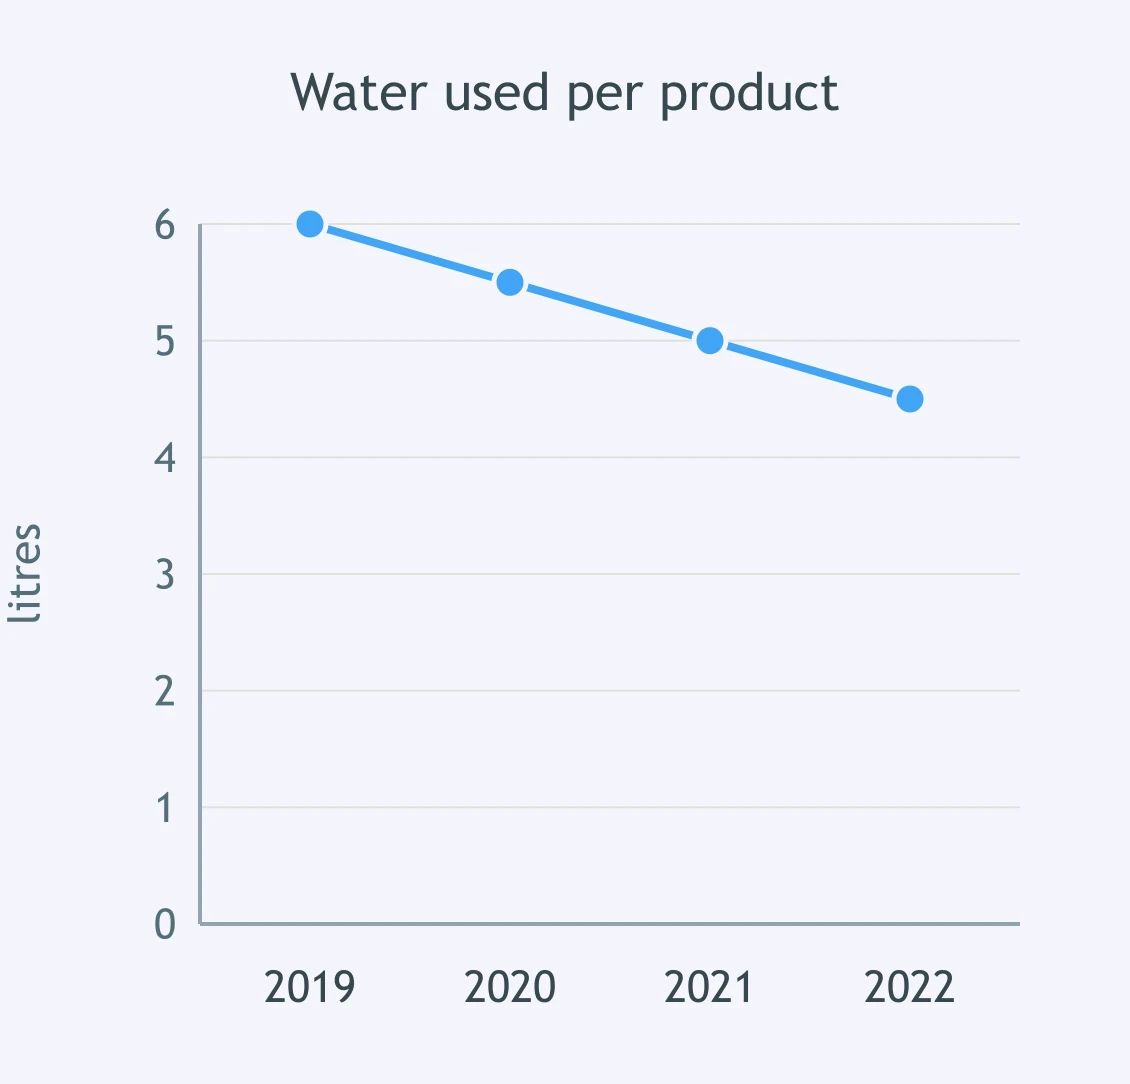
The graph shows water used per product. What was the value in 2021?
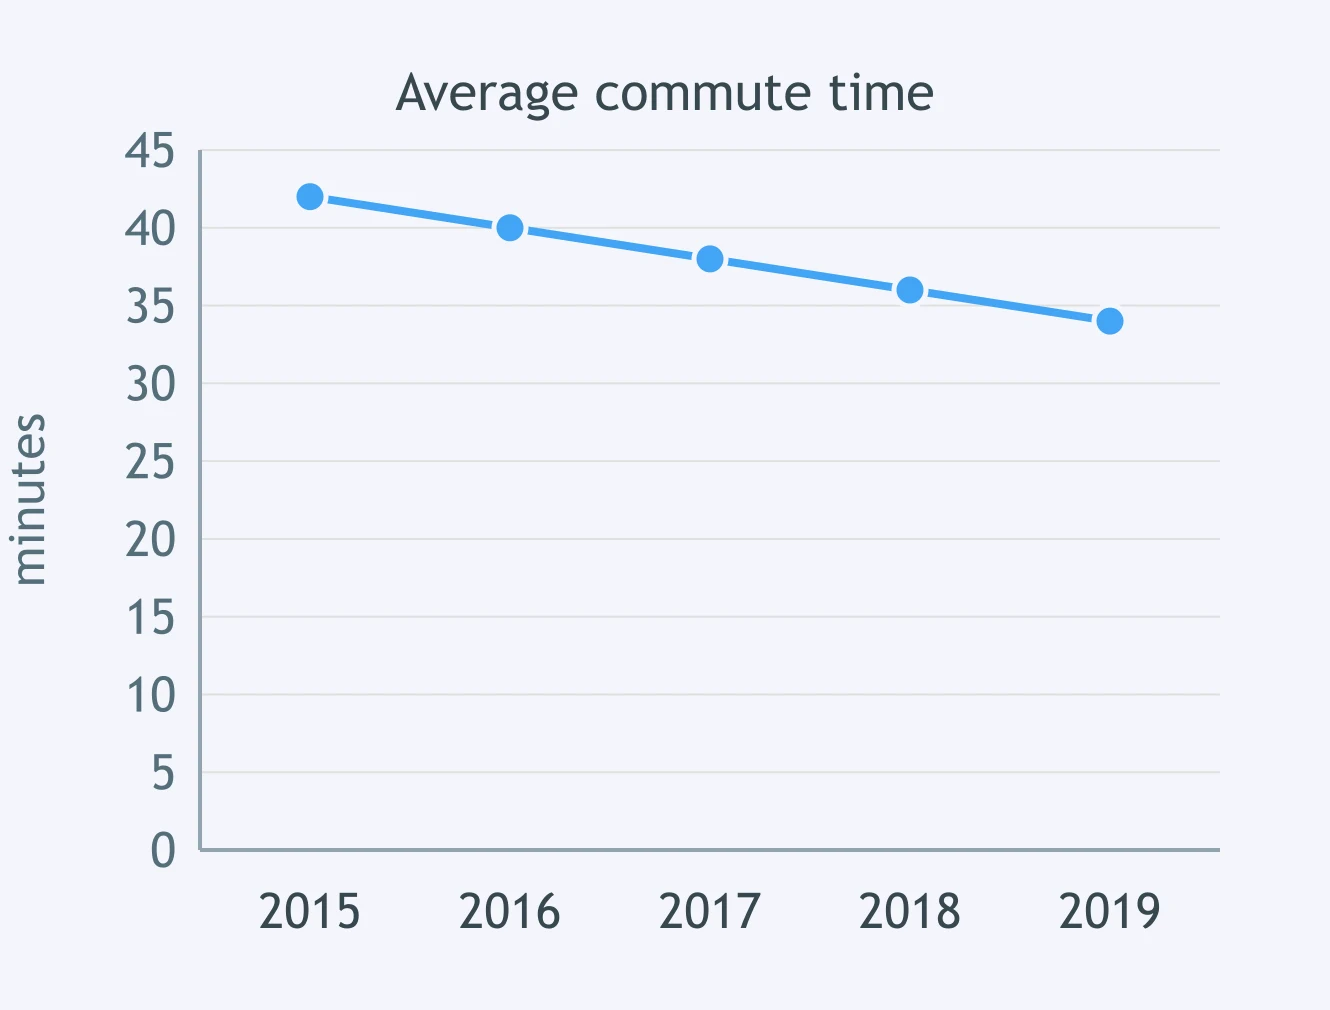
The graph shows average commute time. In which year was the time 38 minutes?
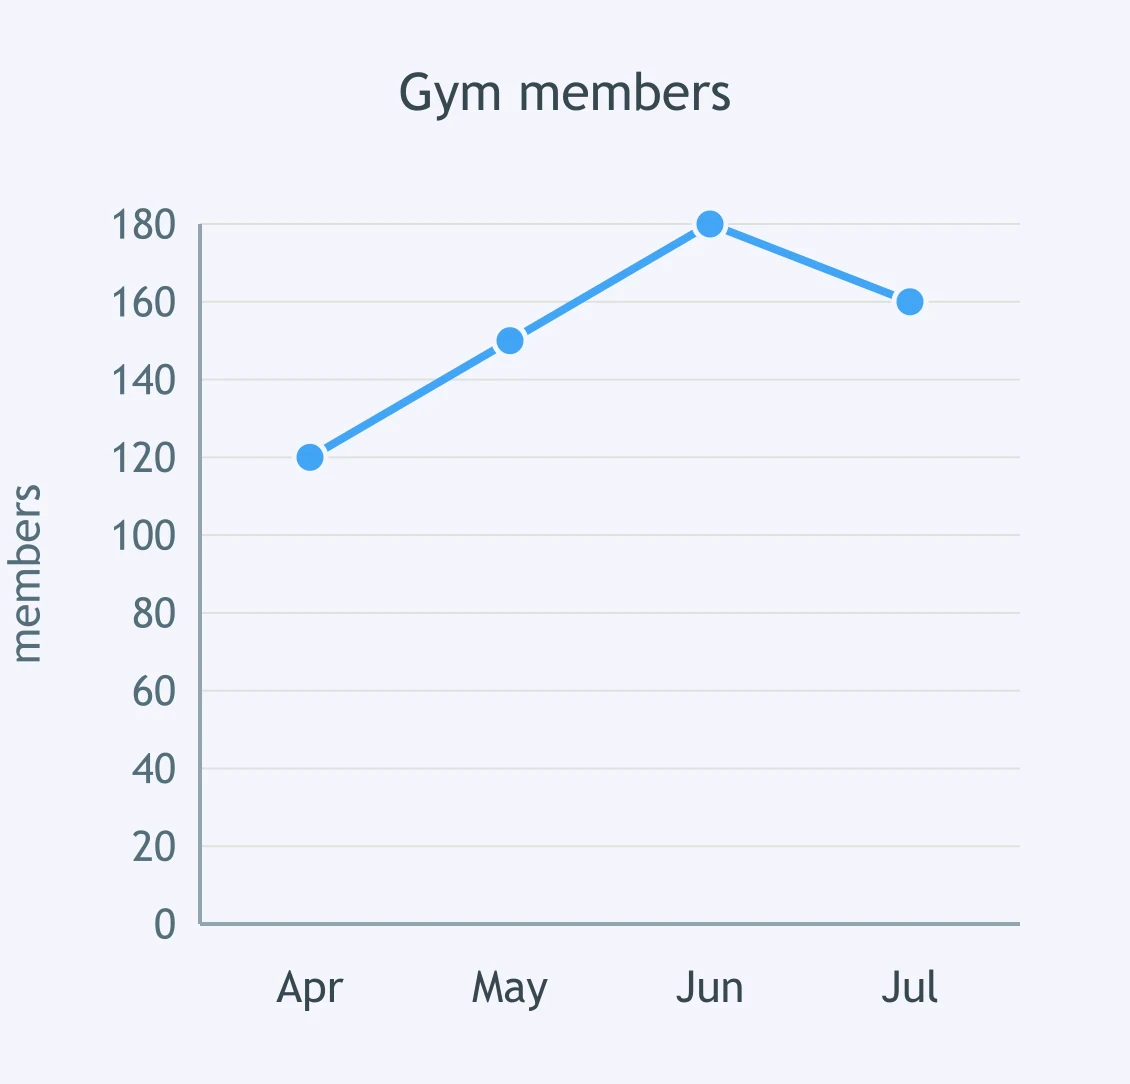
The graph shows gym members. What was the figure in June?
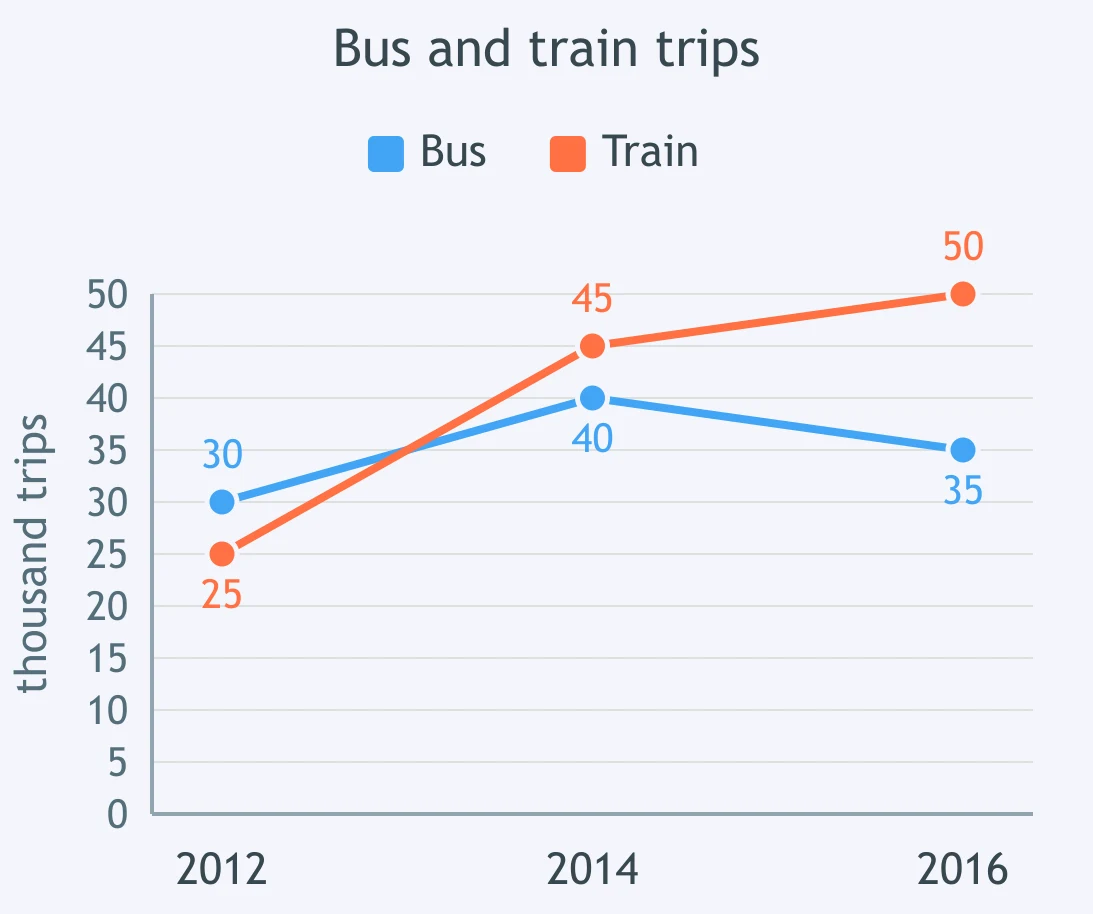
The graph shows bus and train trips. Which statement is true for 2014?
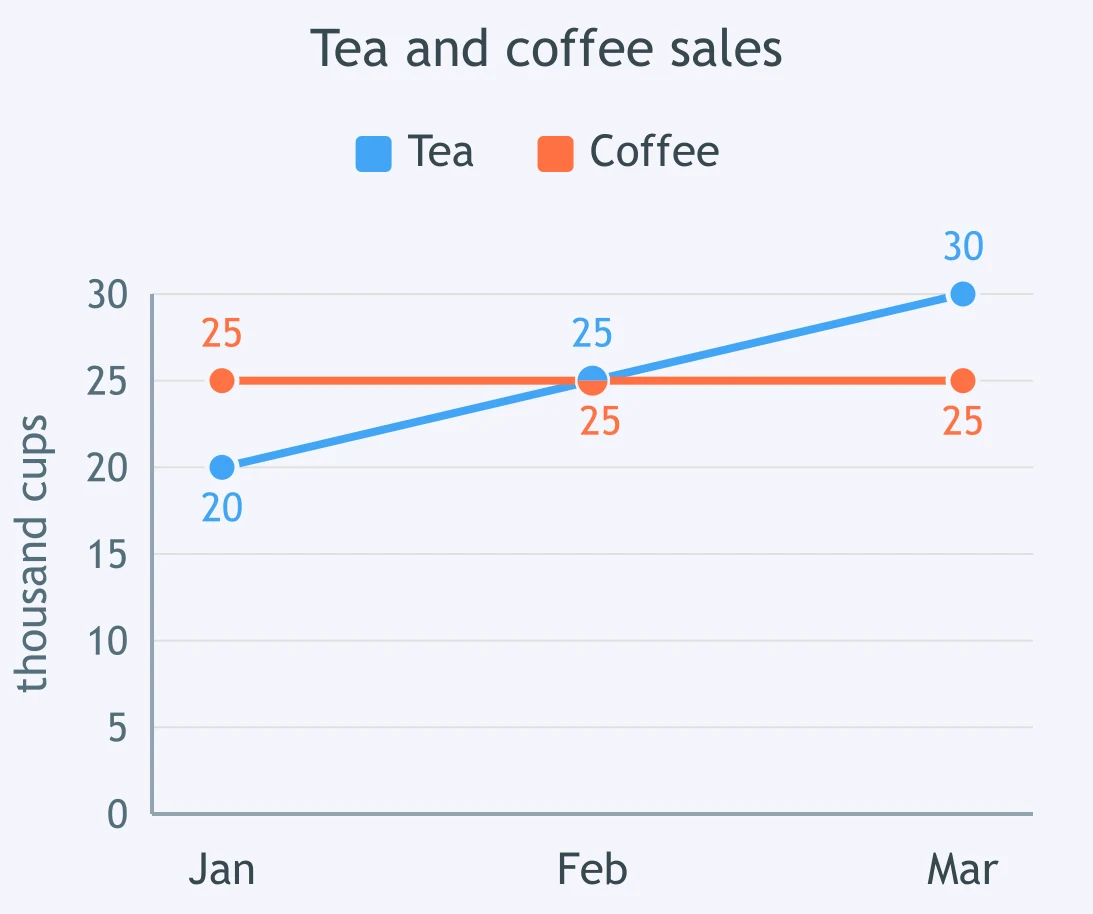
The graph shows tea and coffee sales. Which statement is true for March?
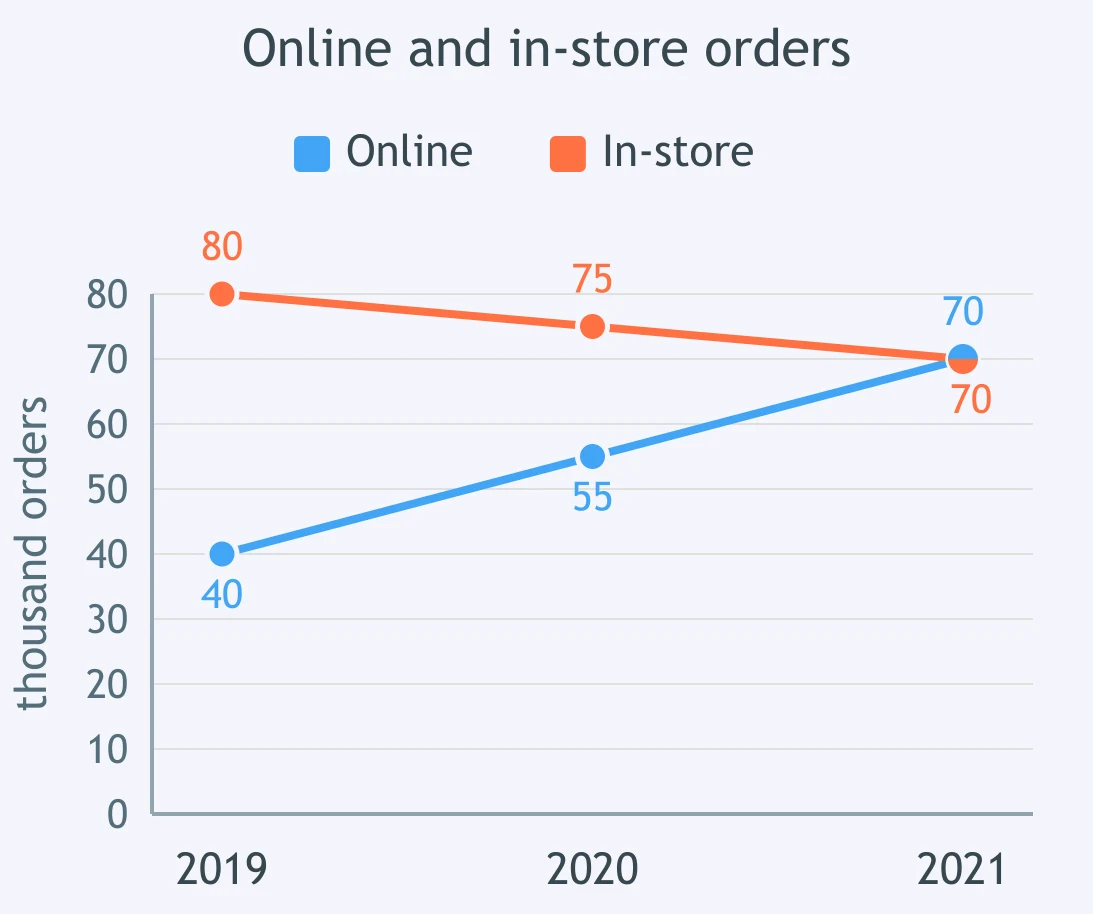
The graph shows online and in-store orders. Which statement is true for 2021?
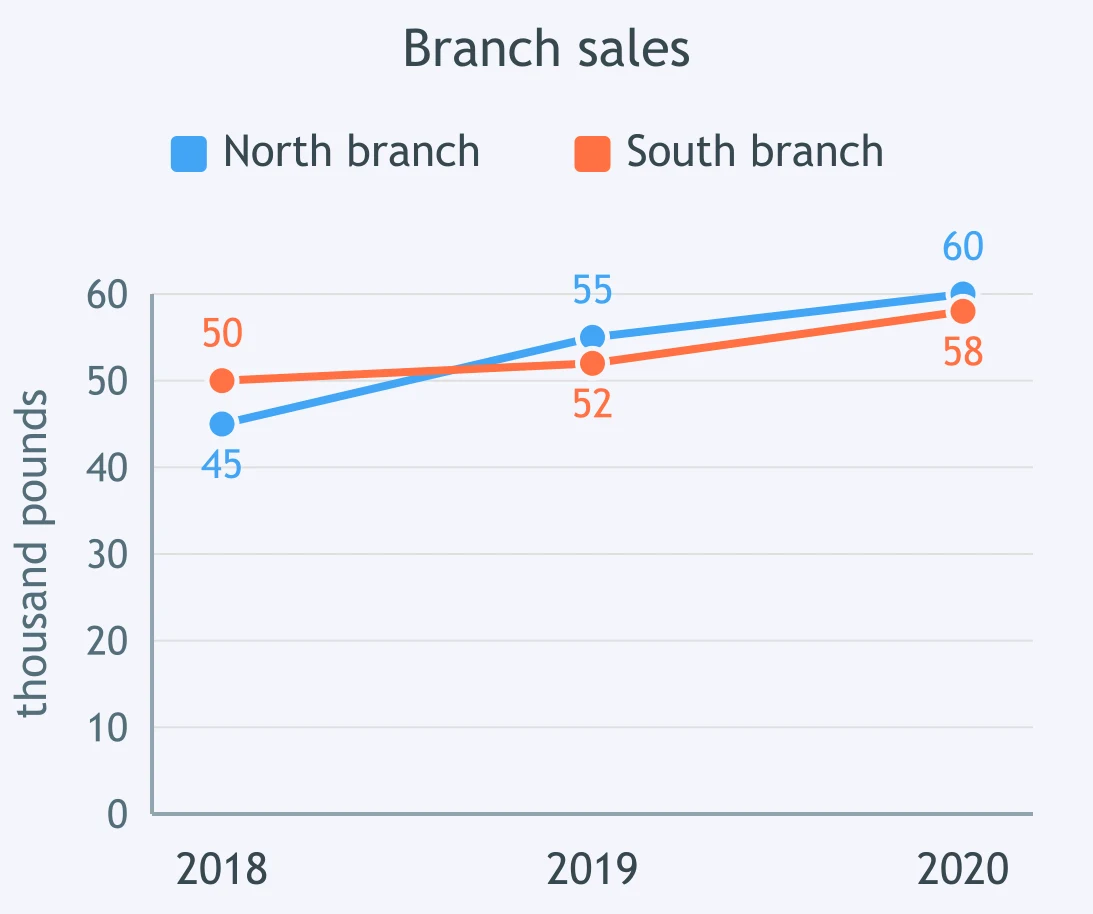
The graph shows sales at the north and south branches. Which statement is true for 2020?
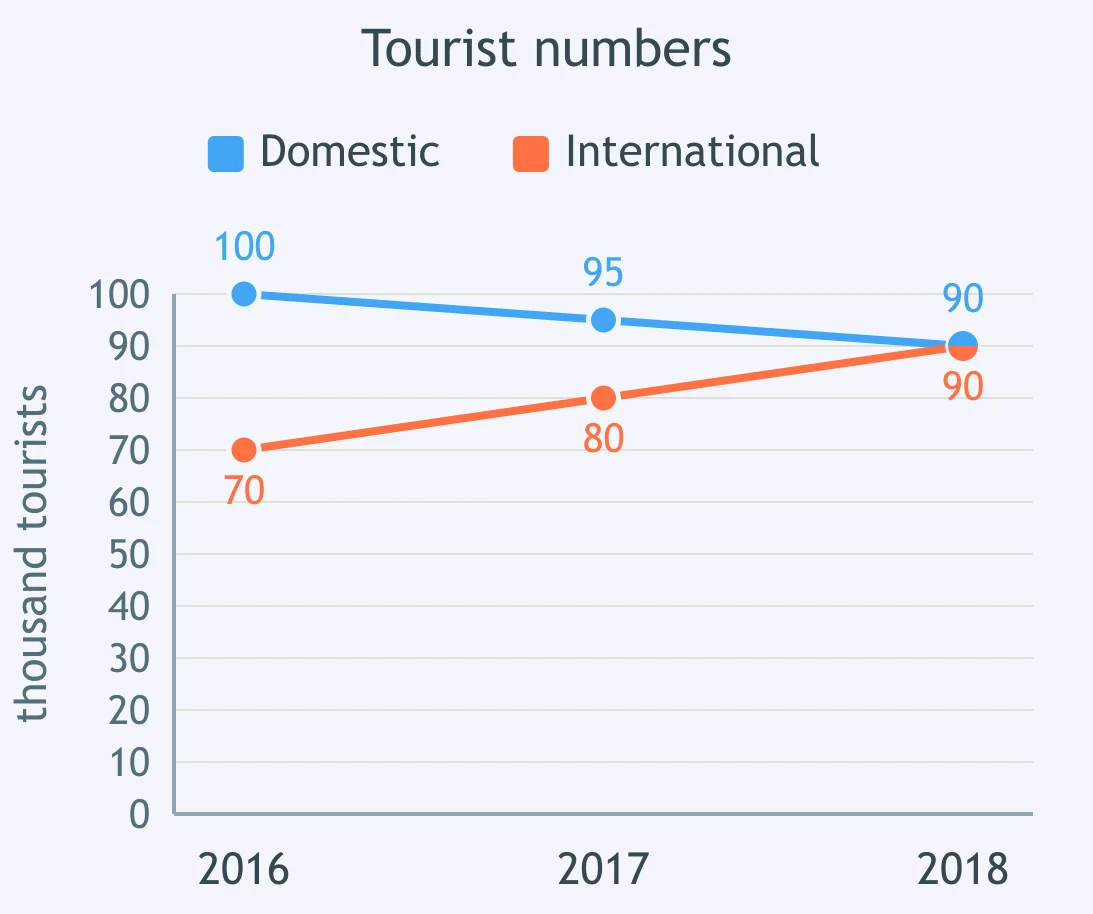
The graph shows domestic and international tourists. Which statement is true for 2018?
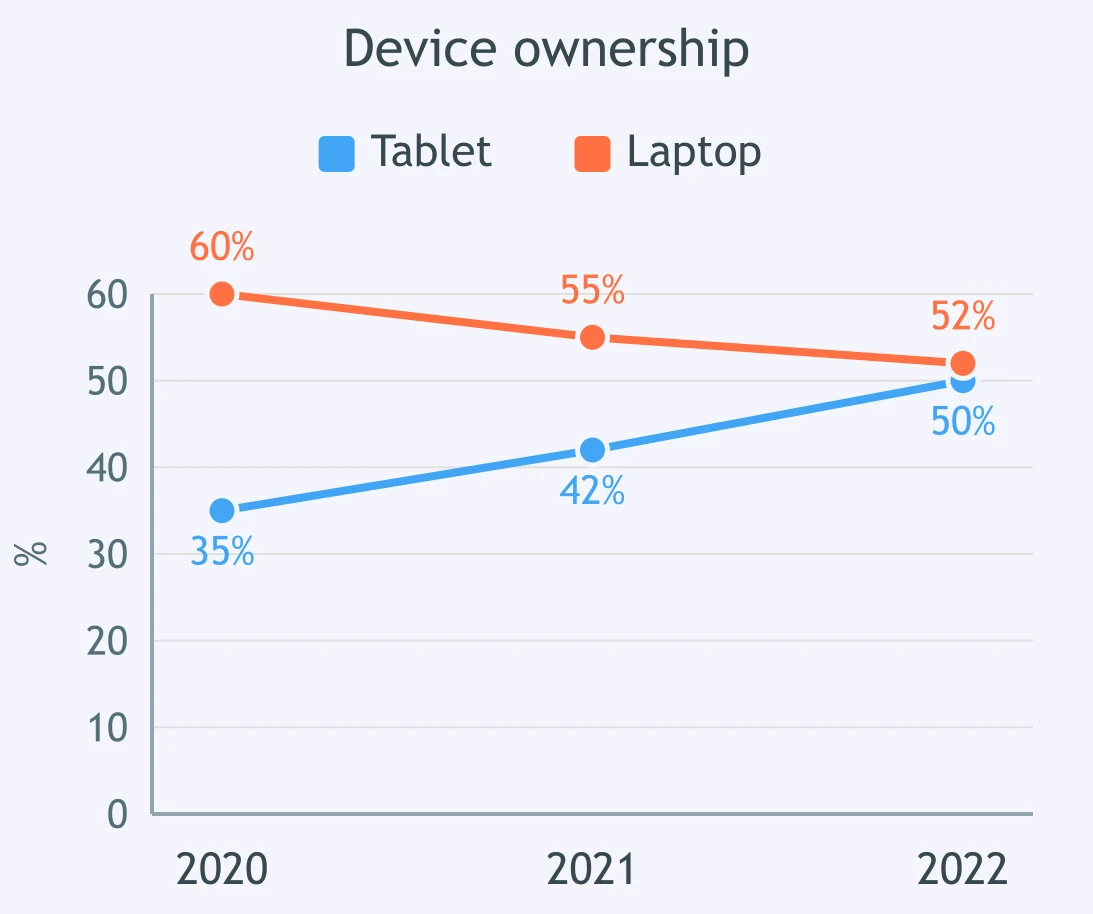
The graph shows tablet and laptop ownership. Which statement is true for 2022?
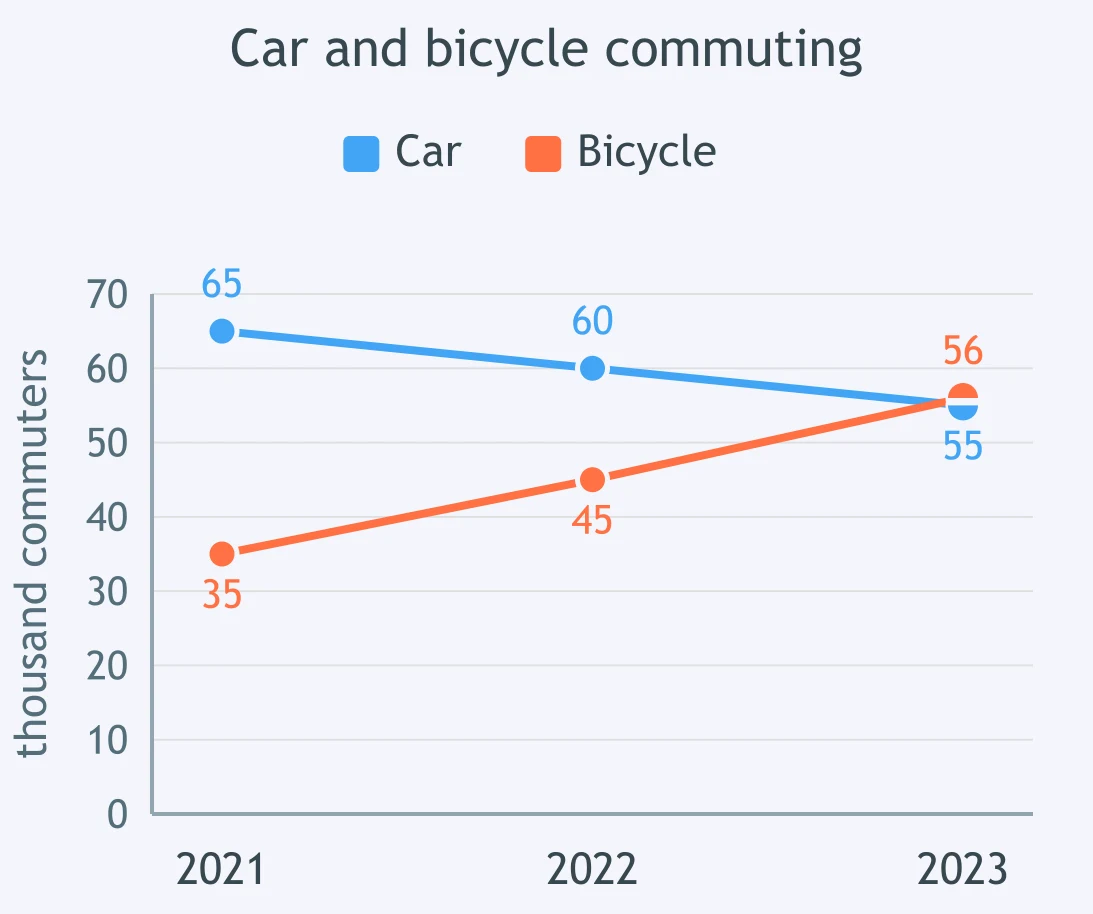
The graph shows car and bicycle commuting. Which statement is true for 2023?
Crack the passcode before the zombies get in.
Answer, then swat bugs for bonus points.
Race through questions at your own speed.
Same question on every screen. Fastest wins.

Pick a tile, answer, hit bonuses and steals.

Describing a Table: Highest, Lowest, Most, Least - IELTS 5.0 W T1
30 questions