Loading
by BlastRoom
Practise reading pie charts and reporting key proportions for IELTS Task 1.
#writing_task_1#ielts_5_0
30 questions
One question set, multiple game modes. Tap any game to see it in action. Not sure which to pick?
Answer to place stones and capture territory.
Outrun the snow together.
Earn blasts, then hunt the other team.
Answer to earn energy, then climb.

The class blasts through walls together.
Bid on mystery lots. Most money wins.
Sell tours. Nice, standard, or a total scam.

Answer, restock, and serve the rush.
More correct answers pulls the rope your way.
Answer, then shoot down the alien wave.
Answer, then tap to leap the frozen ridge.
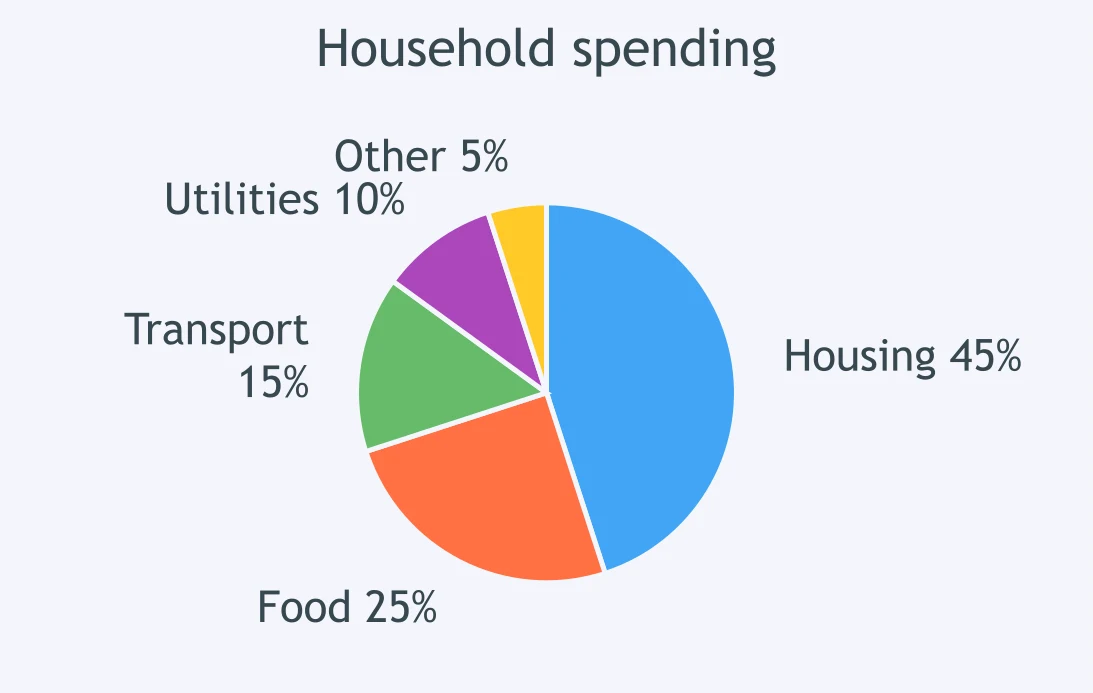
The pie chart shows household spending. Which phrase best describes the housing segment?
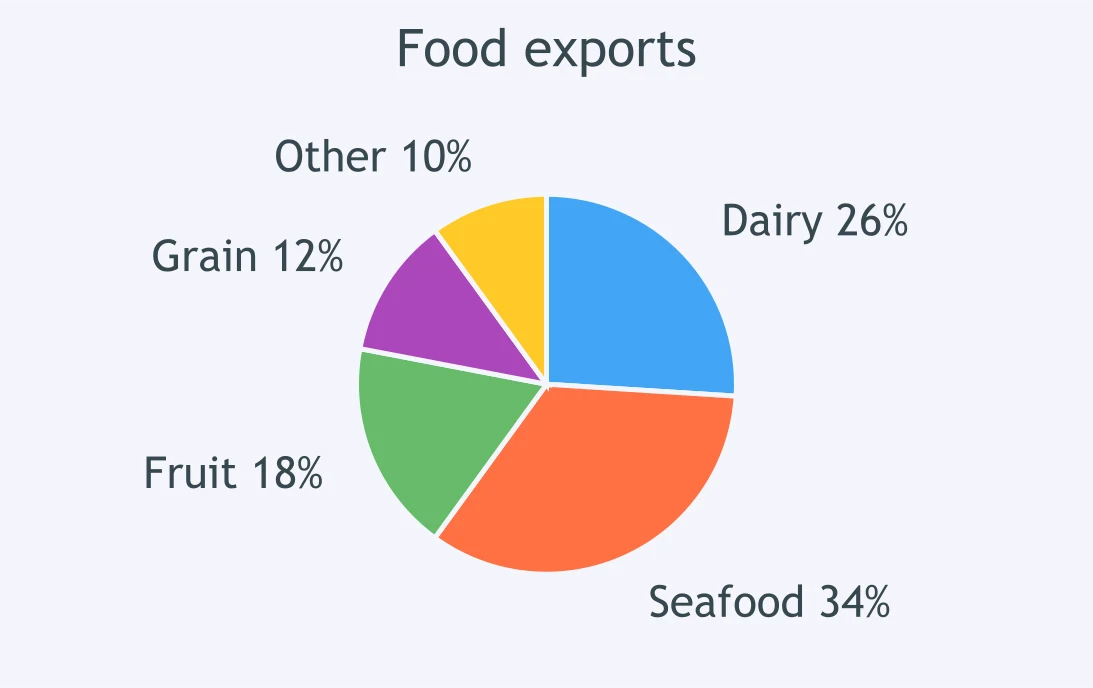
In the food exports chart, which phrase best describes the dairy segment?
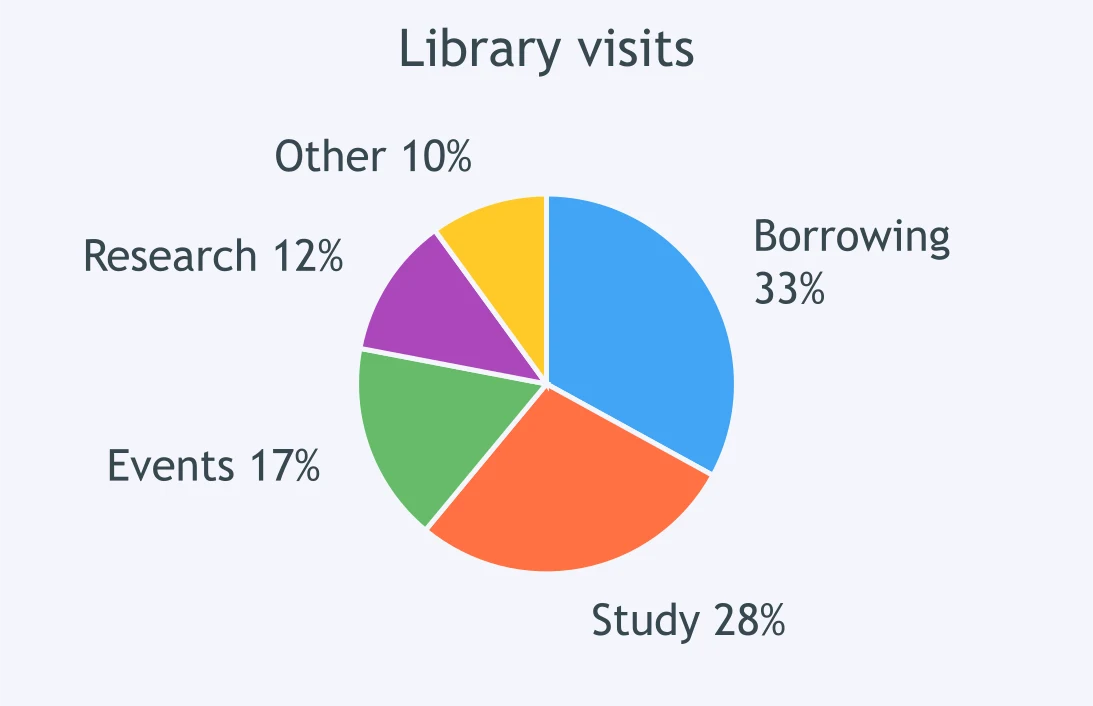
Look at the library visits chart. How large is the research segment?
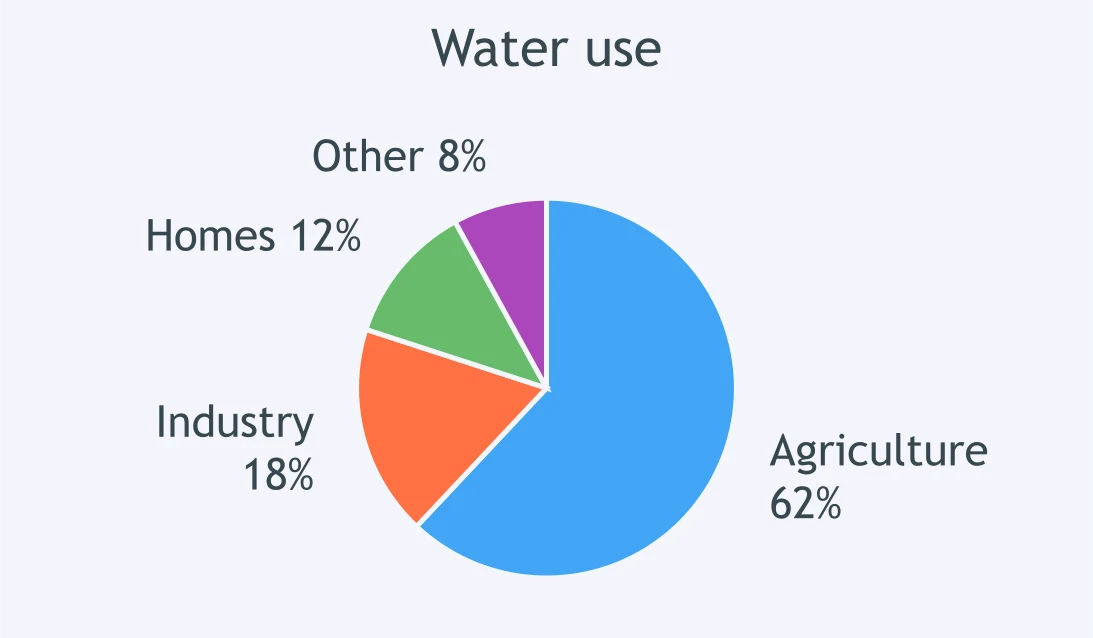
The pie chart shows water use. Which phrase best describes agriculture?
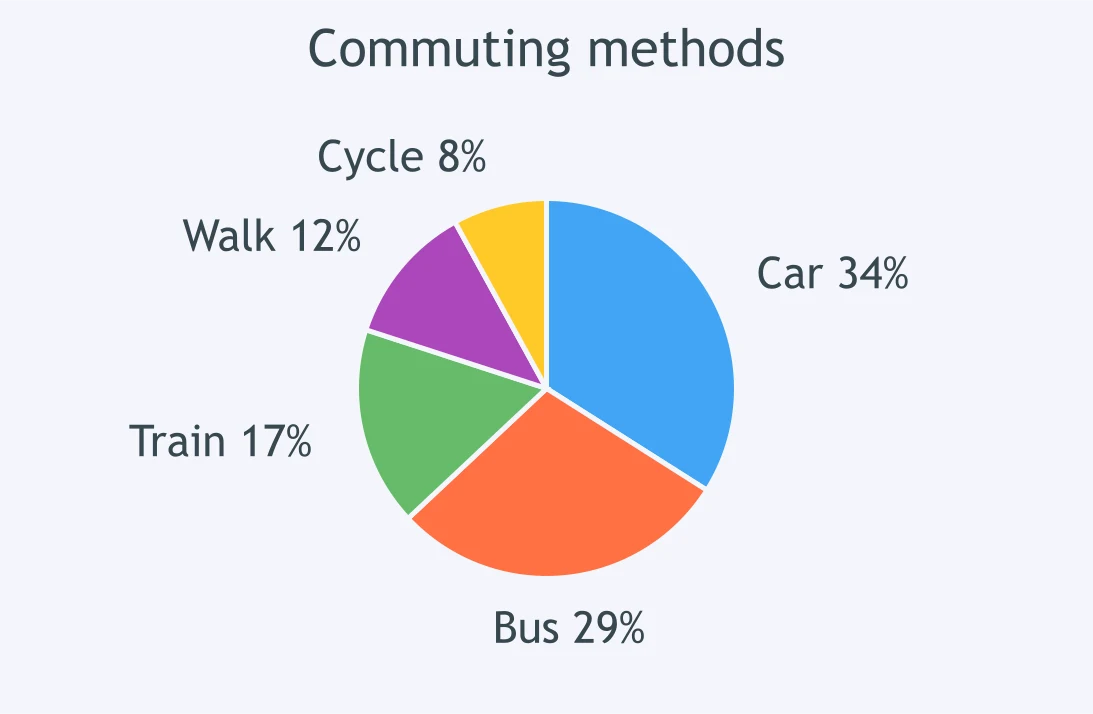
In the commuting chart, what share is taken by car travel?
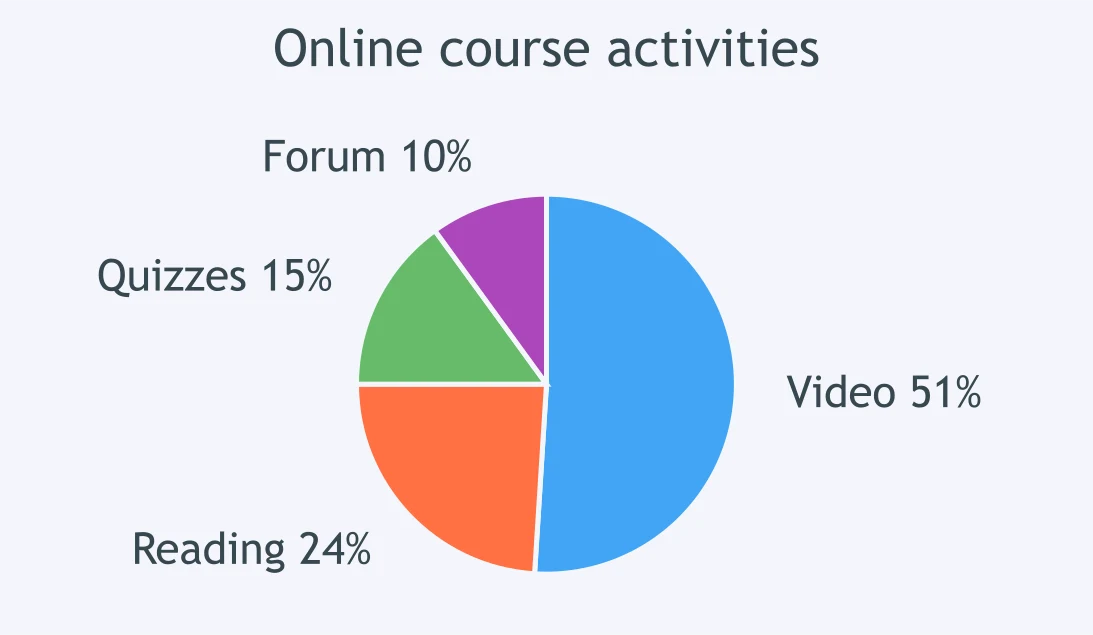
The pie chart shows online course activities. Which phrase fits video lessons?
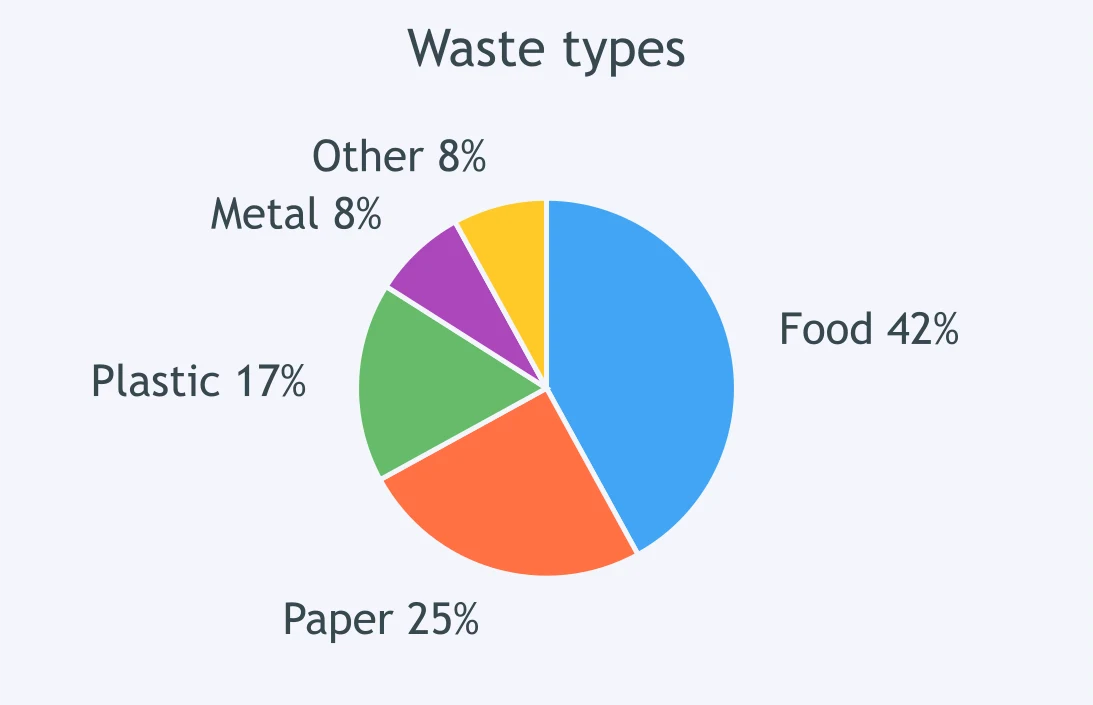
In the waste types chart, which phrase best describes metal?
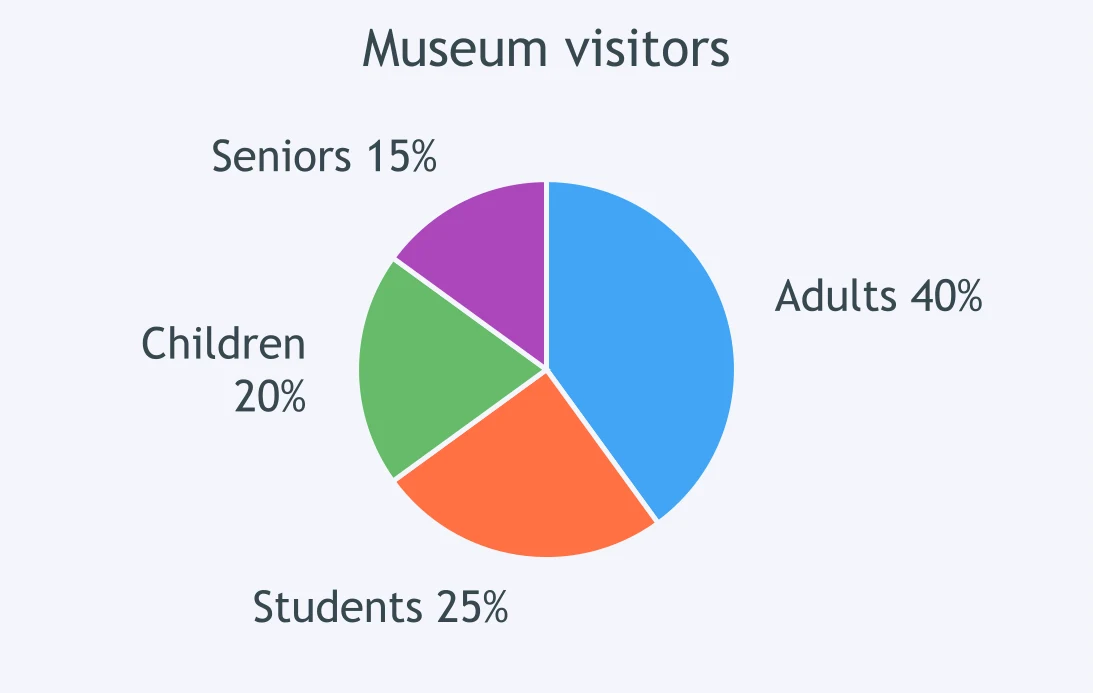
The pie chart shows museum visitors by group. Which phrase best describes adults?
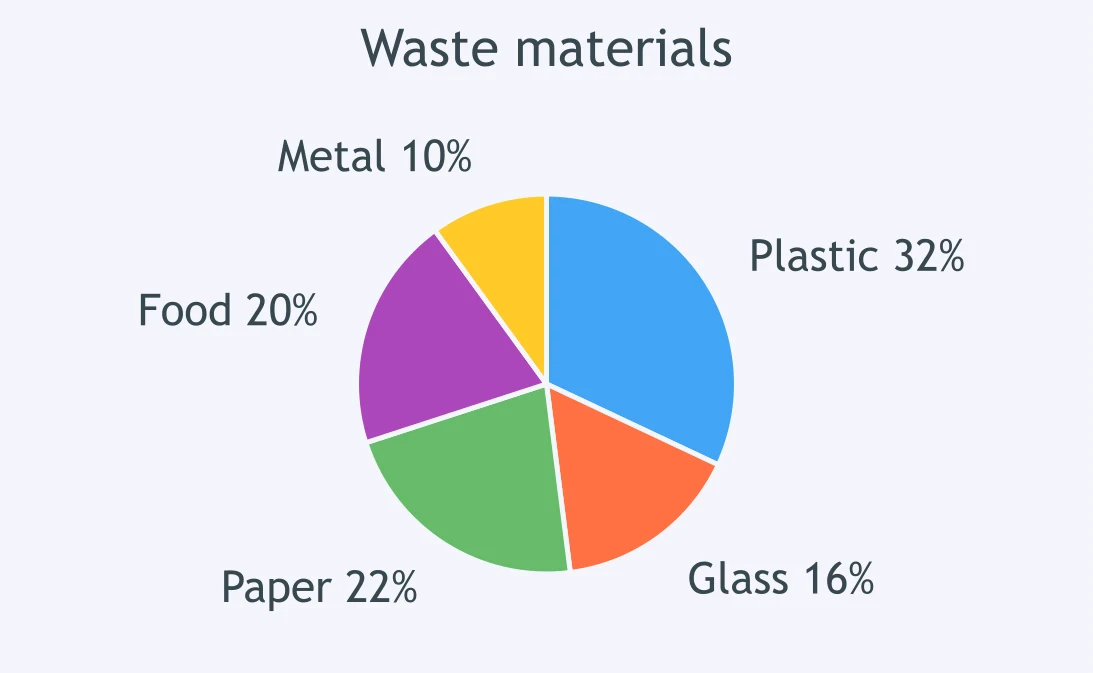
In the waste chart, how does the plastic segment compare with the glass segment?
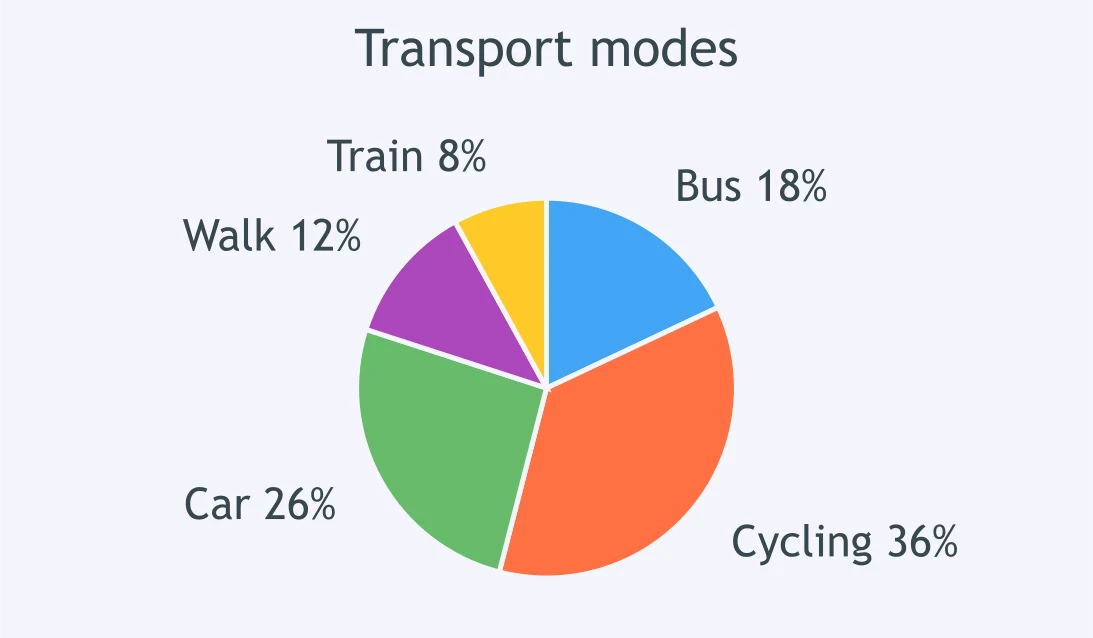
In the transport chart, how does the bus segment compare with the cycling segment?
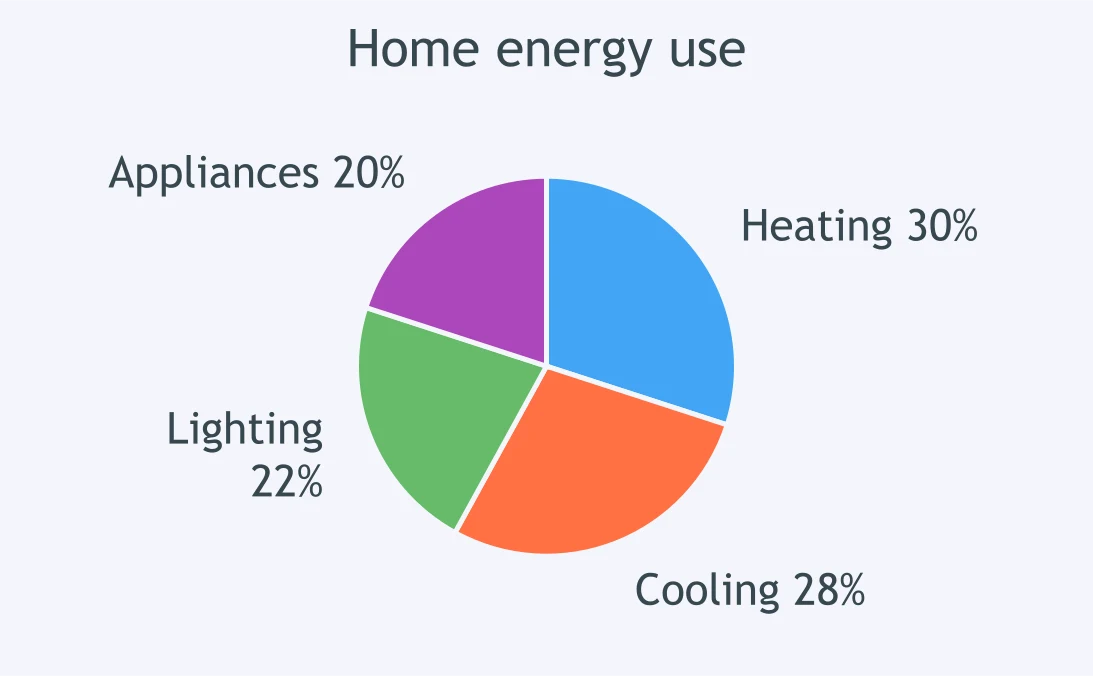
The energy chart compares heating and cooling. What is the best description?
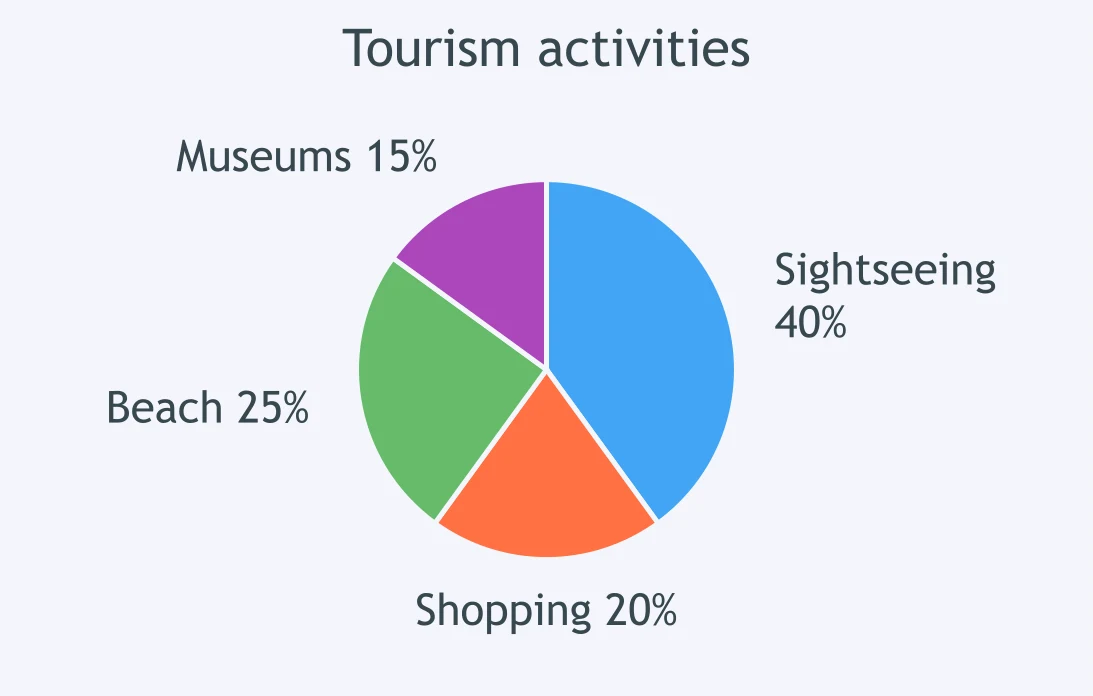
In the tourism activities chart, how does sightseeing compare with shopping?
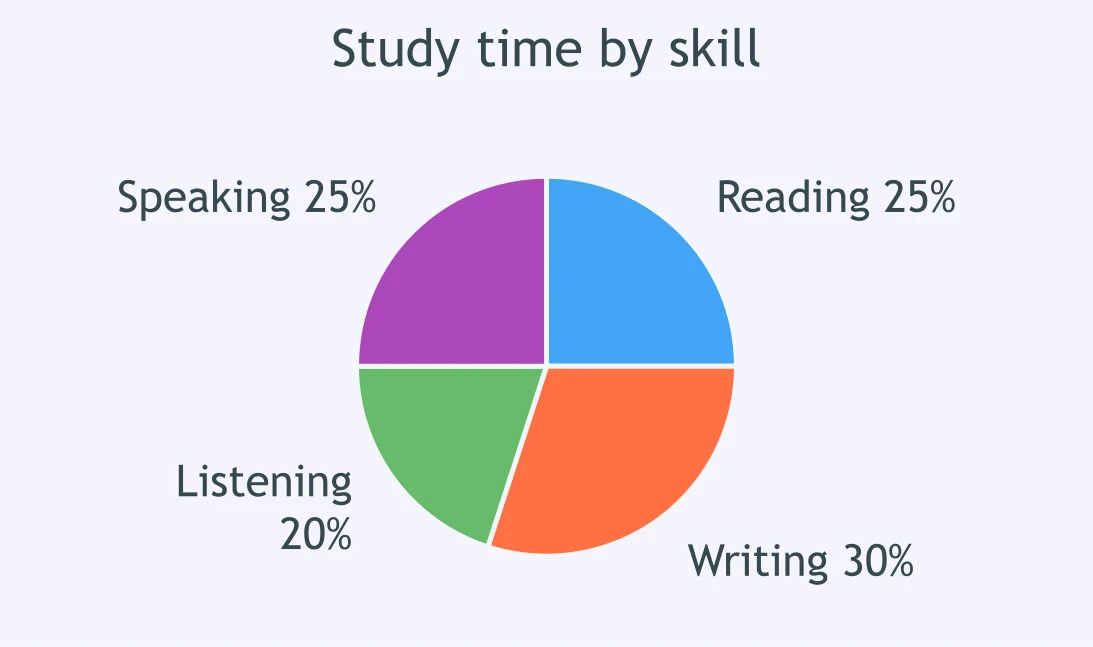
The study-time chart shows reading and writing. Which comparison is accurate?
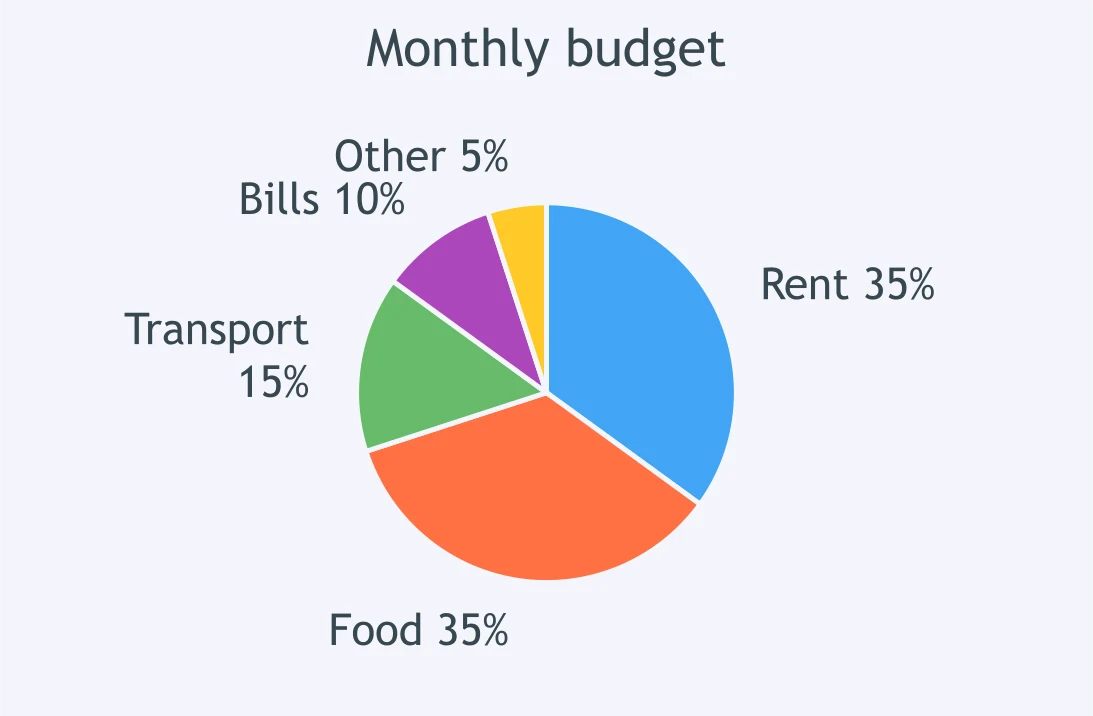
In the monthly budget chart, how do food and rent compare?
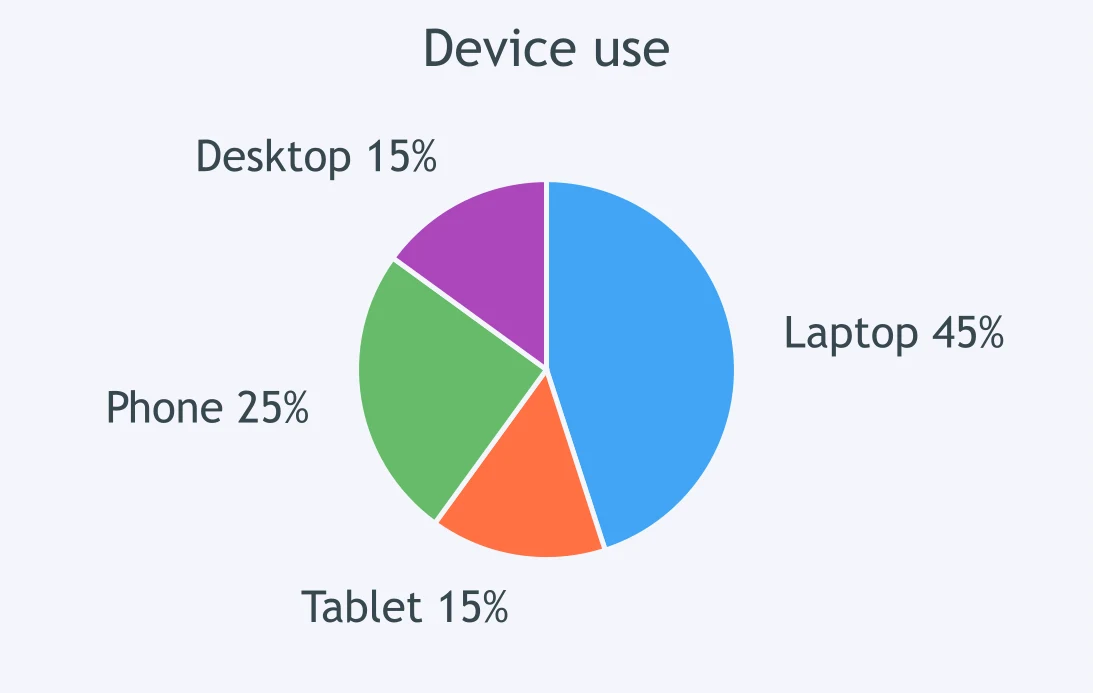
The device-use chart compares laptops and tablets. What is the best description?
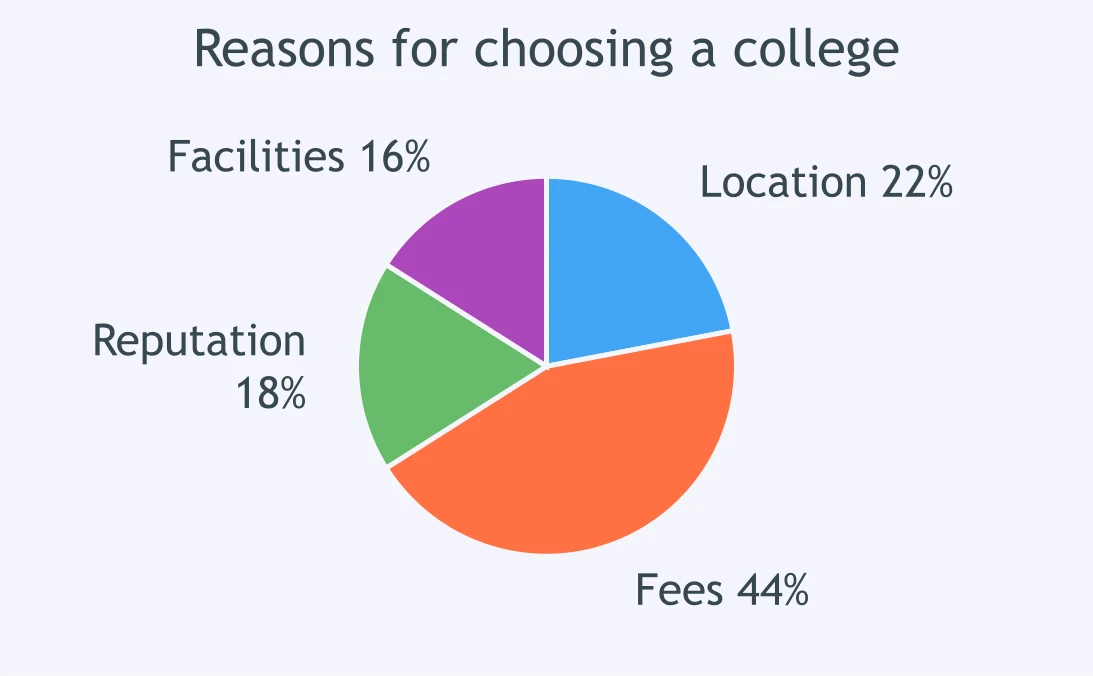
In the college-choice chart, how does location compare with fees?
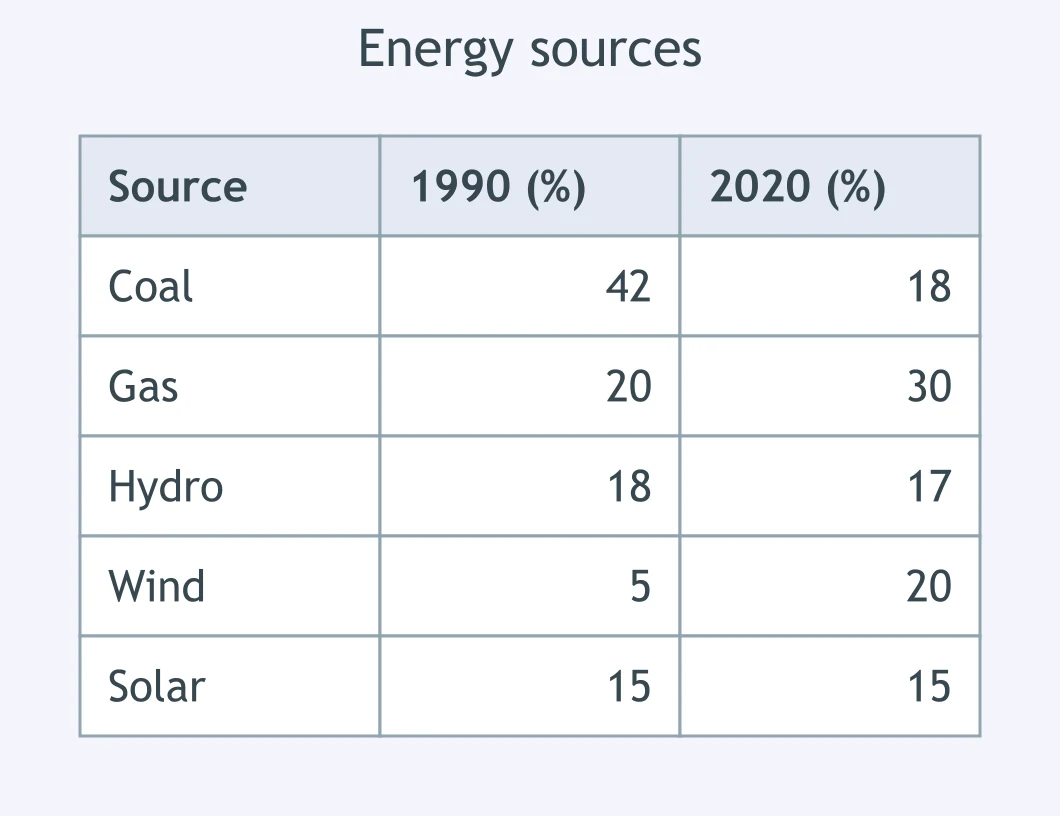
The table shows a country's energy sources in 1990 and 2020. What happened to the share taken by coal?
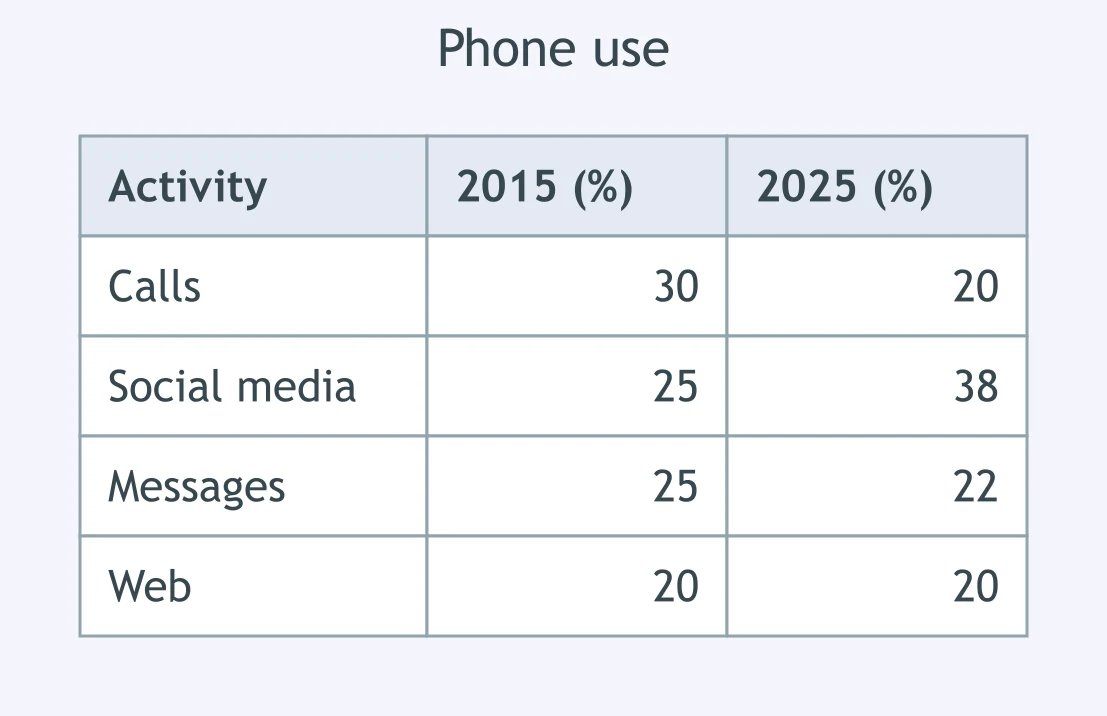
The table shows what people used their phones for in 2015 and 2025. What happened to the share for social media?
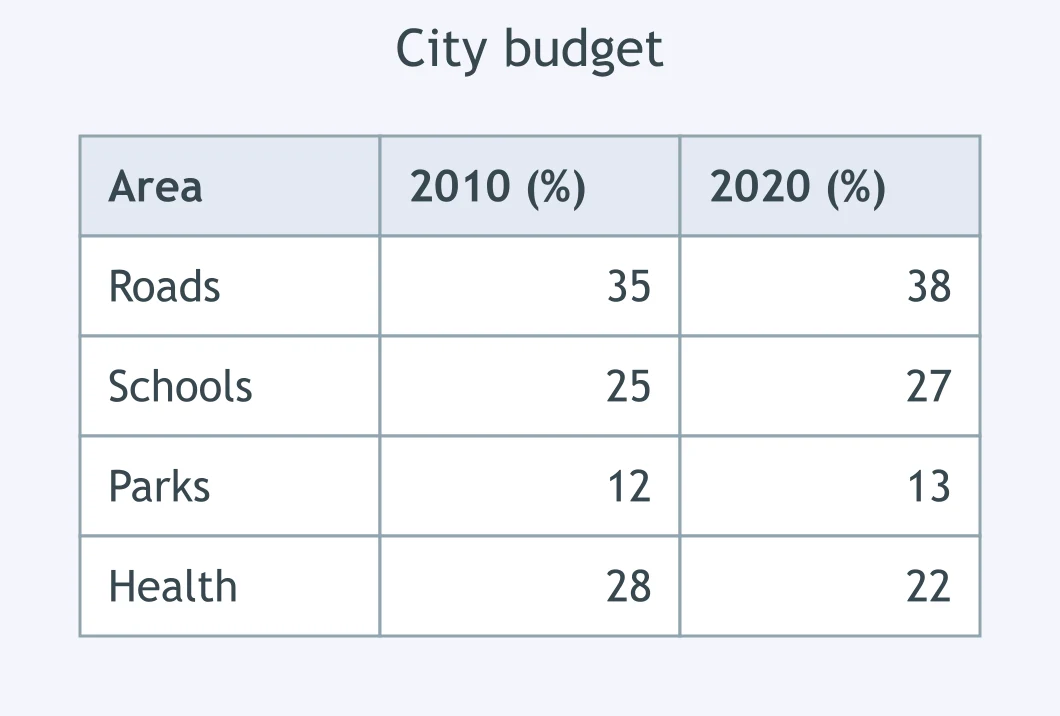
The table shows how a city spent its budget in 2010 and 2020. What happened to the share spent on parks?
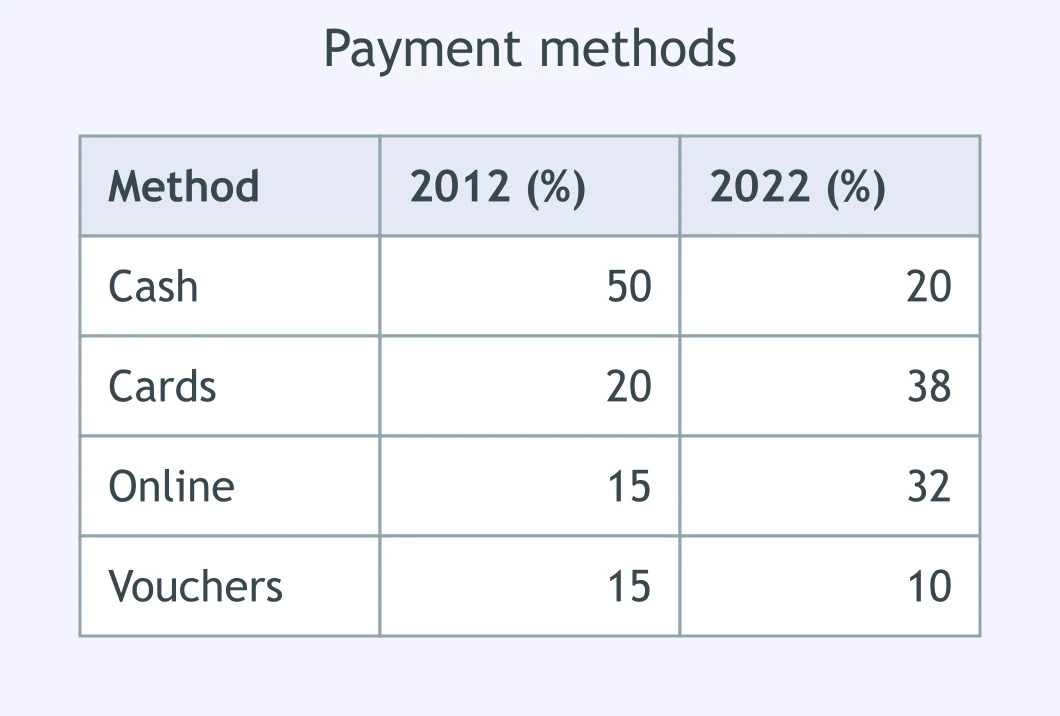
The table shows how shoppers paid in 2012 and 2022. What happened to the share paid in cash?
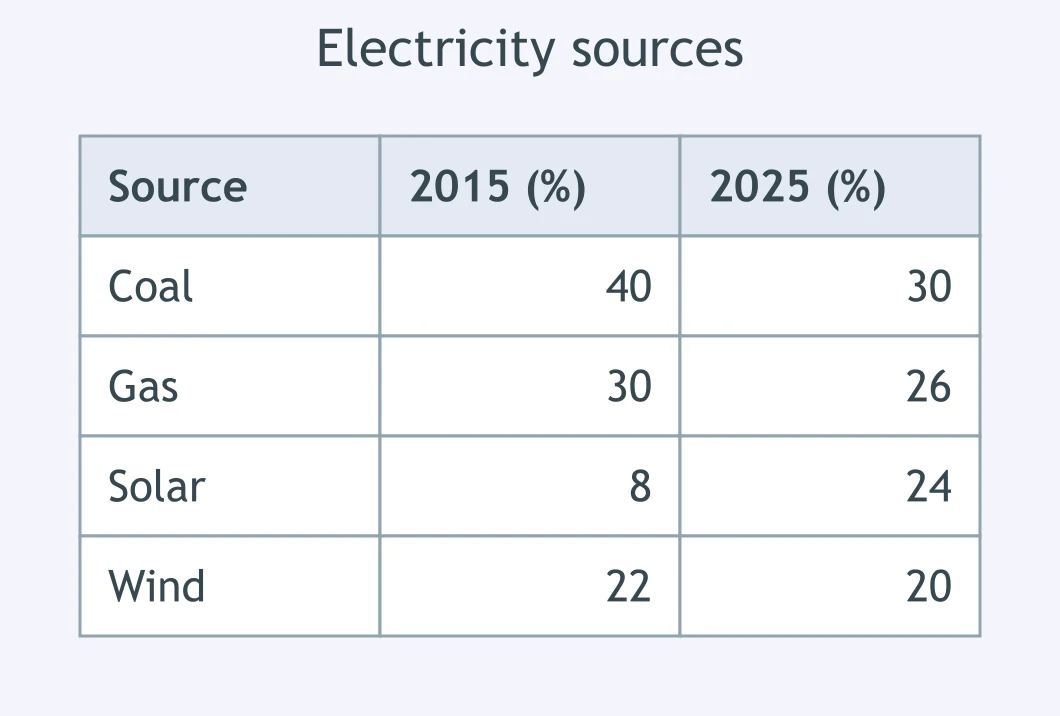
The table shows where electricity came from in 2015 and 2025. What happened to the share from solar?
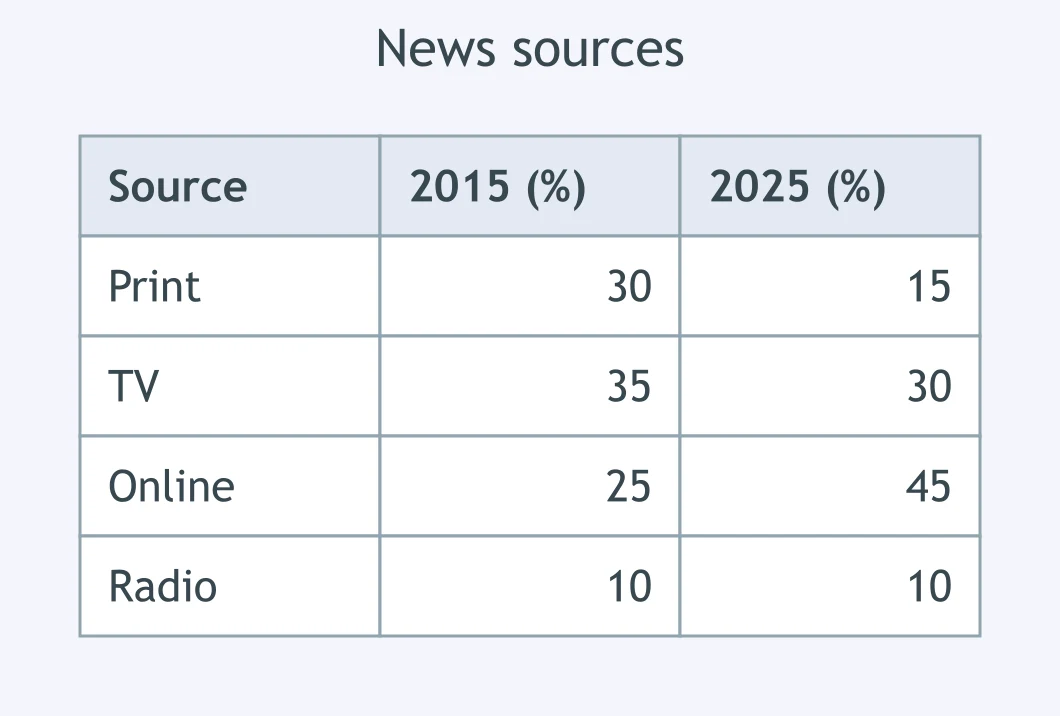
The table shows where people got their news in 2015 and 2025. What happened to the share reading print?
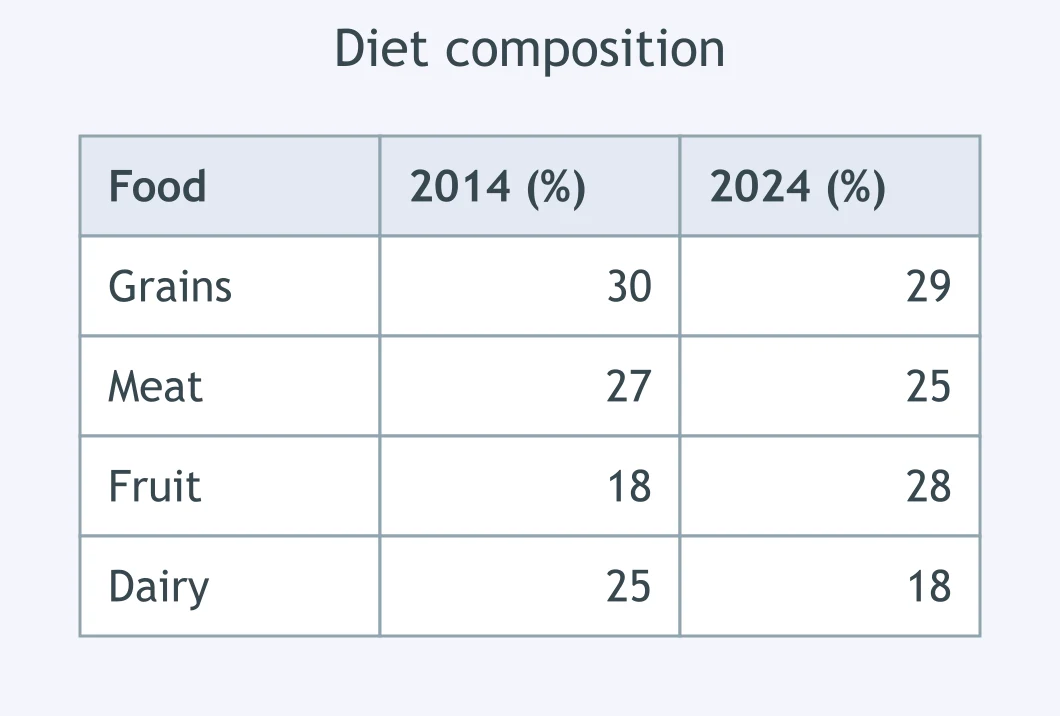
The table shows one group's diet in 2014 and 2024. What happened to the share of fruit?
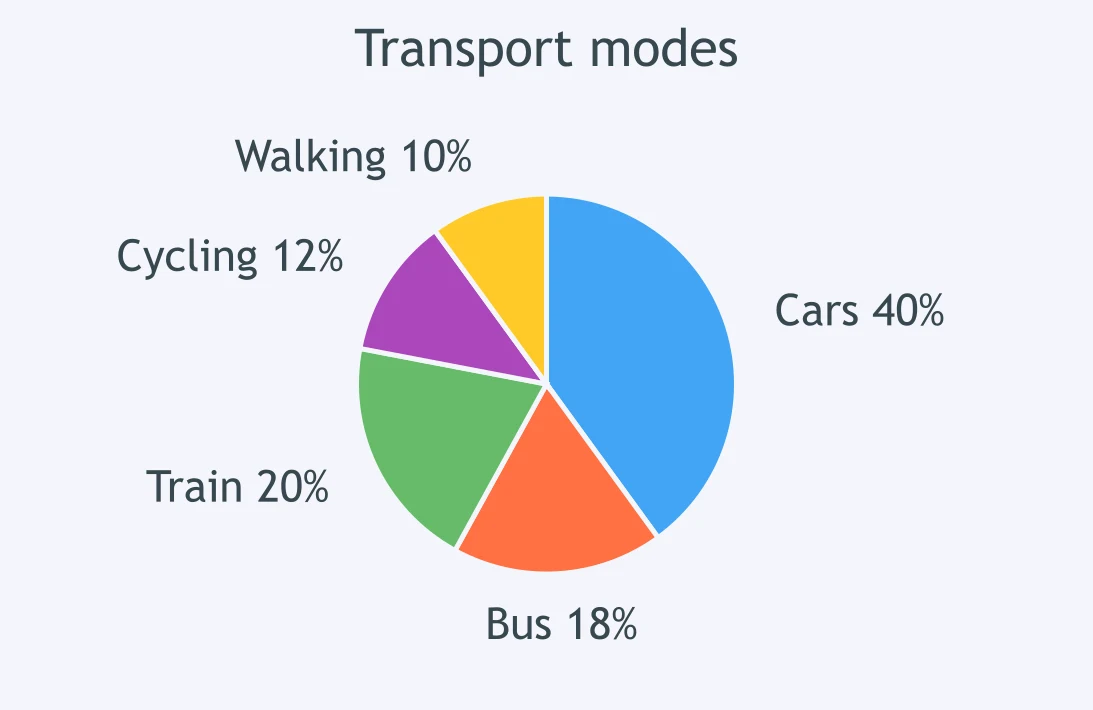
Which summarising sentence does the transport chart support?
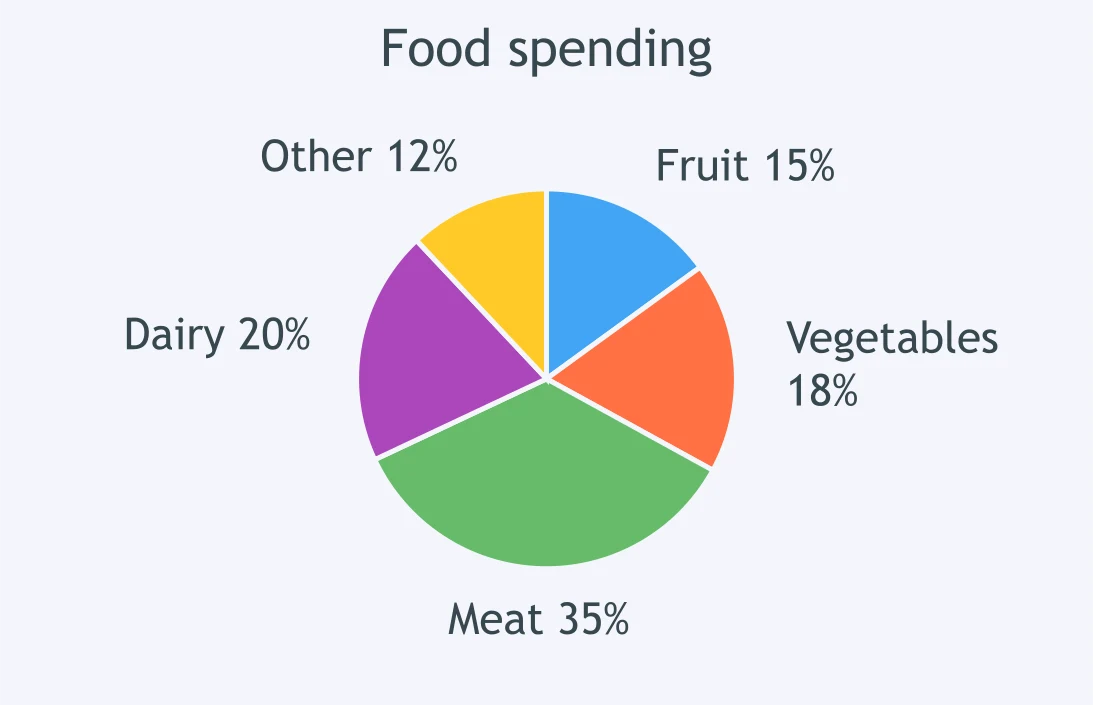
Which overview sentence best matches the food-spending chart?
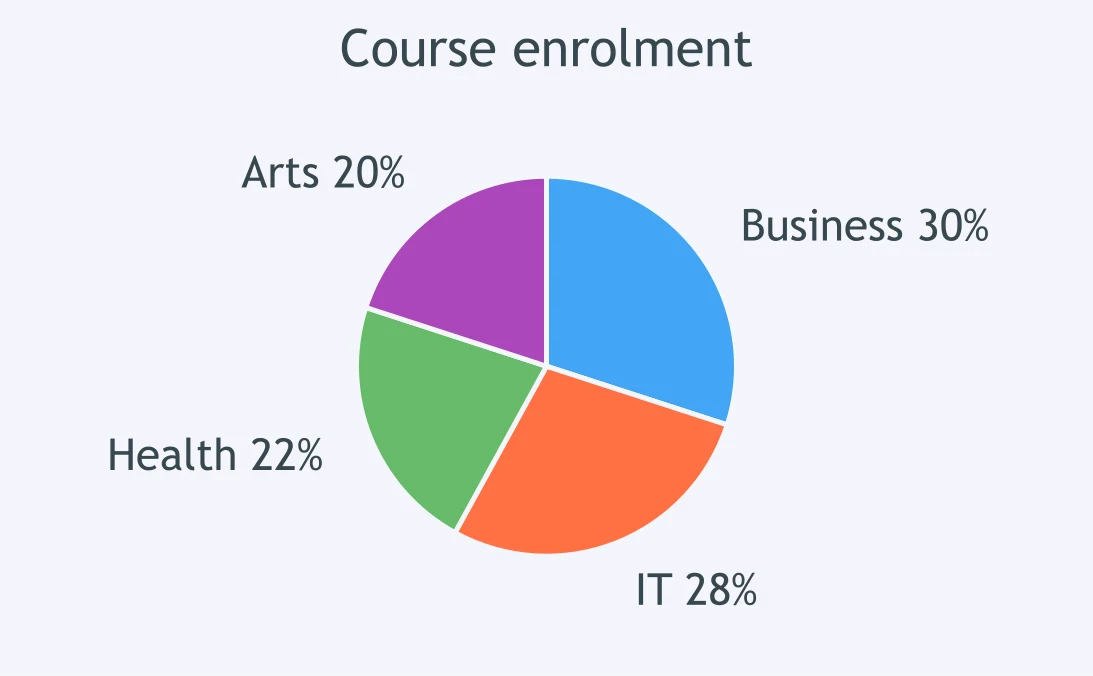
Which sentence is supported by the course enrolment chart?
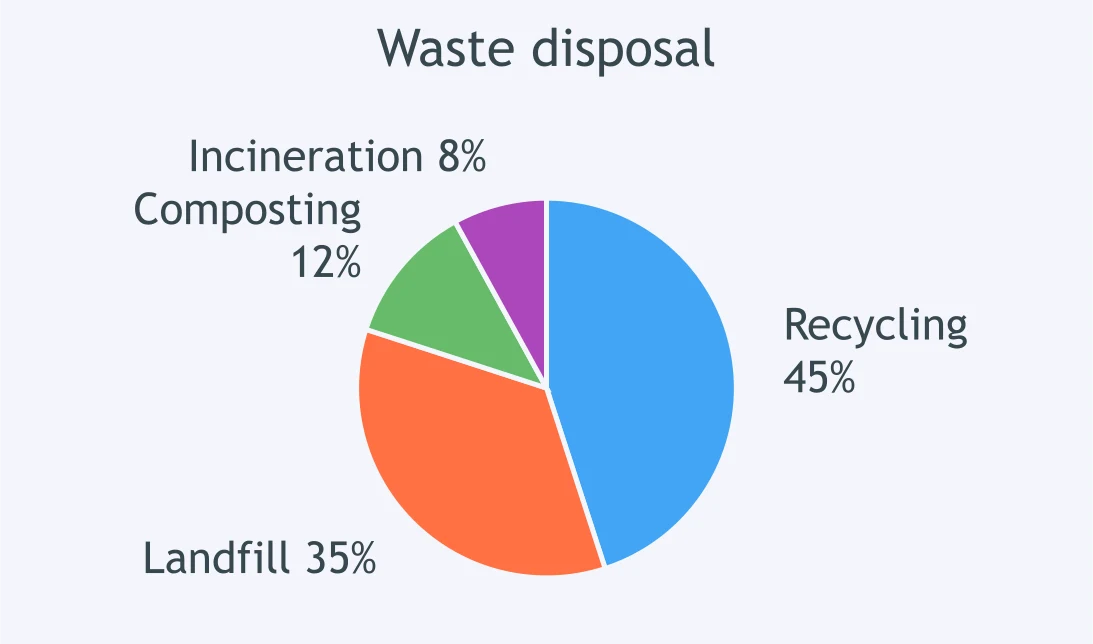
Which key feature should be reported from the waste-disposal chart?
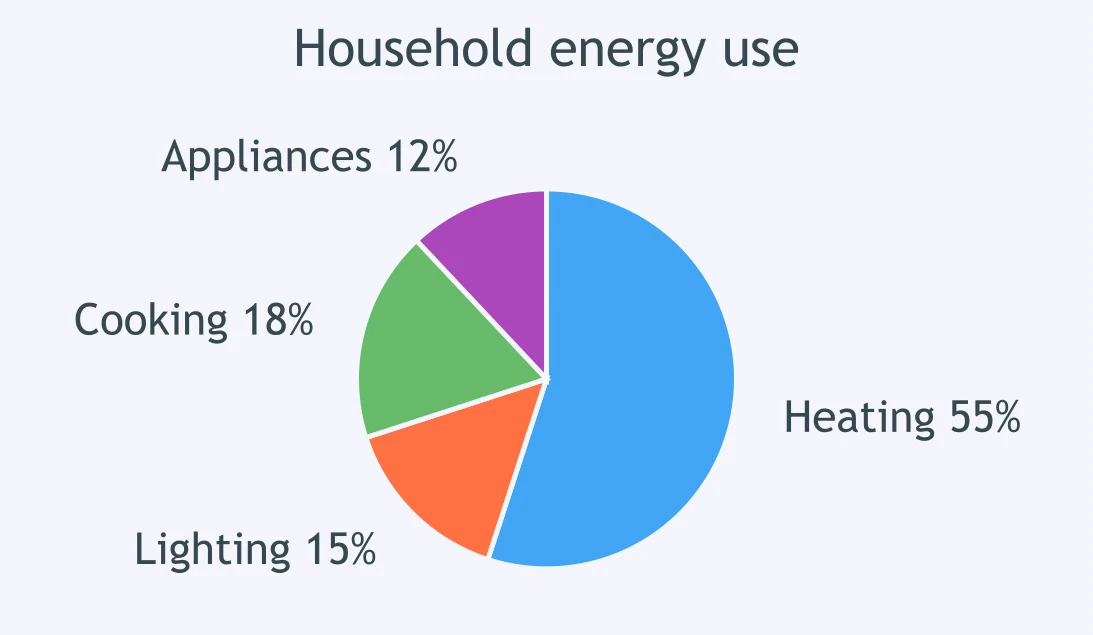
Which summary fits the household energy chart?
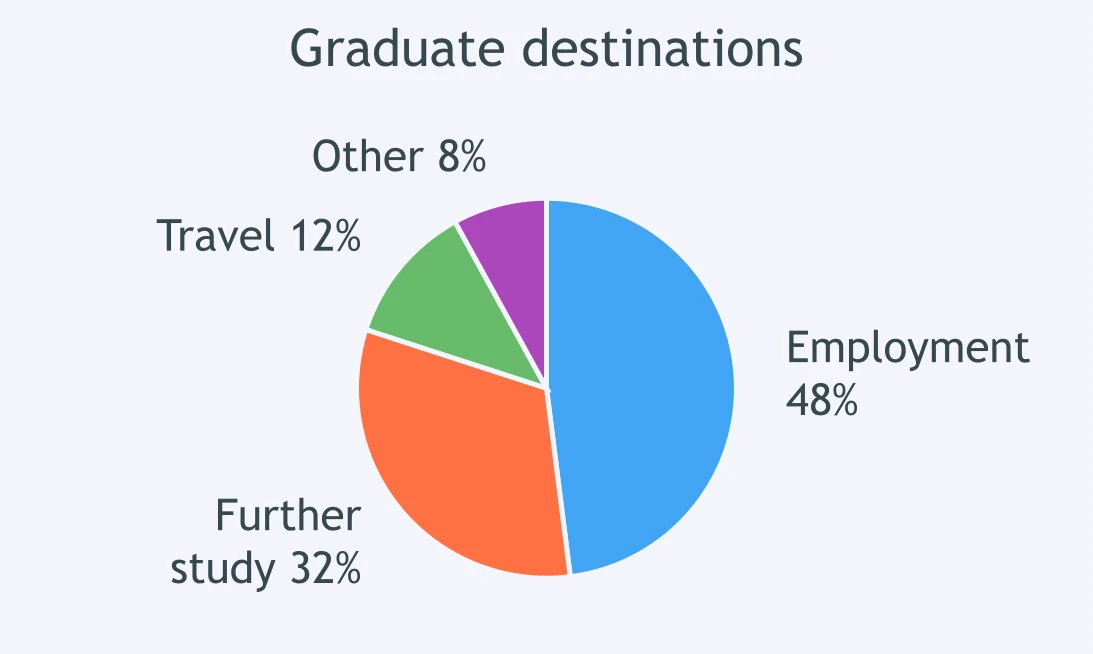
Which sentence does the graduate-destination chart support?
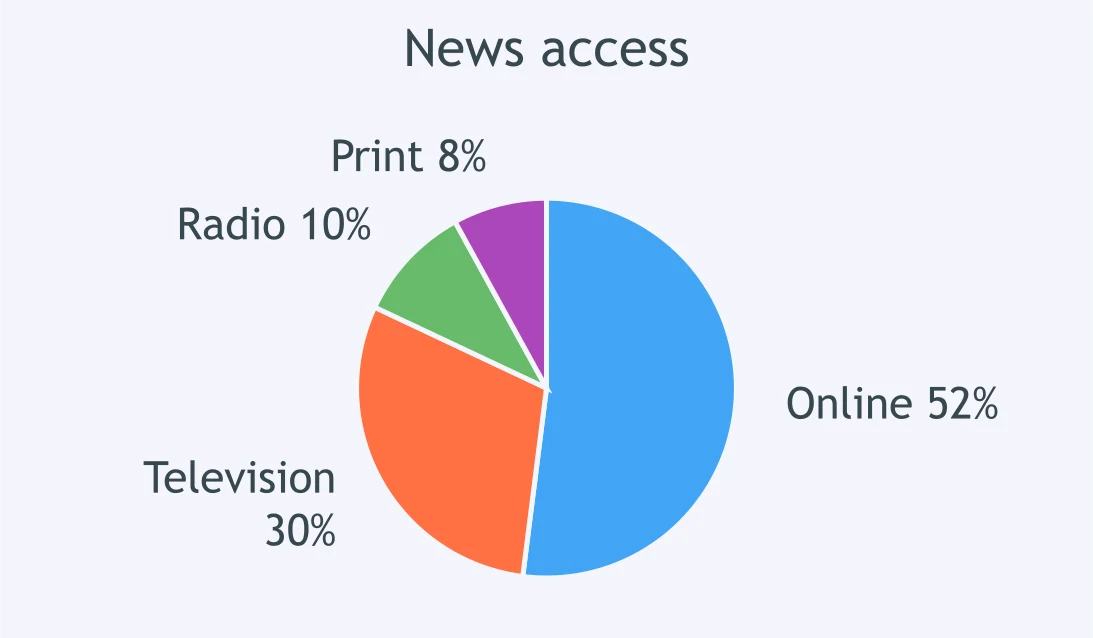
Which overview sentence is best for the news-access chart?
Crack the passcode before the zombies get in.
Answer, then swat bugs for bonus points.
Race through questions at your own speed.
Same question on every screen. Fastest wins.

Pick a tile, answer, hit bonuses and steals.

Describing Percentages - IELTS 5.0 W T1
40 questions