Loading
by BlastRoom
IELTS Academic Writing Task 1. twice as many, far higher, slightly lower.
#writing_task_1#ielts_5_0
40 questions
One question set, multiple game modes. Tap any game to see it in action. Not sure which to pick?
Answer to place stones and capture territory.
Outrun the snow together.
Earn blasts, then hunt the other team.
Answer to earn energy, then climb.

The class blasts through walls together.
Bid on mystery lots. Most money wins.
Sell tours. Nice, standard, or a total scam.

Answer, restock, and serve the rush.
More correct answers pulls the rope your way.
Answer, then shoot down the alien wave.
Answer, then tap to leap the frozen ridge.
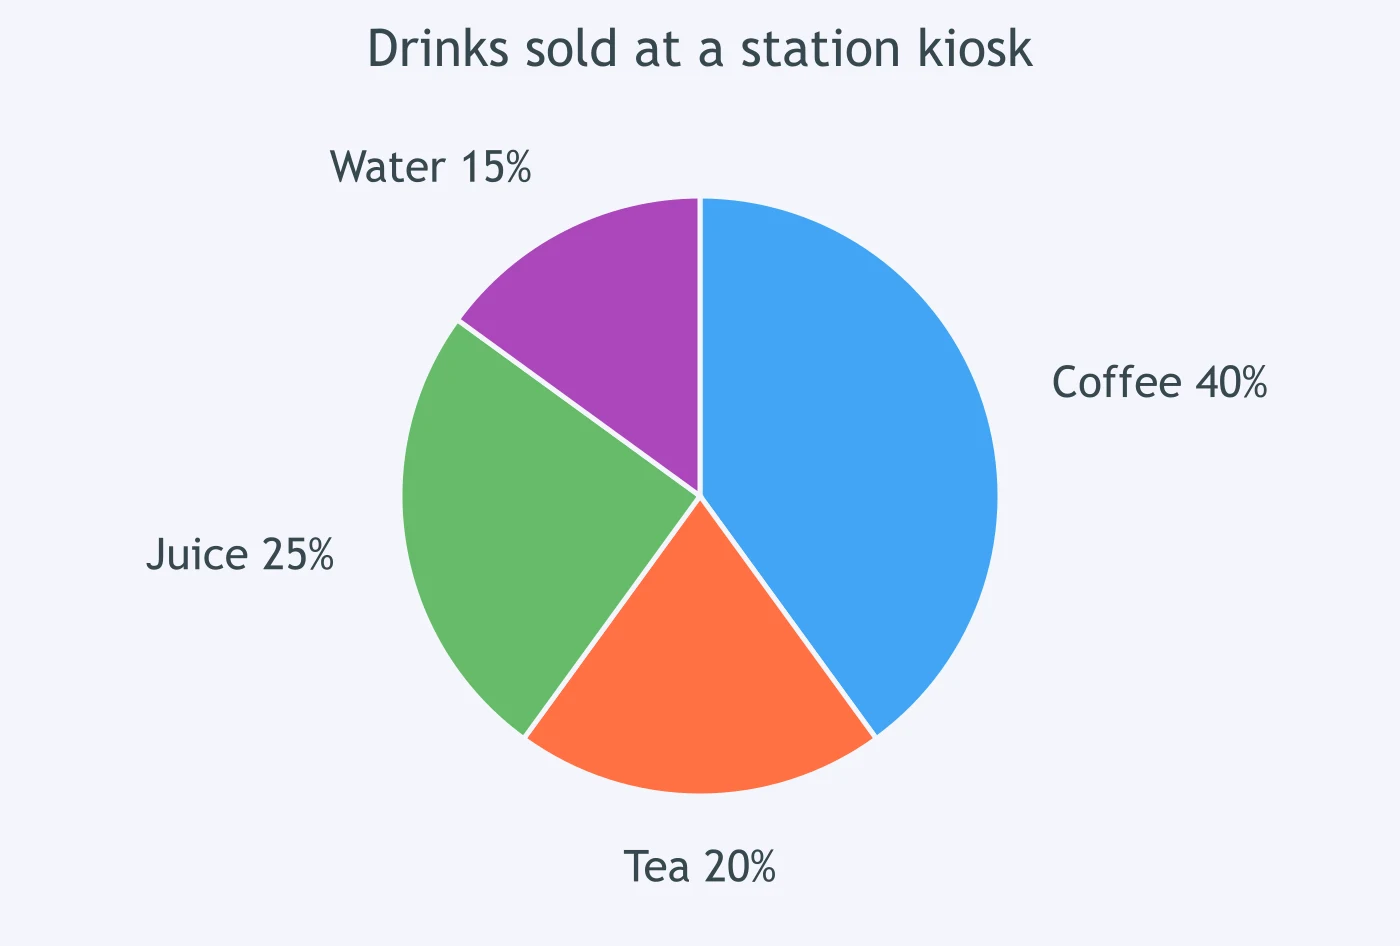
The pie chart shows drinks sold at a station kiosk. Which sentence compares coffee with tea correctly?
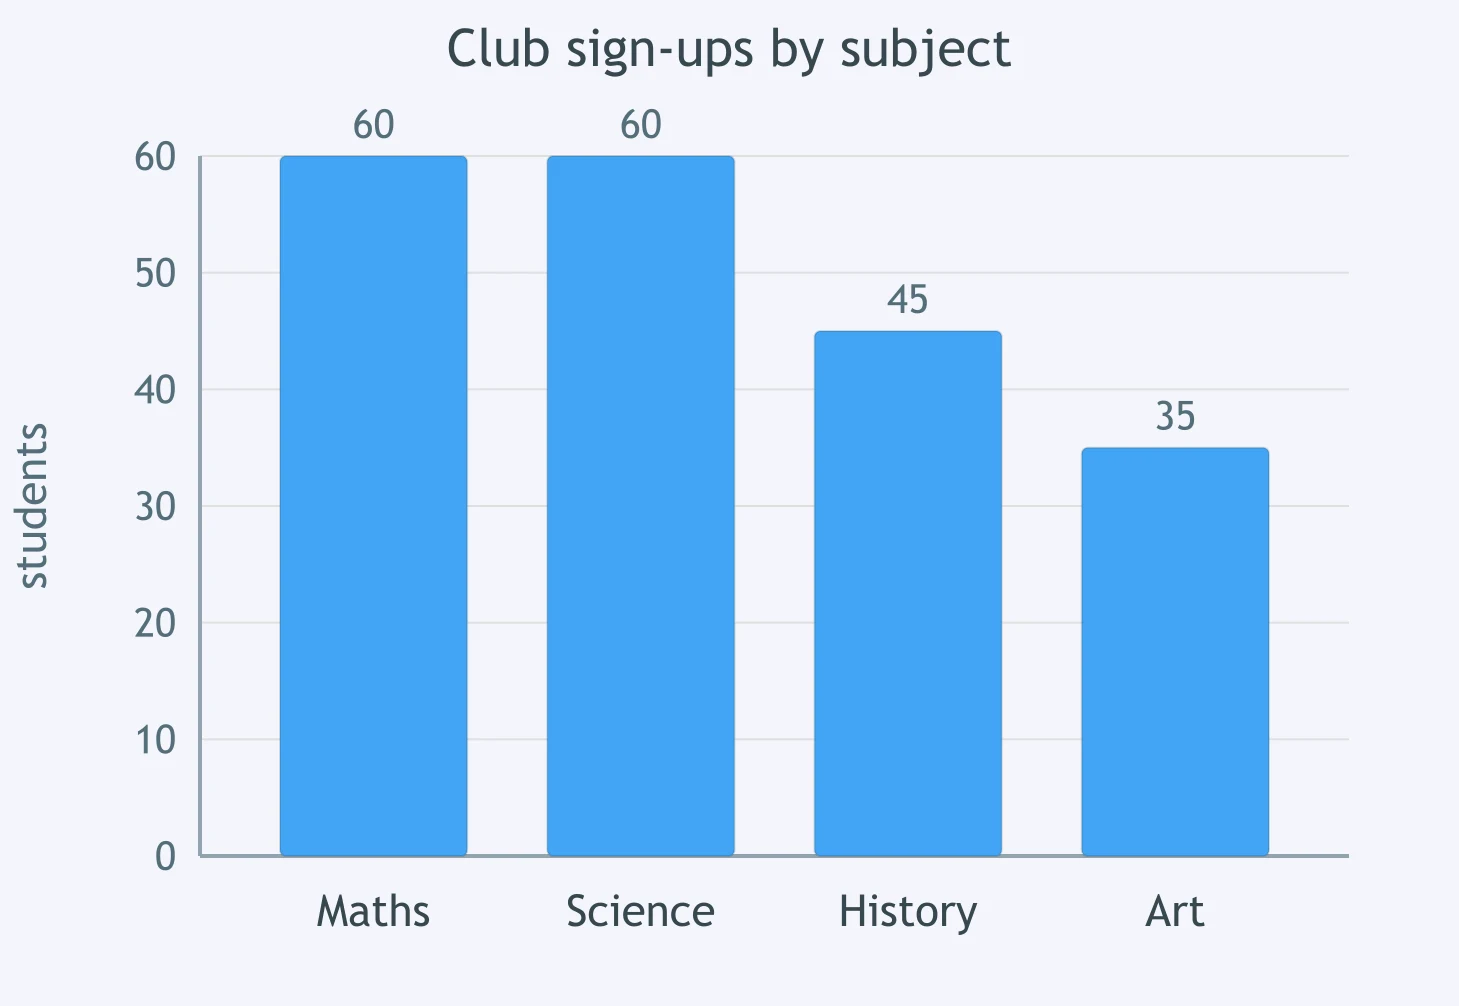
The bar chart shows club sign-ups by subject. How did maths compare with science?
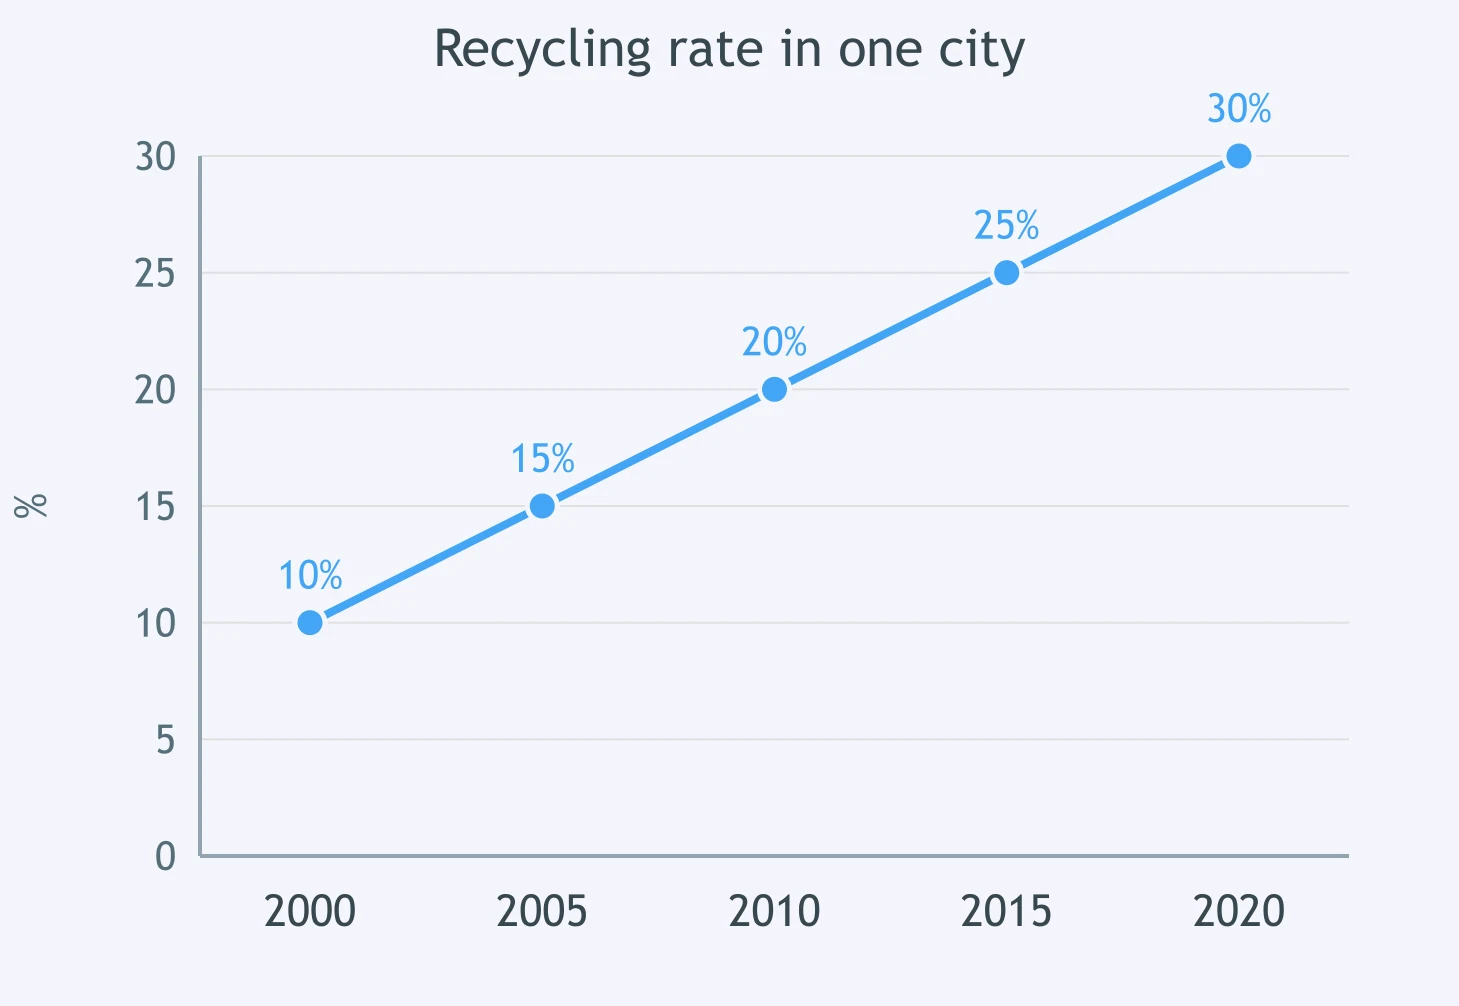
The line graph shows the recycling rate in one city. How did 2020 compare with 2000?
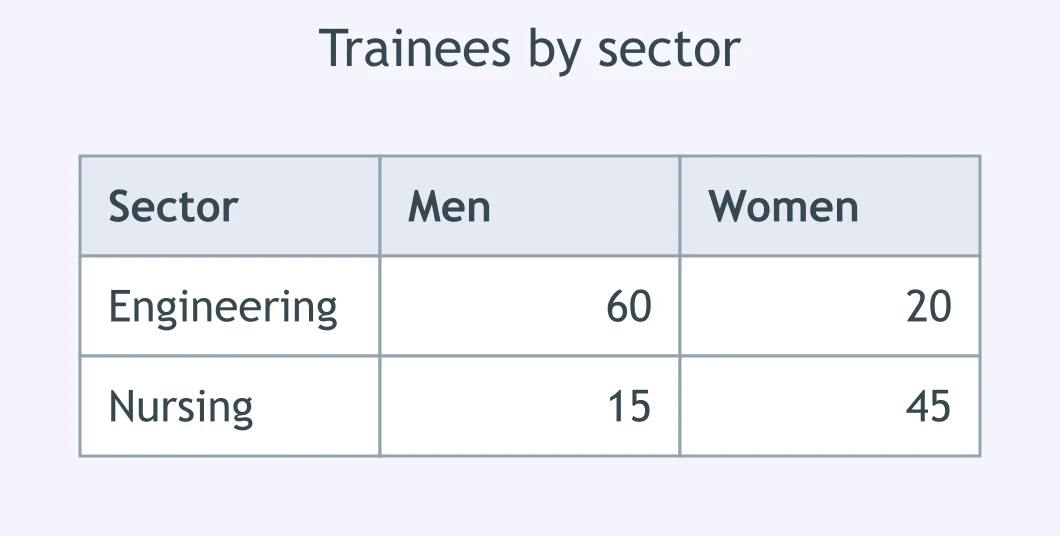
In the table of trainees, how did women in engineering compare with men in engineering?
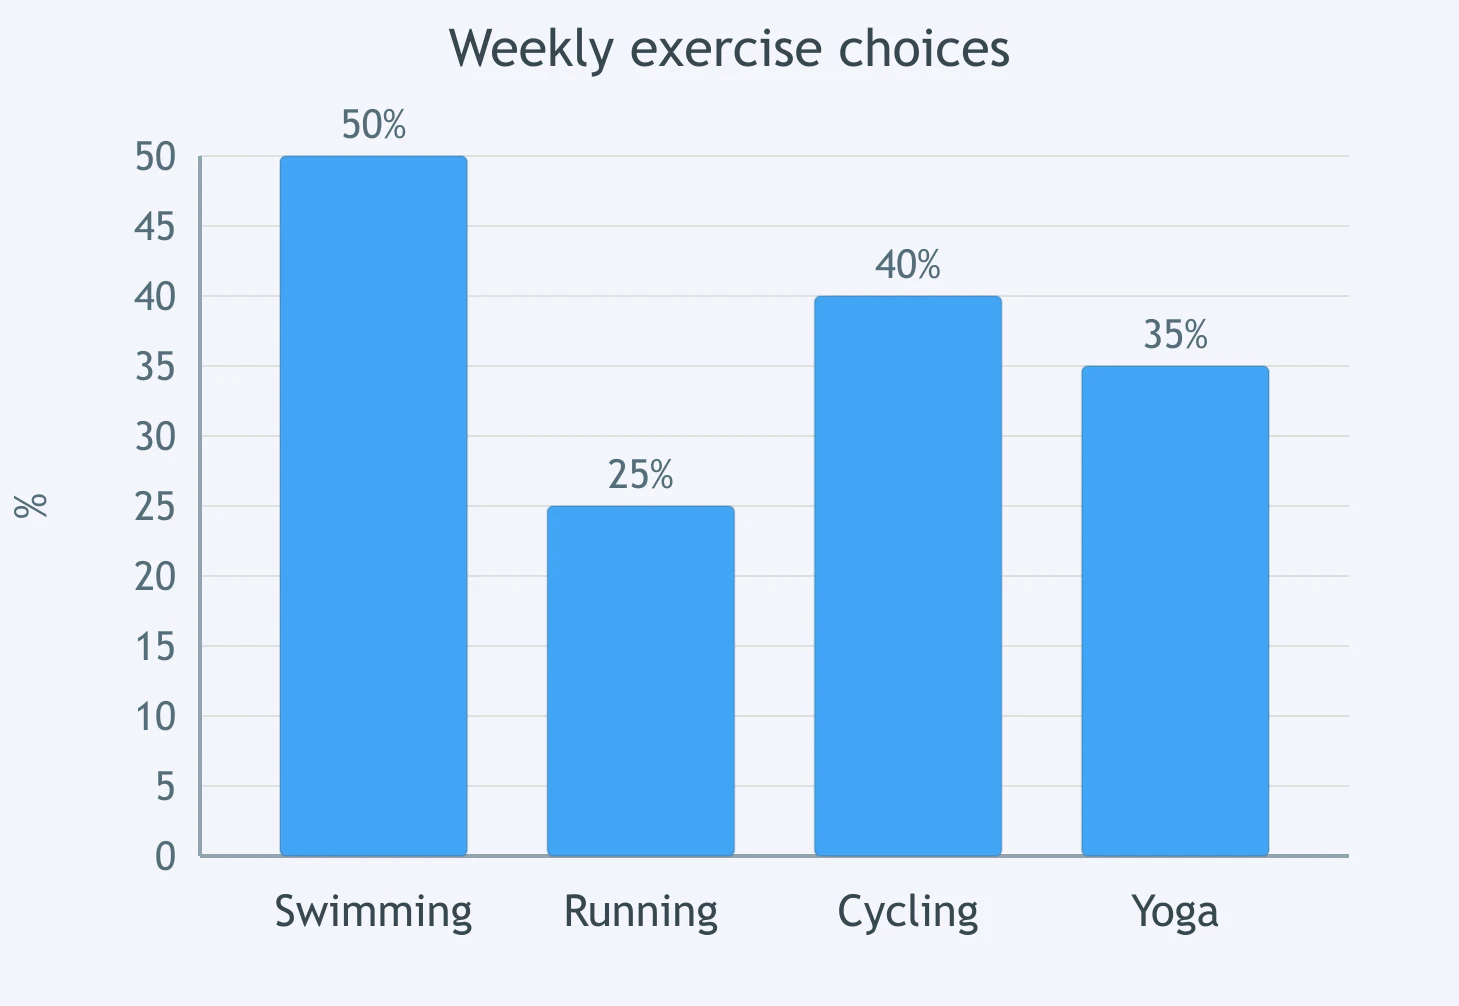
The chart shows weekly exercise choices. Which comparison of running with swimming is accurate?
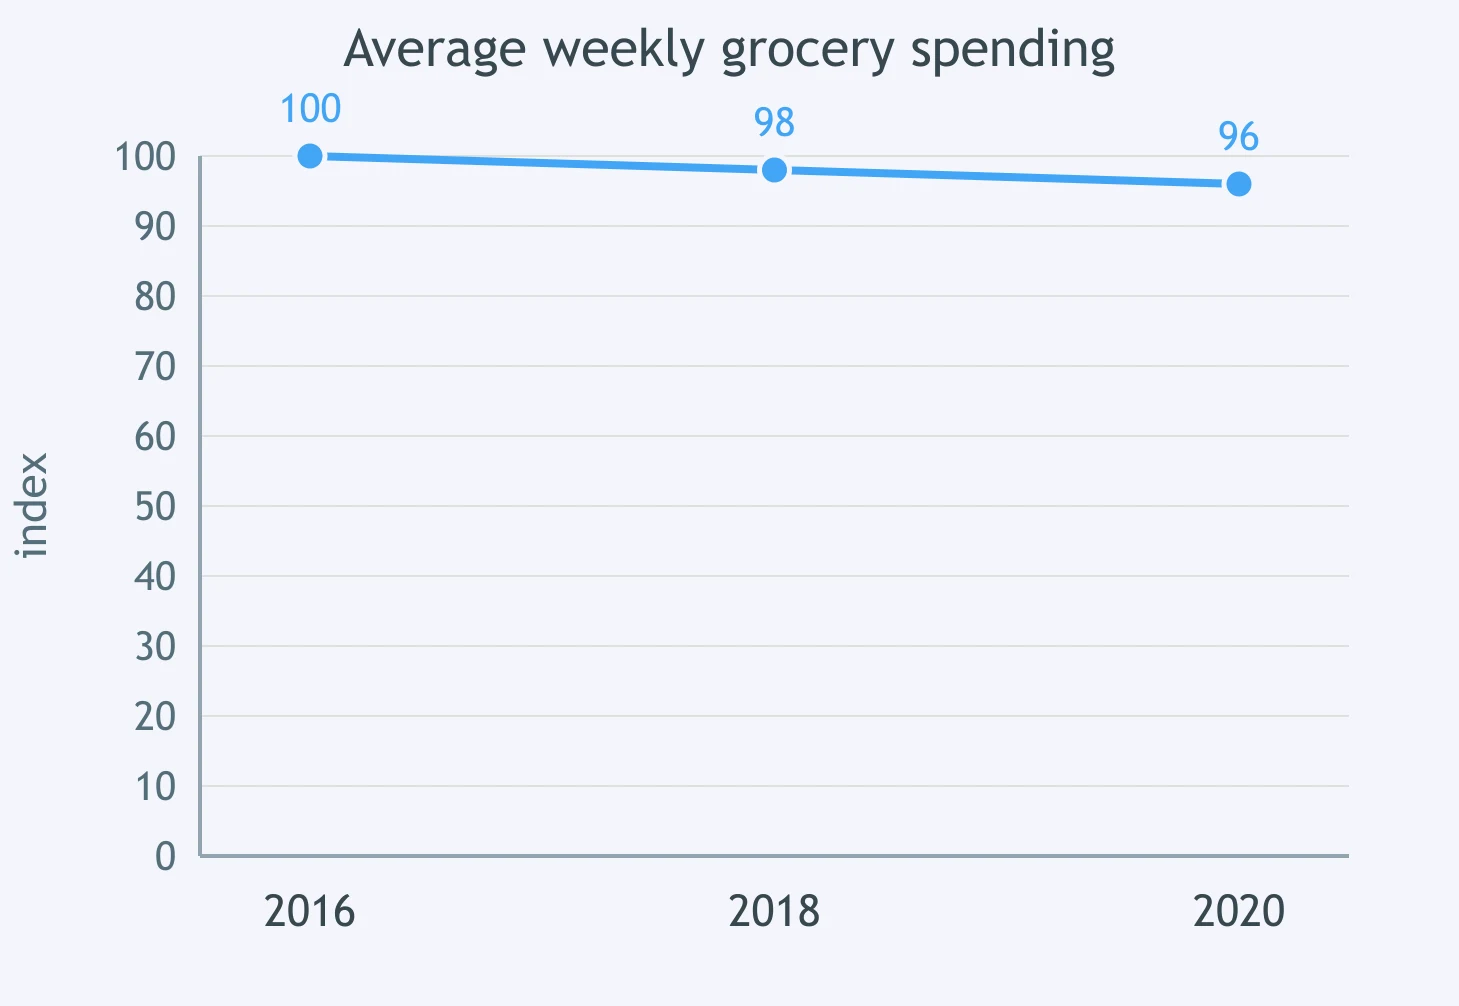
The line graph shows average weekly grocery spending. How did 2018 compare with 2016?
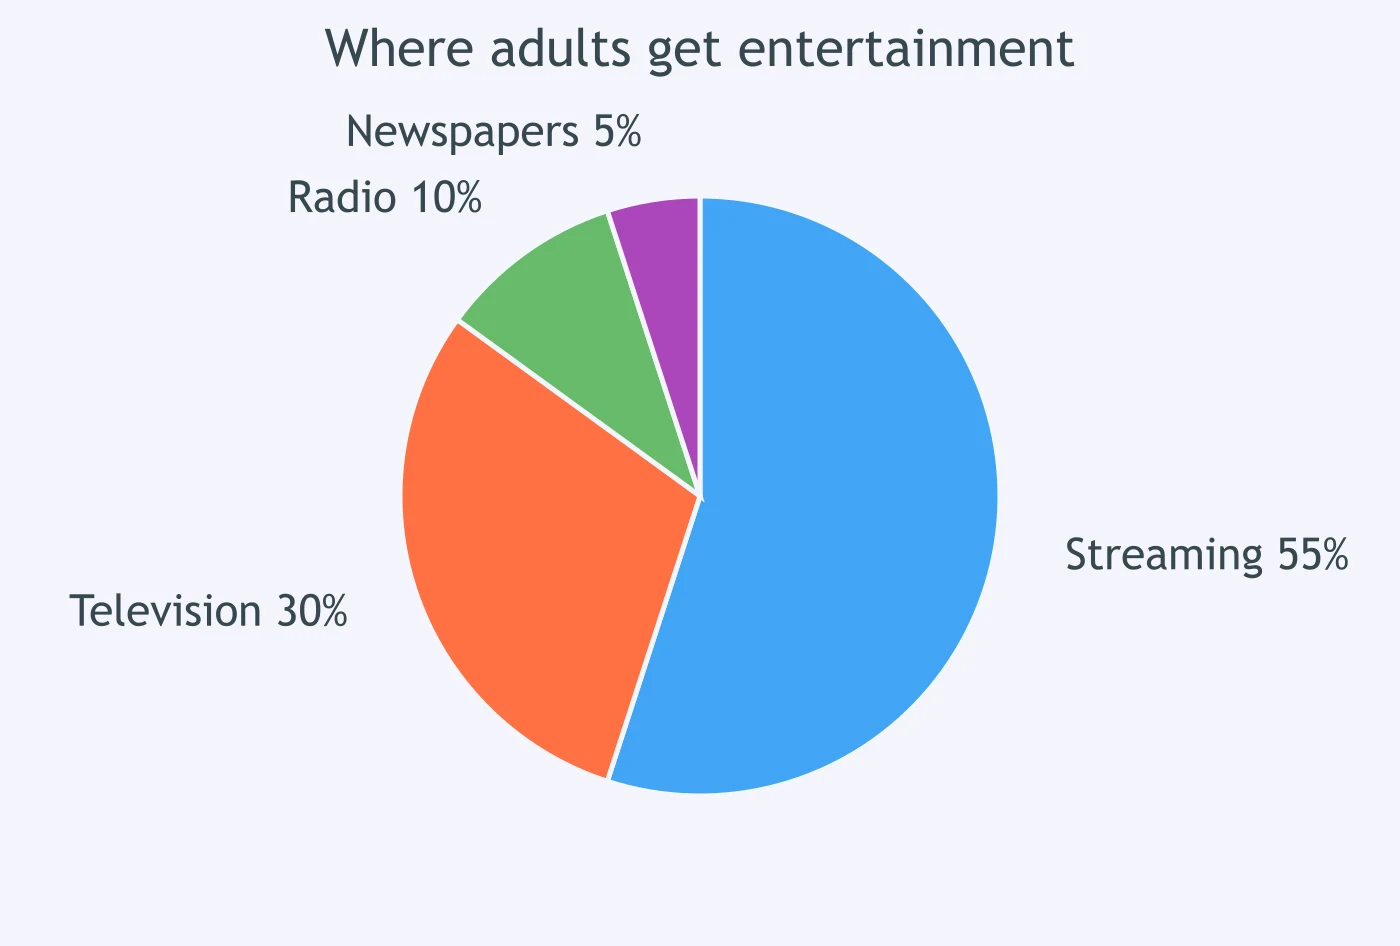
The pie chart shows where adults get entertainment. Which sentence compares newspapers with streaming correctly?
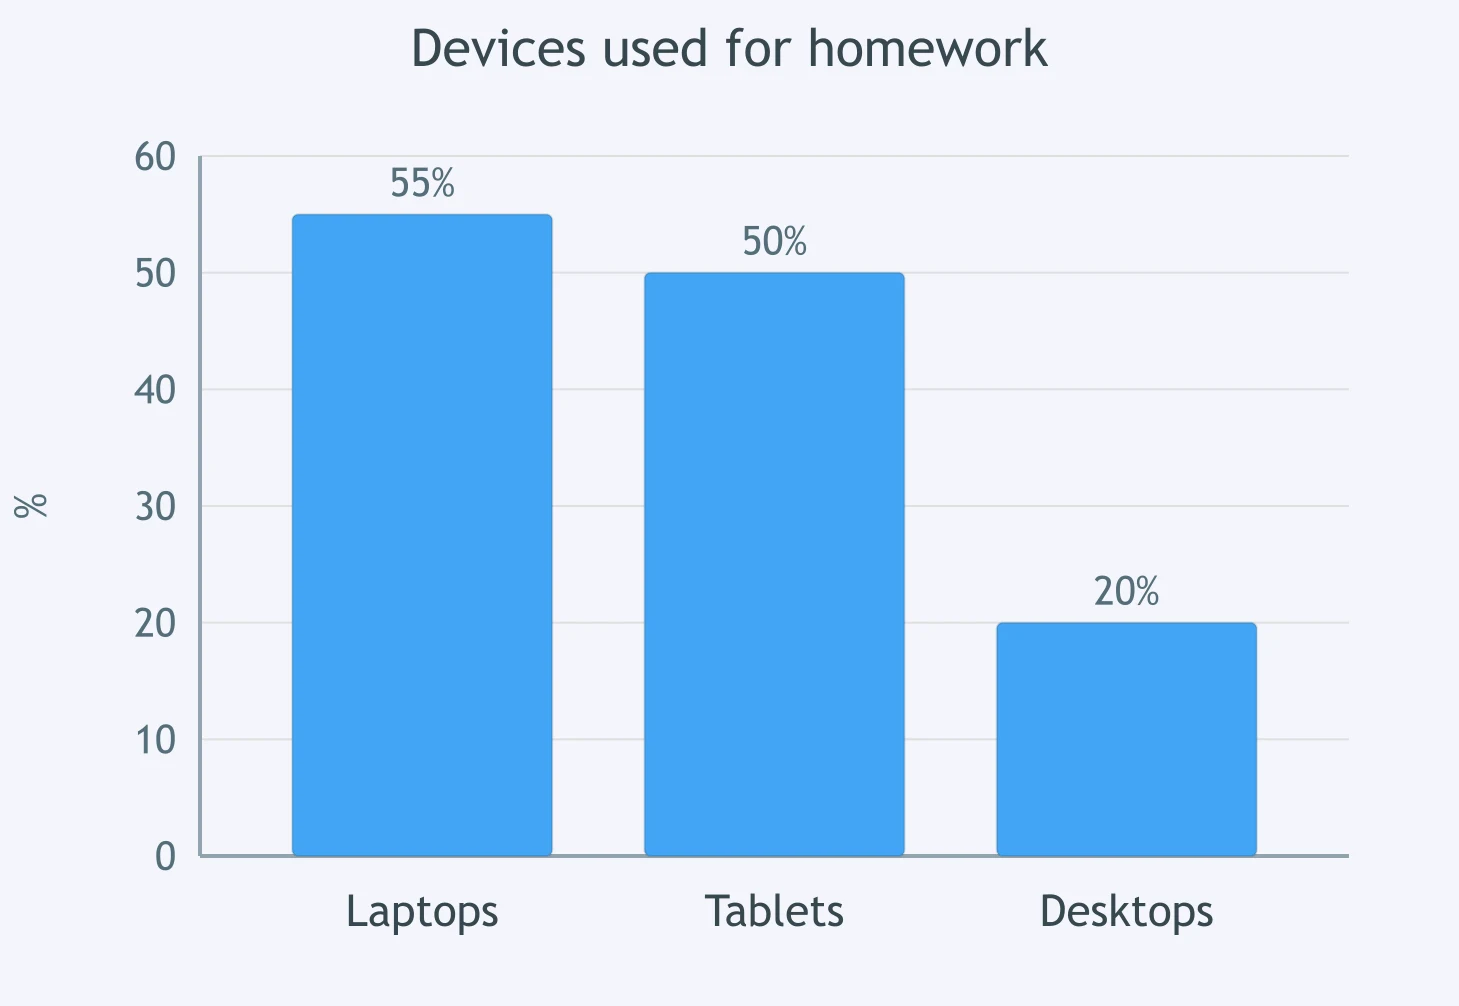
The bar chart shows devices used for homework. How did laptop use compare with tablet use?
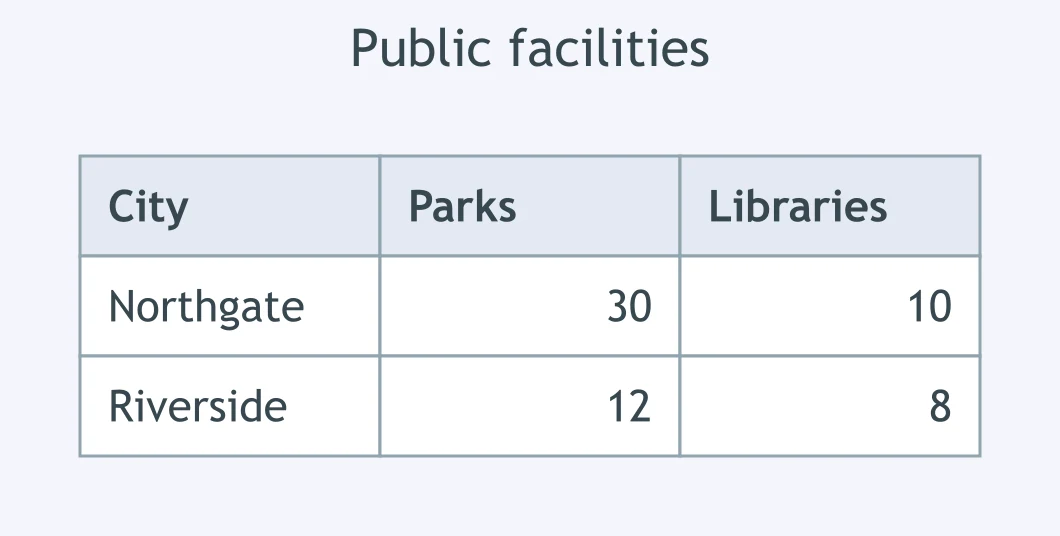
According to the table, how did parks in Northgate compare with libraries there?
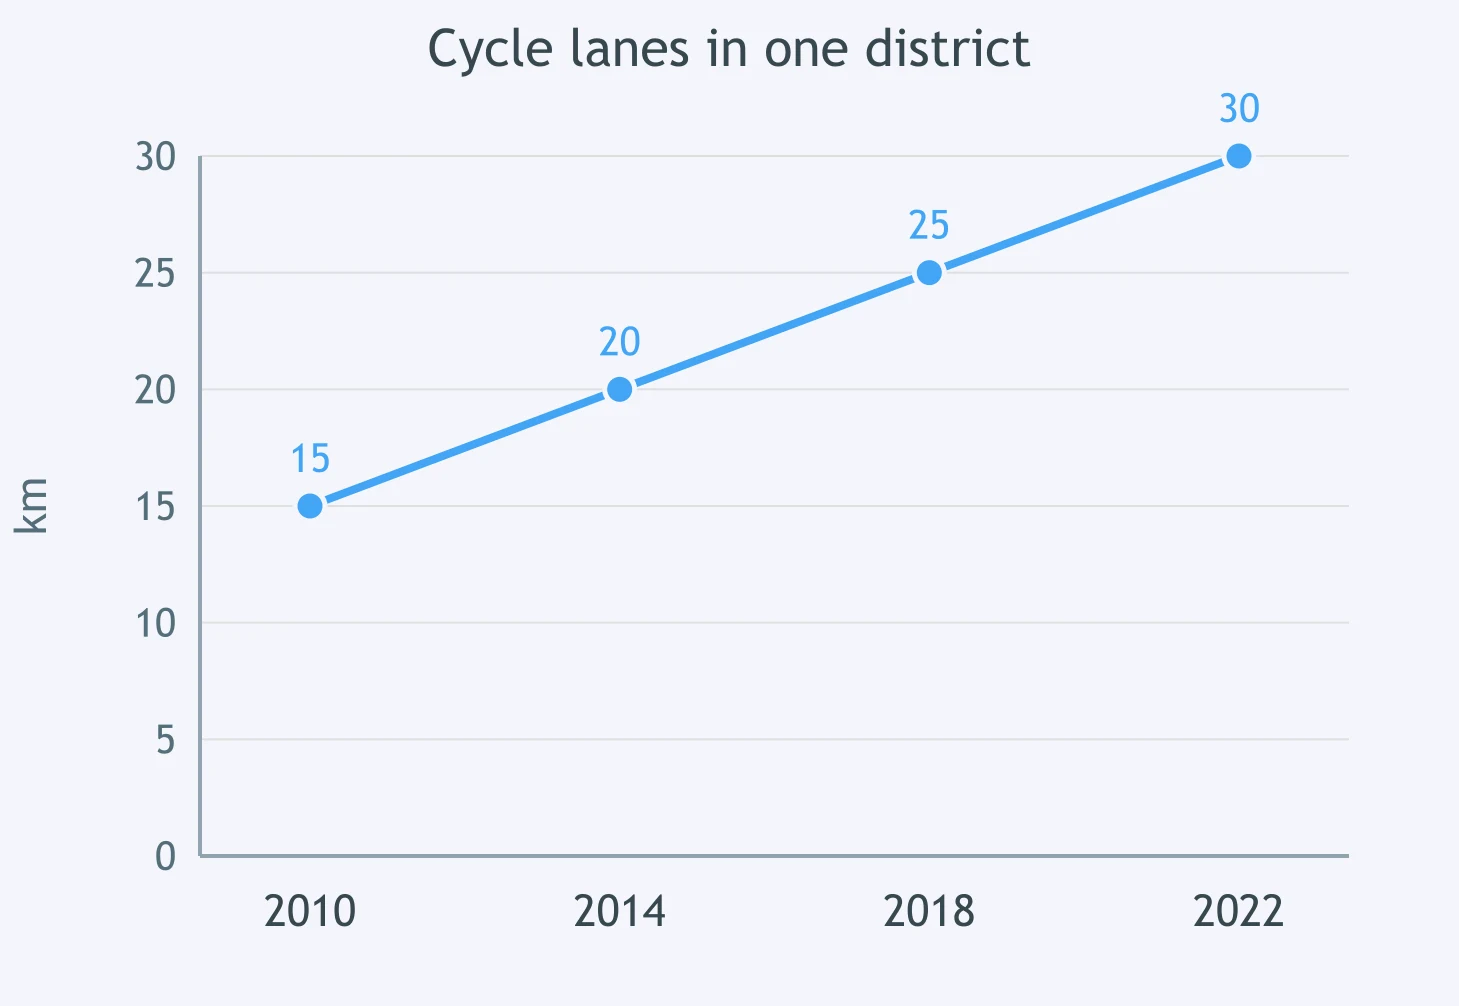
The graph shows cycle lanes in one district. How did 2022 compare with 2010?
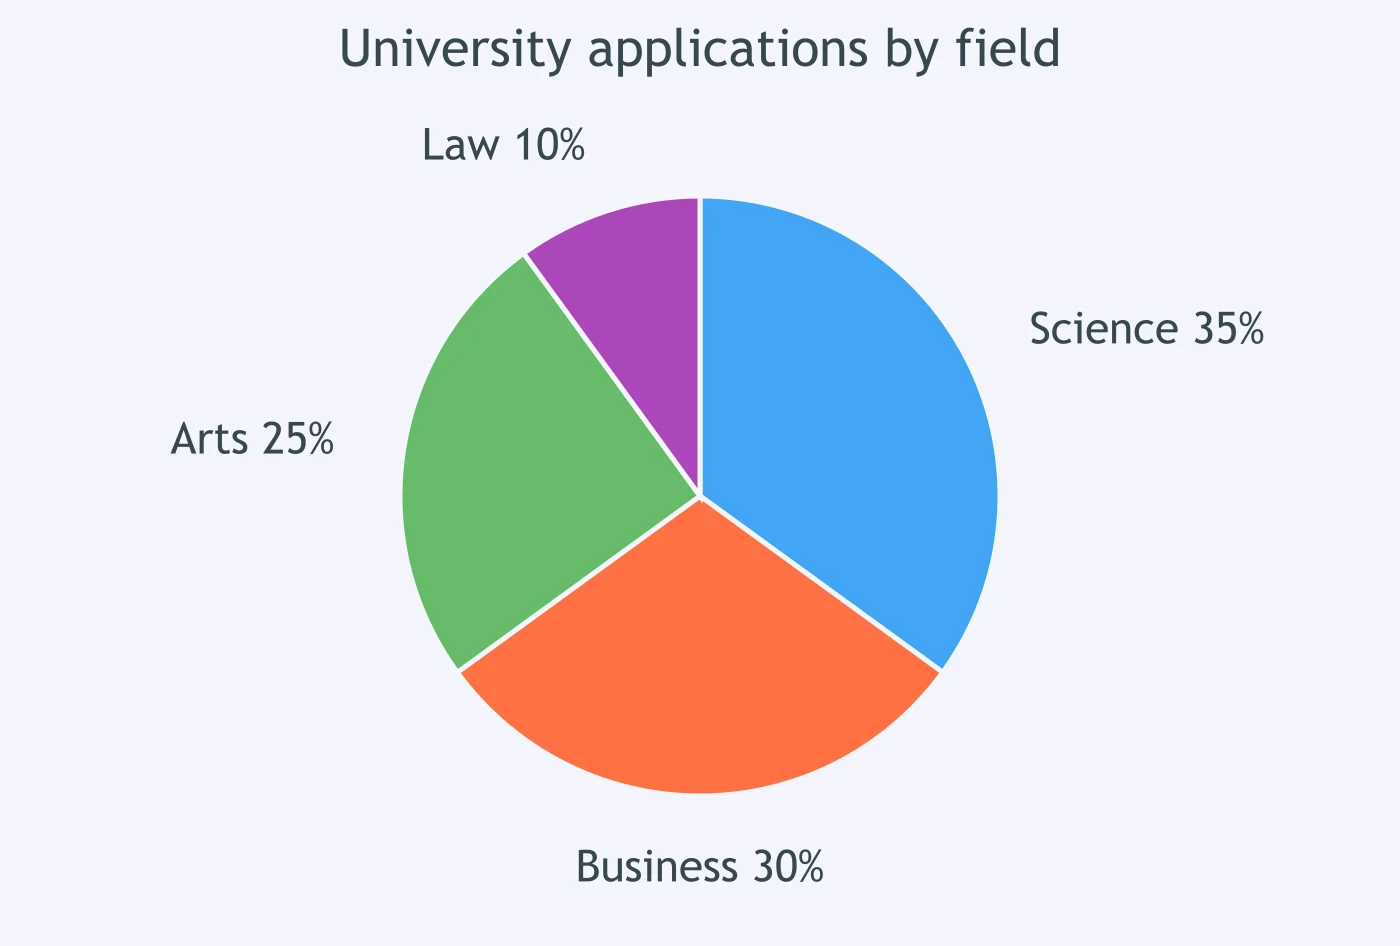
The pie chart shows university applications by field. Which comparison of science with business is correct?
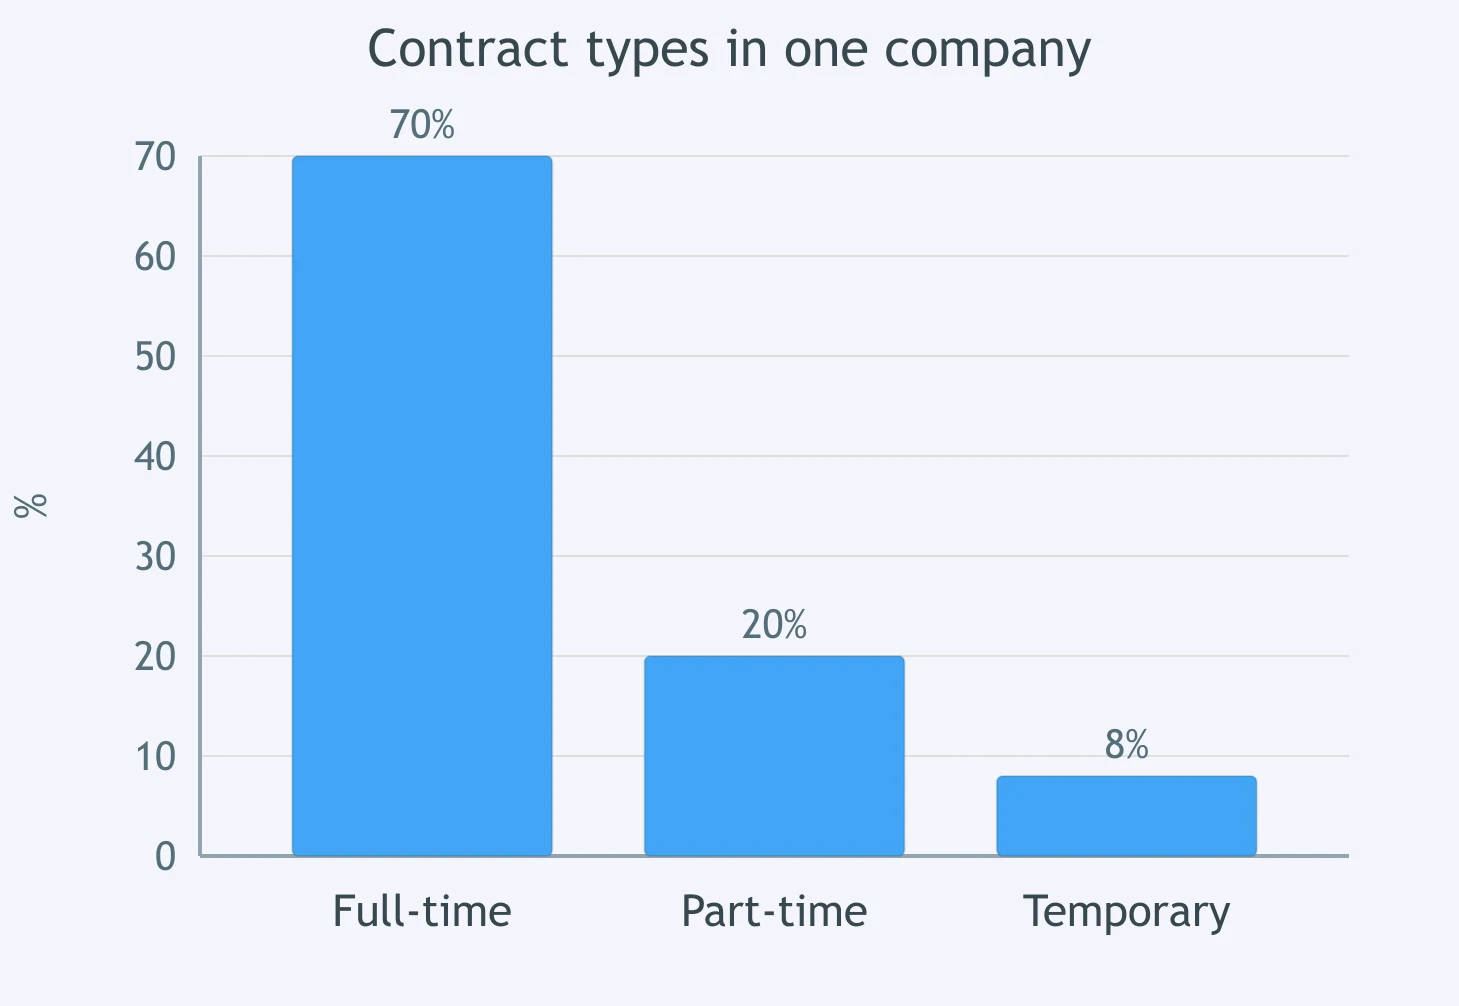
The chart shows contract types in one company. How did temporary staff compare with full-time staff?
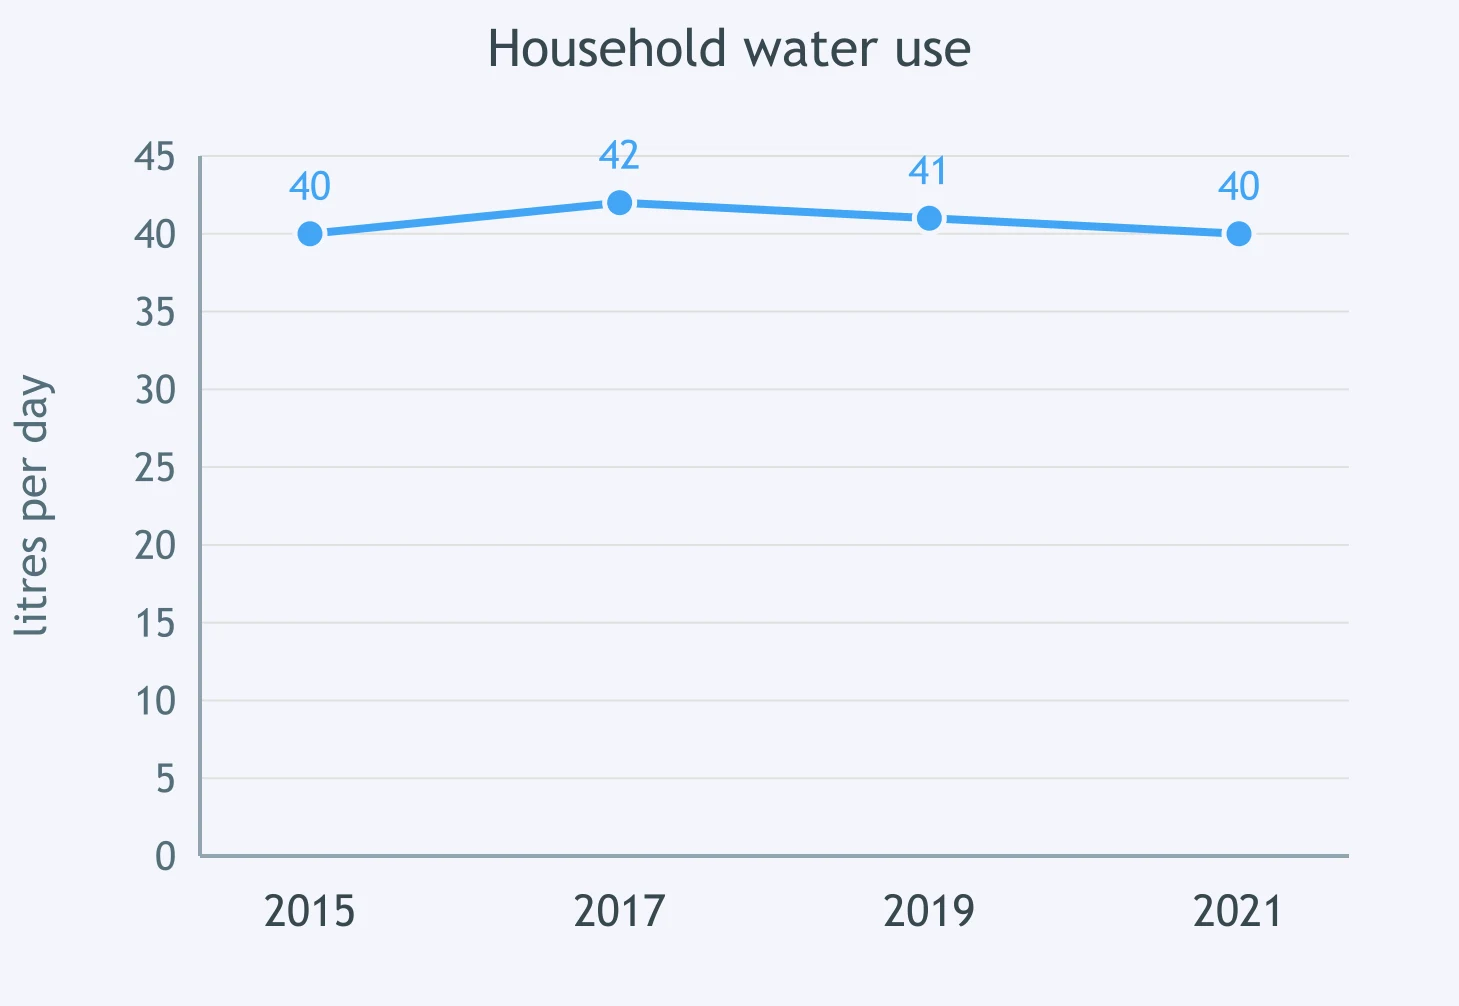
The line graph shows household water use. How did use in 2021 compare with 2015?
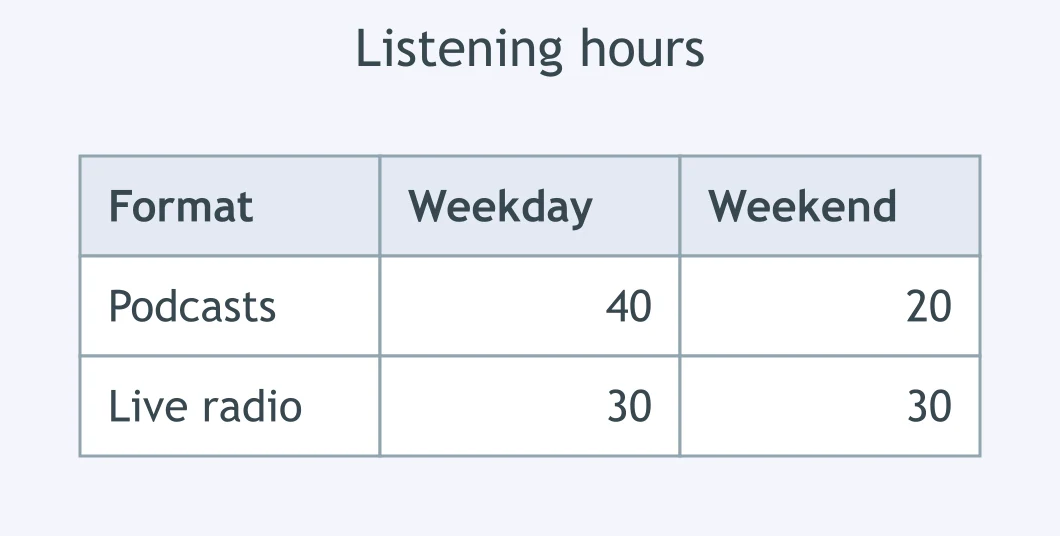
In the table of listening hours, how did weekend podcast listening compare with weekday listening?
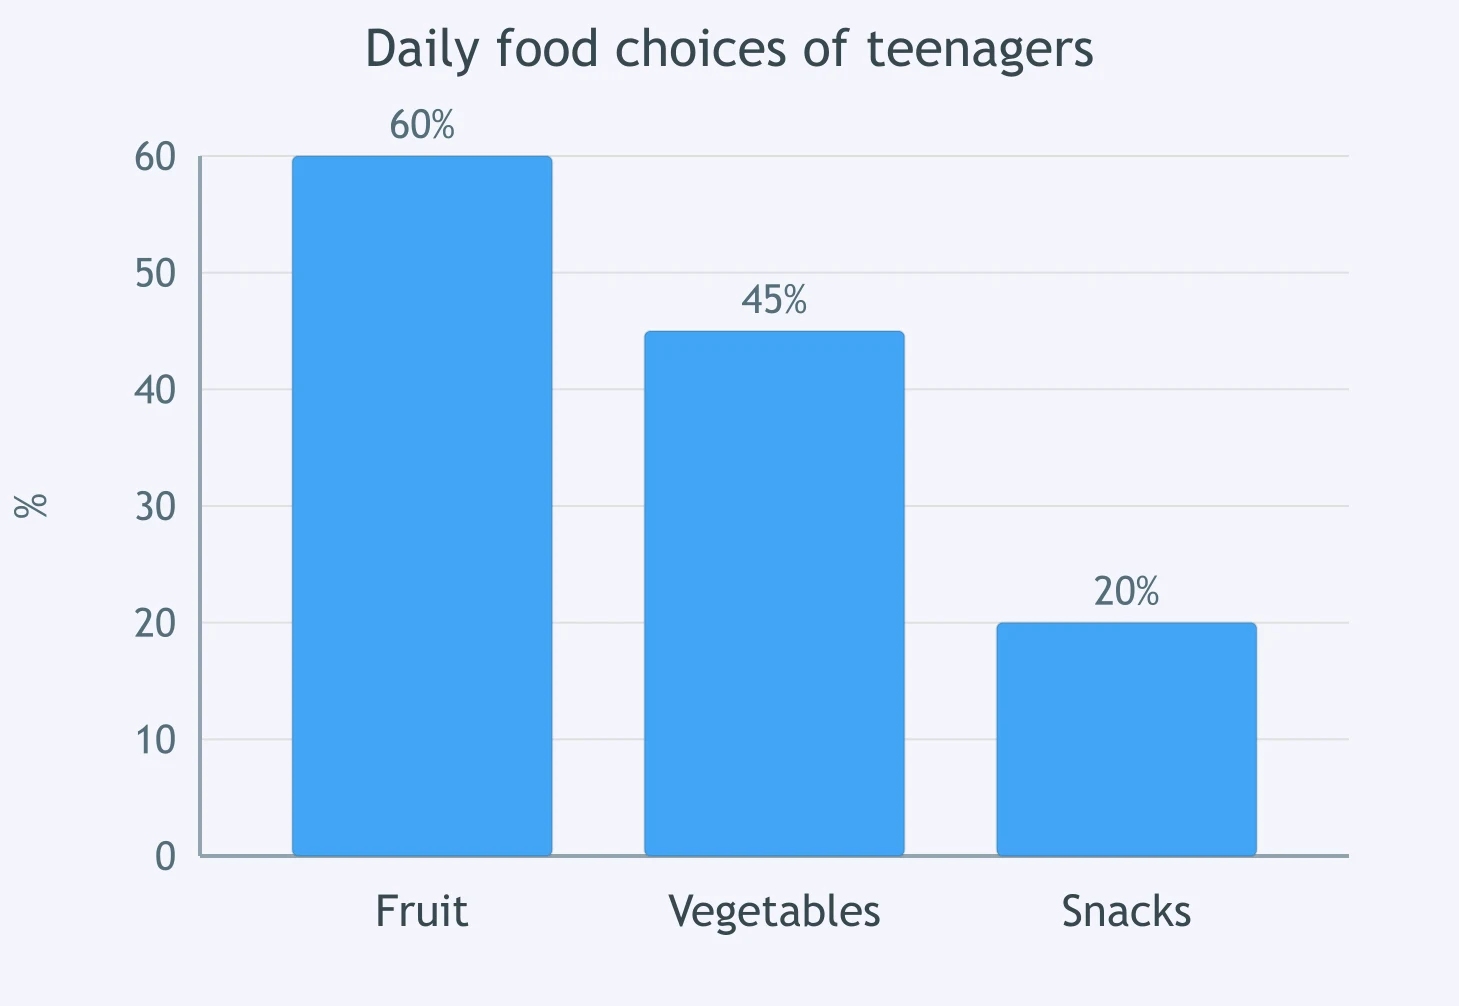
The bar chart shows daily food choices of teenagers. Which sentence compares snacks with fruit correctly?
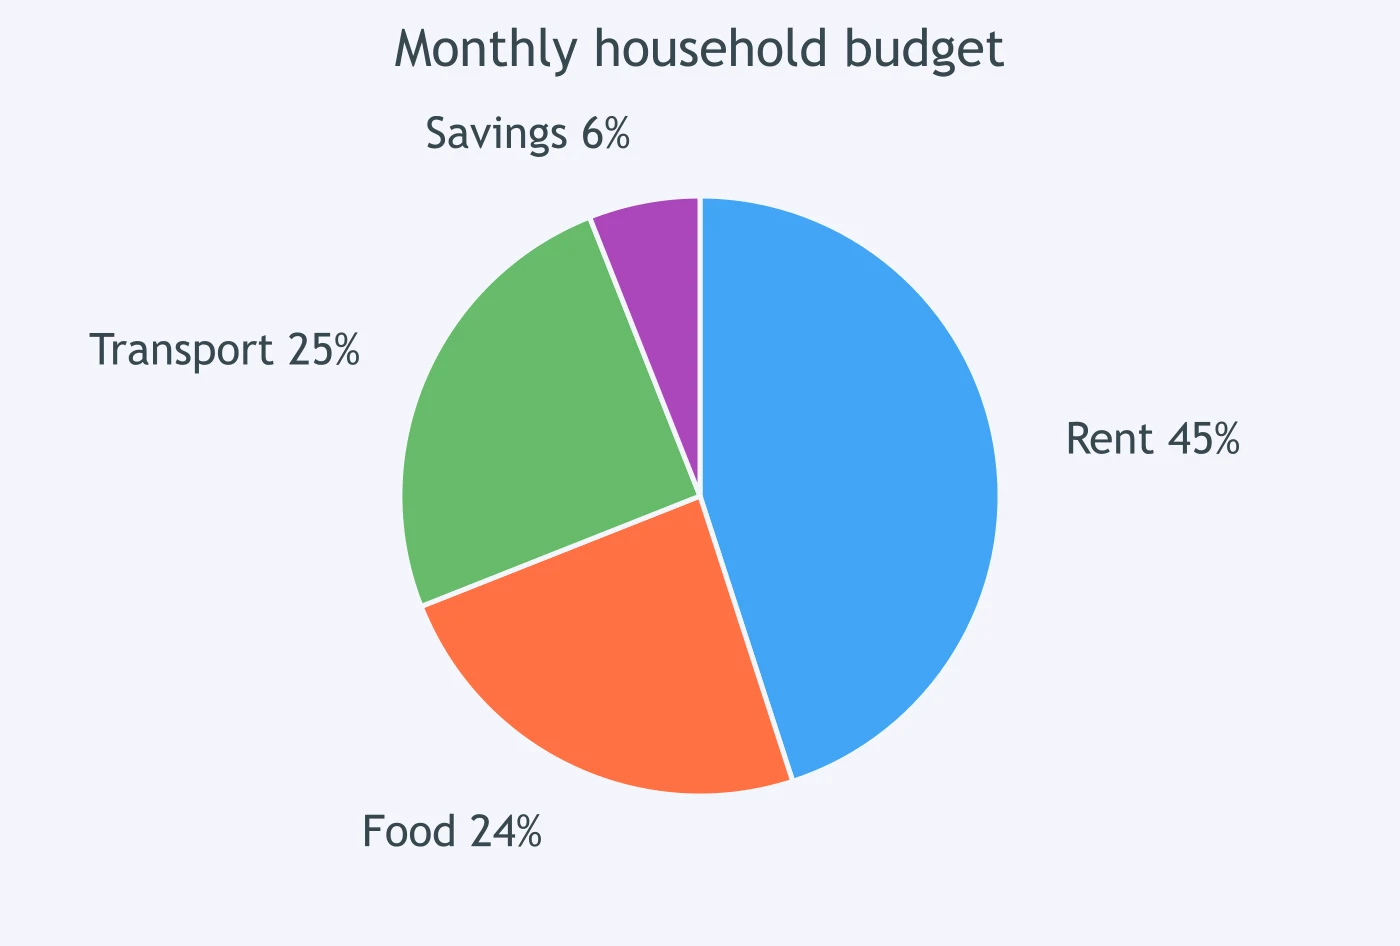
The pie chart shows a monthly household budget. How did the food share compare with transport?
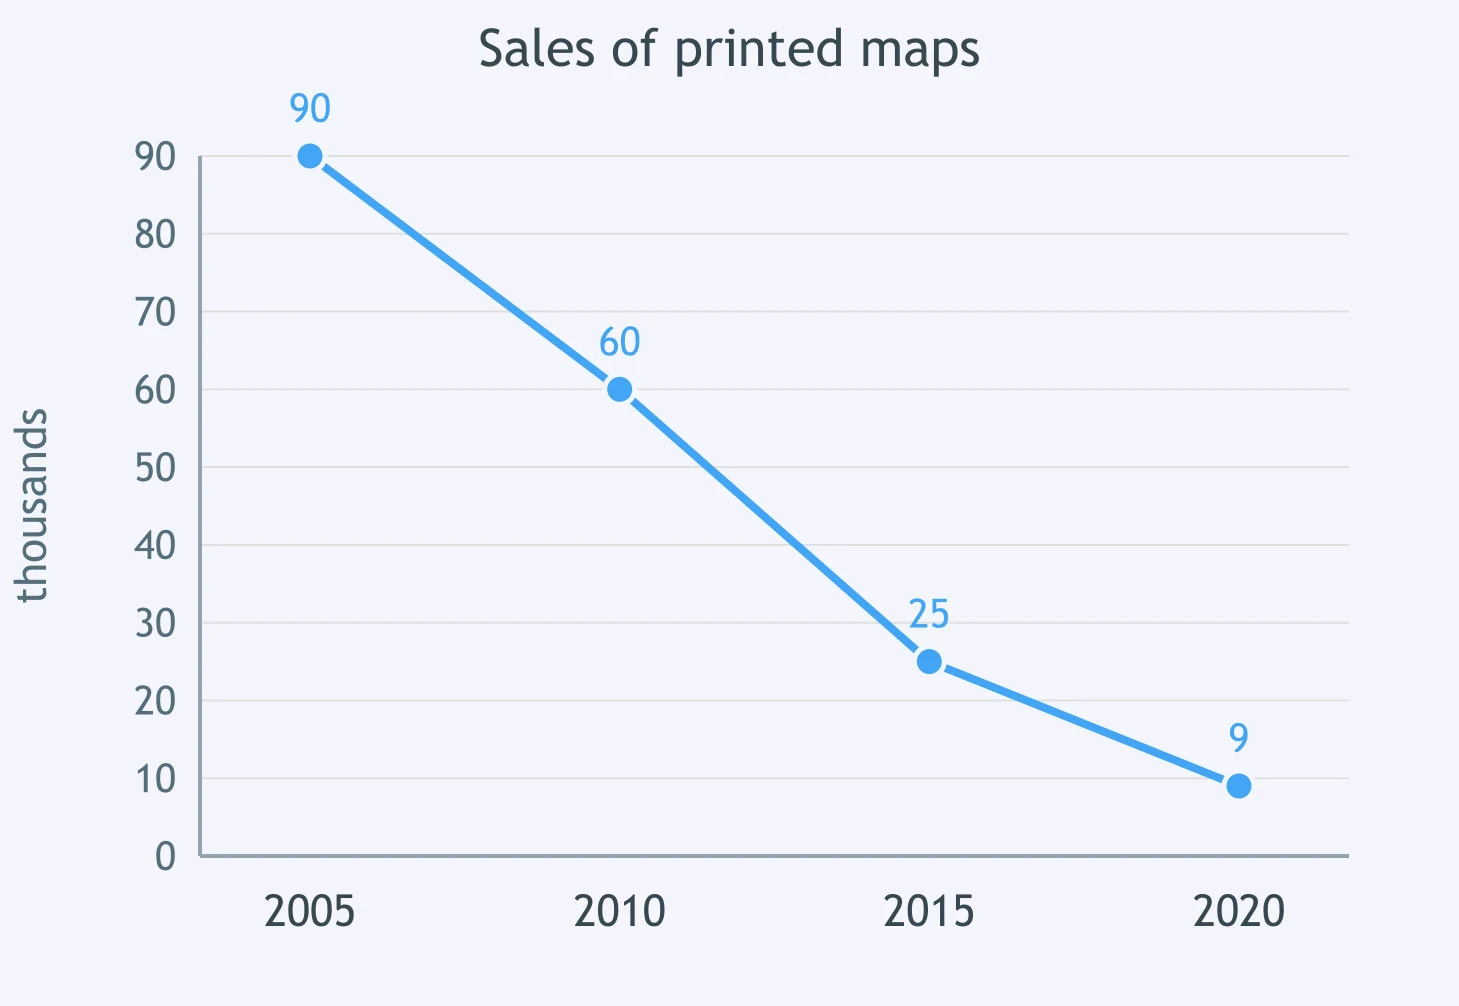
The graph shows sales of printed maps. How did 2020 compare with 2005?
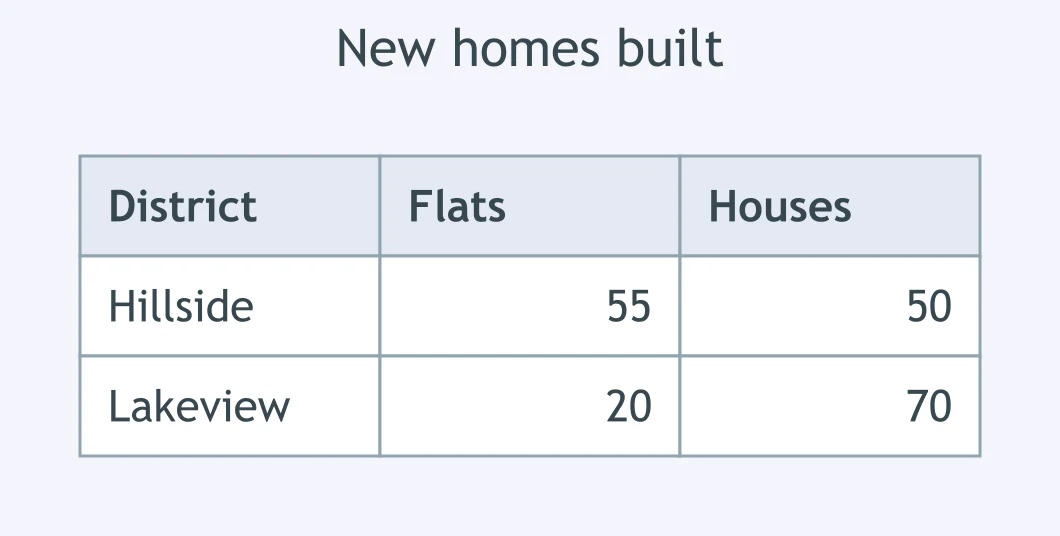
In the table of new homes, how did flats in Hillside compare with houses there?
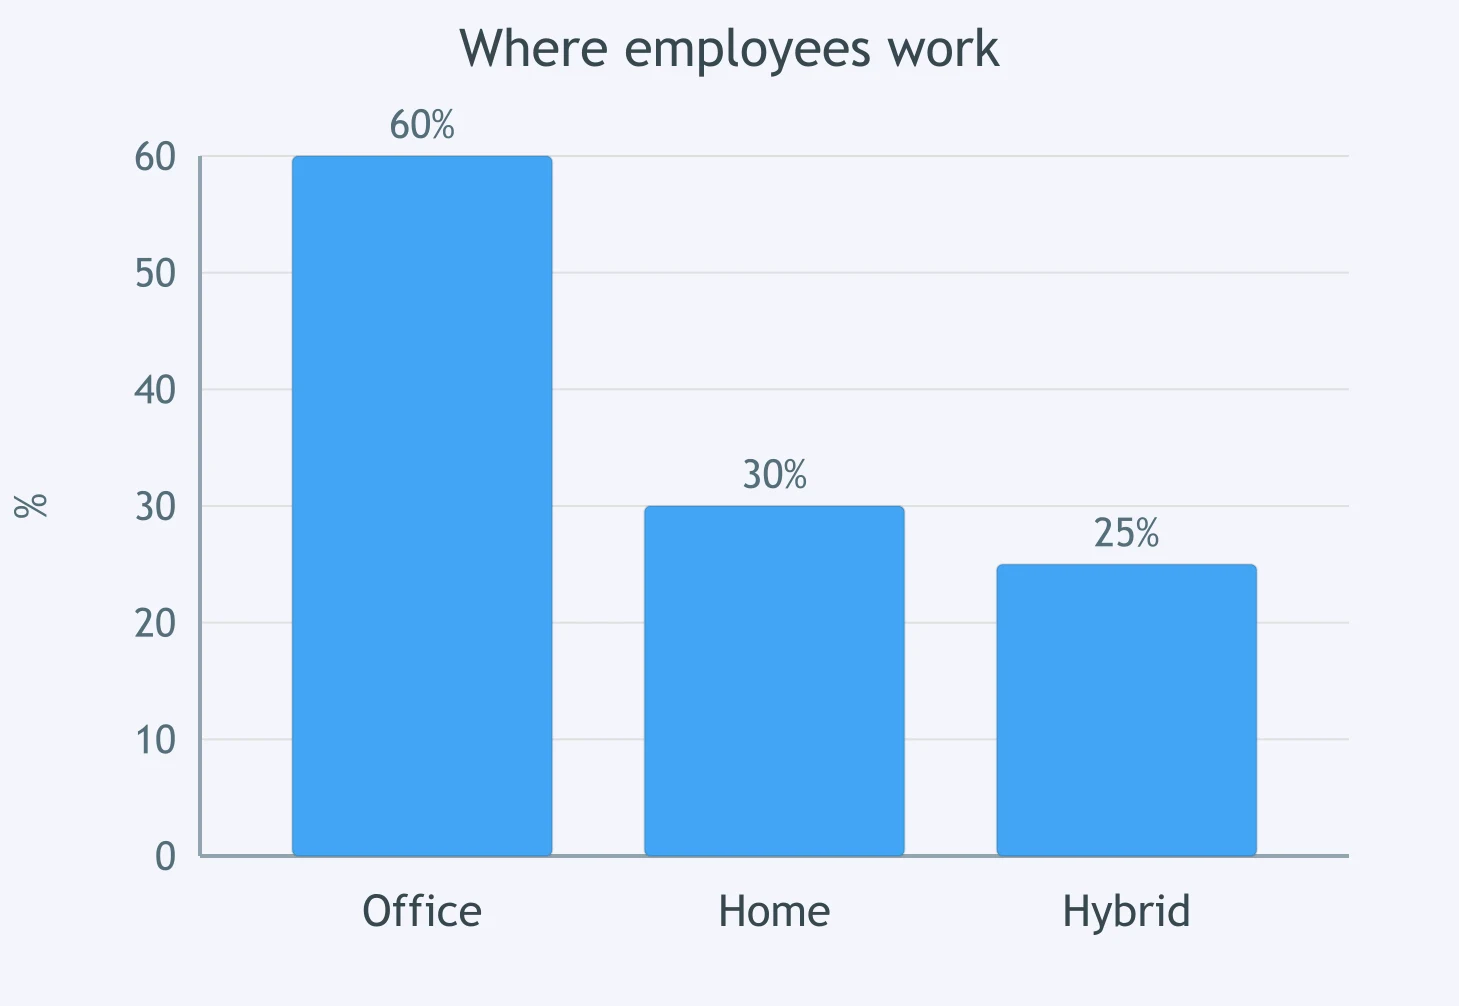
The chart shows where employees work. Which comparison of office with home working is accurate?
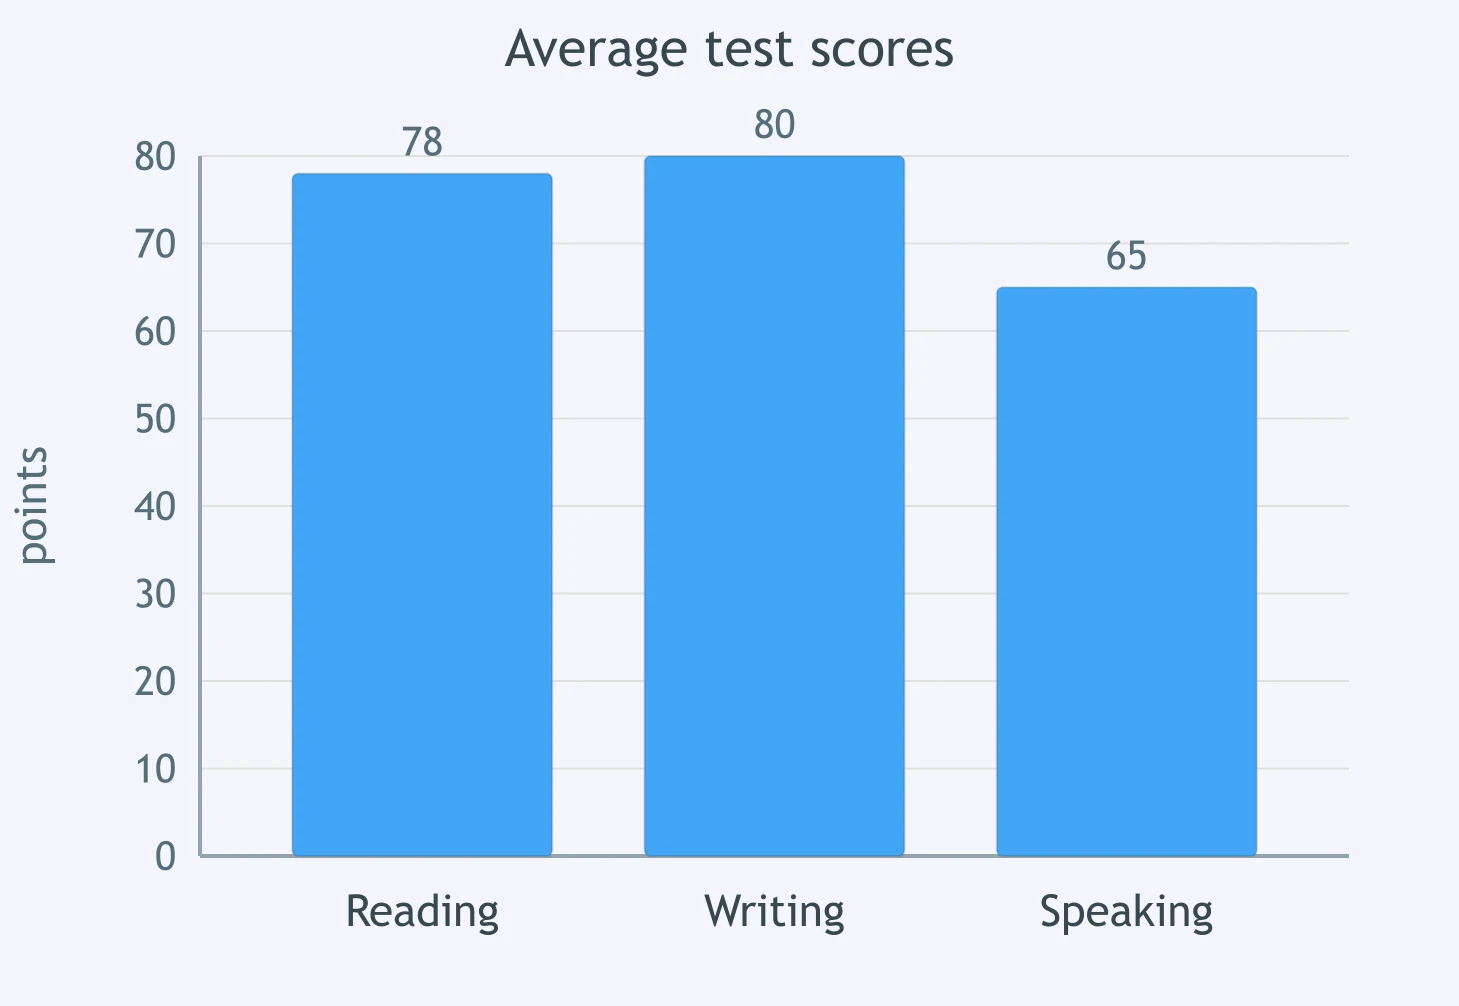
The bar chart shows average test scores. How did the reading score compare with the writing score?
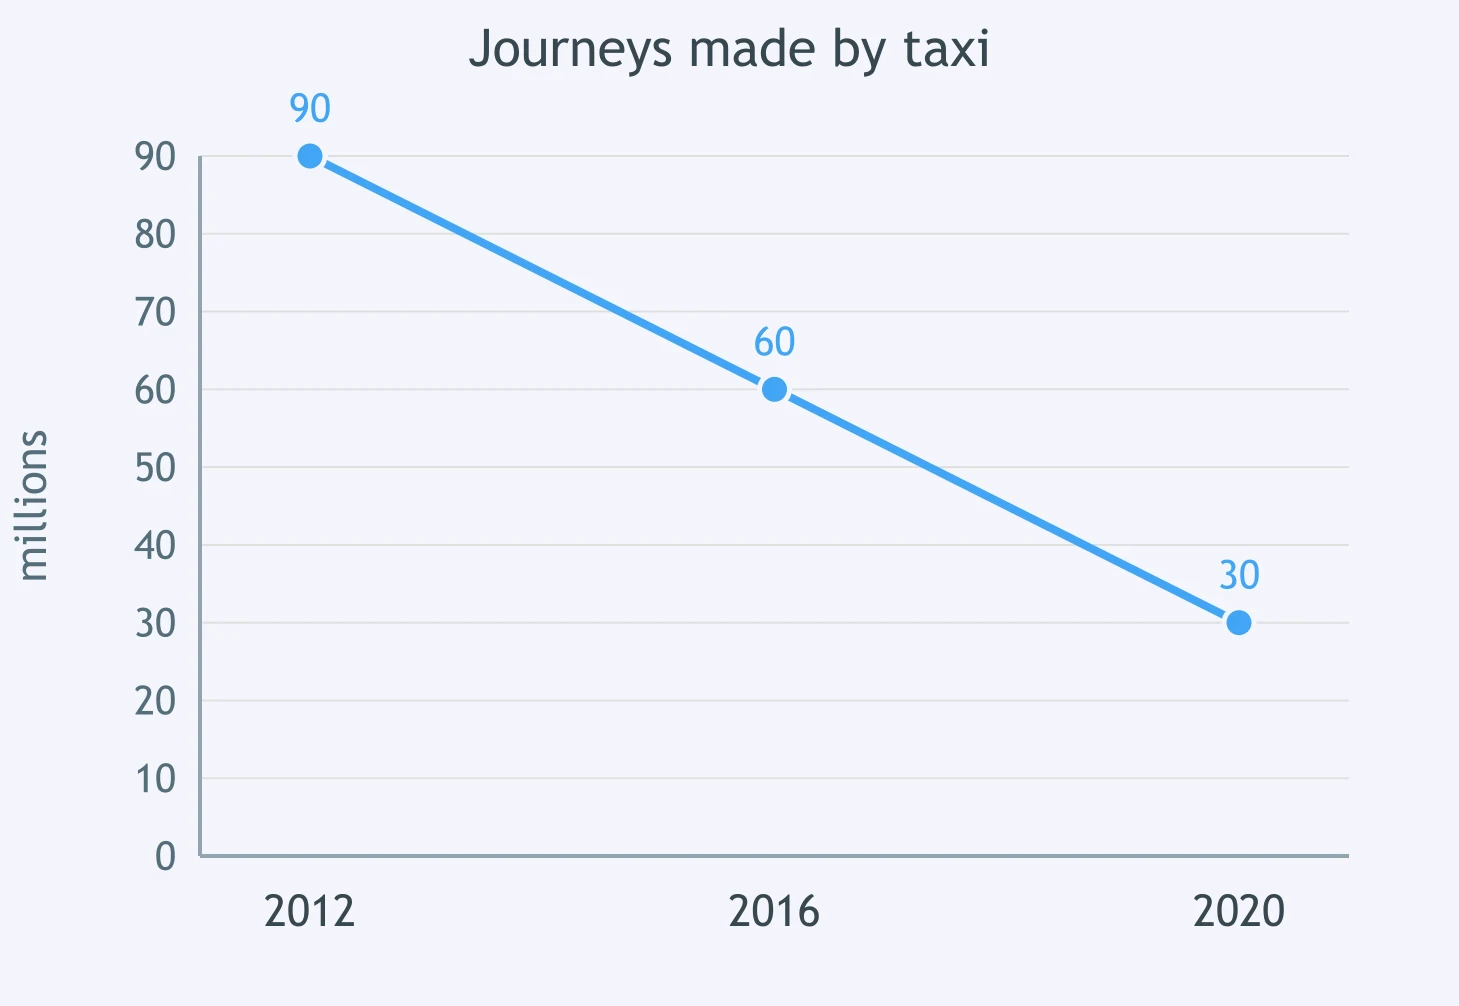
The graph shows journeys made by taxi. How did 2020 compare with 2012?
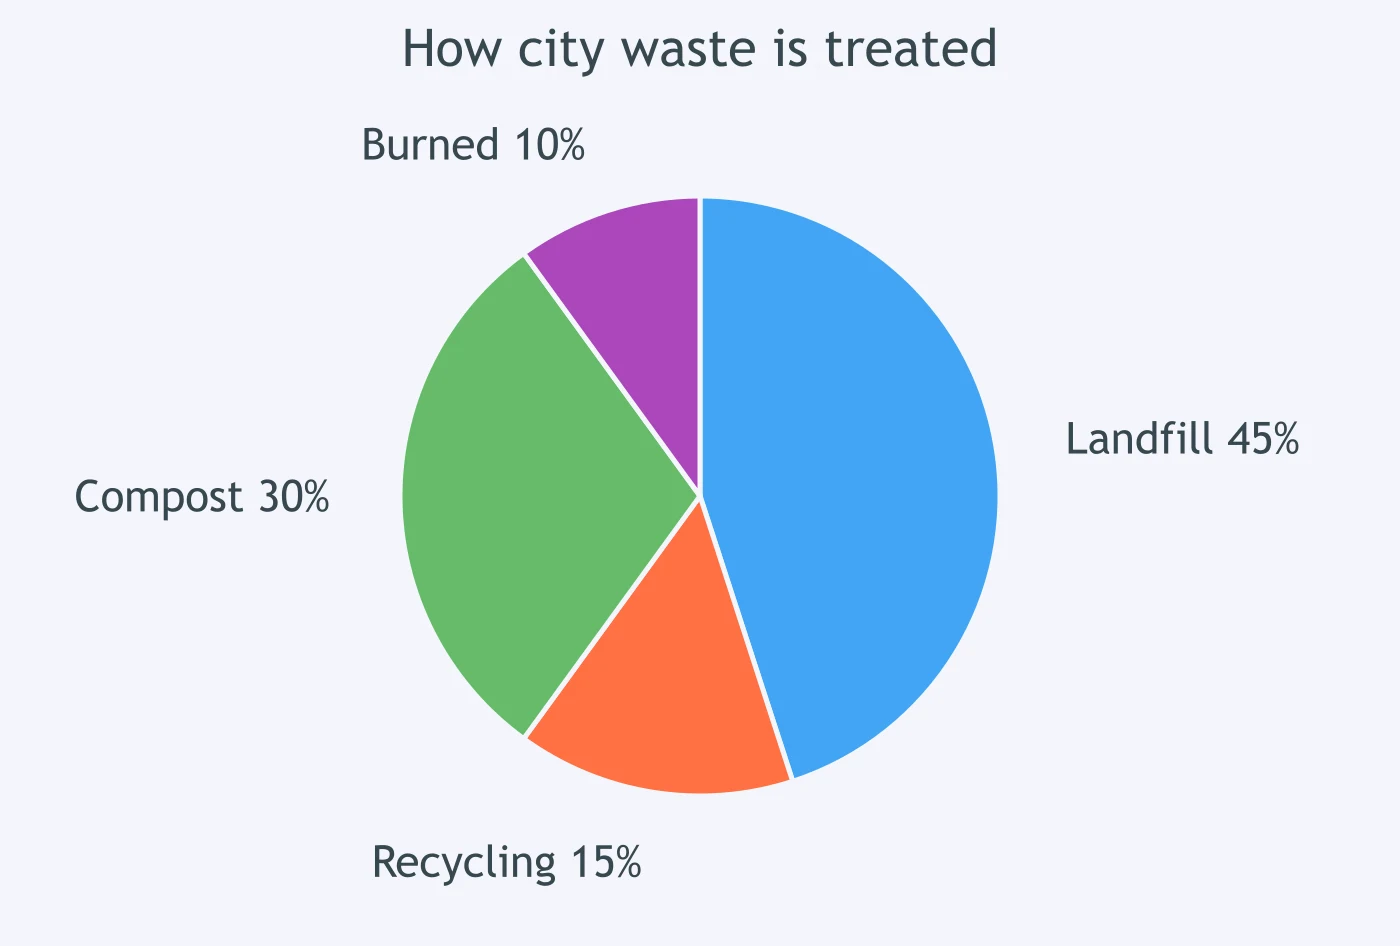
The pie chart shows how city waste is treated. Which comparison of landfill with recycling is correct?
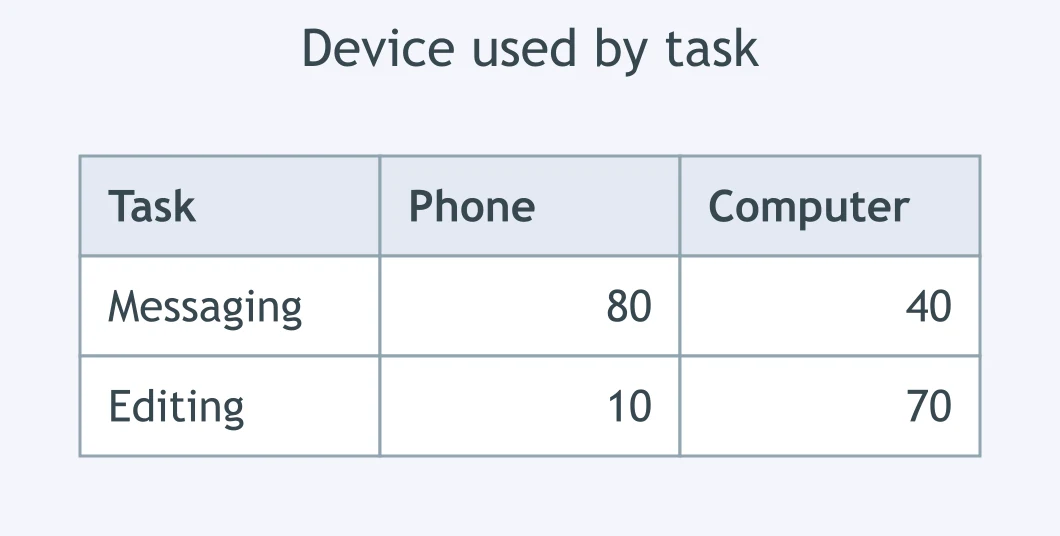
In the table of device use, how did messaging on a computer compare with messaging on a phone?
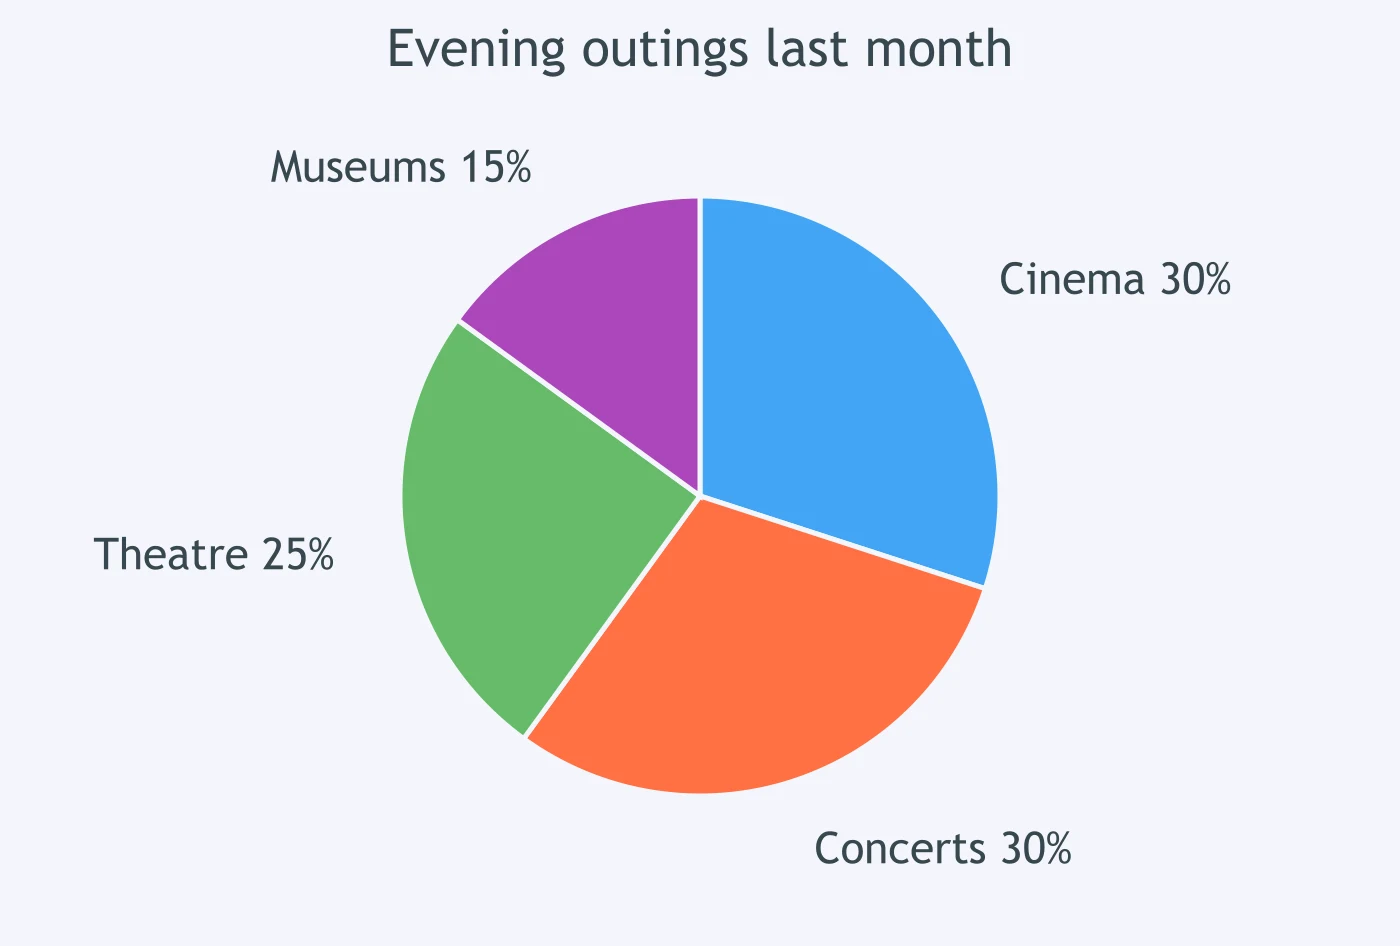
The pie chart shows evening outings last month. How did cinema trips compare with concert trips?
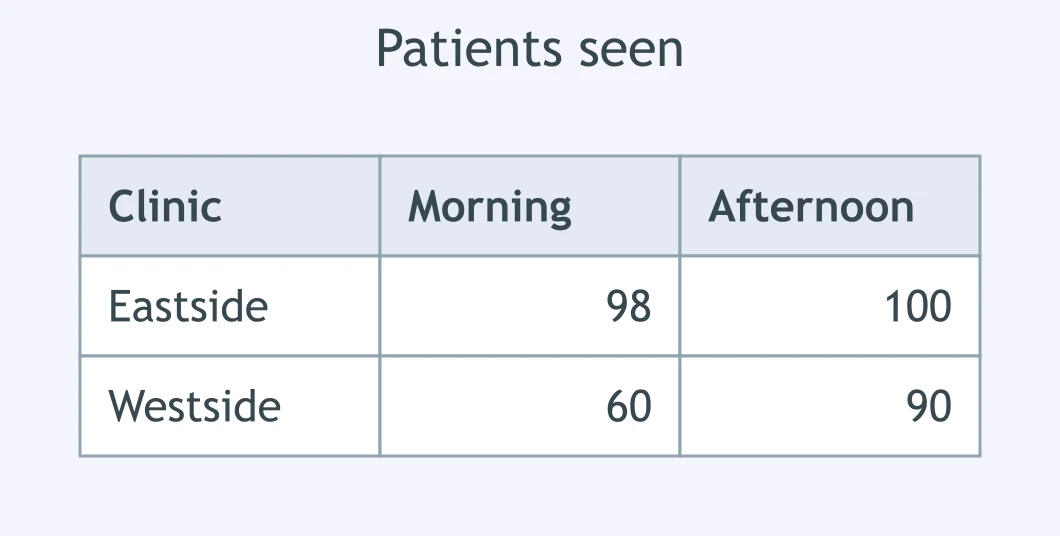
In the table of patients seen, how did the Eastside morning figure compare with its afternoon figure?
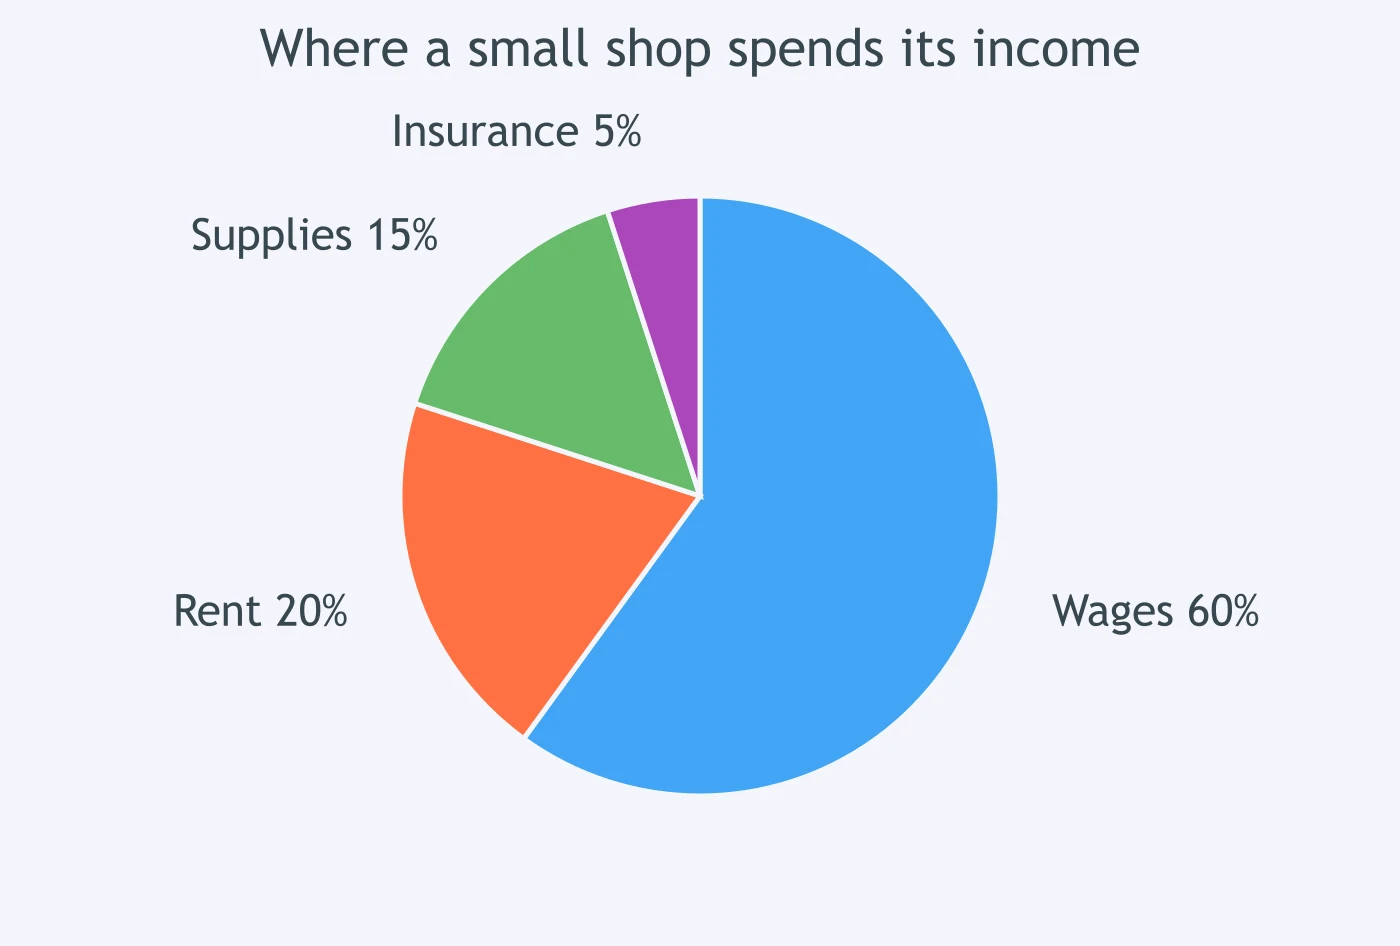
The pie chart shows where a small shop spends its income. Which comparison of rent with wages is correct?
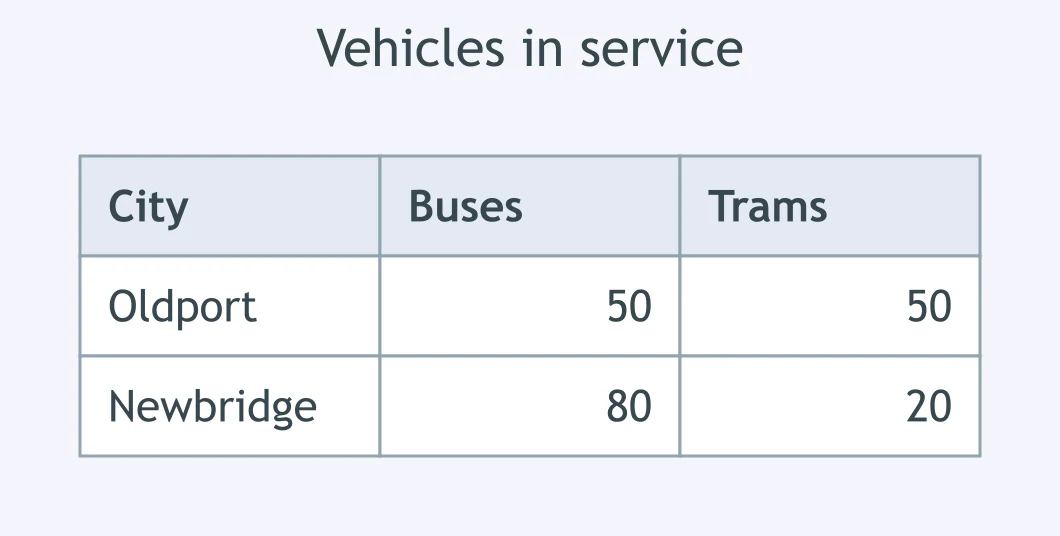
In the table of vehicles in service, how did buses in Oldport compare with trams there?
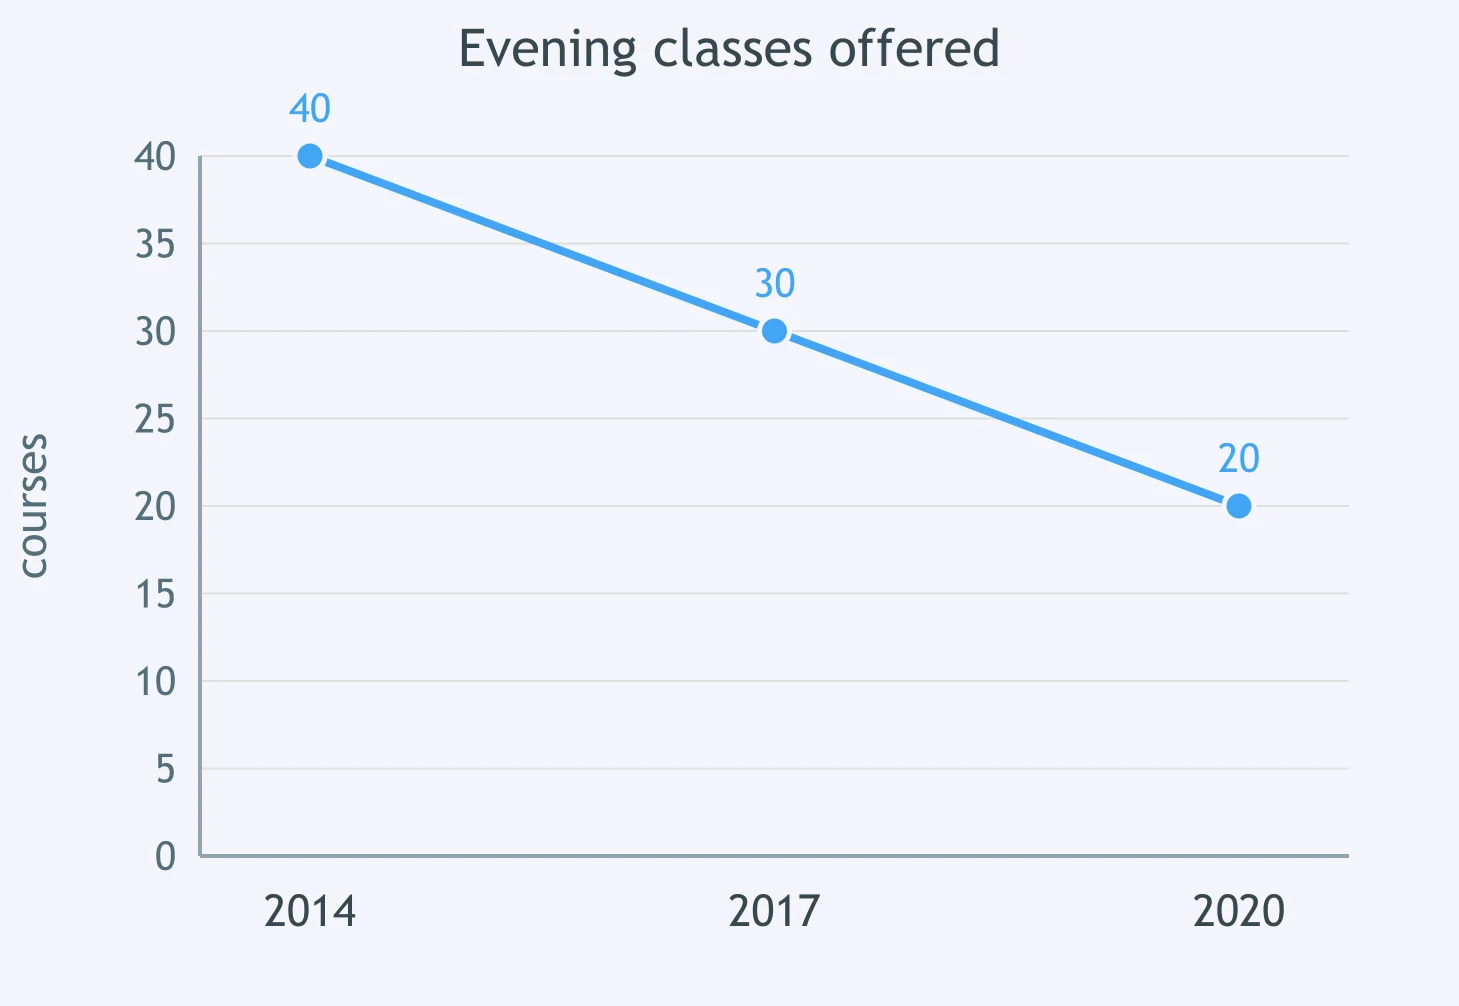
The graph shows evening classes offered. How did 2020 compare with 2014?
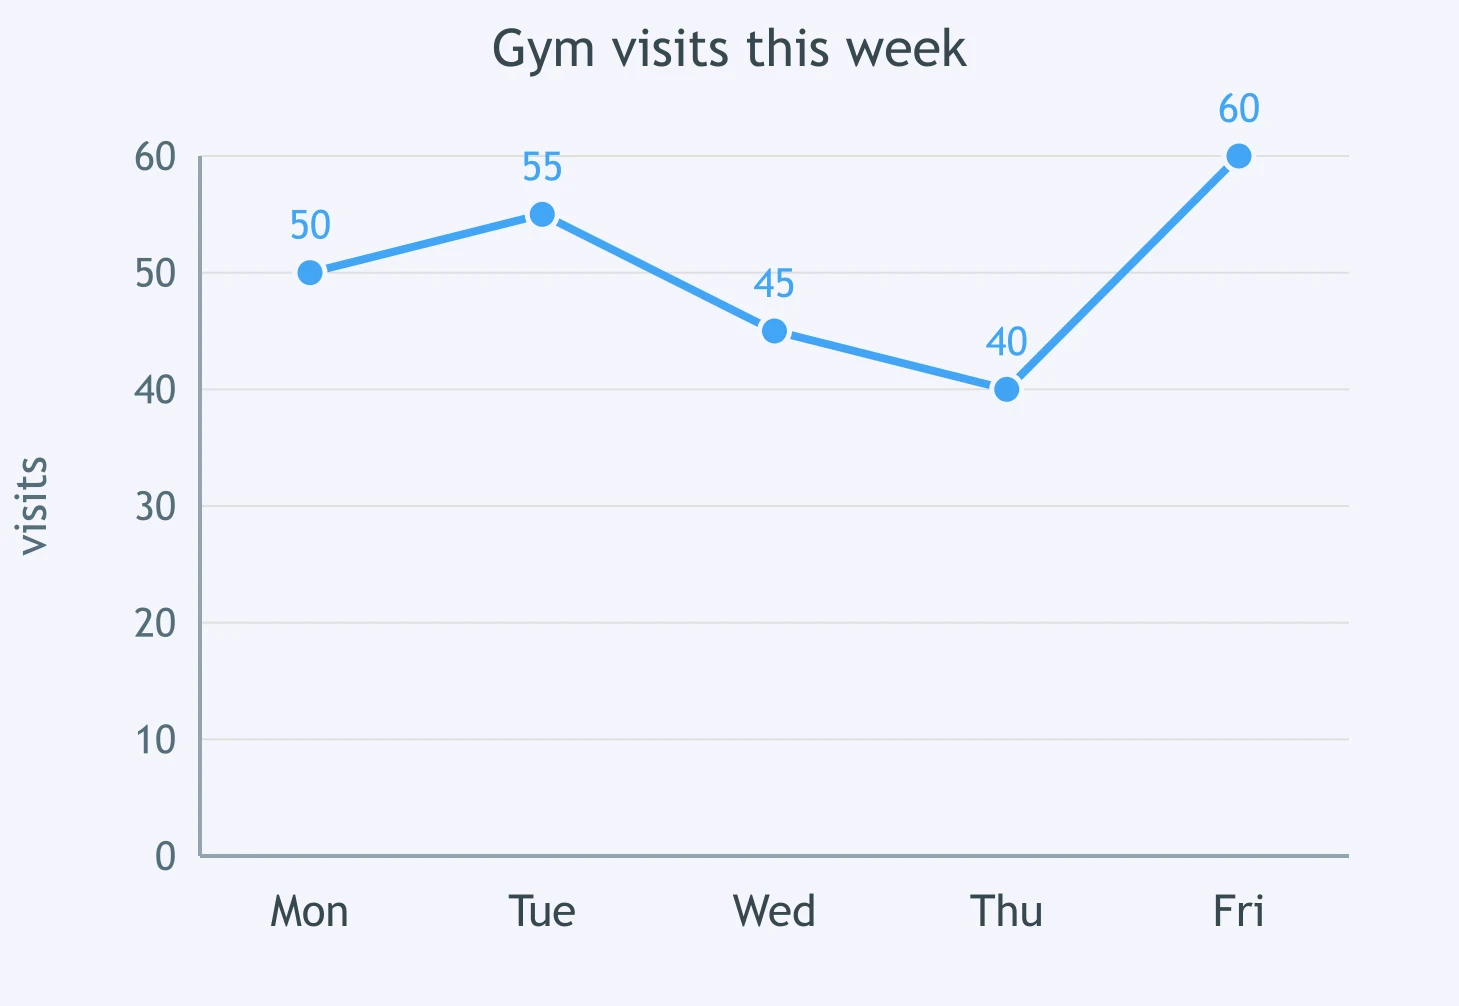
The graph shows gym visits this week. How did Tuesday compare with Monday?
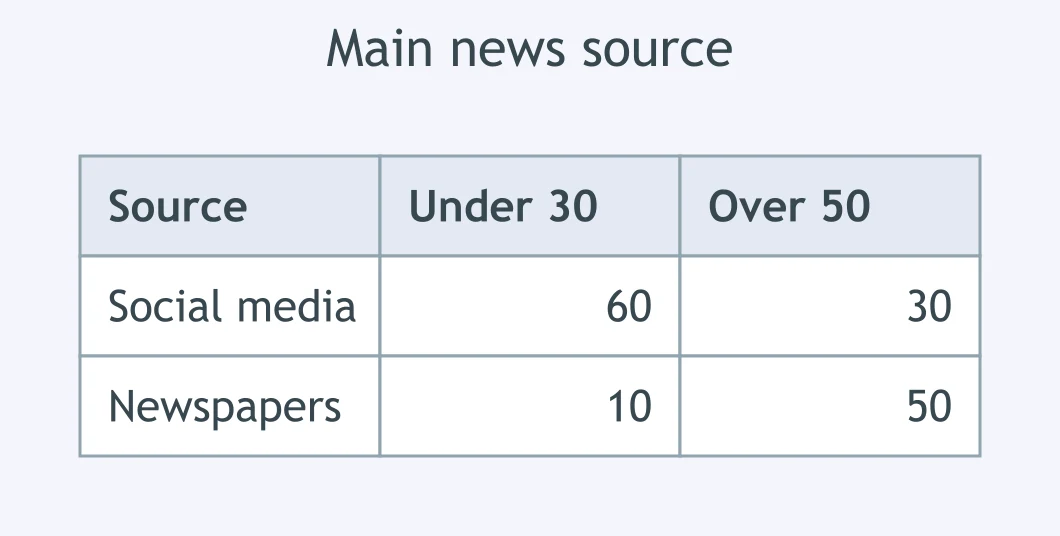
In the table of main news sources, how did under-30s compare with over-50s on social media?
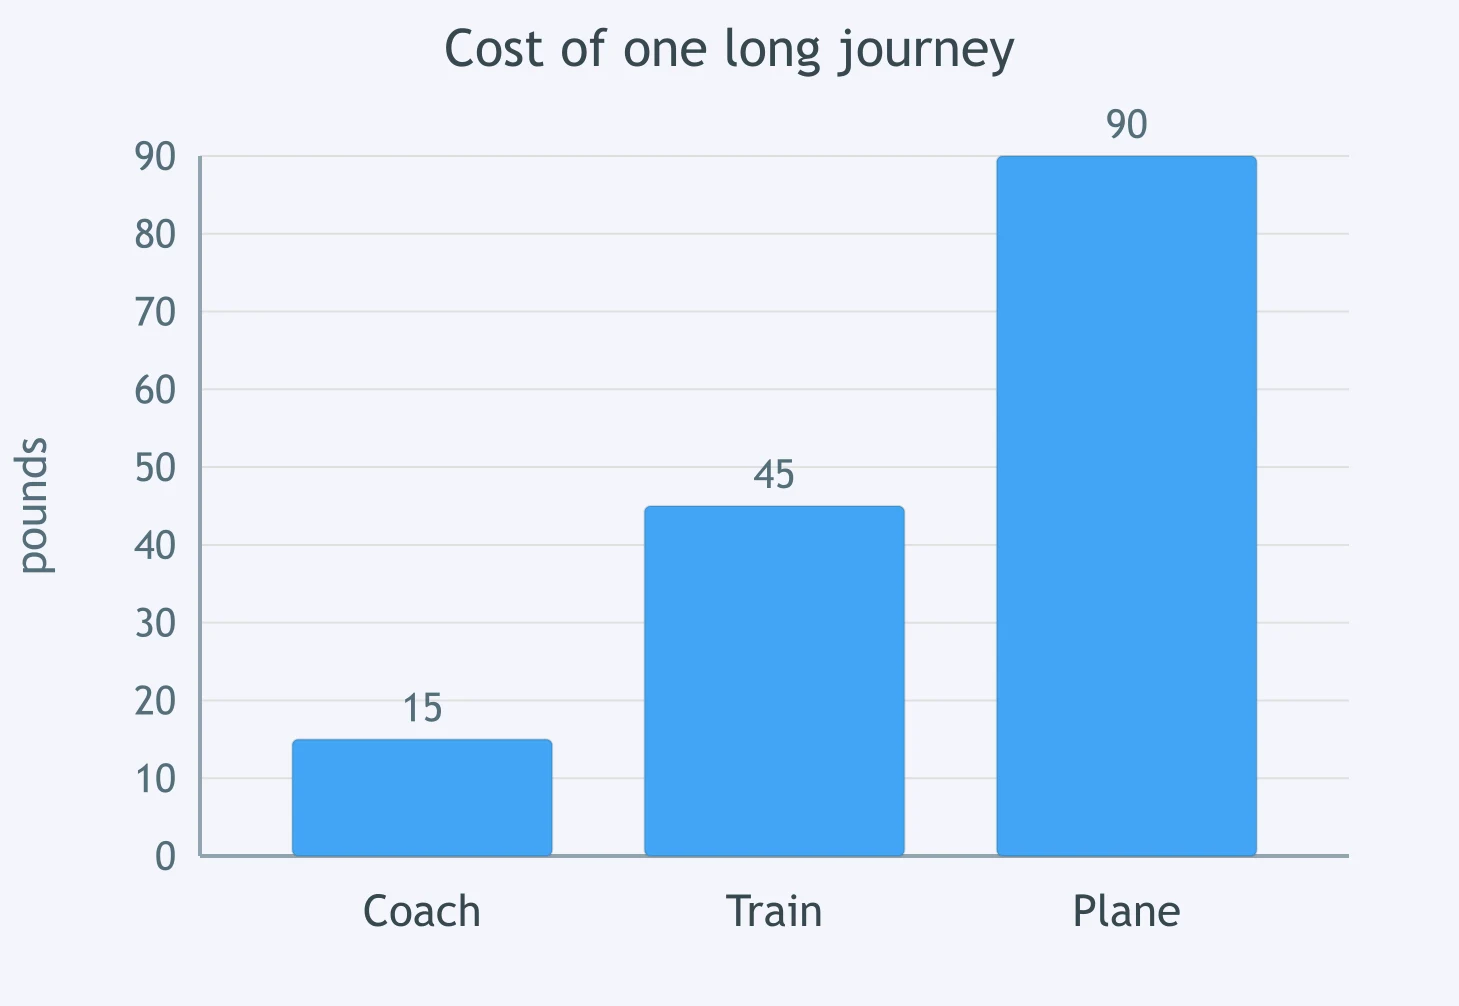
The chart shows the cost of one long journey. How did the train fare compare with the coach fare?
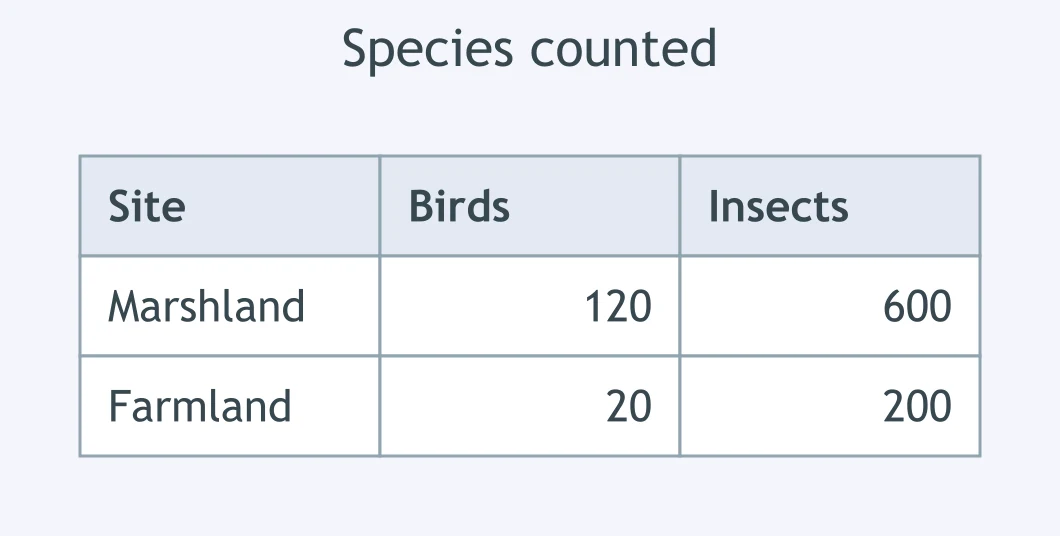
In the table of species counted, how did bird species in the marshland compare with insect species?
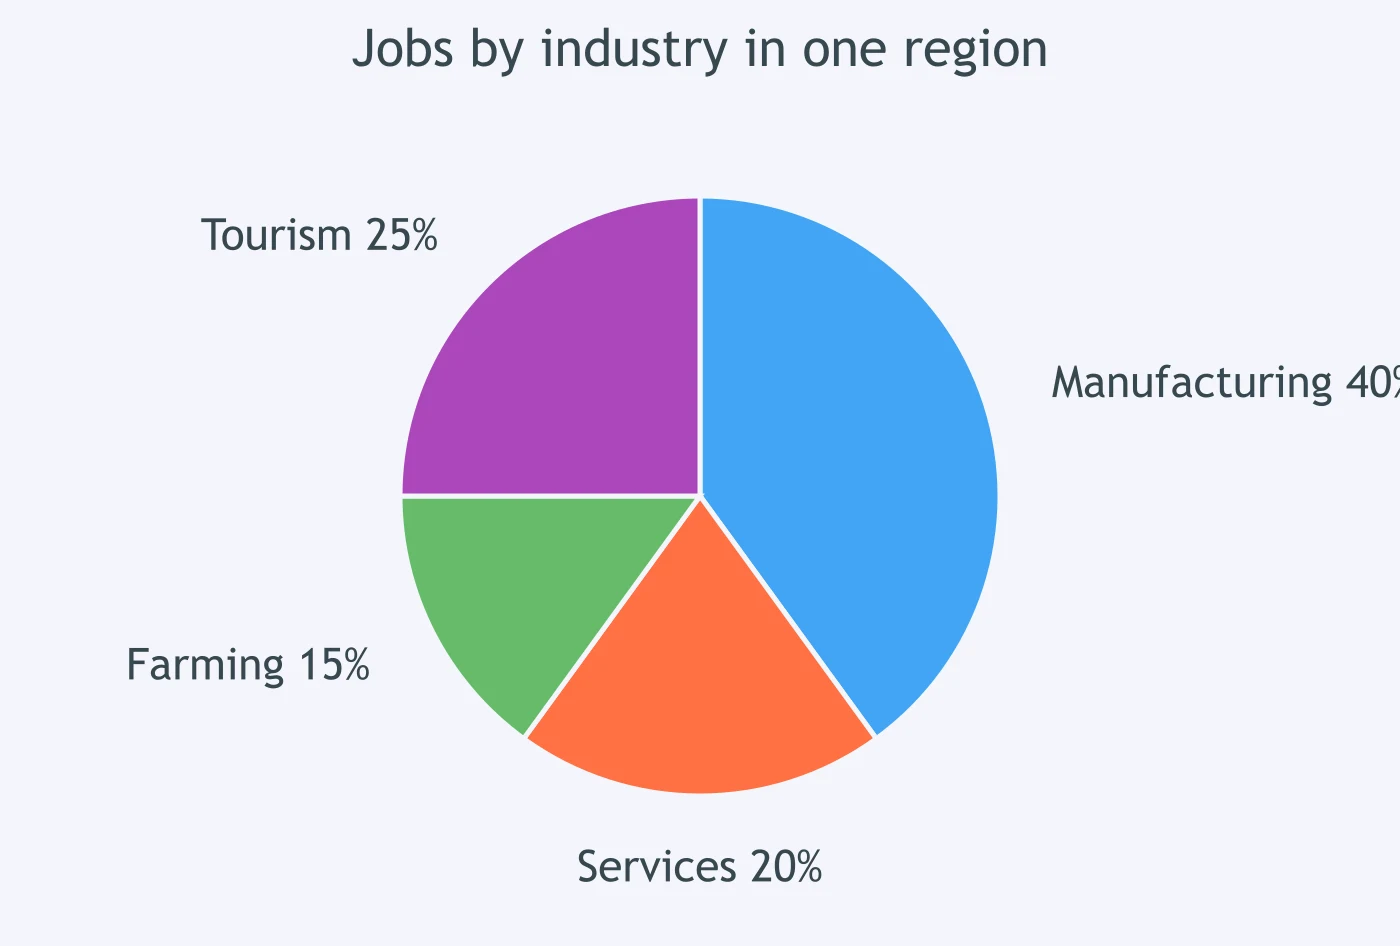
The pie chart shows jobs by industry in one region. Which comparison of services with manufacturing is correct?
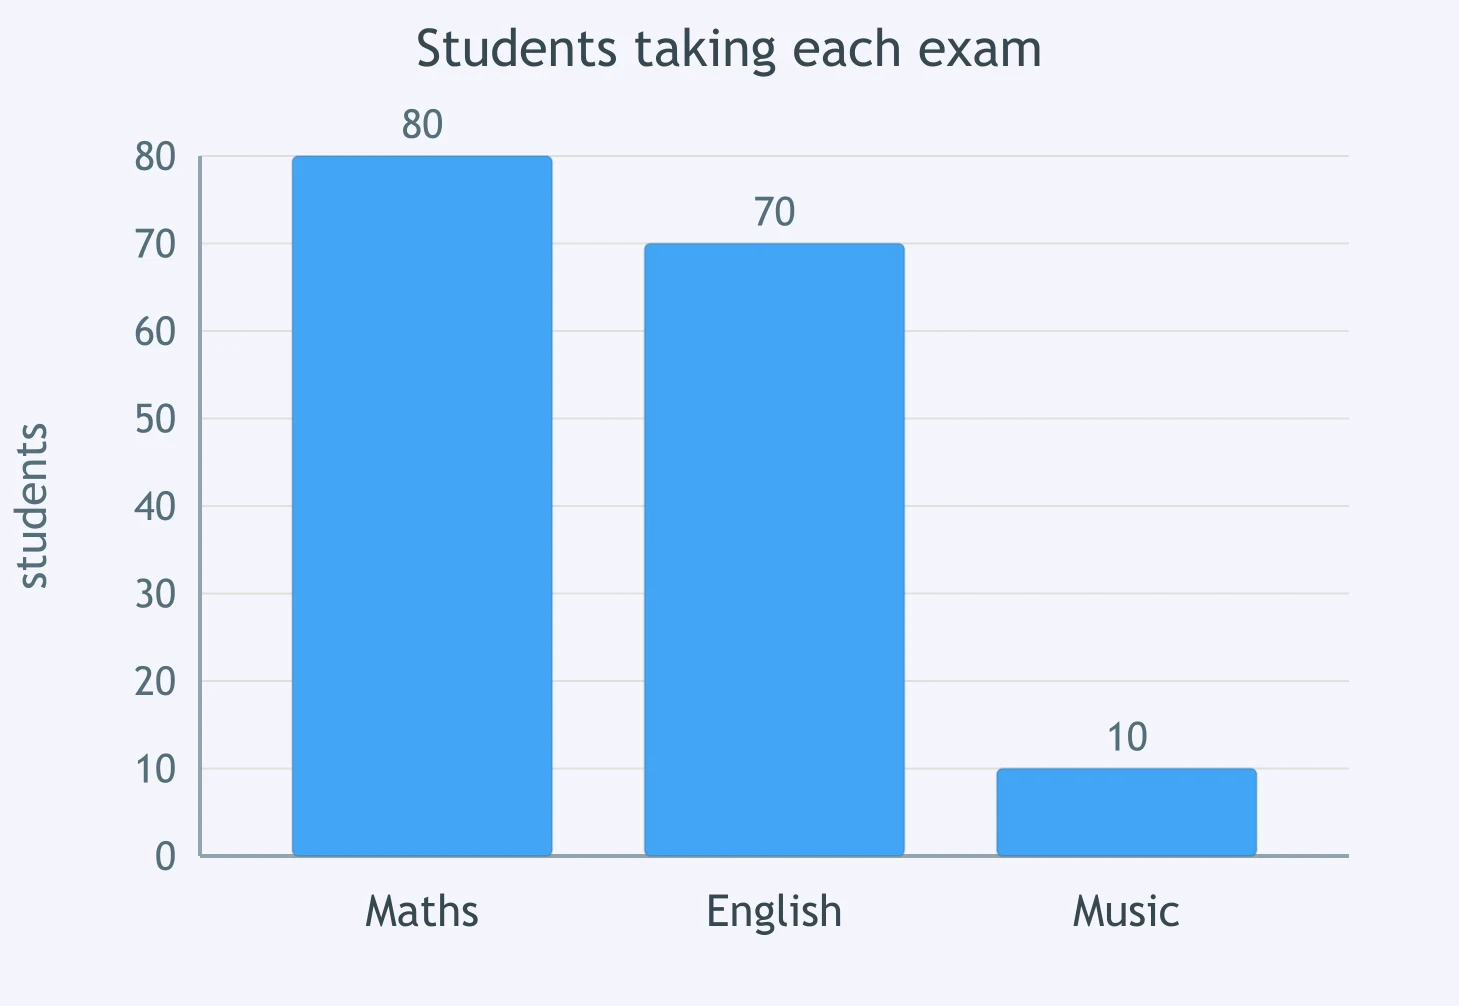
The bar chart shows students taking each exam. How did music compare with maths?
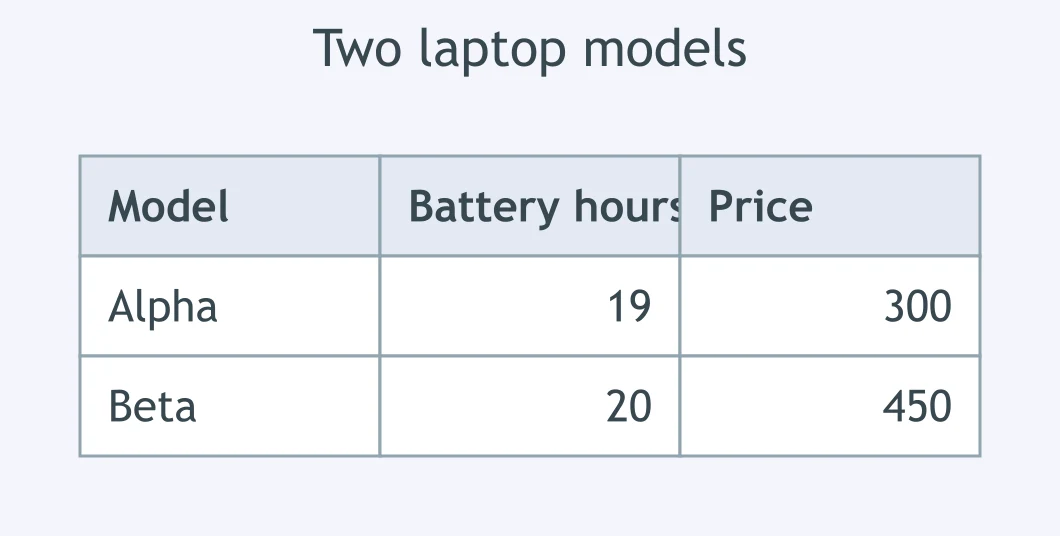
In the table of laptop models, how did battery life on the Alpha compare with the Beta?
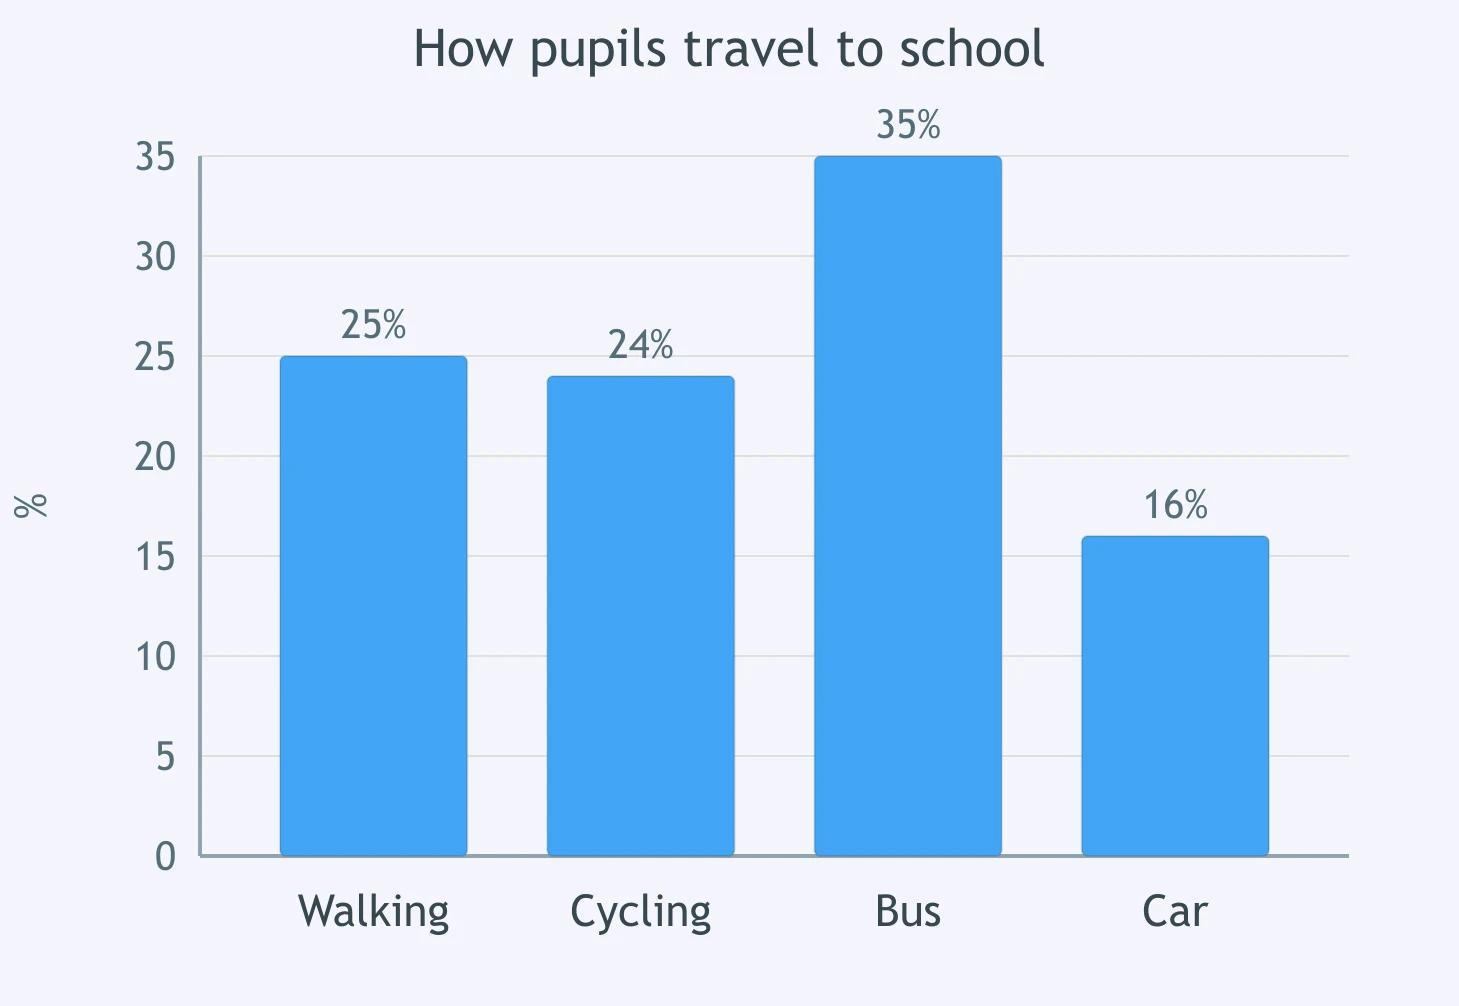
The chart shows how pupils travel to school. Which comparison of walking with cycling is correct?
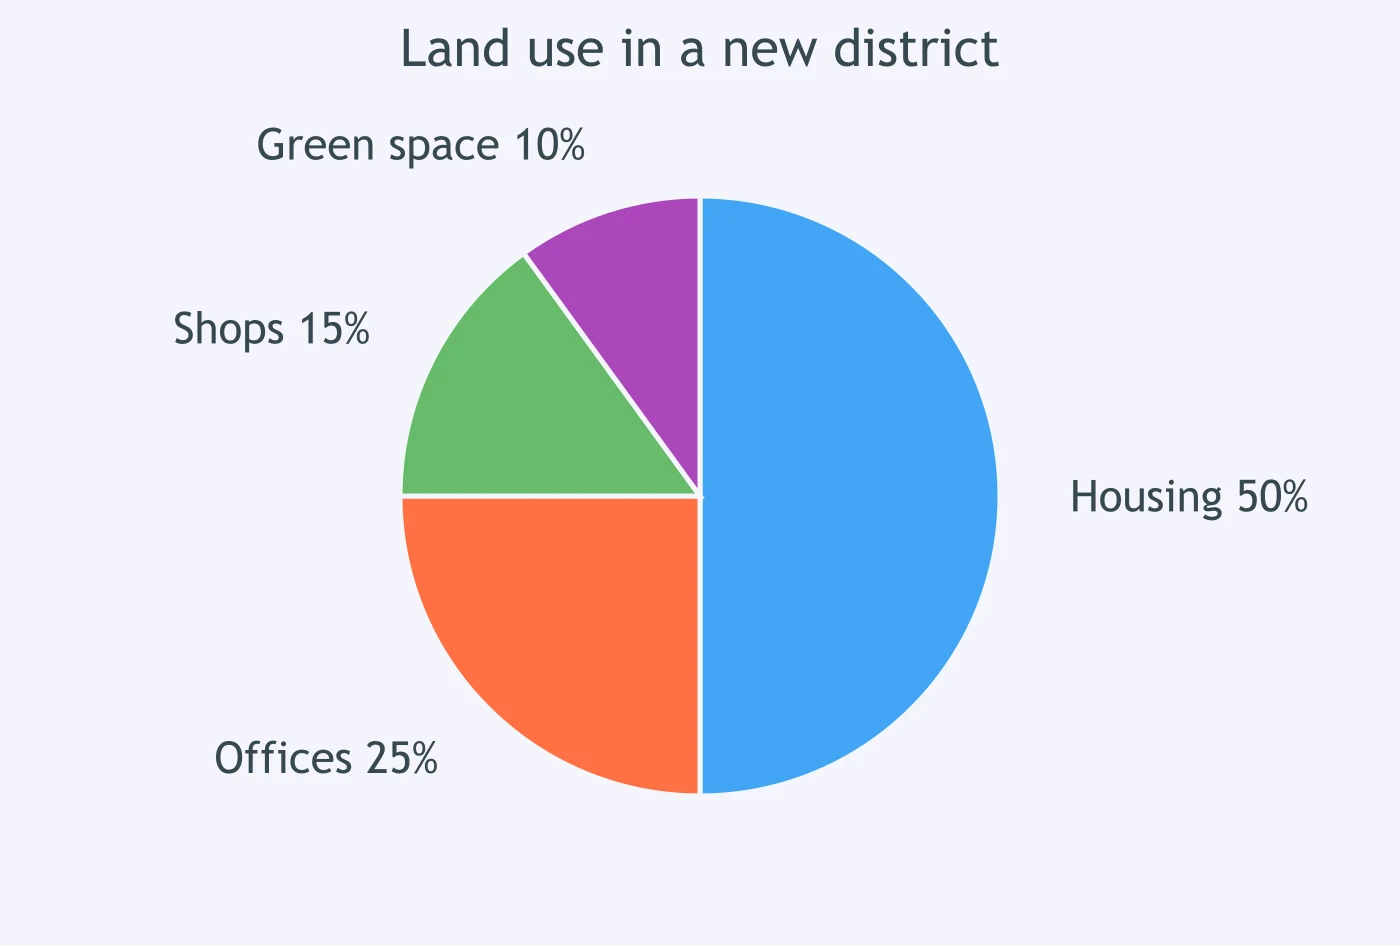
The pie chart shows land use in a new district. How did housing compare with offices?
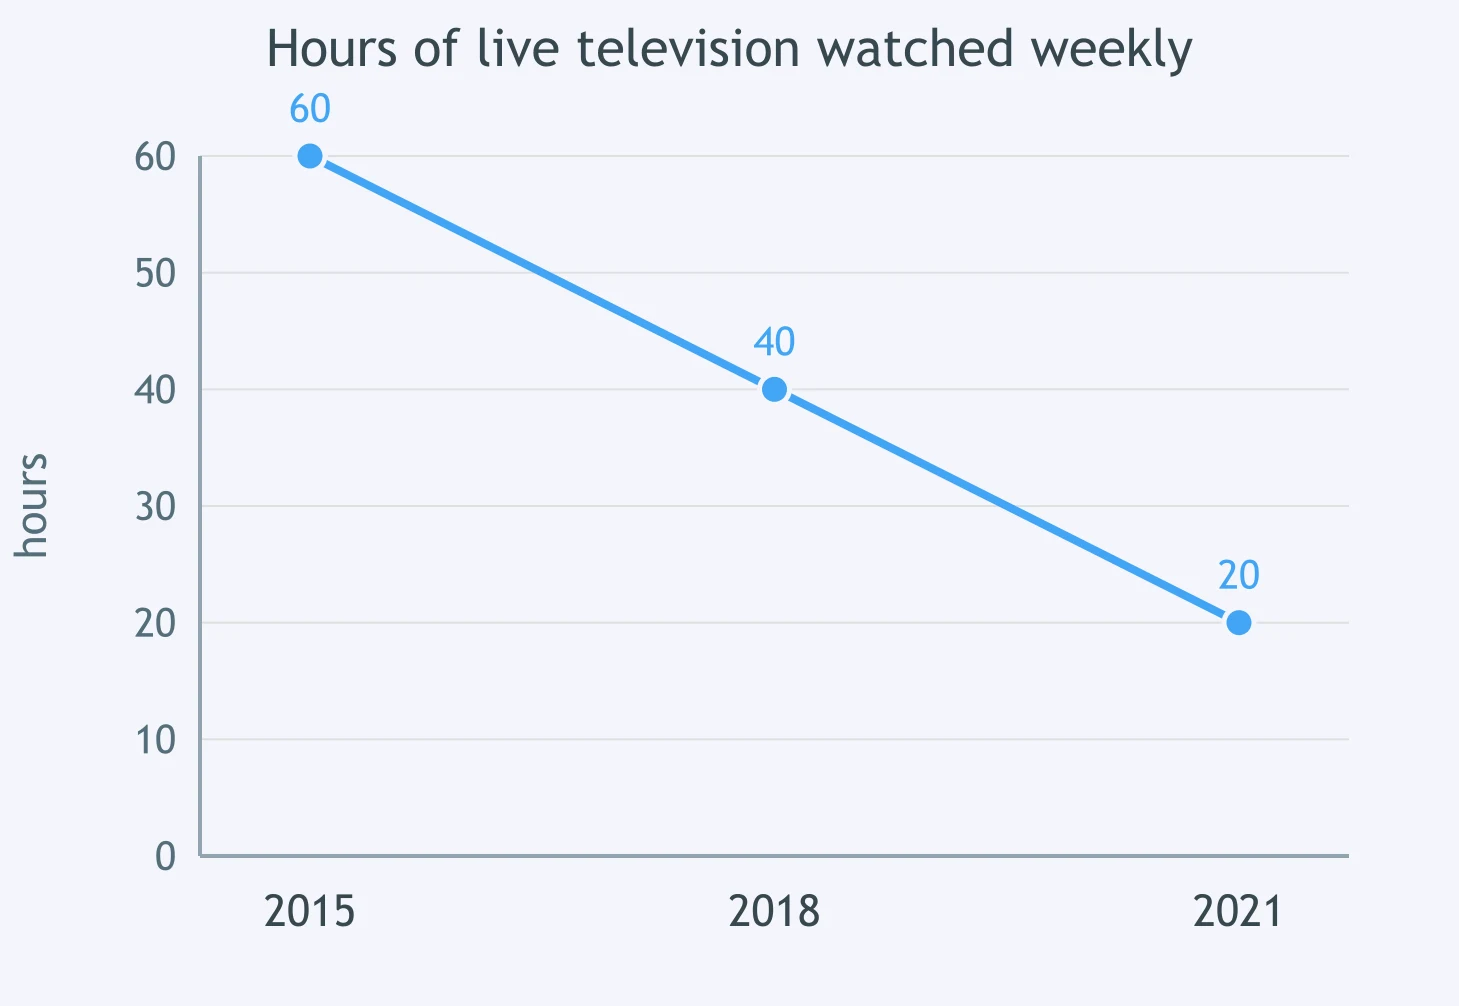
The graph shows weekly hours of live television watched. How did 2021 compare with 2015?
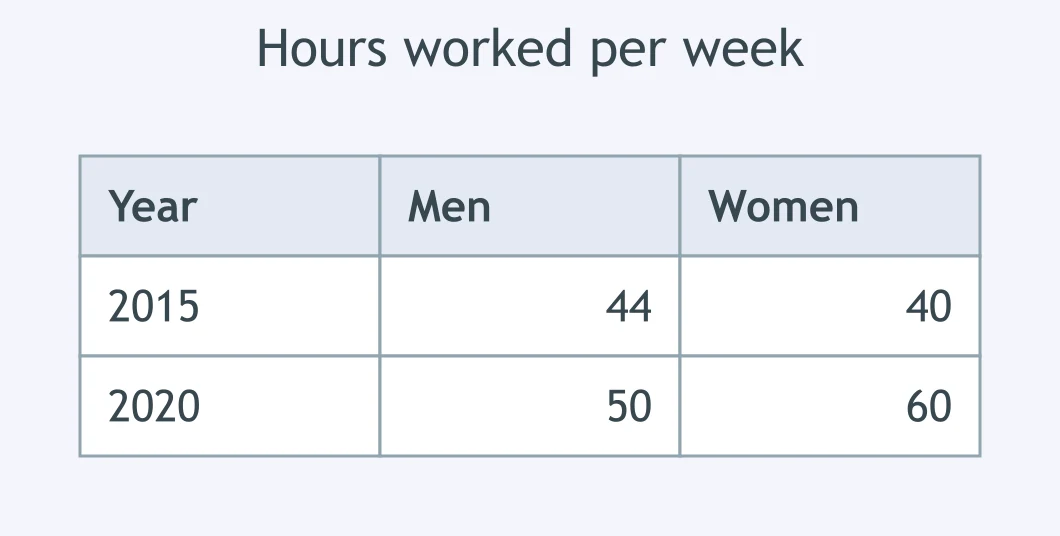
In the table of hours worked, how did men compare with women in 2015?
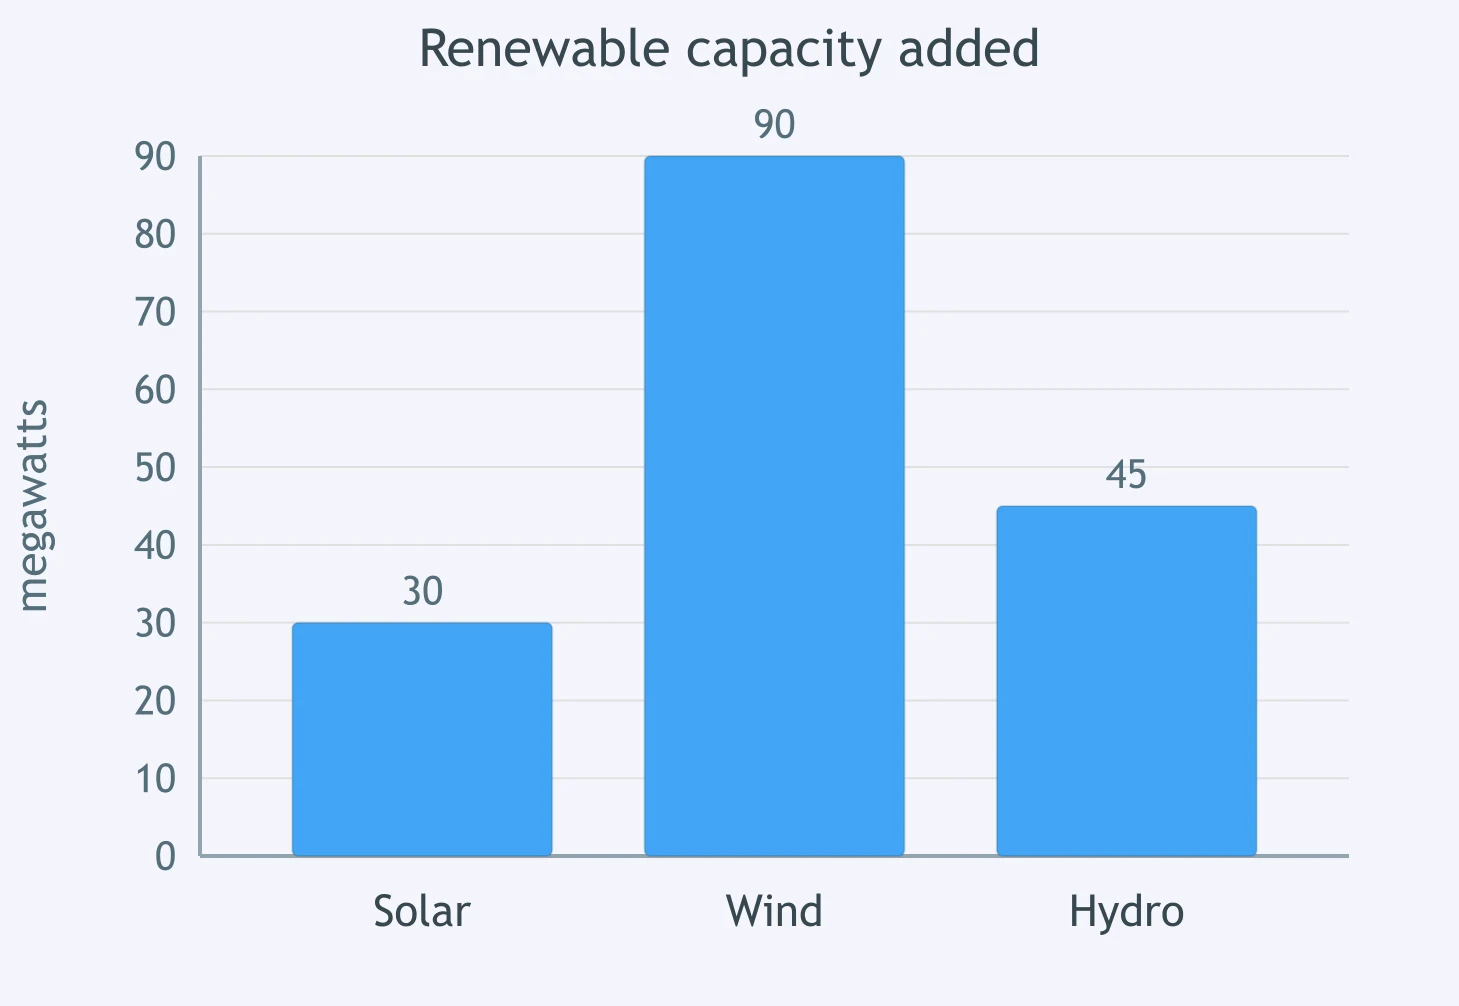
The bar chart shows renewable capacity added. How did wind compare with solar?

Reading a Line Graph - IELTS 5.0 W T1
30 questions
Reading a Pie Chart: Simple Proportions - IELTS 5.0 W T1
30 questions
Describing a Table: Highest, Lowest, Most, Least - IELTS 5.0 W T1
30 questions
Describing Percentages - IELTS 5.0 W T1
40 questions
Up, Down or Flat: Basic Trend Verbs - IELTS 5.0 W T1
40 questions
Crack the passcode before the zombies get in.
Answer, then swat bugs for bonus points.
Race through questions at your own speed.
Same question on every screen. Fastest wins.

Pick a tile, answer, hit bonuses and steals.