Loading
by BlastRoom
IELTS Academic Writing Task 1. Choosing to, by, from or between to describe a change.
#writing_task_1#ielts_5_0
40 questions
One question set, multiple game modes. Tap any game to see it in action. Not sure which to pick?
Answer to place stones and capture territory.
Outrun the snow together.
Earn blasts, then hunt the other team.
Answer to earn energy, then climb.

The class blasts through walls together.
Bid on mystery lots. Most money wins.
Sell tours. Nice, standard, or a total scam.

Answer, restock, and serve the rush.
More correct answers pulls the rope your way.
Answer, then shoot down the alien wave.
Answer, then tap to leap the frozen ridge.
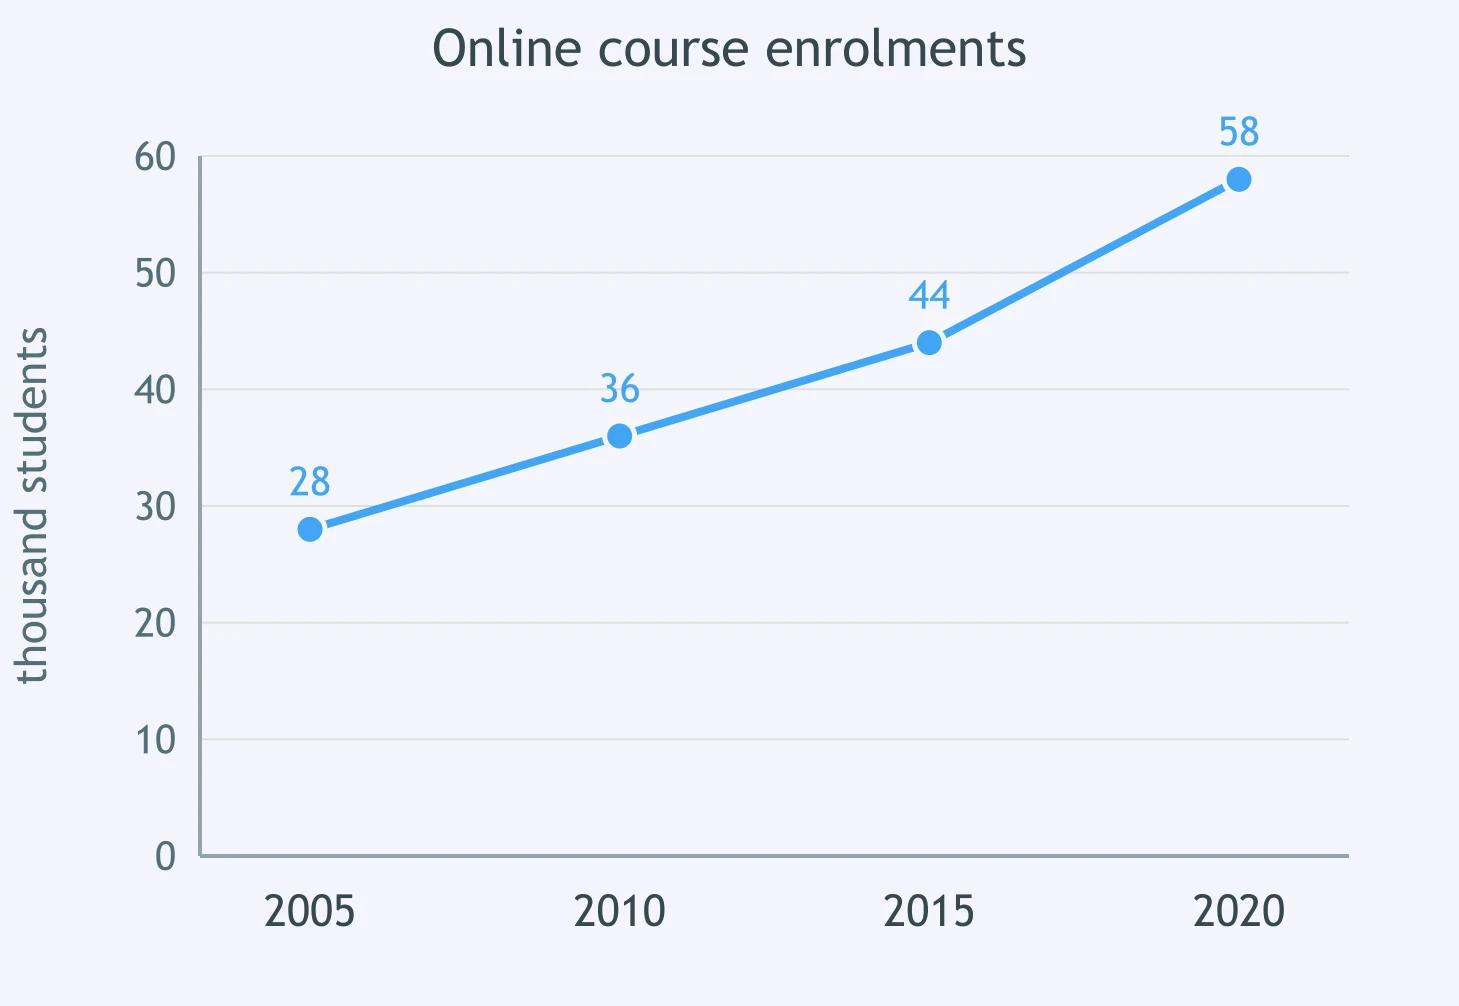
Study the line chart for online course enrolments. Complete: Enrolments climbed ___ 58 thousand in 2020.
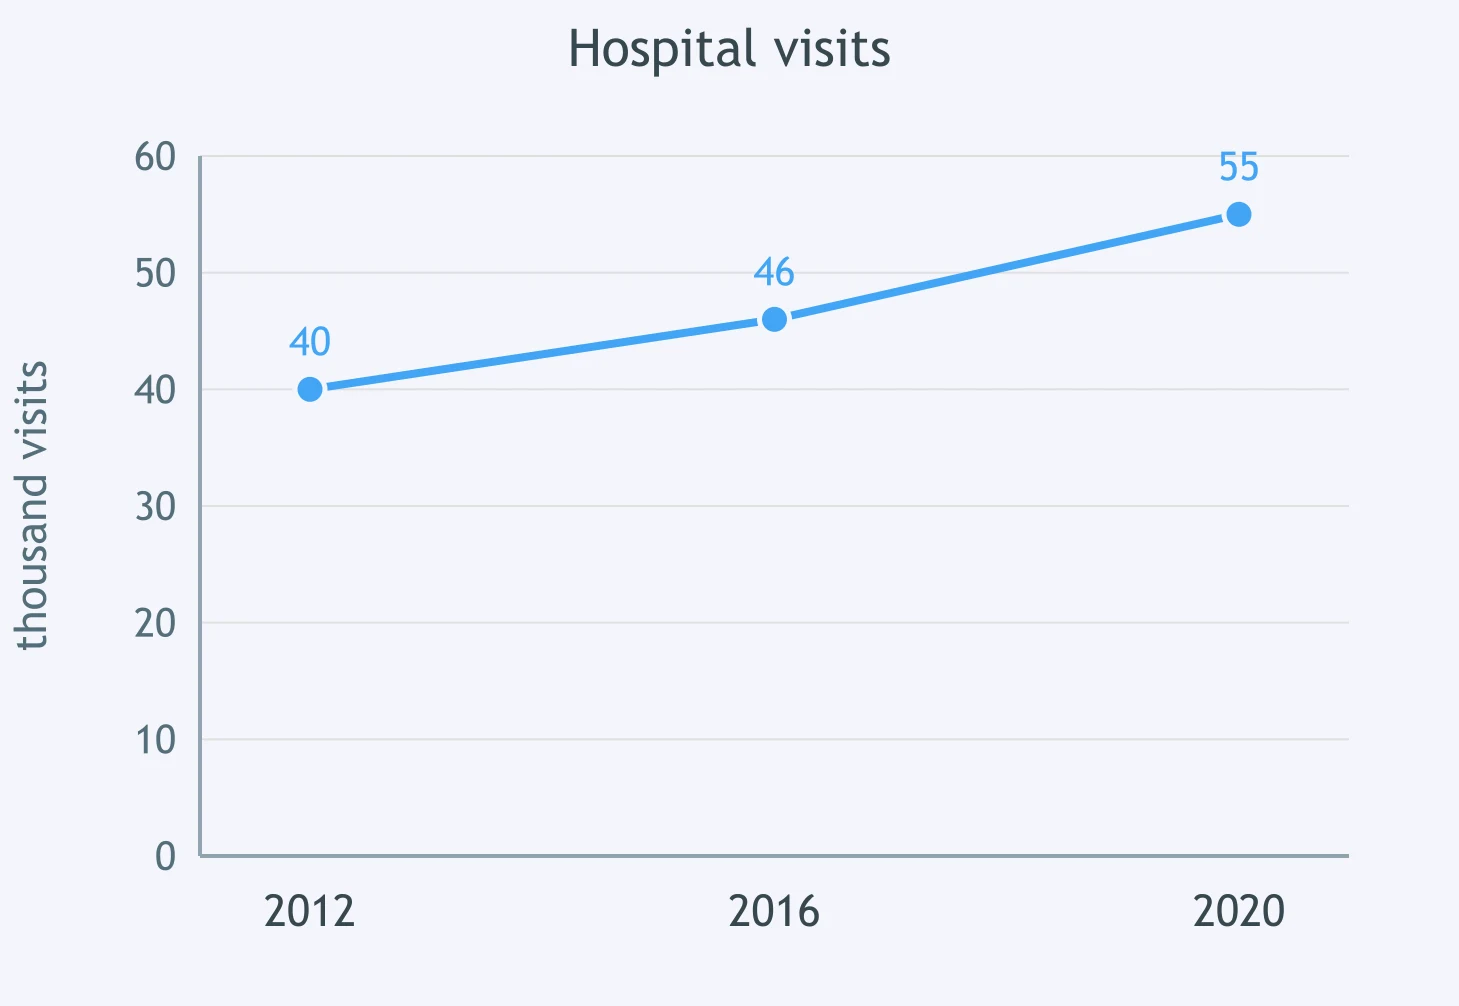
The line graph reports hospital visits. Choose the missing preposition: Visits increased ___ 15 thousand over the whole period.
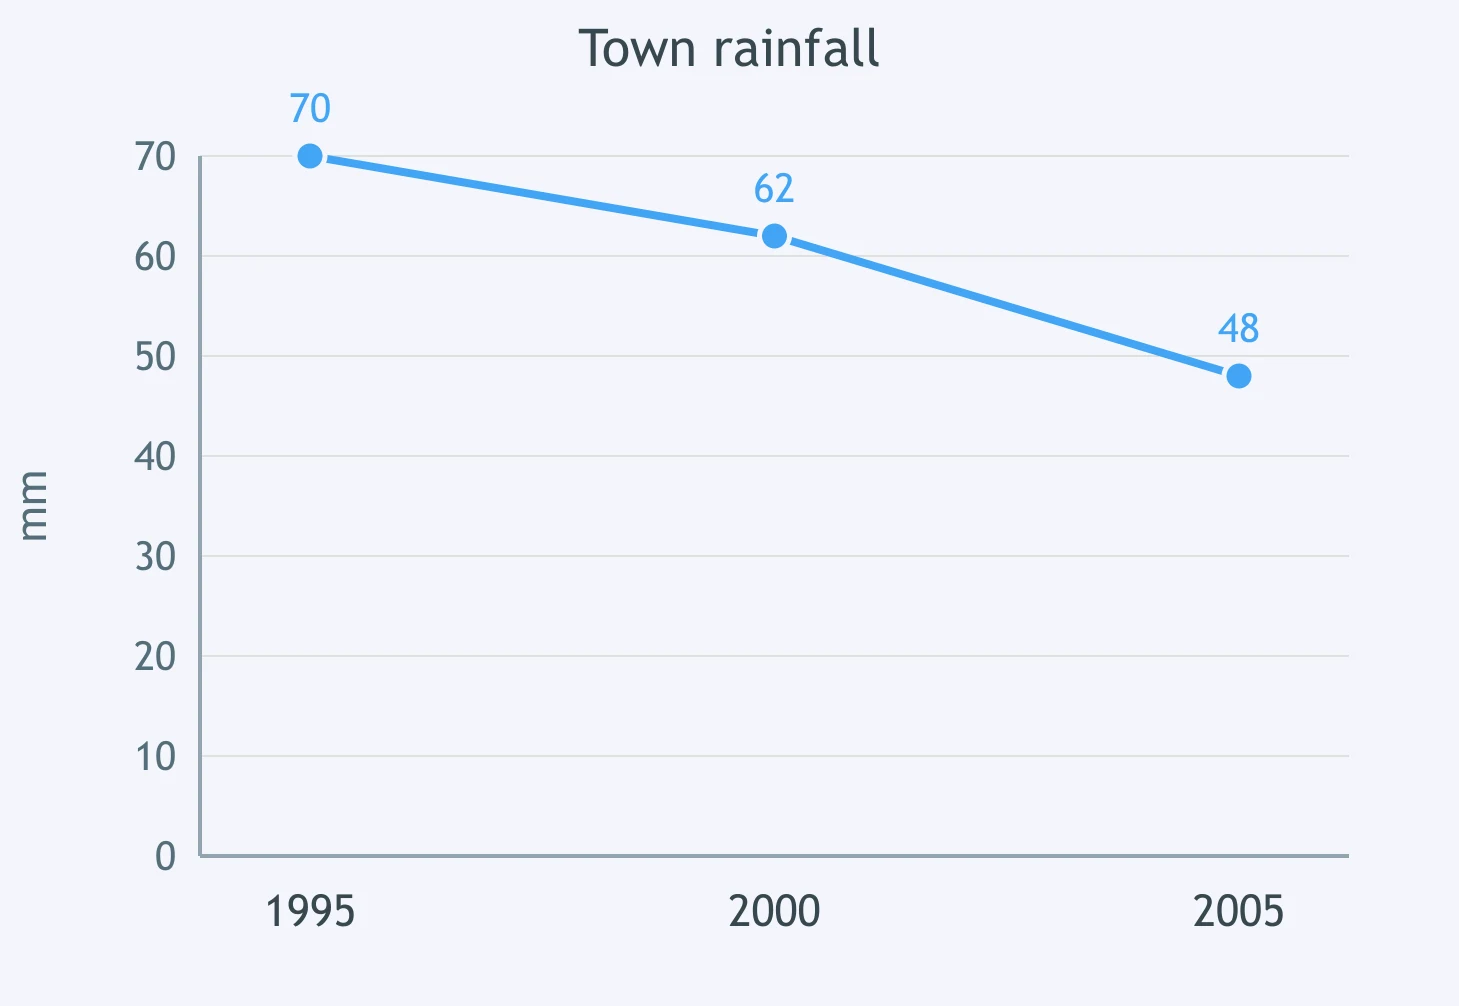
Use the rainfall figure. Fill the blank: Rainfall dropped steadily ___ 1995 to 2005.
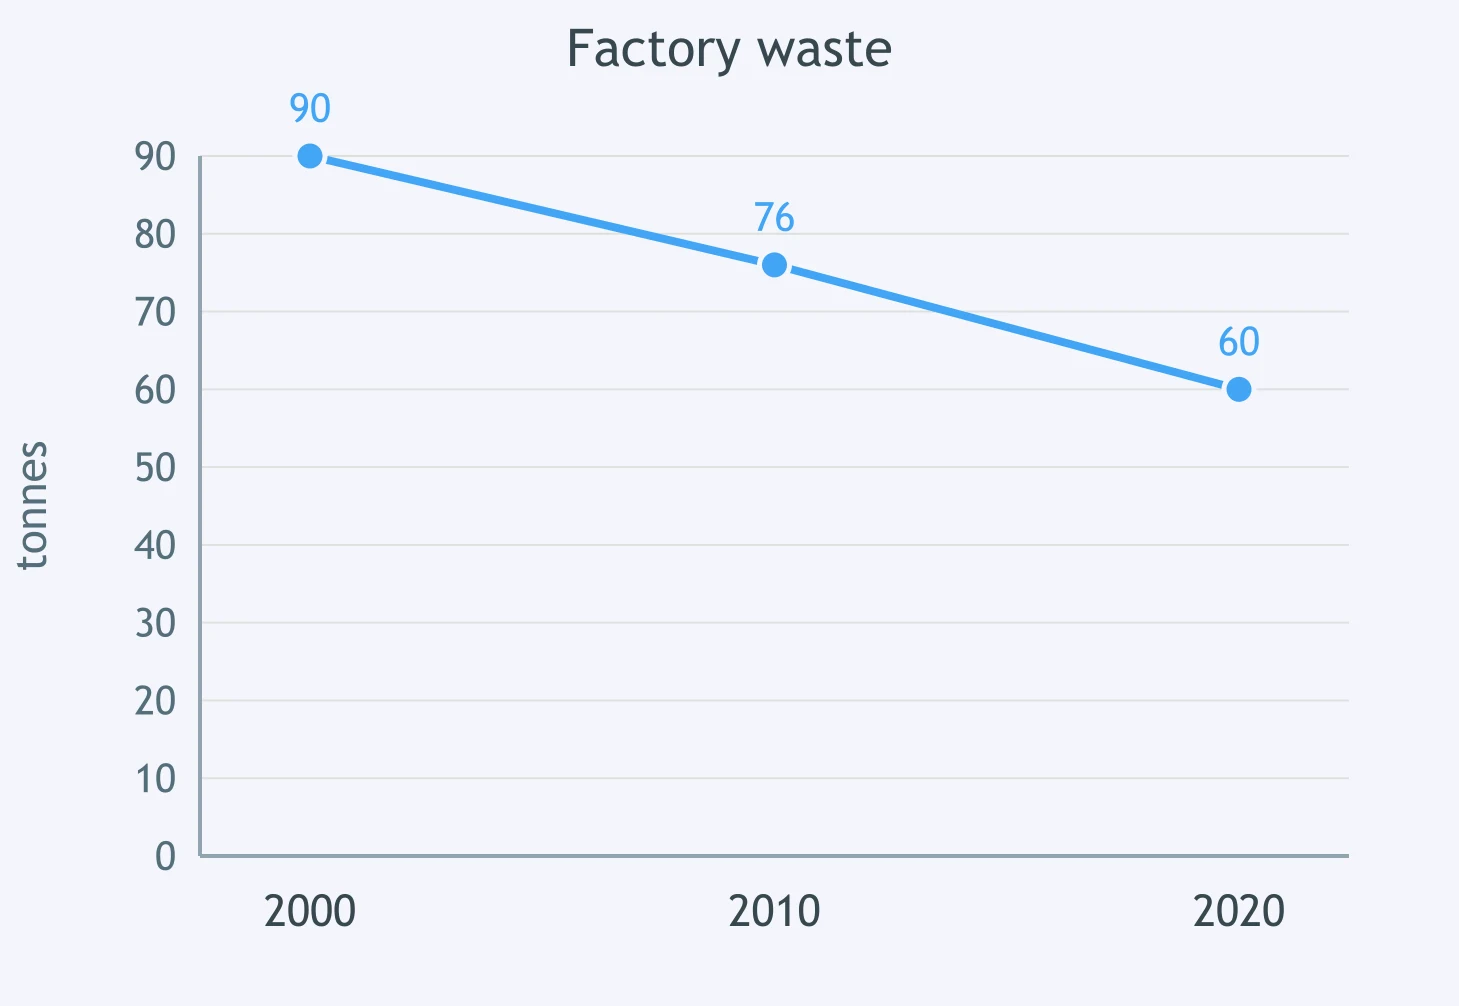
According to the factory waste chart, waste declined sharply ___ 2000 and 2020. Which preposition fits?
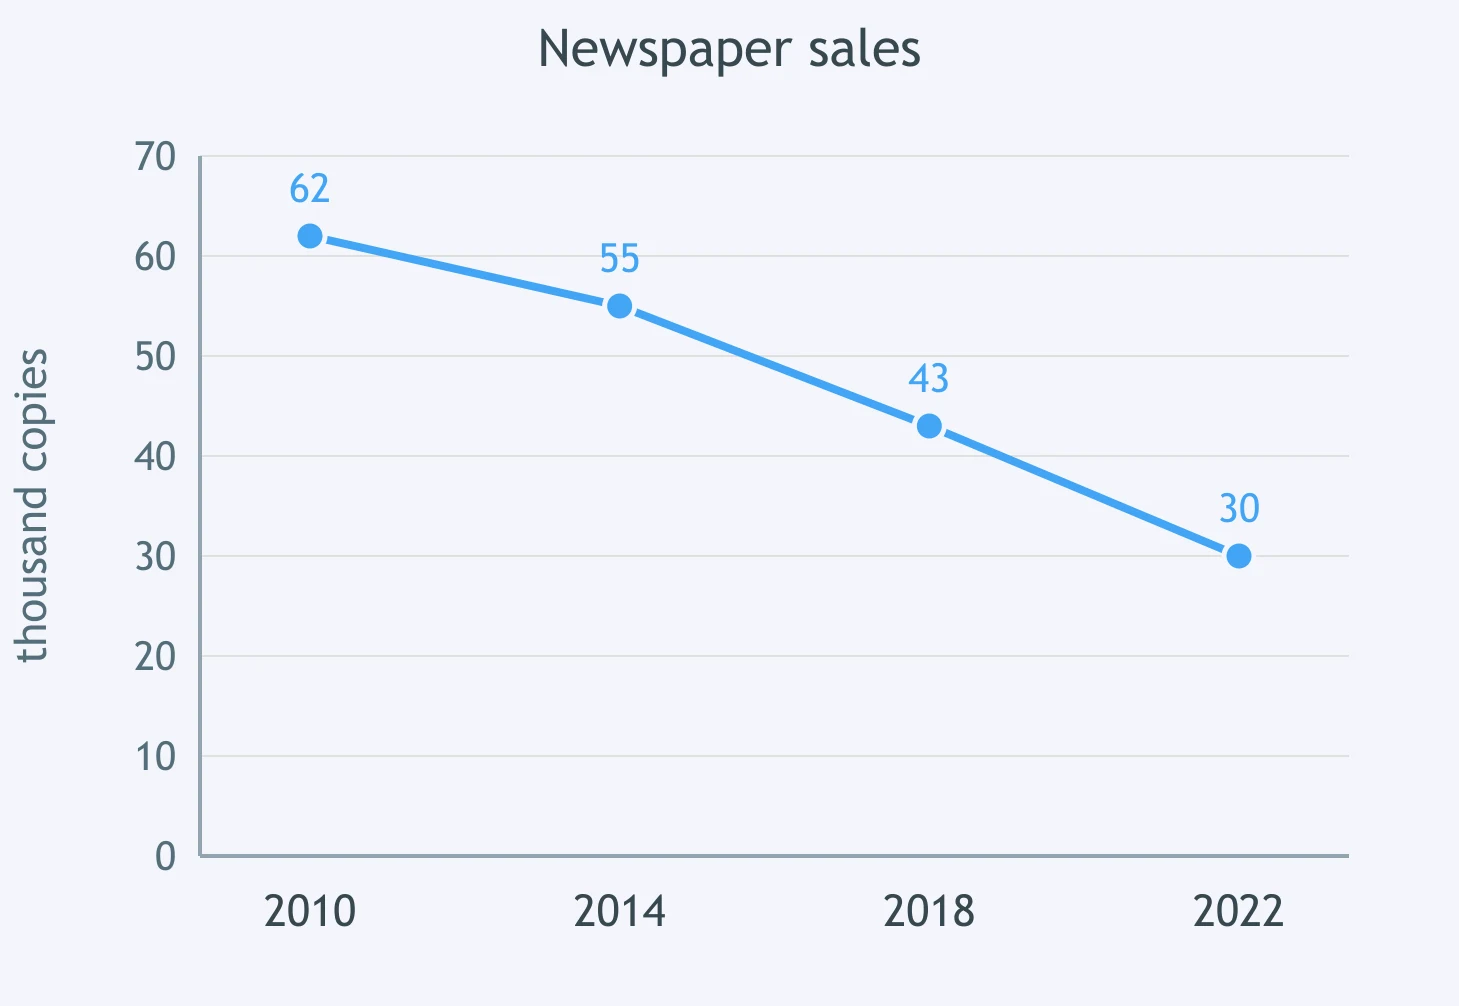
Look at the chart of newspaper sales. Complete the sentence: Sales fell ___ 30 thousand copies in 2022.
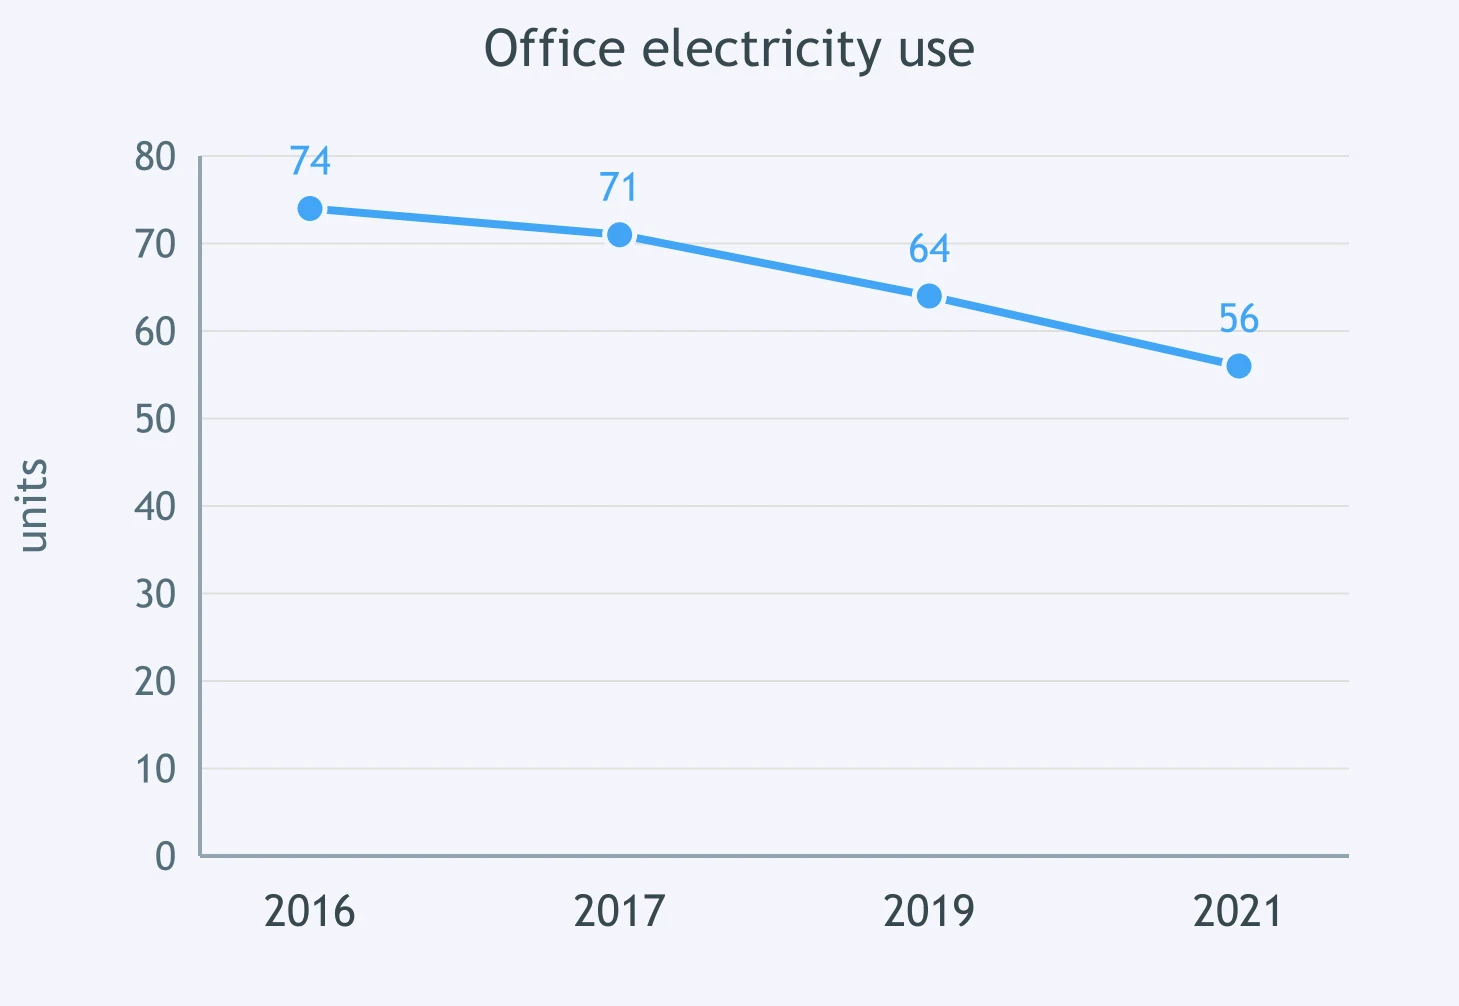
The chart tracks office electricity use. Select the answer: Use dropped ___ 18 units from 2016 to 2021.
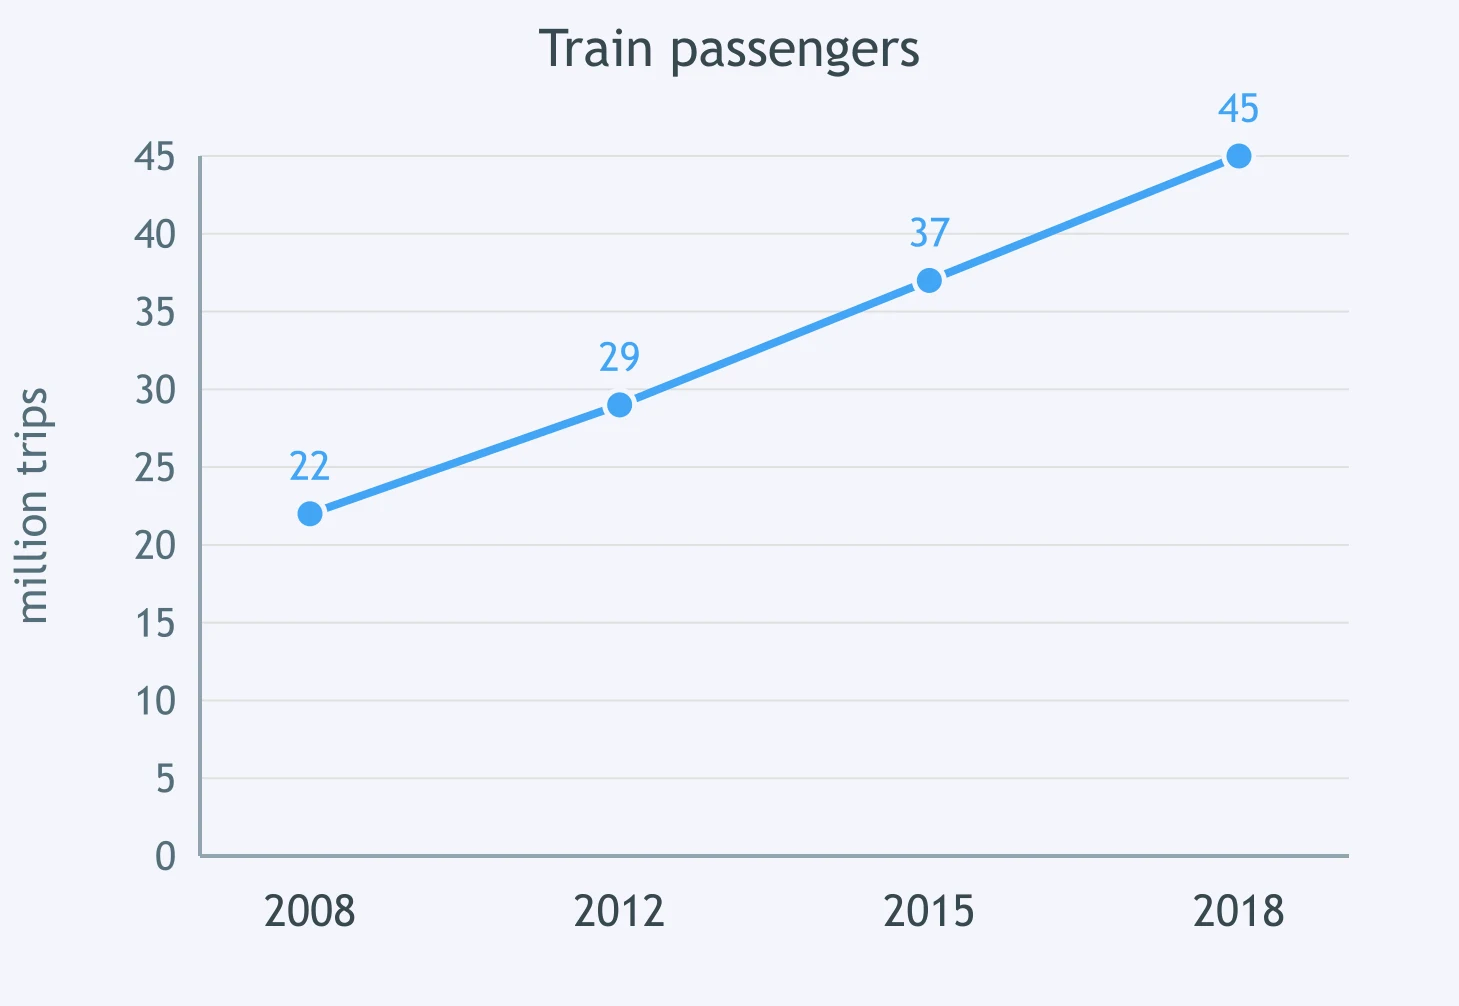
Check the train passenger chart. Complete: Passenger numbers rose ___ 2008 to 2018.
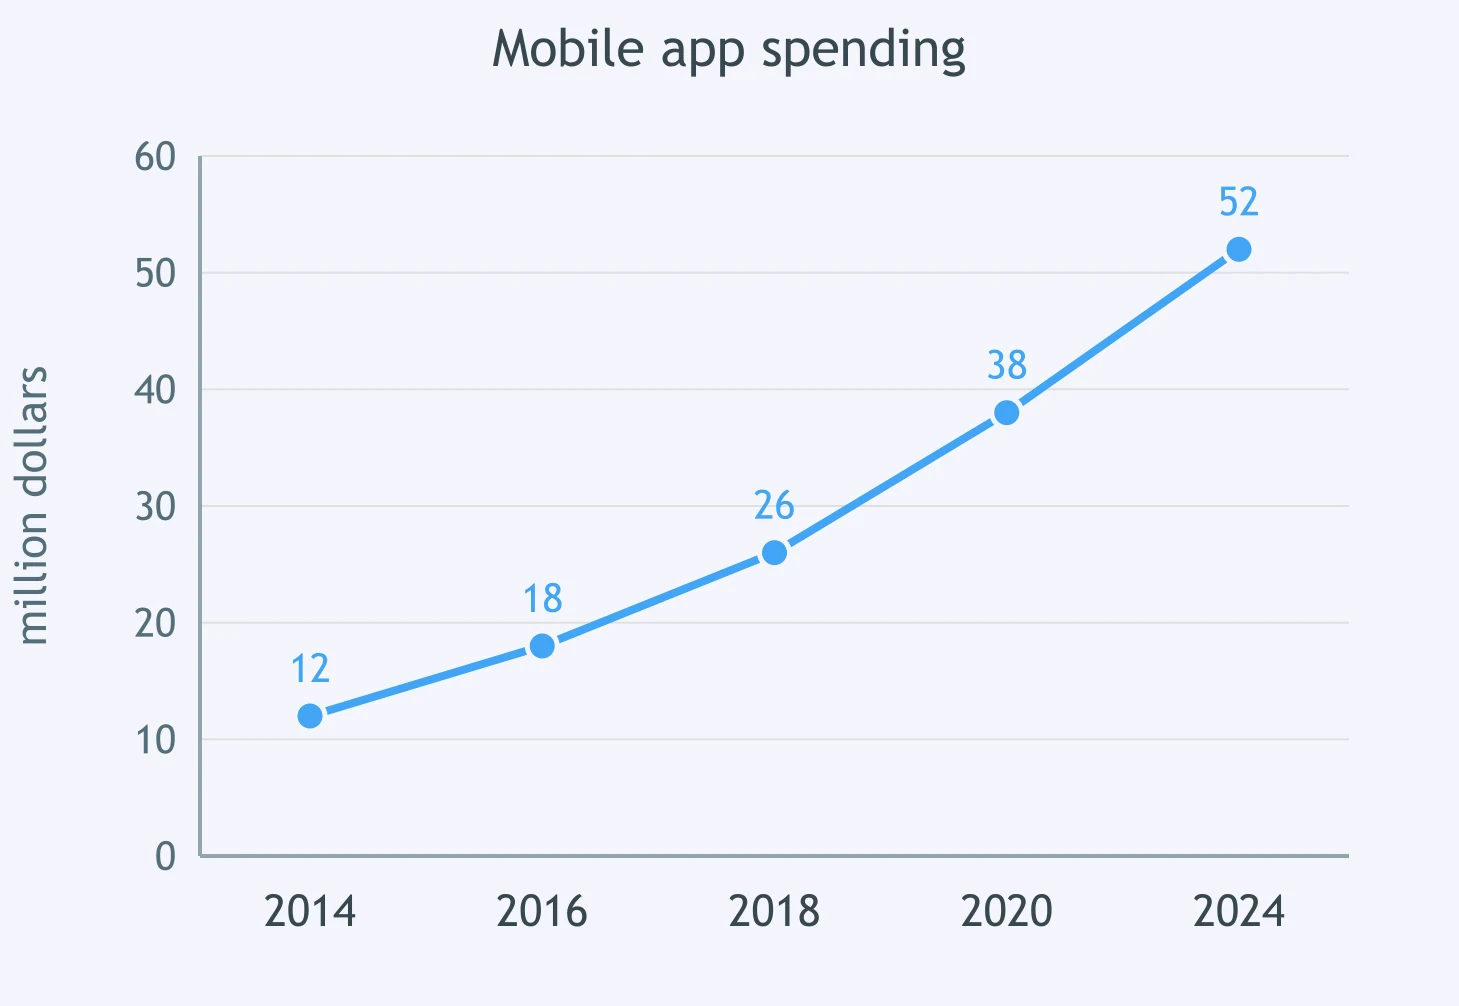
The chart shows spending on mobile apps. Spending grew quickly ___ 2014 and 2024. Choose the preposition.
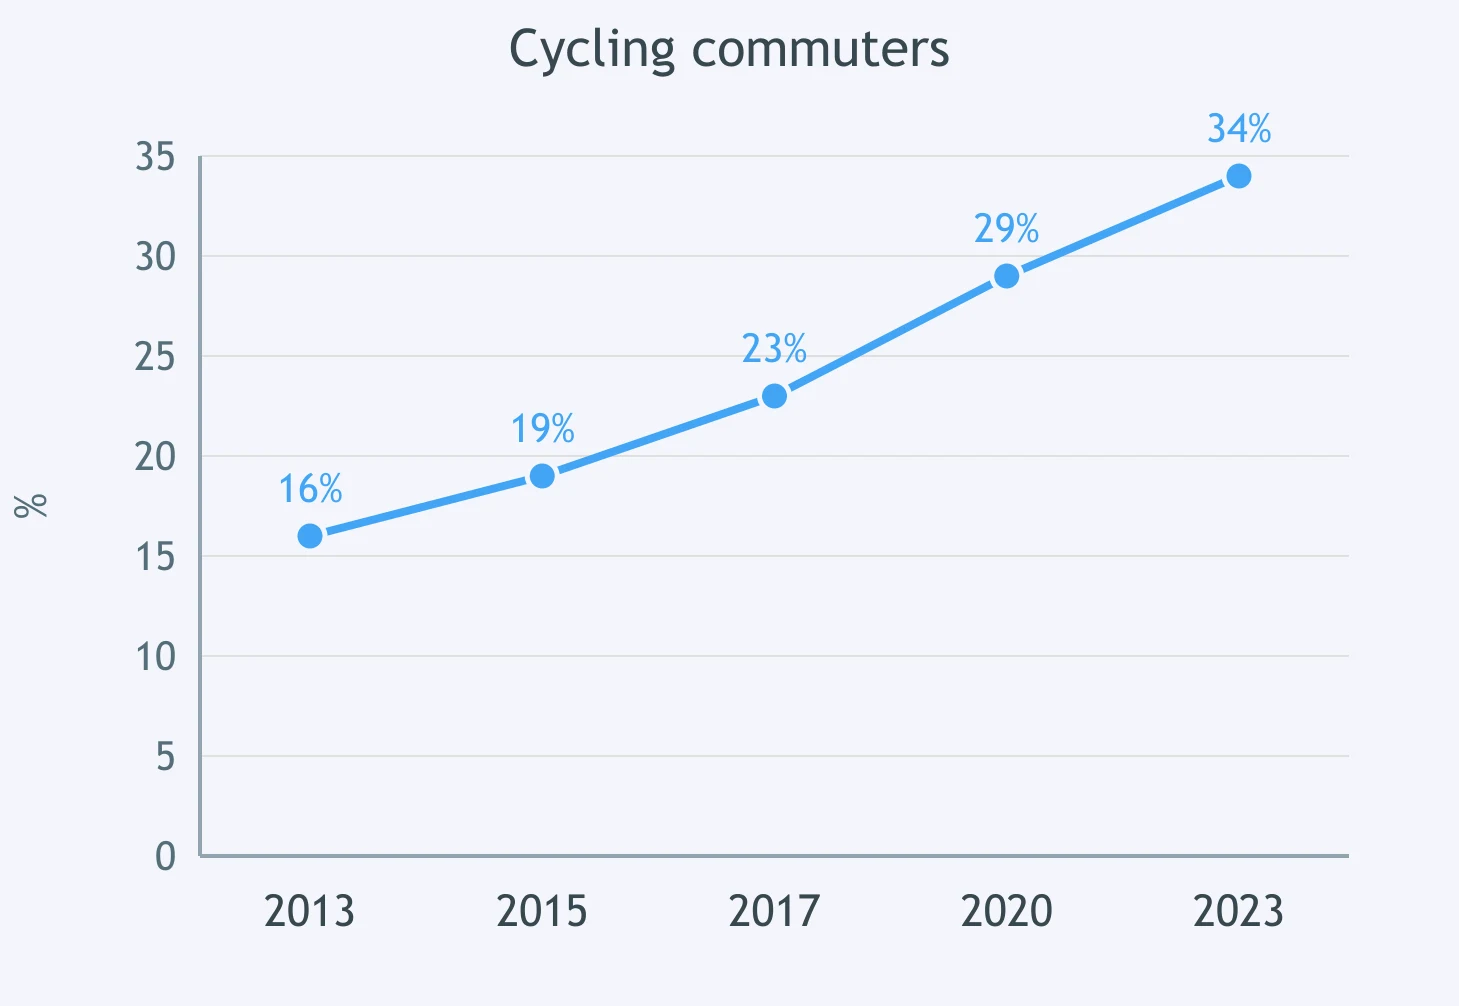
In the cycling chart, the share of commuters rose ___ 34% by 2023. Fill the blank.
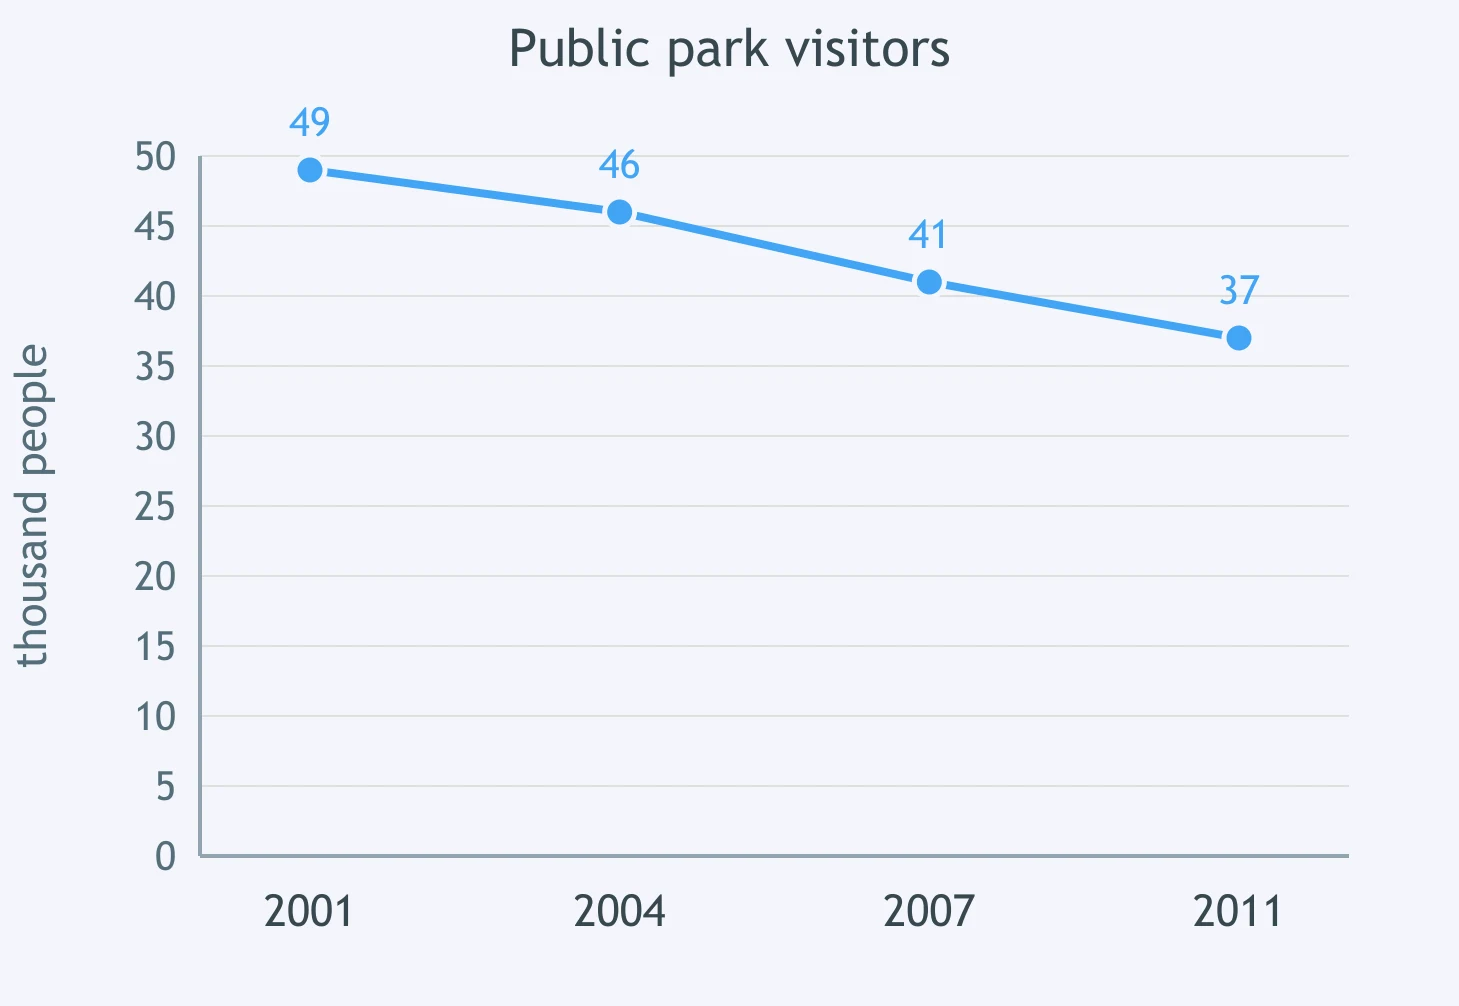
Use the chart on public park visitors. Complete: Visitor numbers fell ___ 12 thousand during the period.
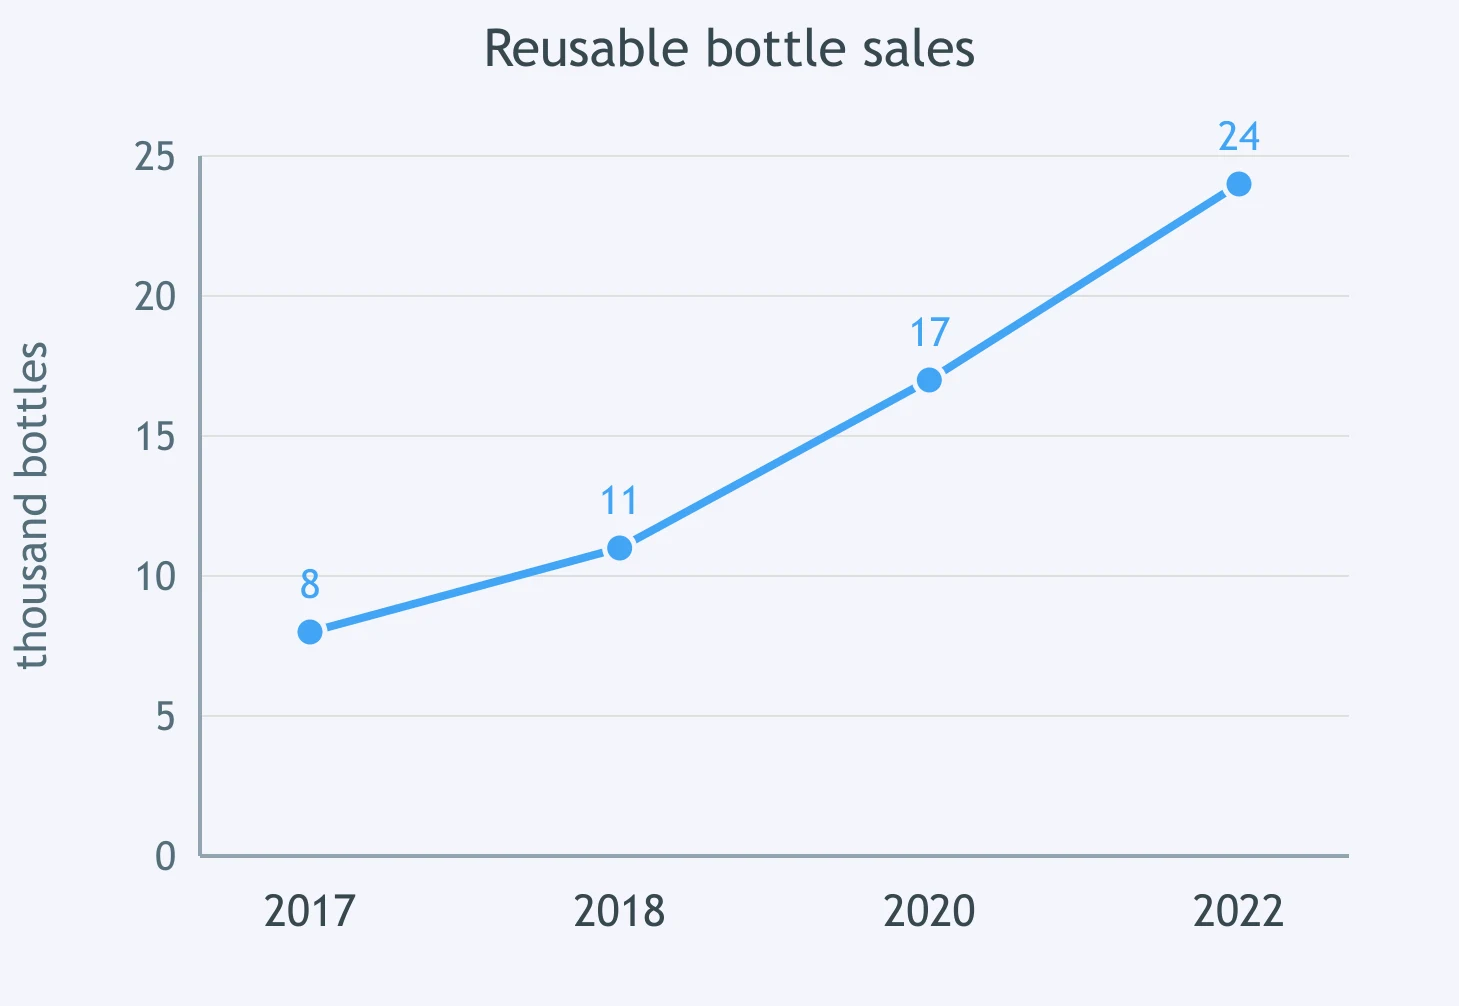
The chart gives sales of reusable bottles. Complete the trend sentence: Sales climbed ___ 2017 to 2022.
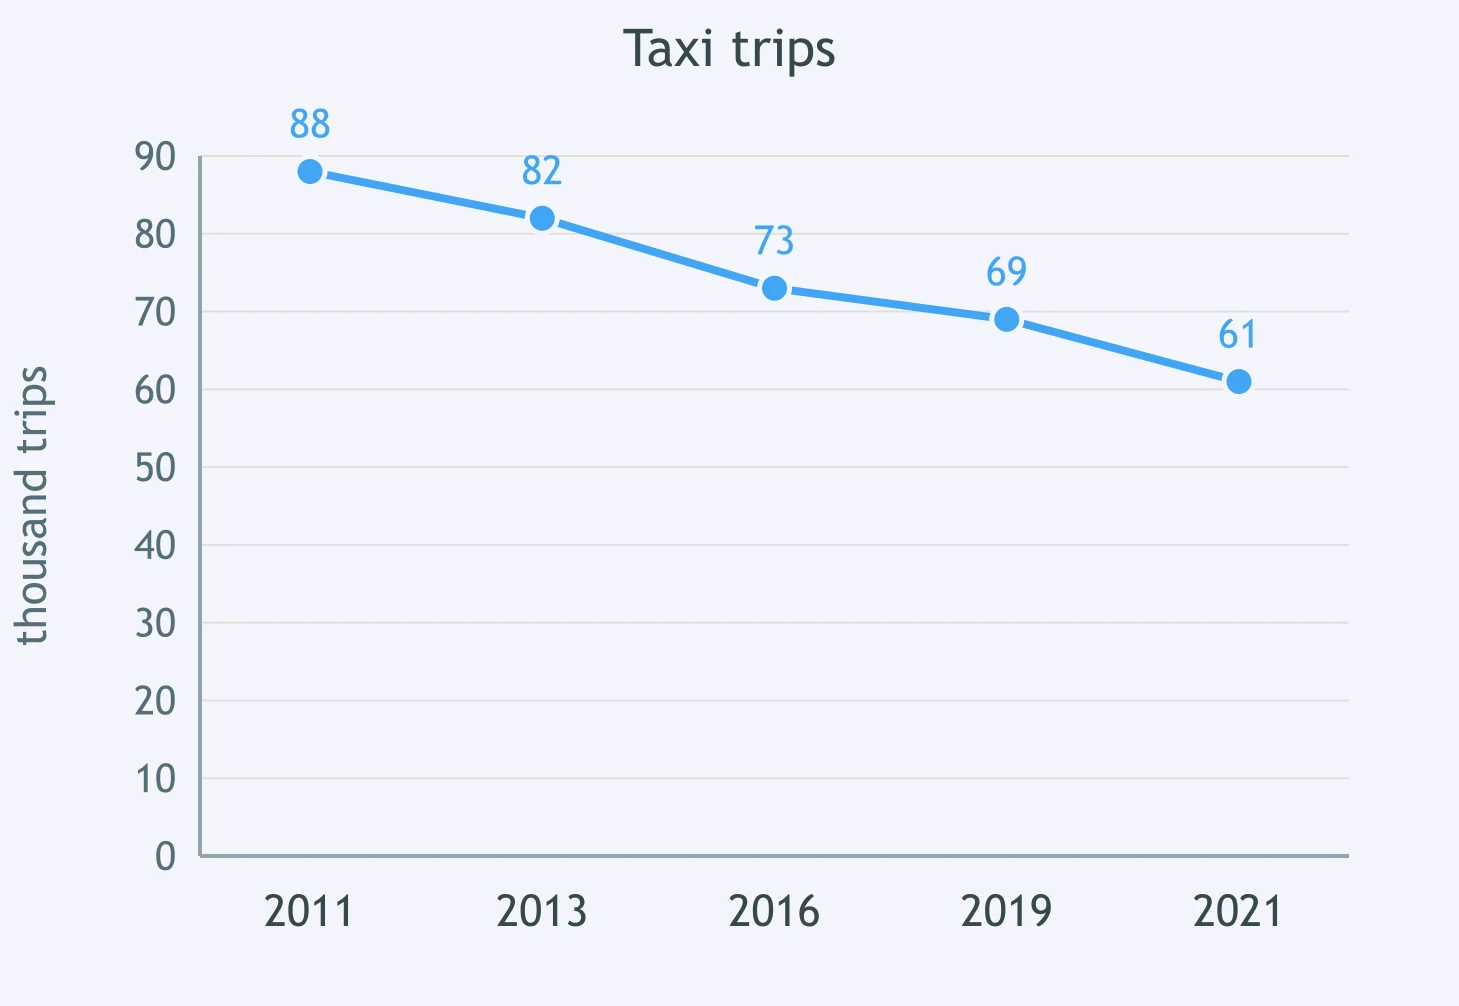
Look at the chart for taxi trips. Taxi use declined gradually ___ 2011 and 2021. What is missing?
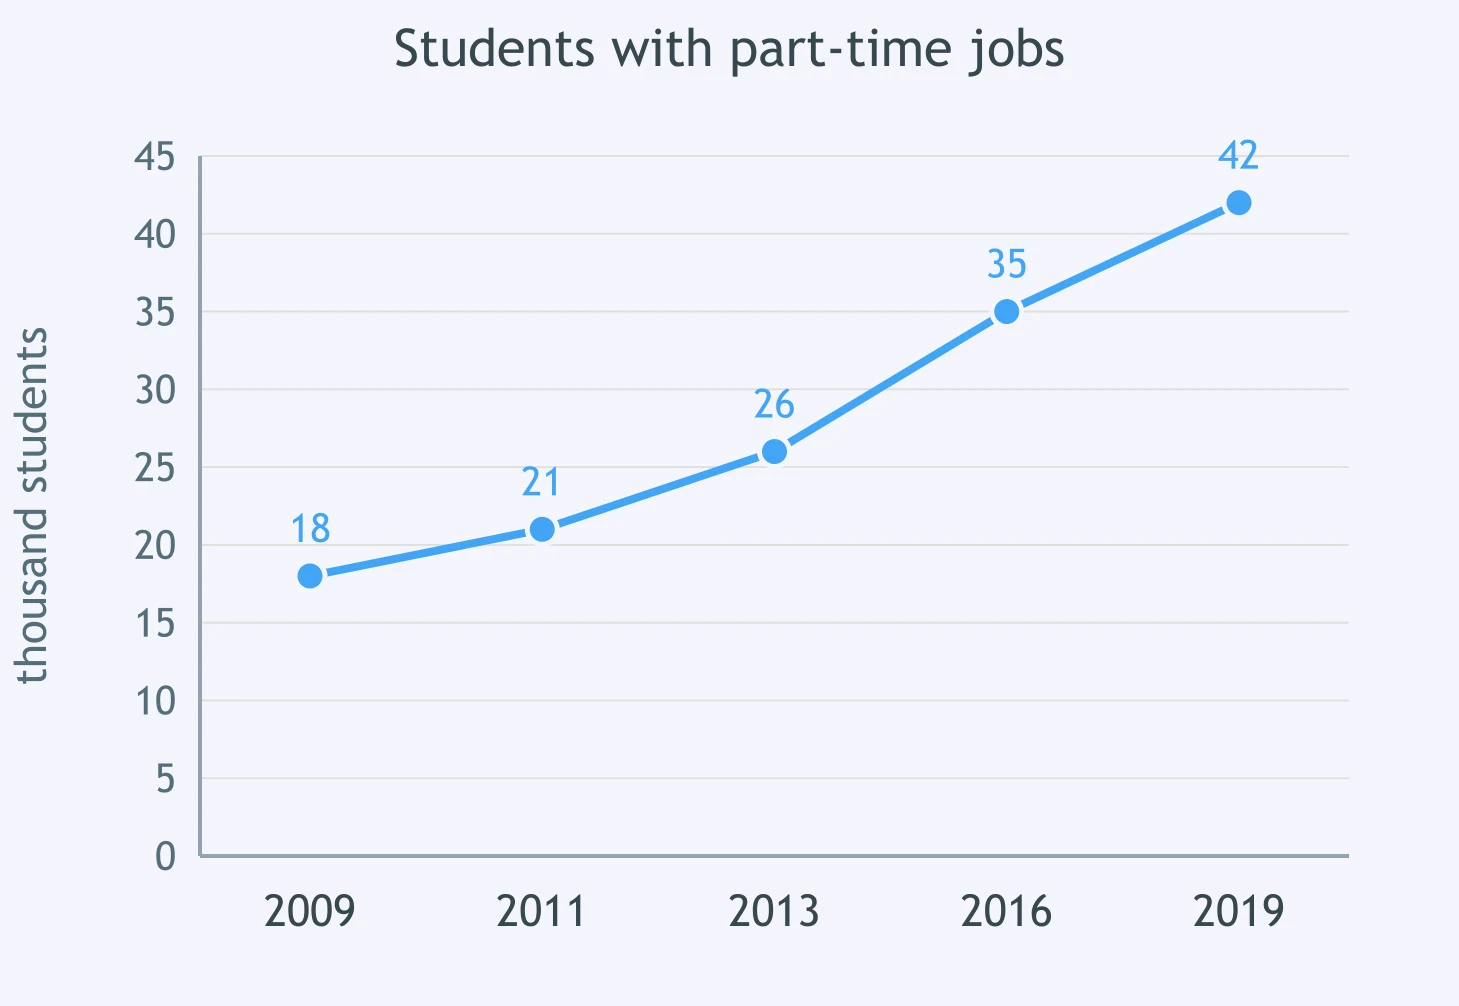
The figure is about part-time jobs for students. Complete: The number rose ___ 42 thousand in 2019.
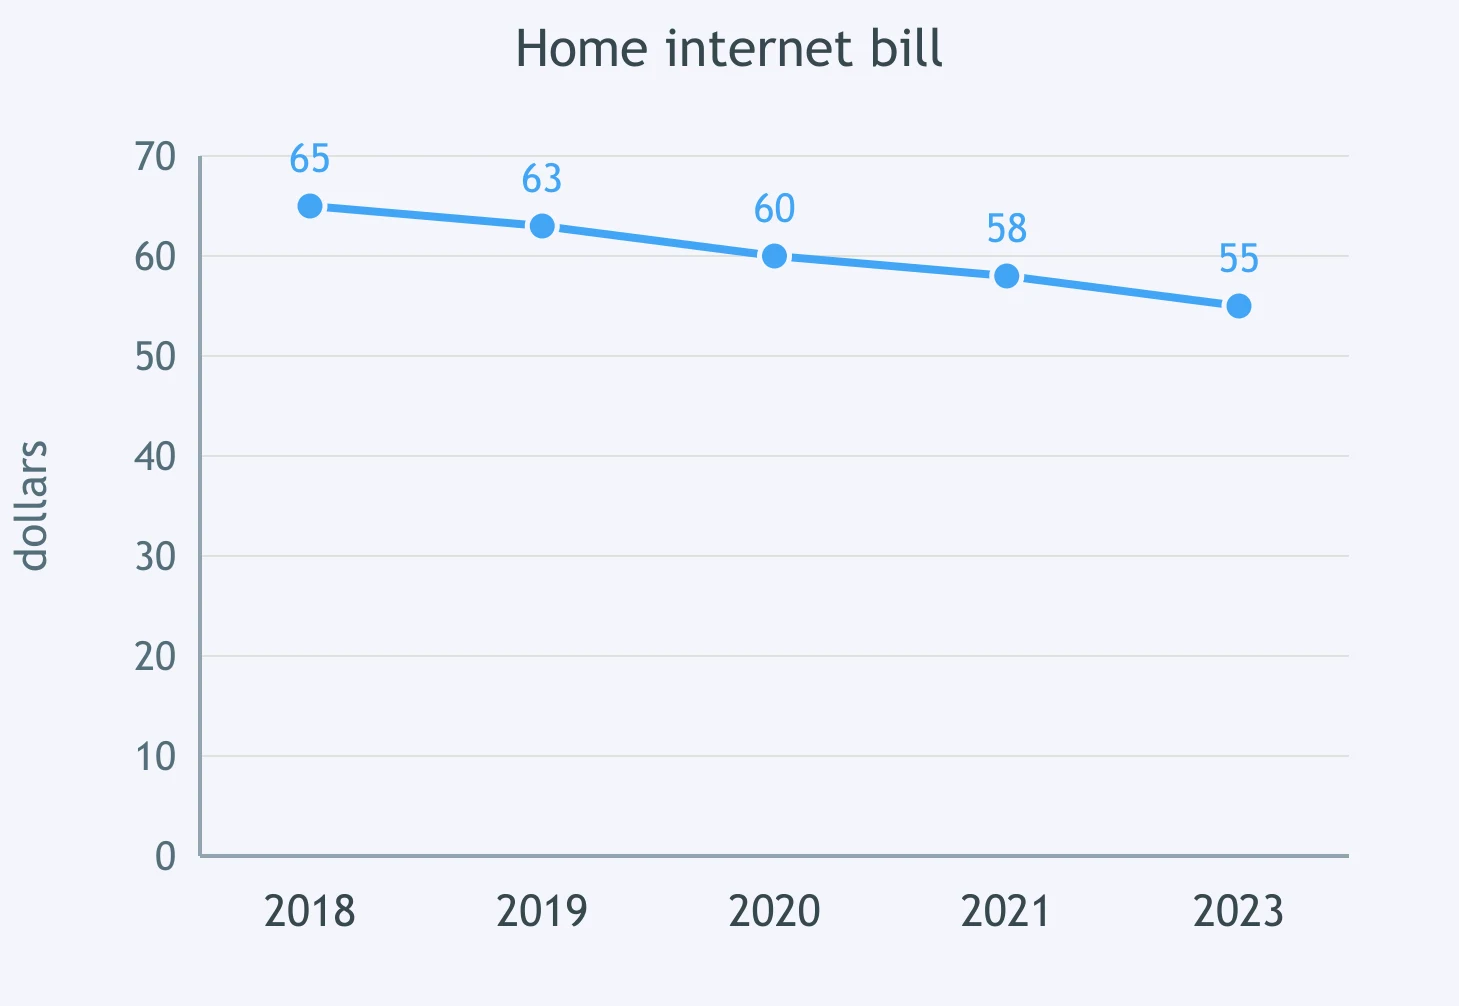
Read the chart on home internet costs. Complete the sentence: The average bill declined ___ 10 dollars in five years.
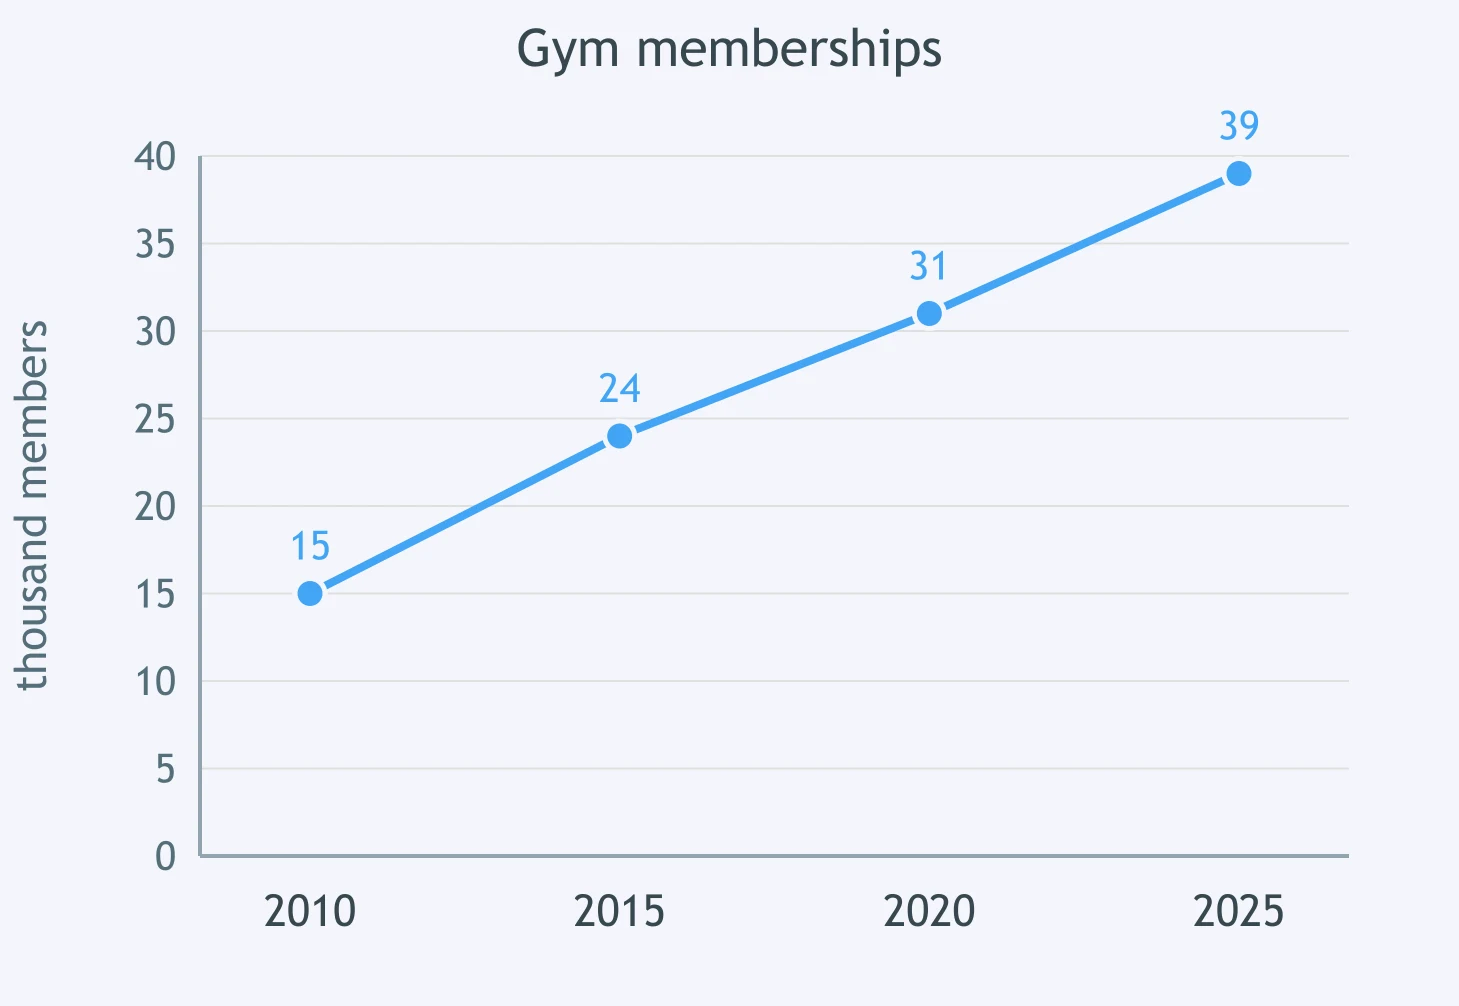
Refer to the line chart for gym memberships. Fill the blank: Membership increased ___ 2010 to 2025.
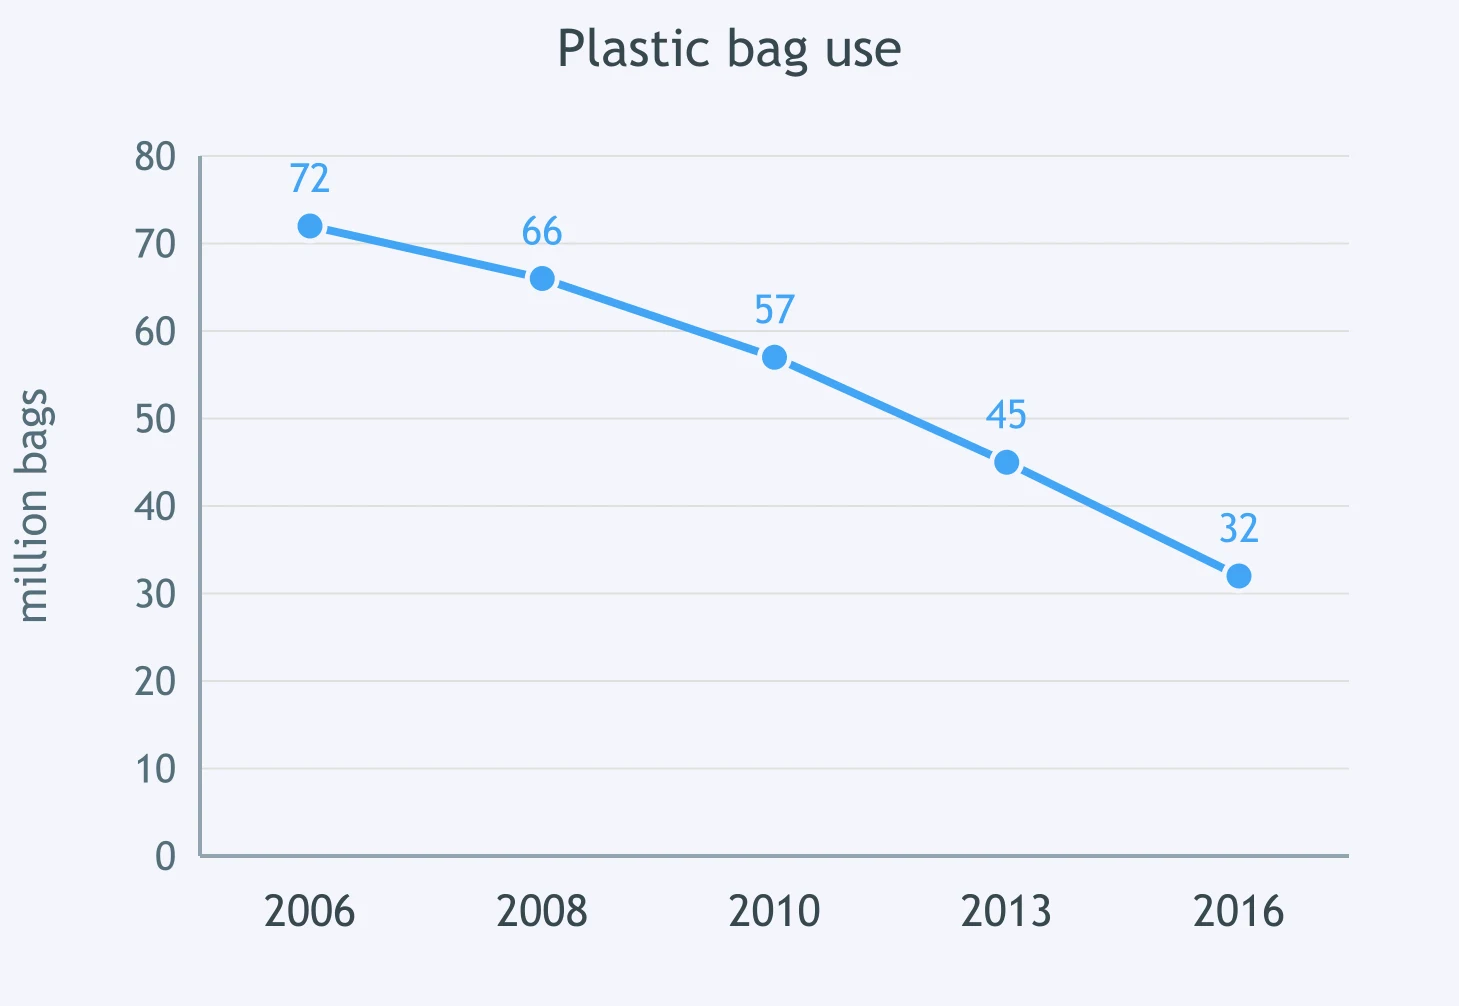
The chart measures plastic bag use. Use the correct word: Plastic bag use fell markedly ___ 2006 and 2016.
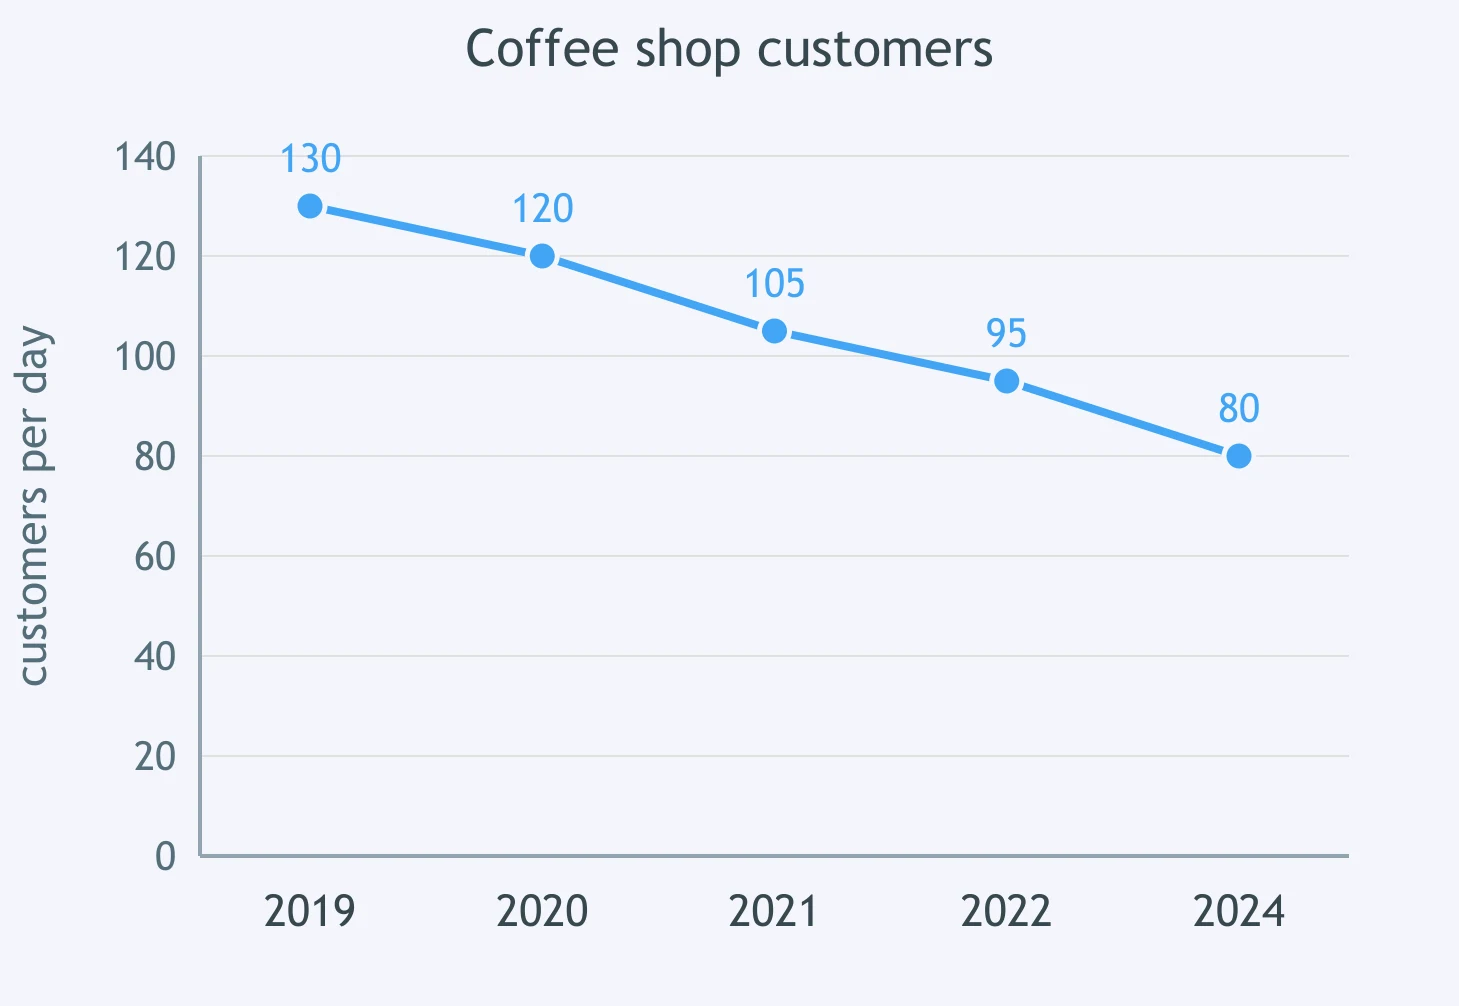
Use the figure on coffee shop customers. Complete: Daily customer numbers dropped ___ 80 in 2024.
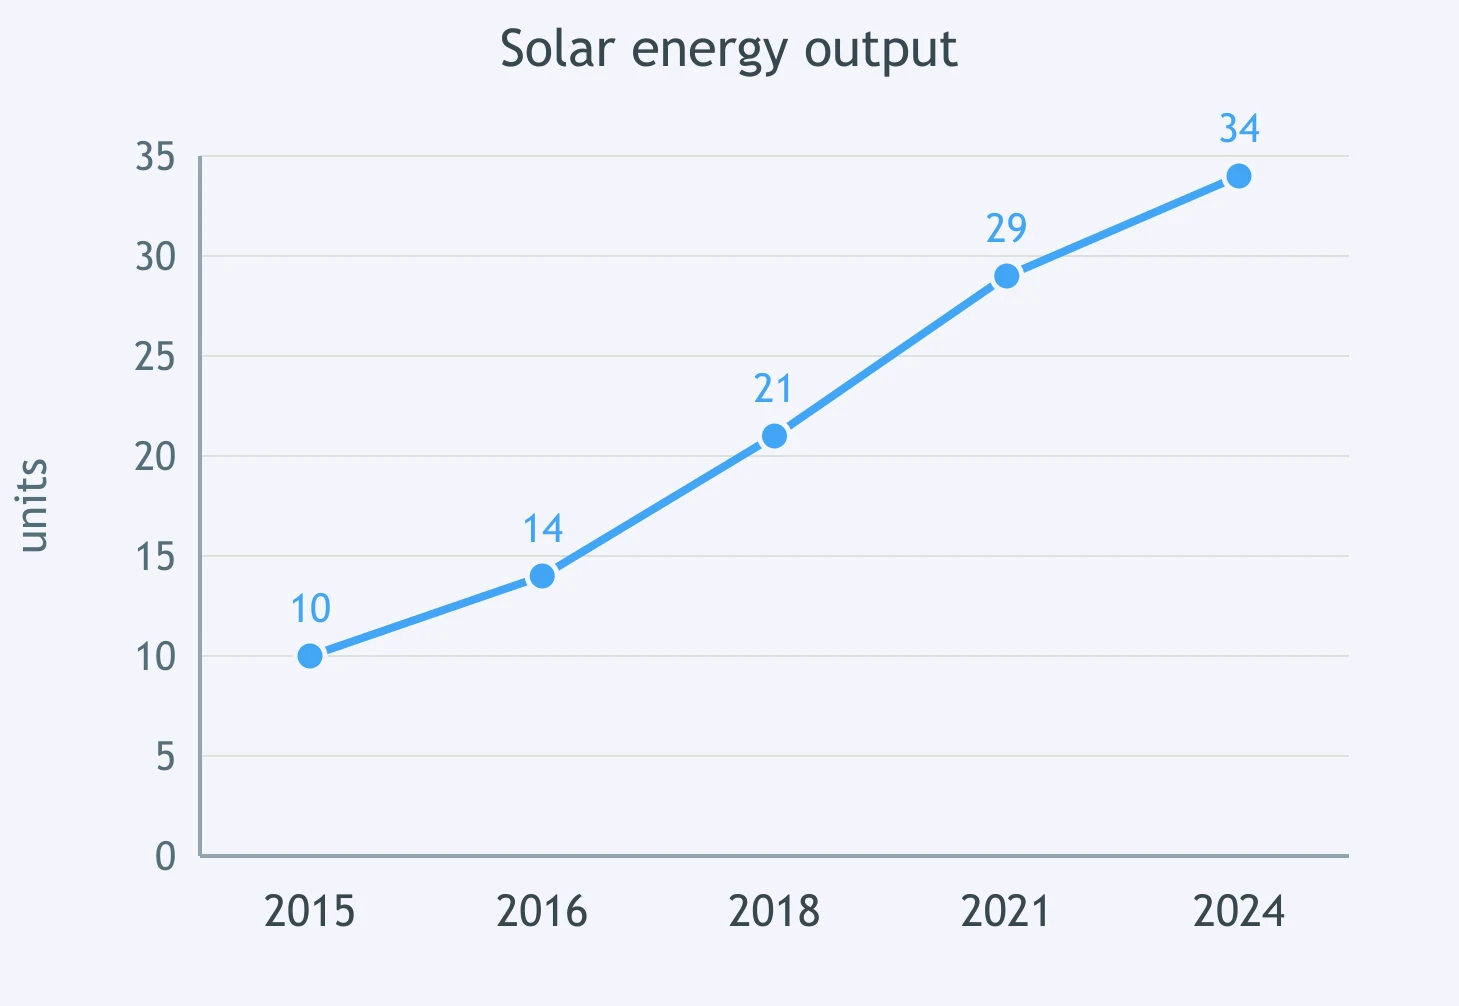
The line graph shows solar energy output. Complete: Output rose ___ 24 units across the period.
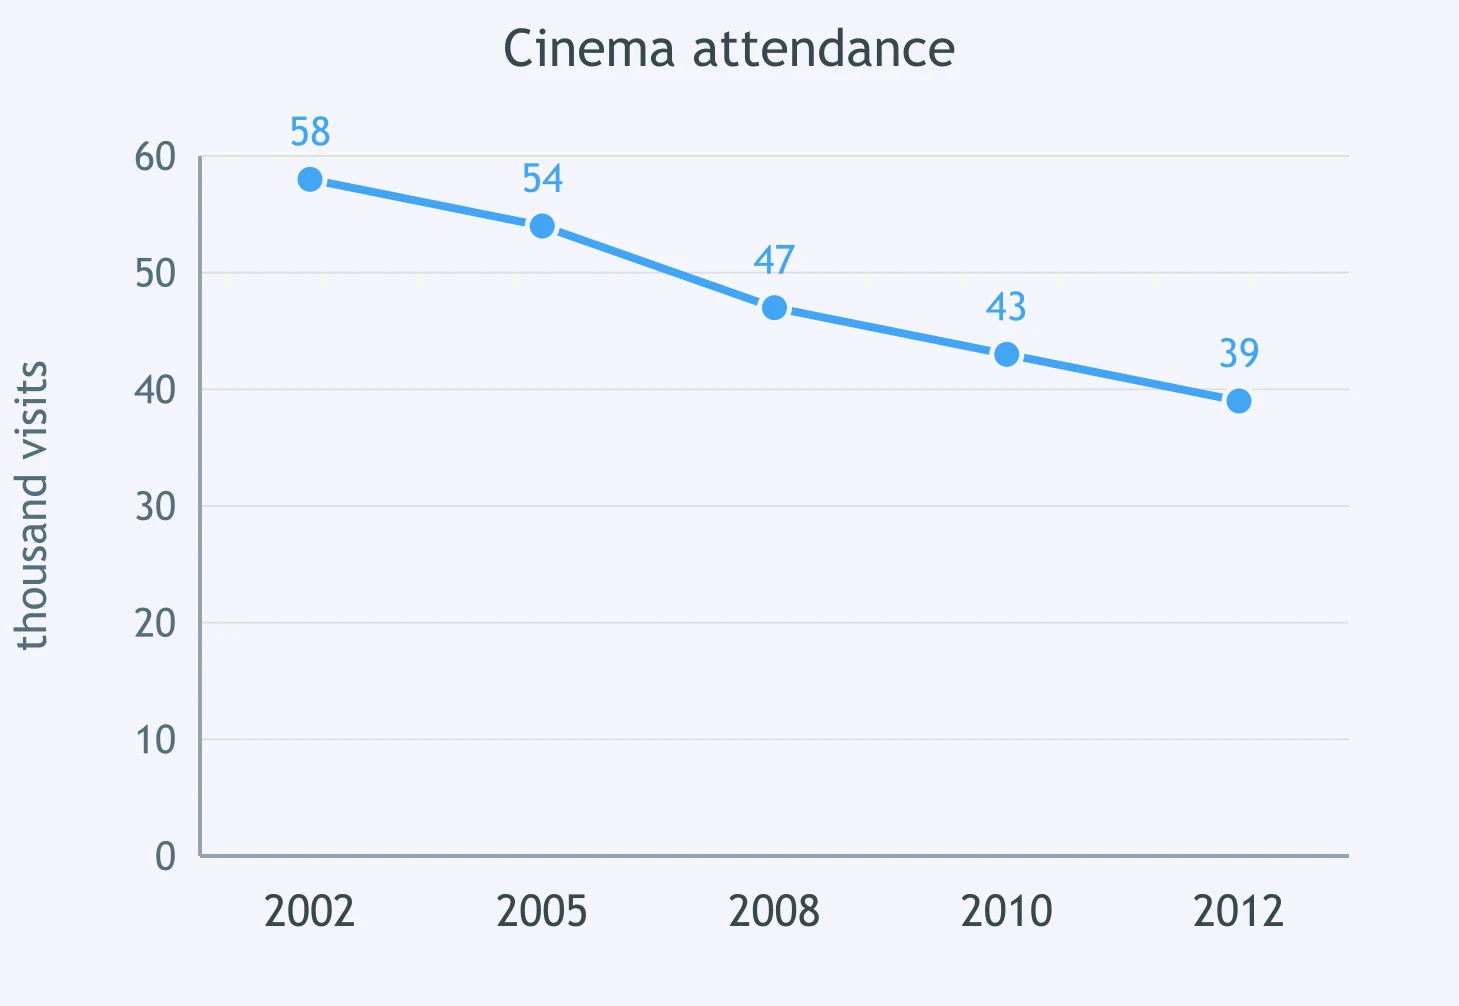
Check the figure for cinema attendance. Choose the missing word: Attendance declined ___ 2002 to 2012.
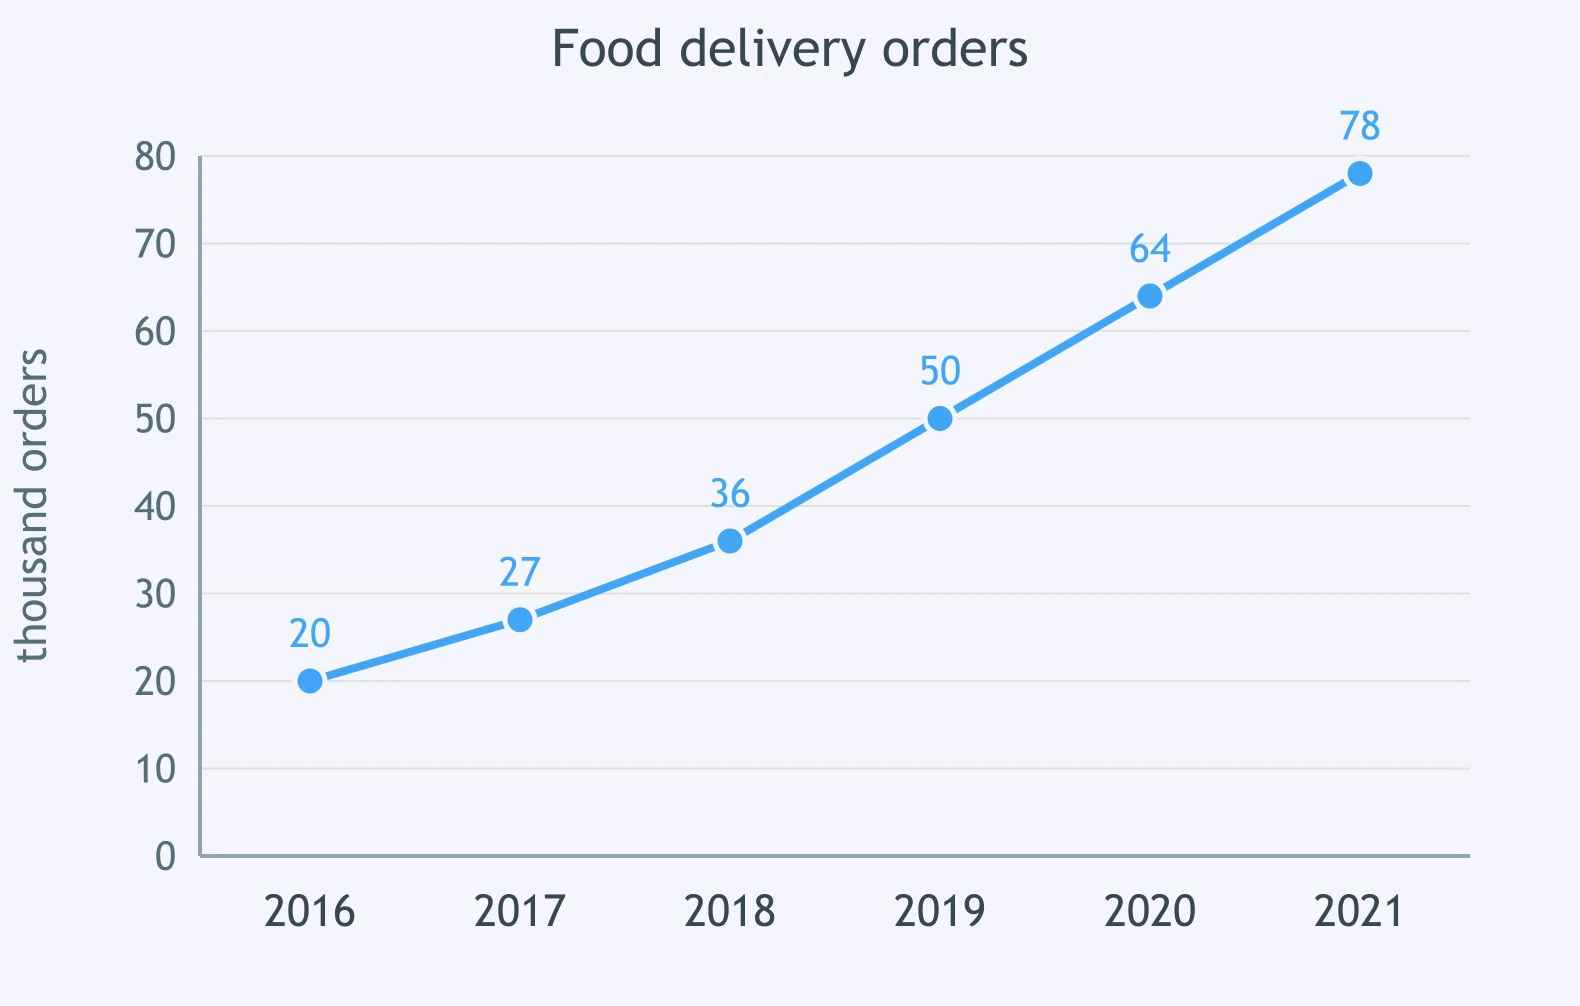
The chart records food delivery orders. Orders climbed strongly ___ 2016 and 2021. Which option fits?
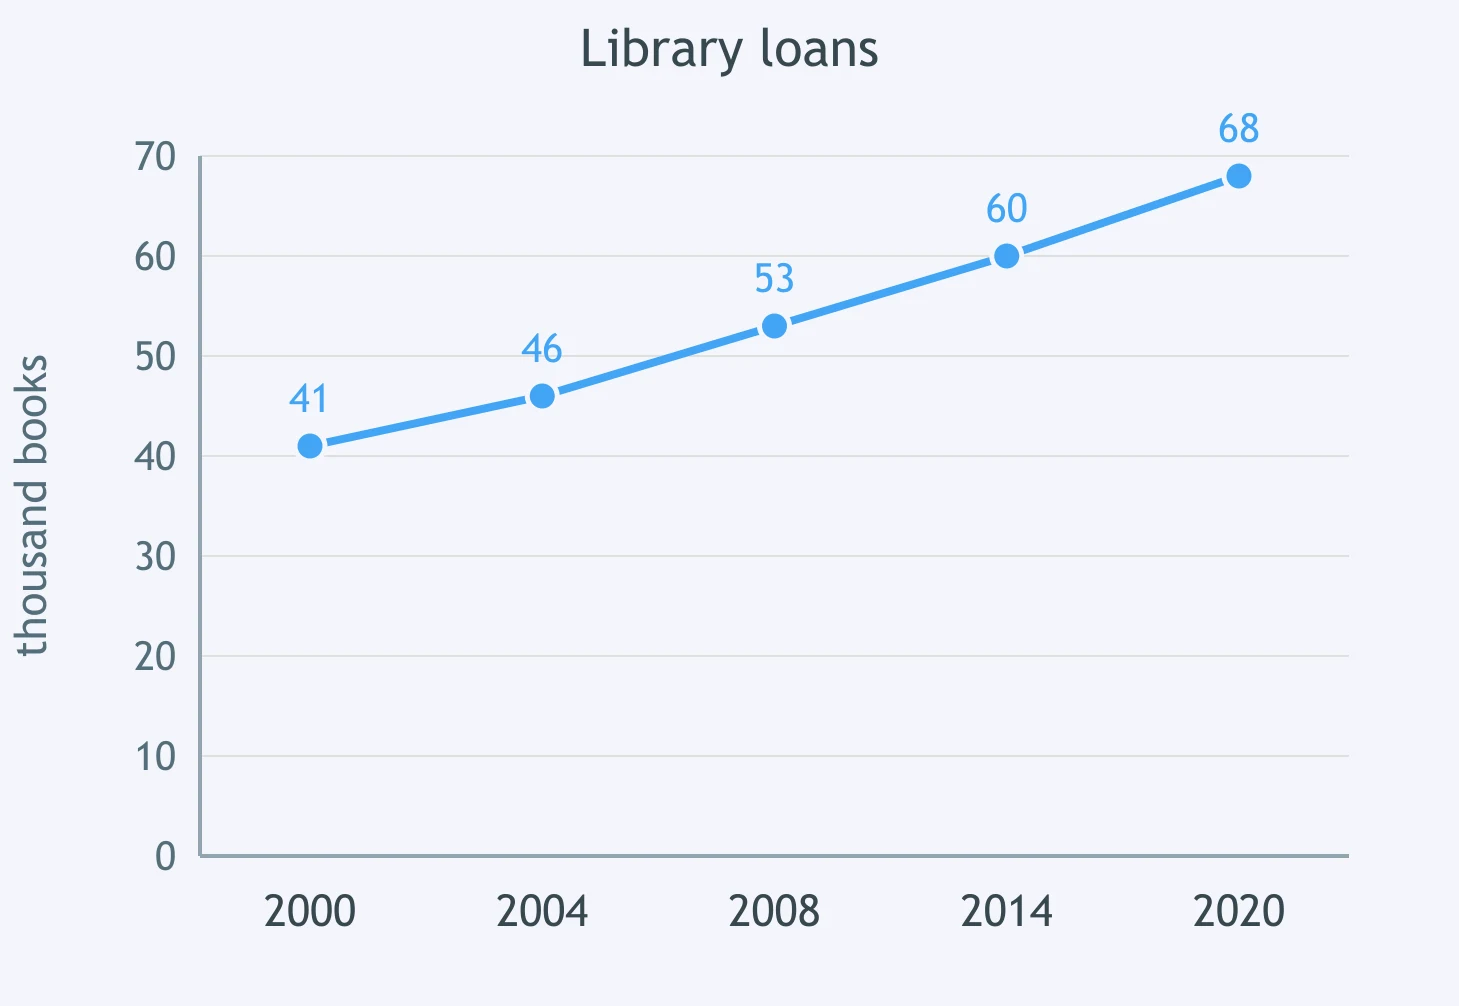
Examine the line chart for library loans. Complete the sentence: Loans increased ___ 68 thousand by 2020.
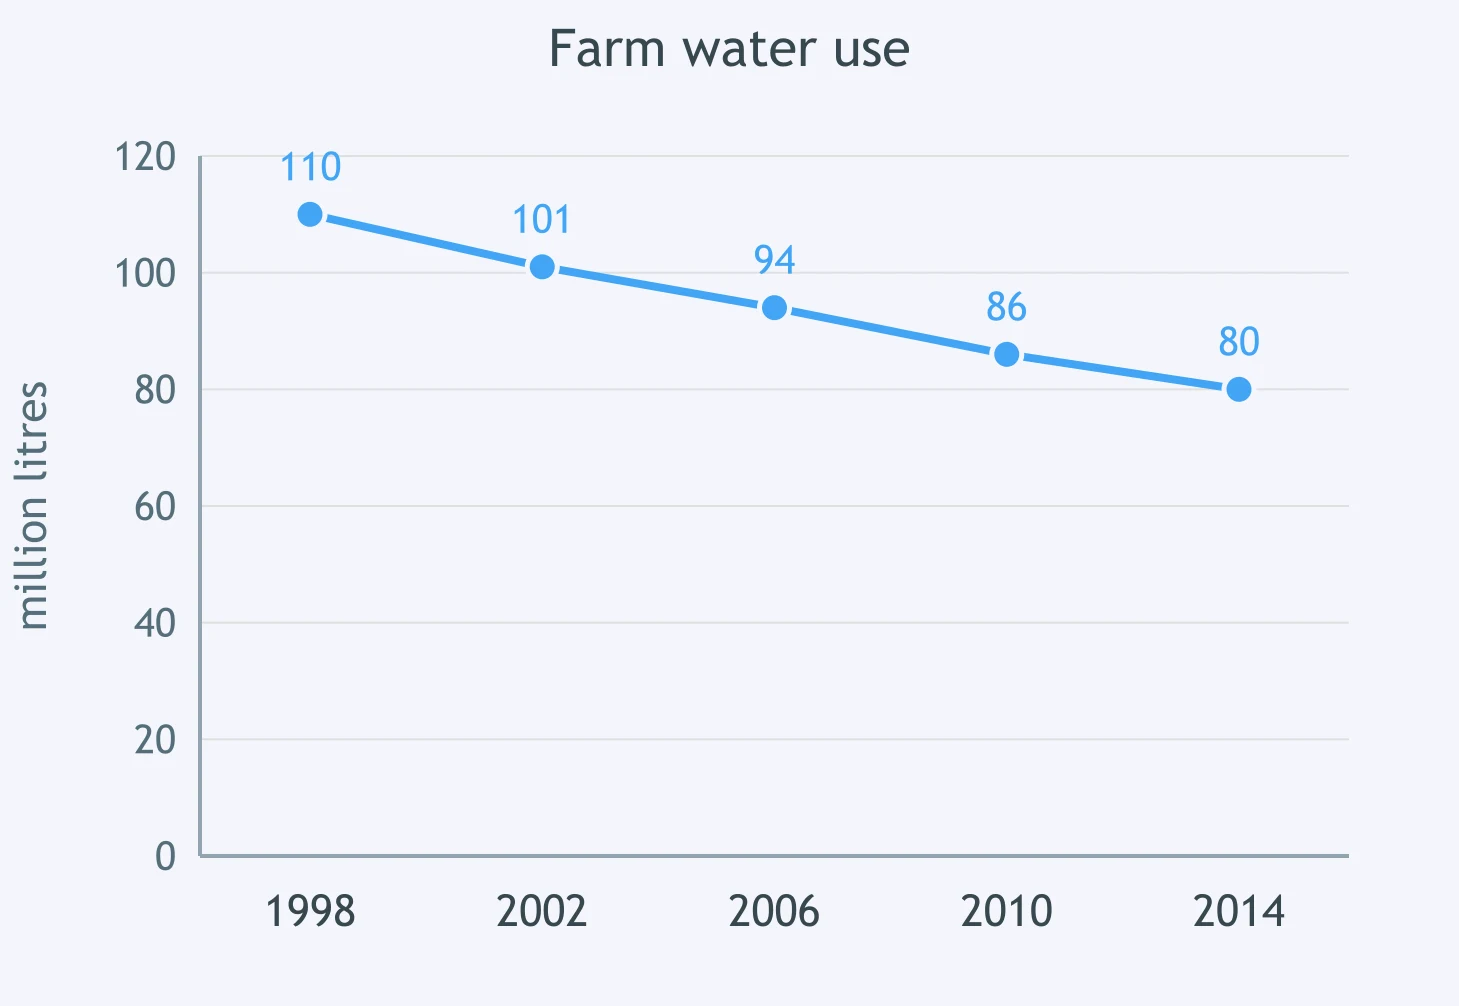
The chart gives water use on farms. Pick the preposition: Water use fell ___ 30 million litres over the period.
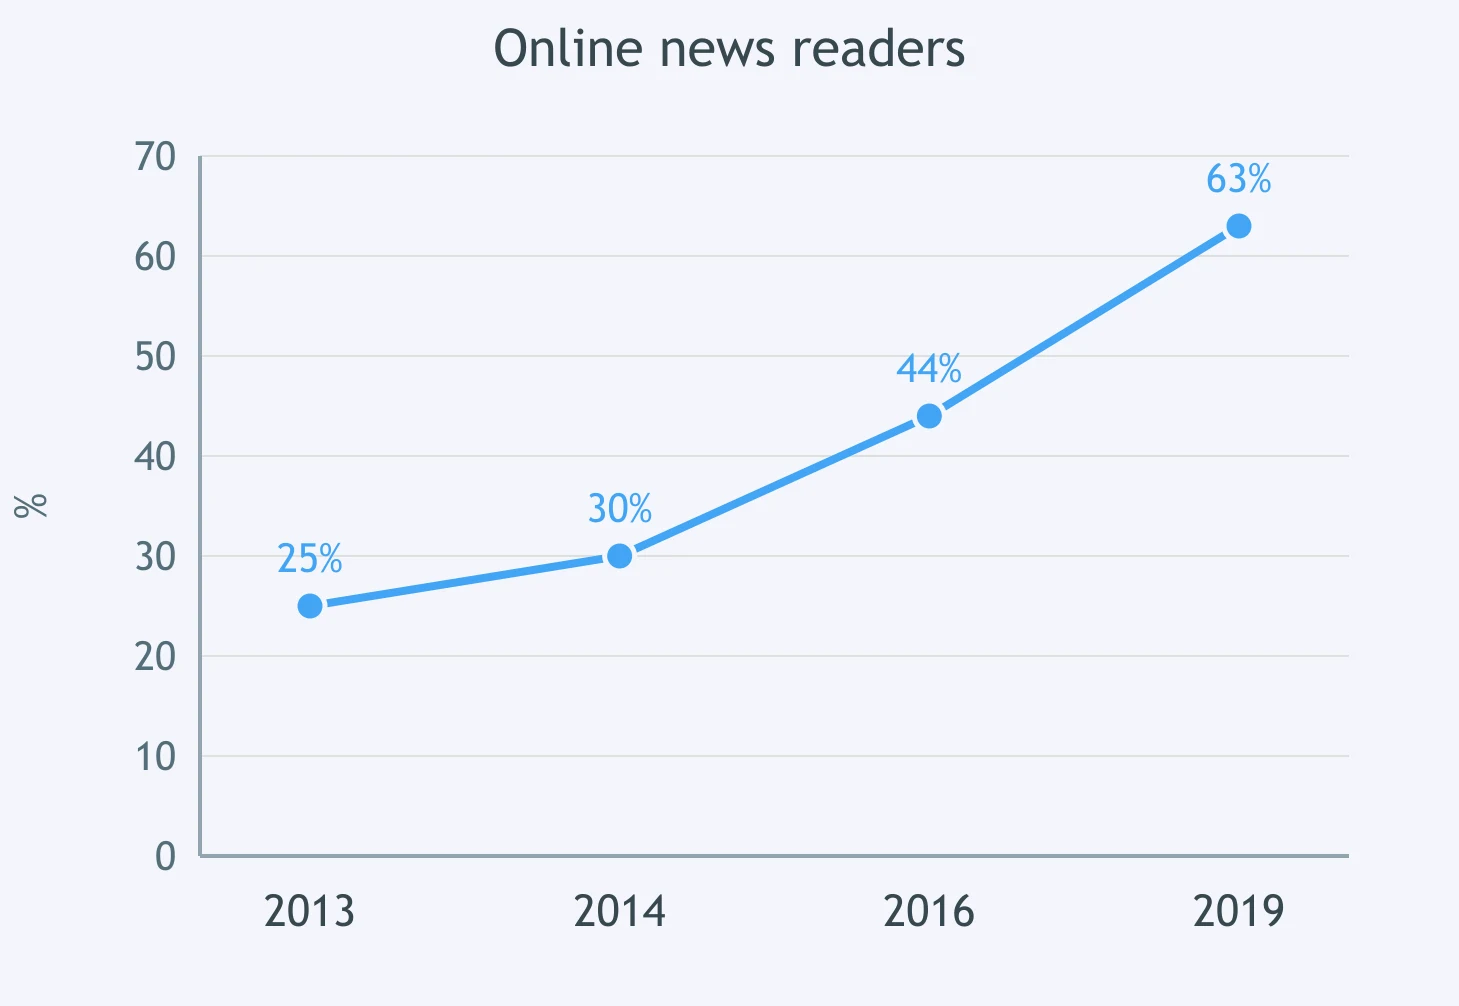
Follow the chart of online news readers. Fill the gap: The number climbed ___ 2013 to 2019.
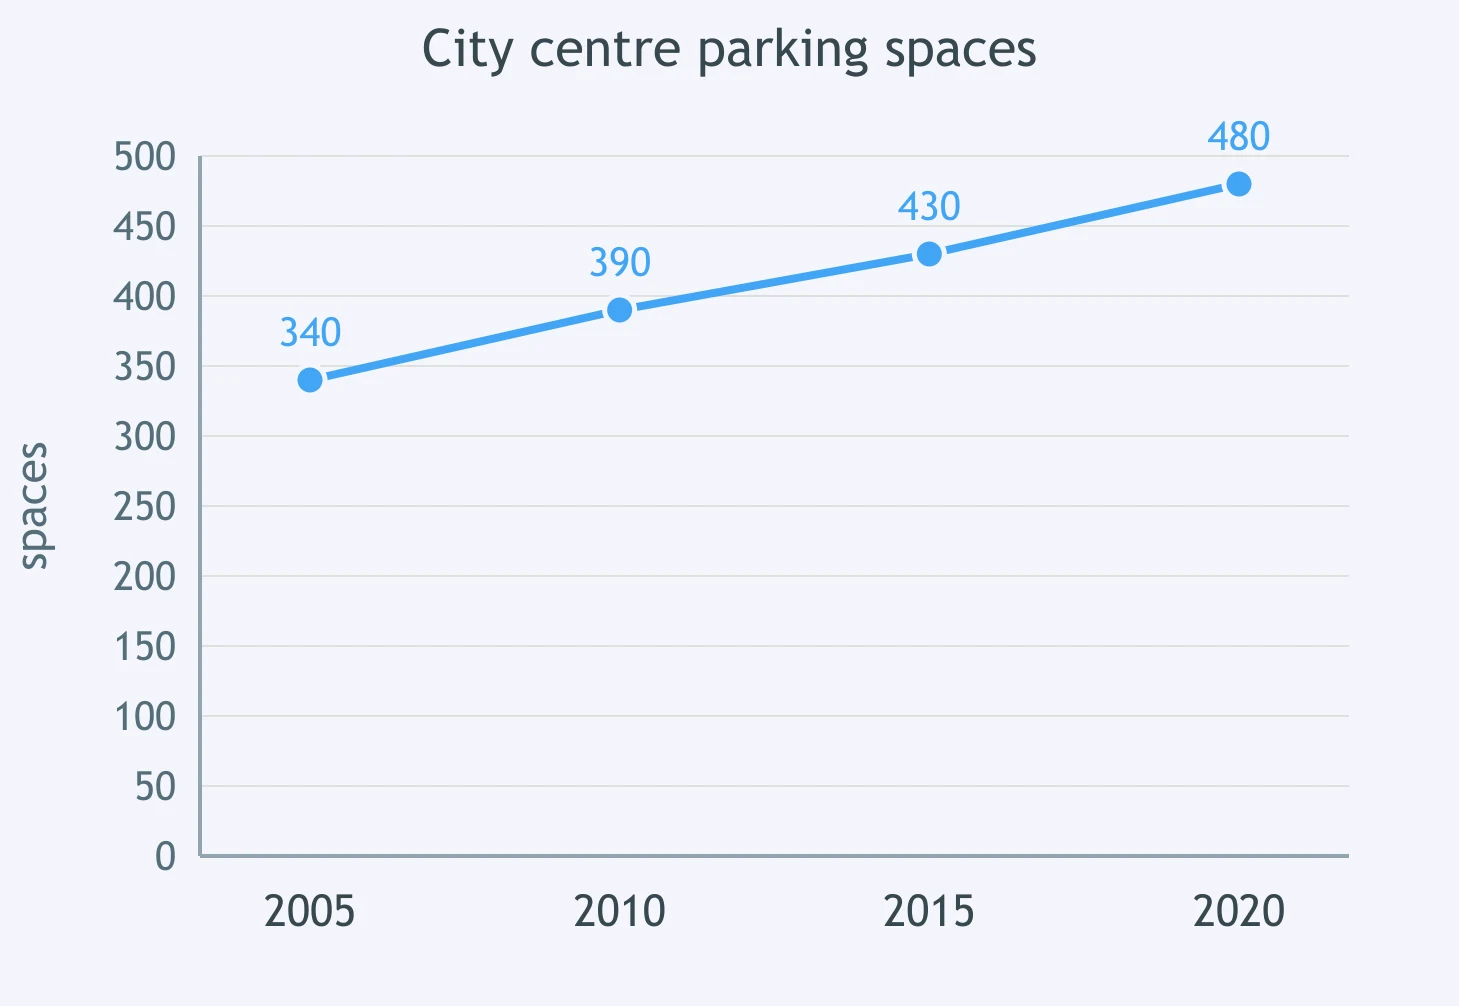
The chart is about parking spaces in the city centre. Spaces grew ___ 2005 and 2020. Choose the word.
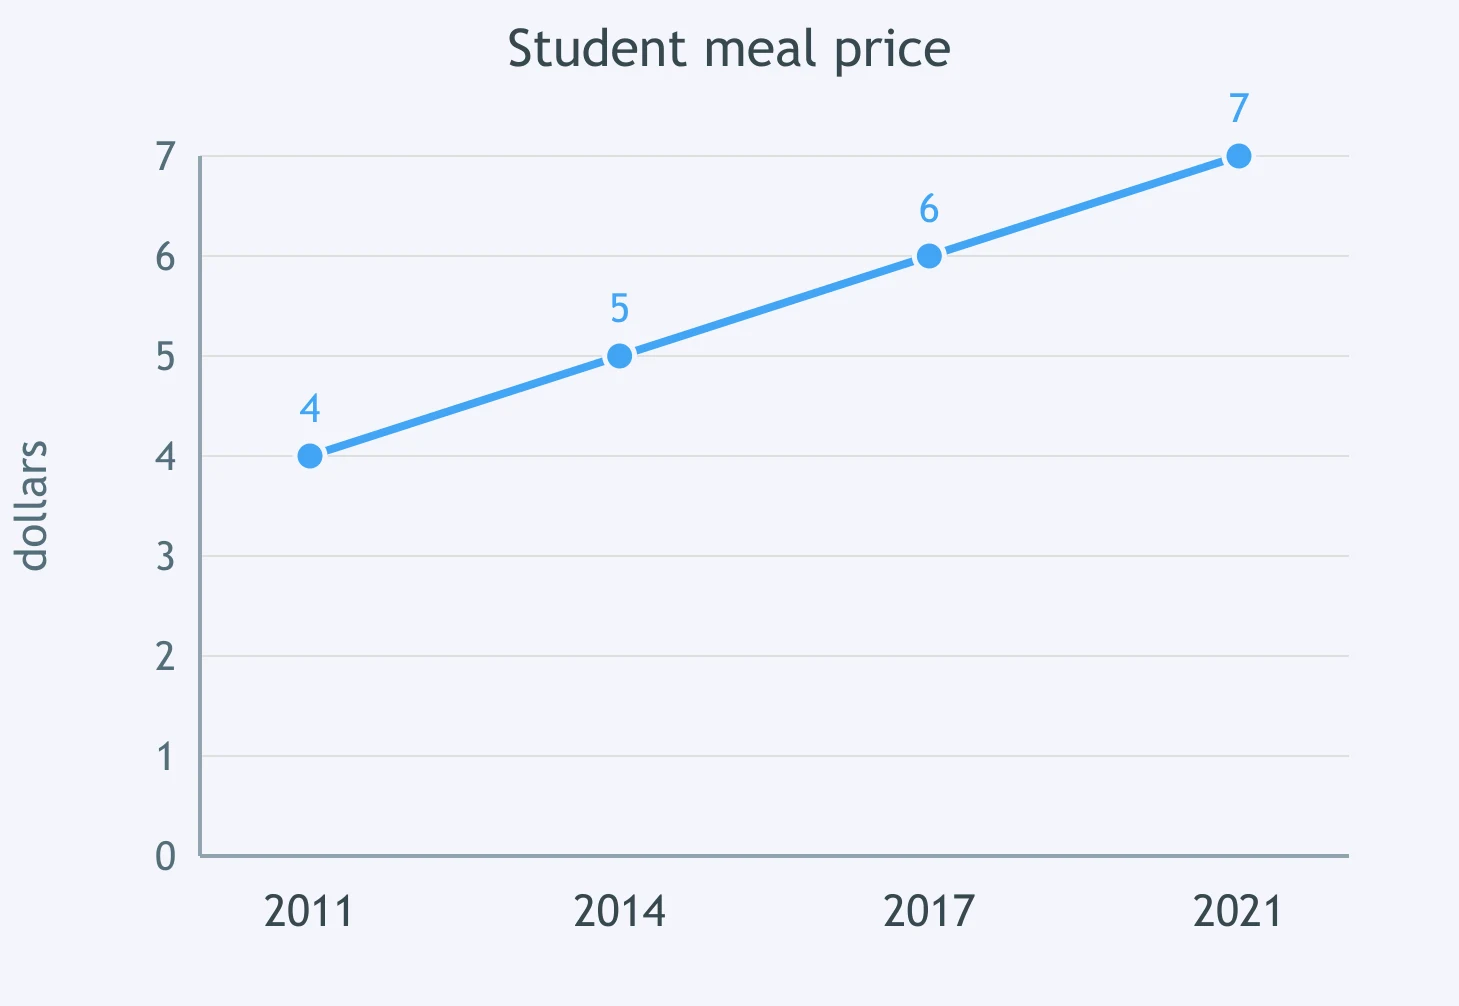
The figure tracks the price of a student meal. Complete: The price rose ___ 7 dollars at the end of the period.
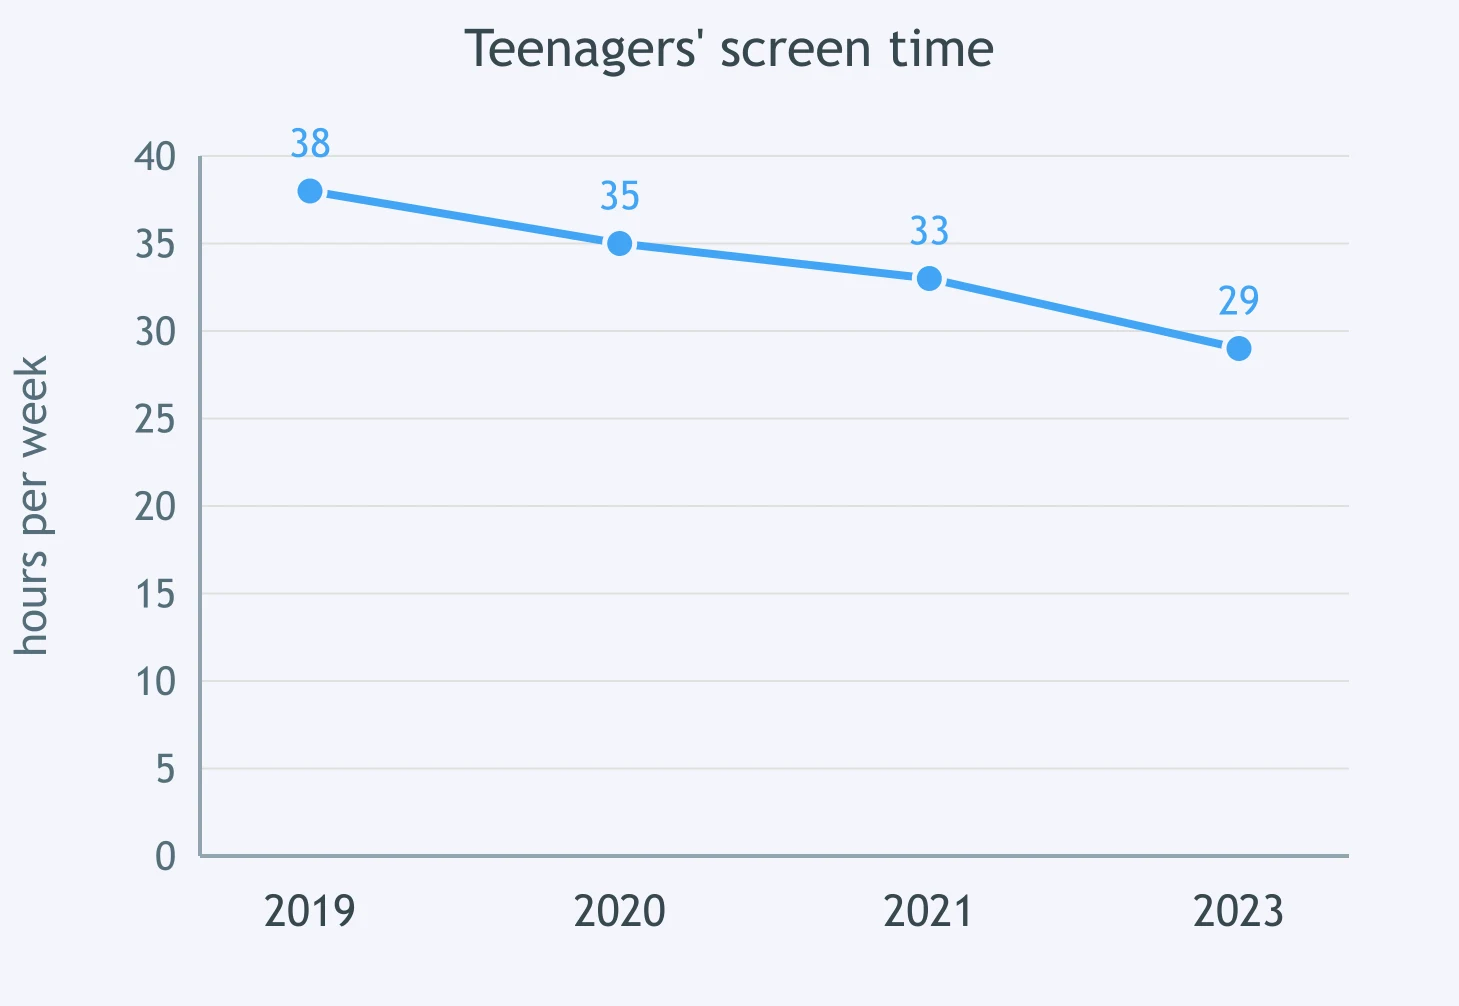
Look at the chart for screen time among teenagers. Complete: Average screen time dropped ___ 9 hours per week.
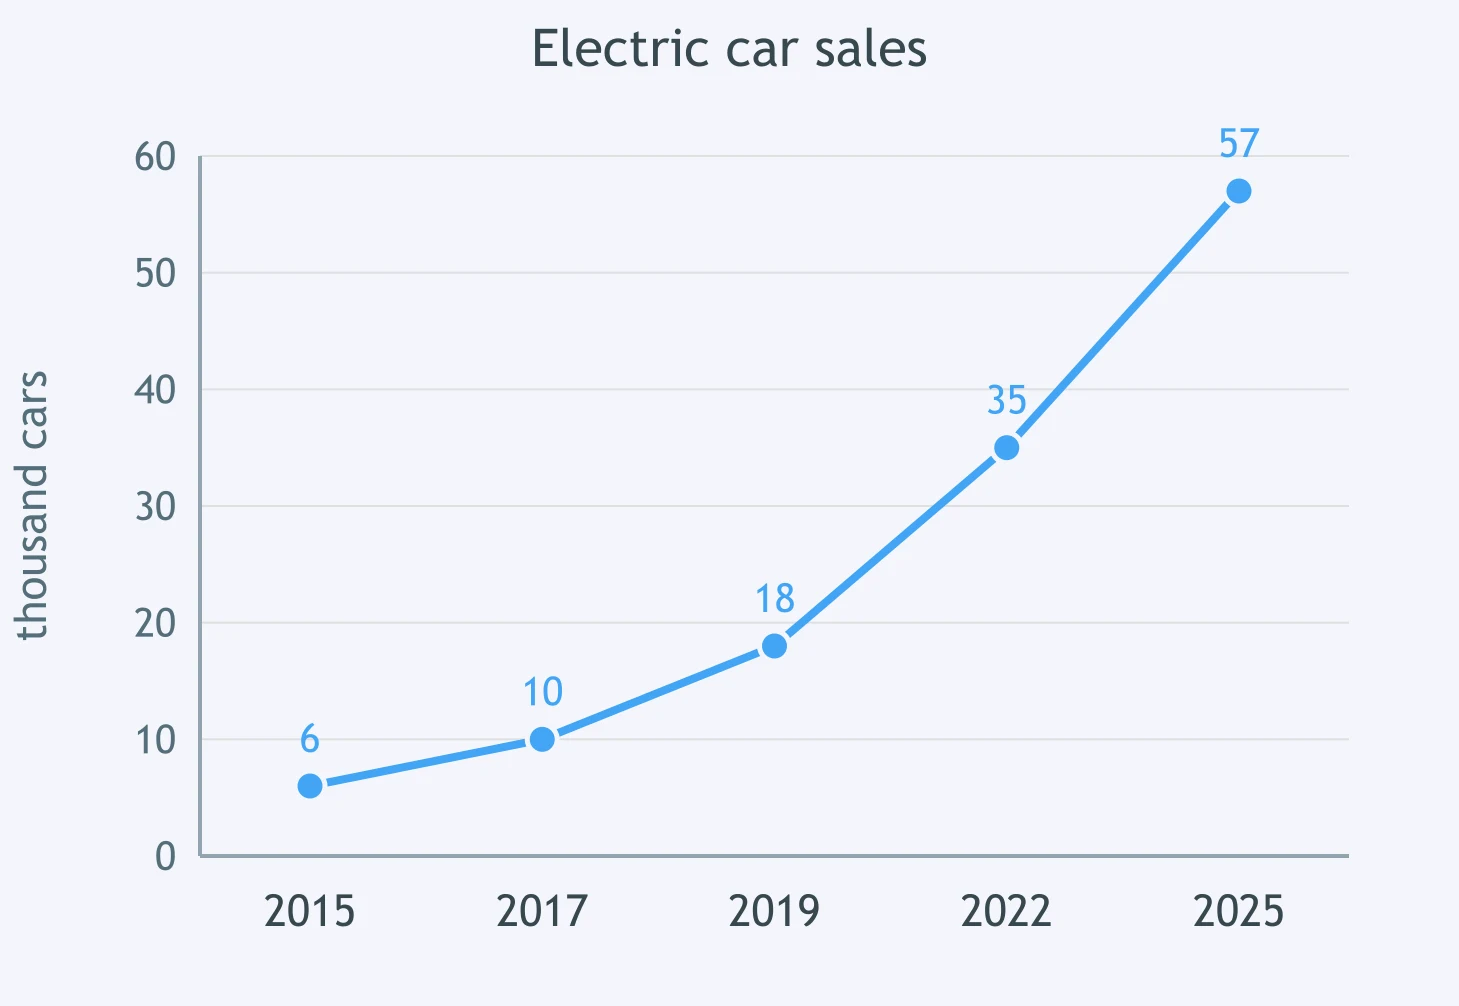
Use the figure showing electric car sales. Complete the trend: Sales increased ___ 2015 to 2025.
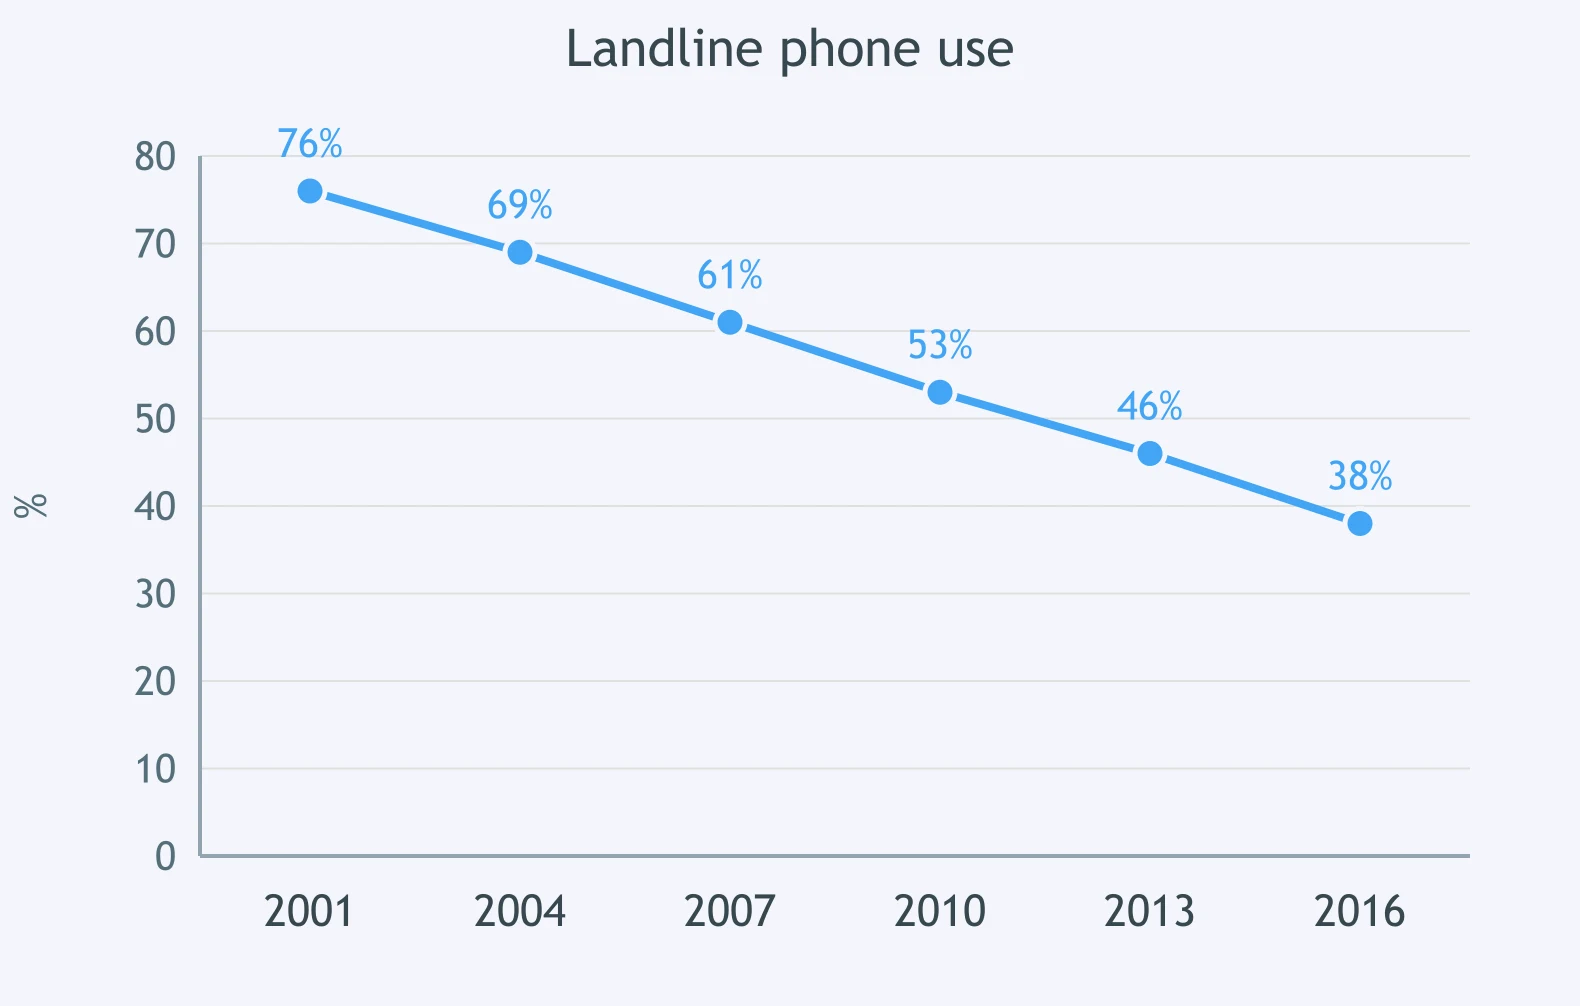
The graph shows landline phone use. It fell consistently ___ 2001 and 2016. Select the missing word.
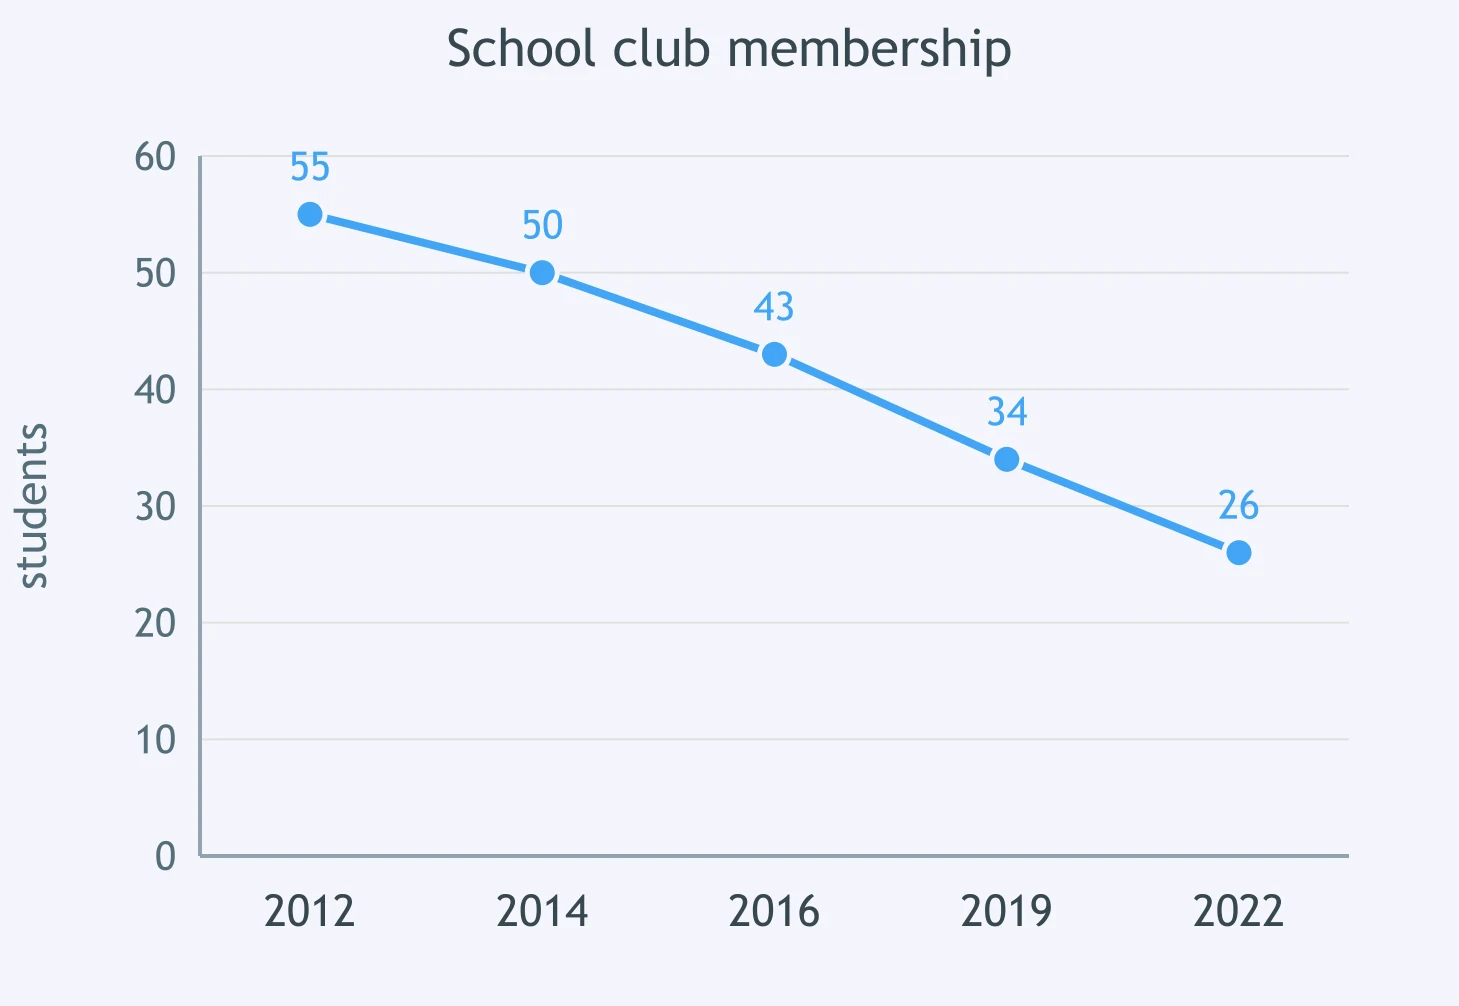
According to the school club chart, membership declined ___ 26 students in 2022. Fill the blank.
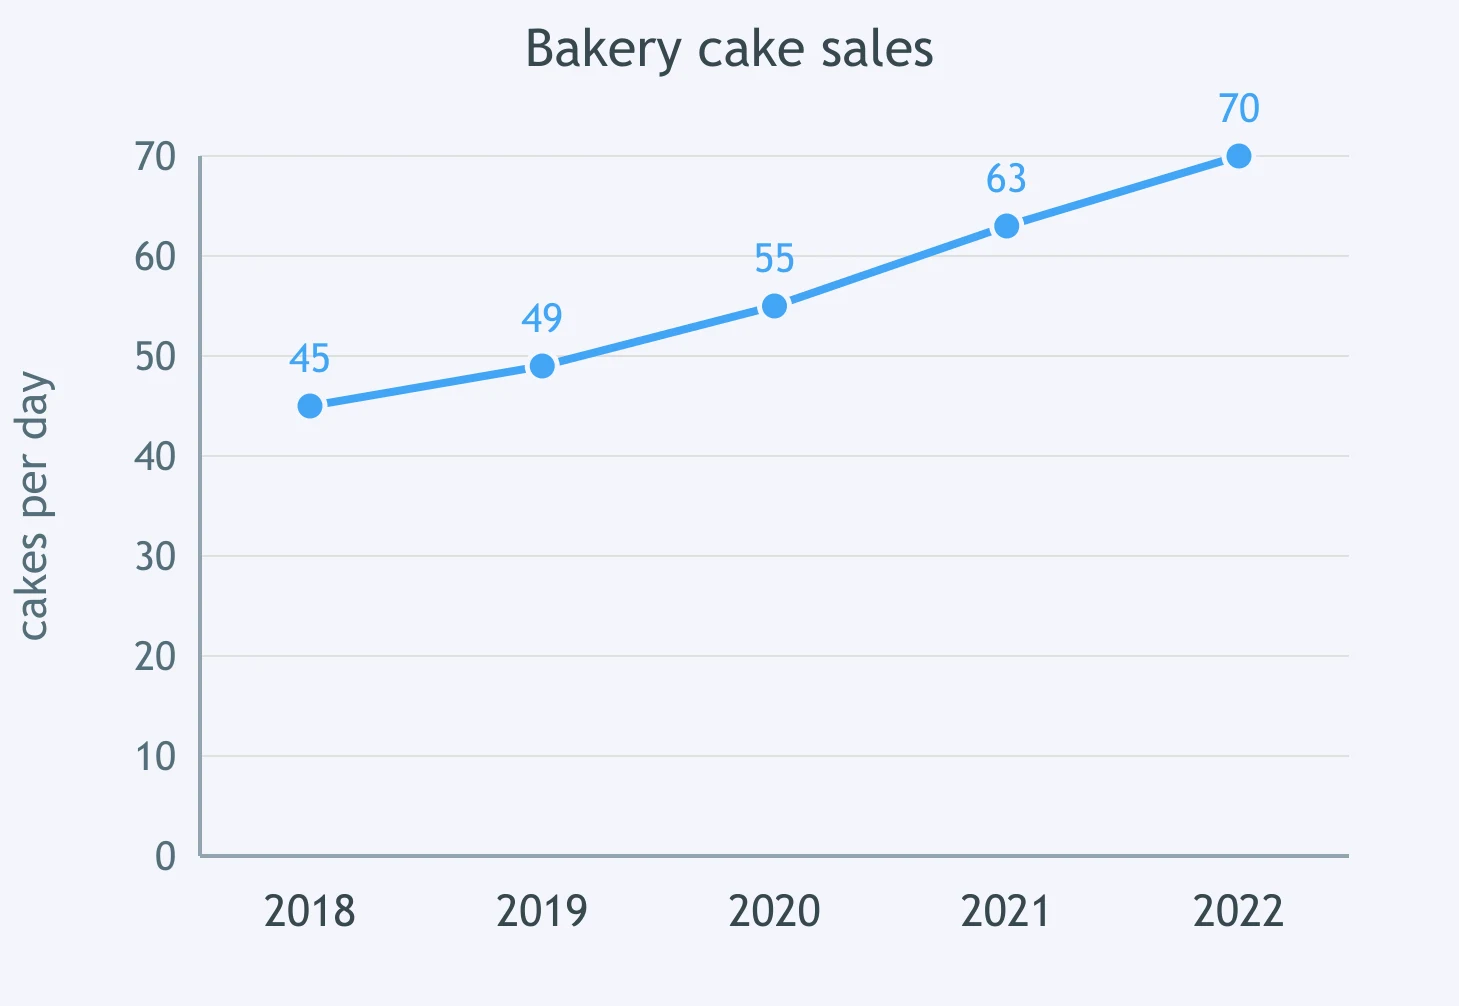
The figure shows sales at a small bakery. Complete: Sales rose ___ 25 cakes per day between 2018 and 2022.
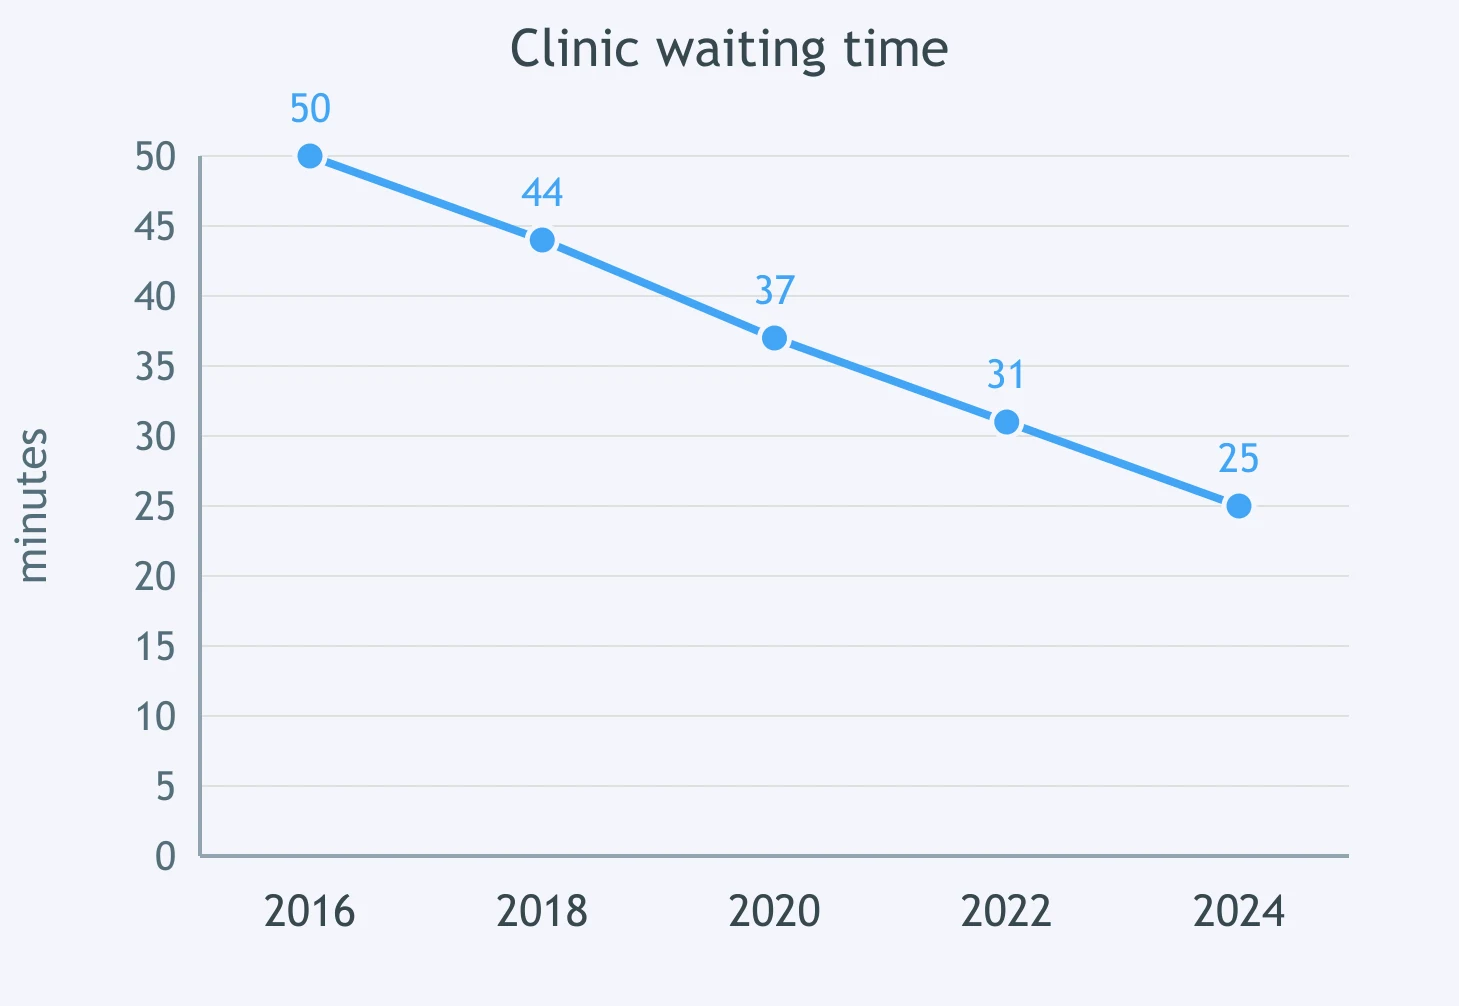
Study the chart of waiting times at a clinic. Complete: Waiting times decreased ___ 2016 to 2024.
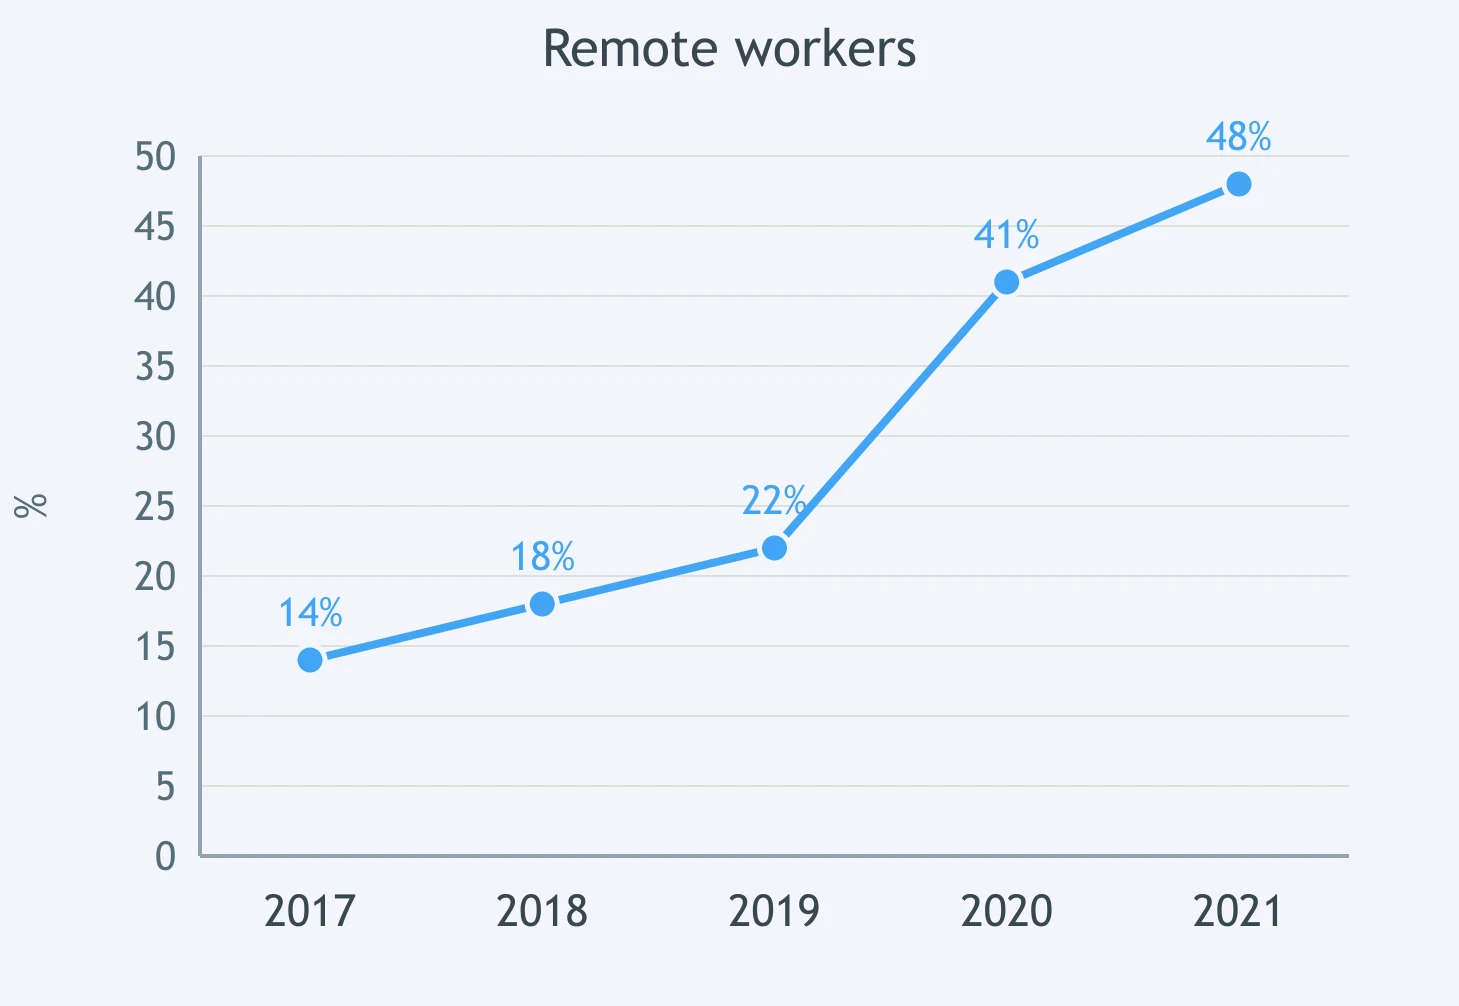
The line chart compares remote workers over time. Remote work increased ___ 2017 and 2021. Which word is correct?
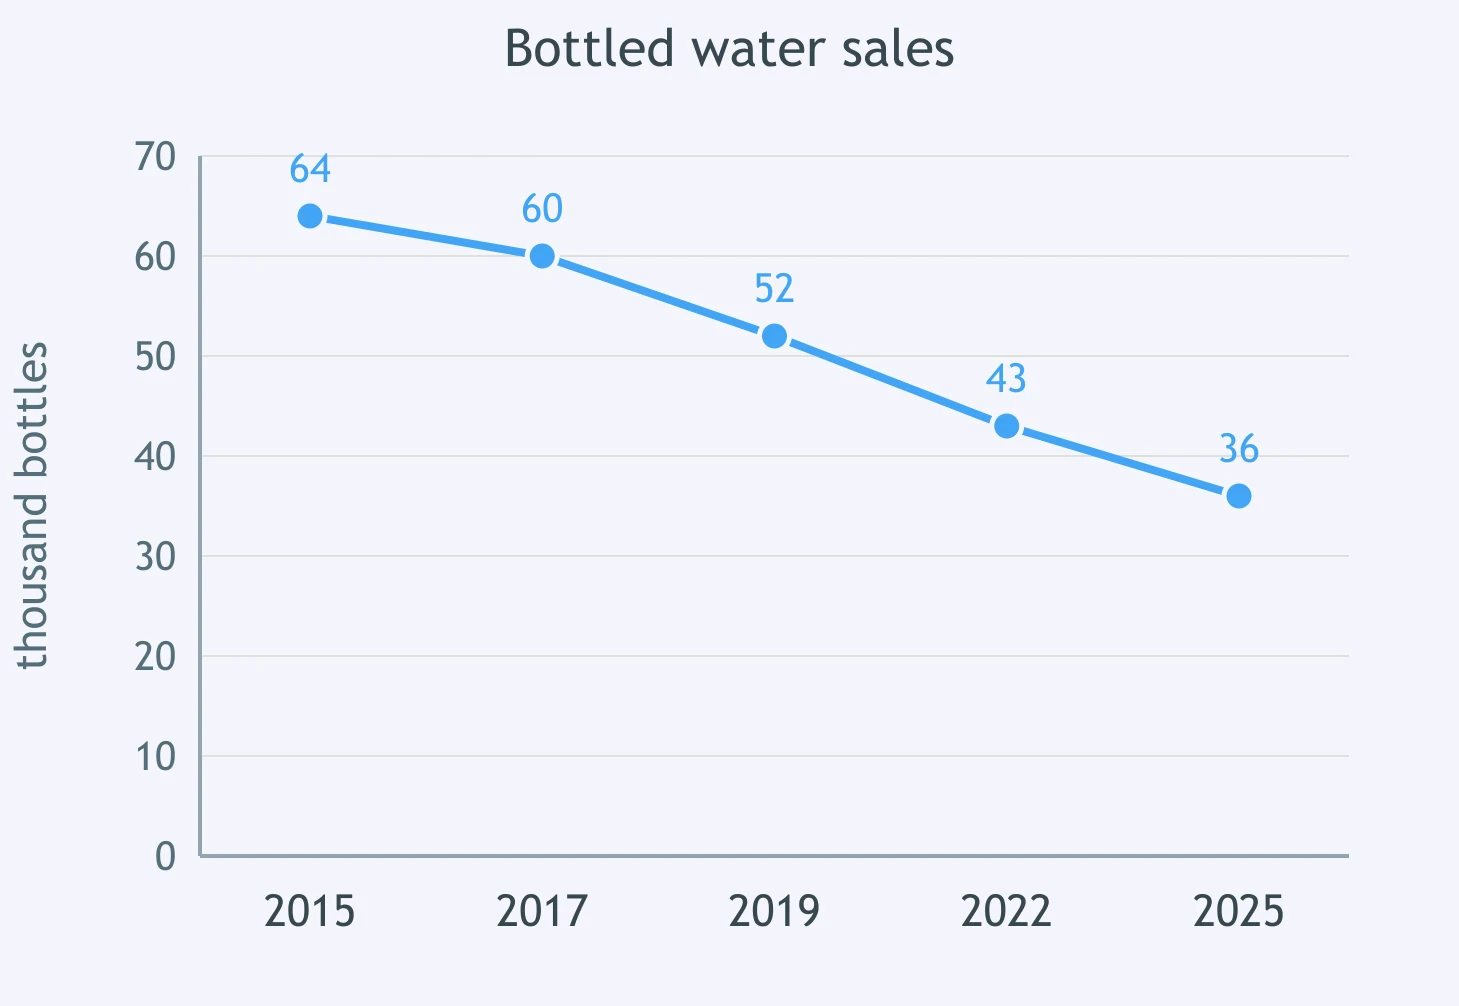
Read the chart about bottled water sold in shops. Complete: Sales fell ___ 36 thousand bottles in 2025.
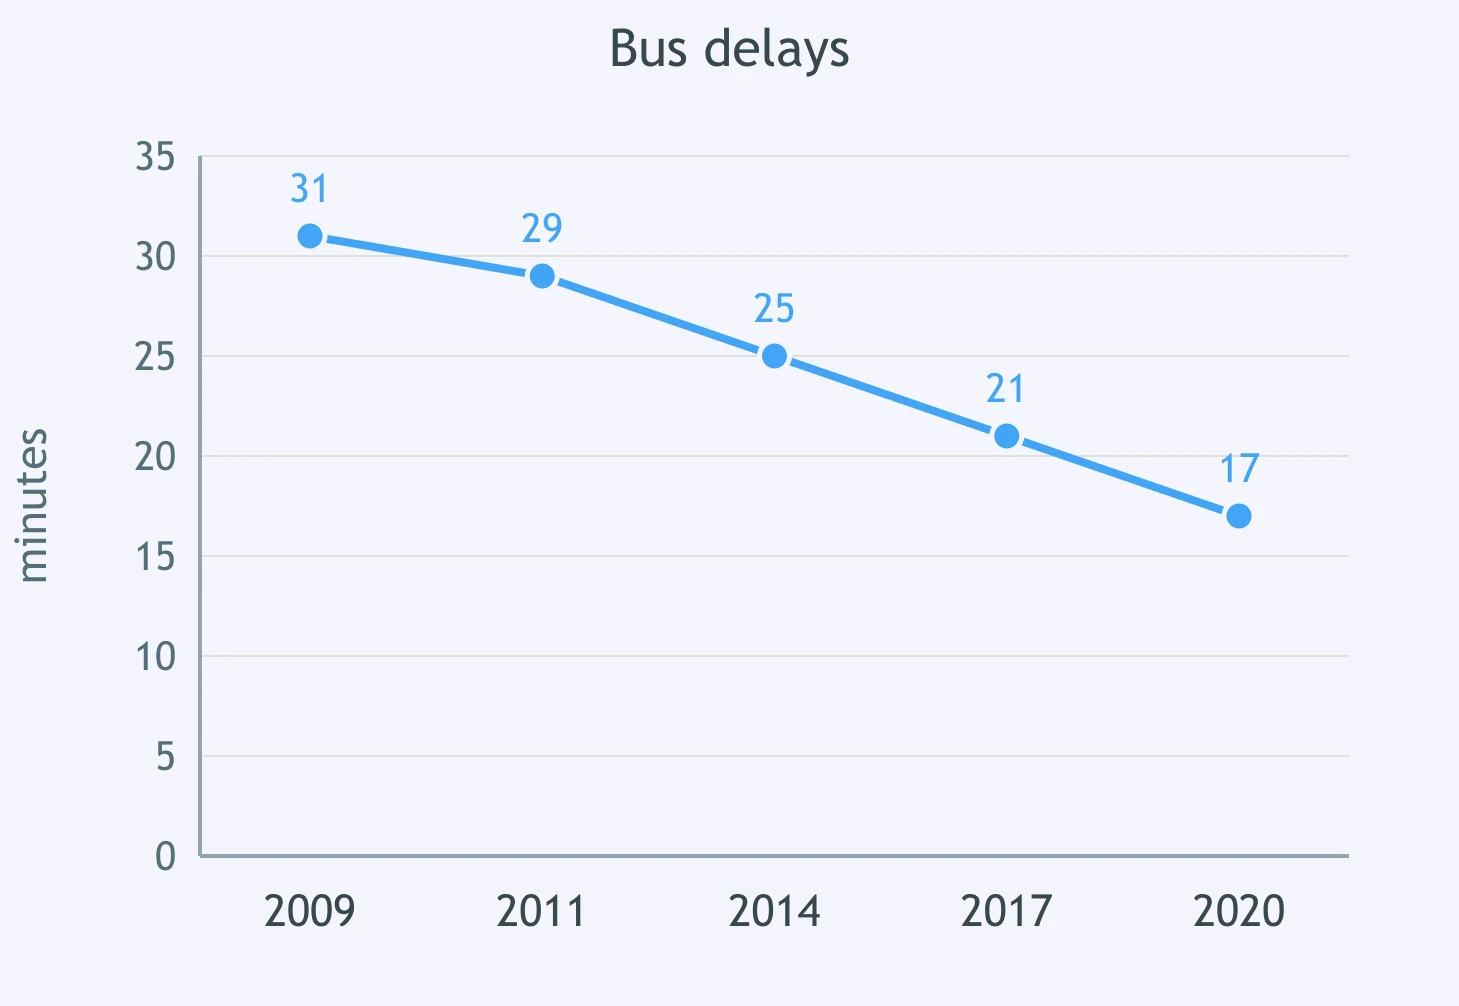
The chart presents bus delays. Complete this Task 1 sentence: Delays declined ___ 14 minutes over the period.
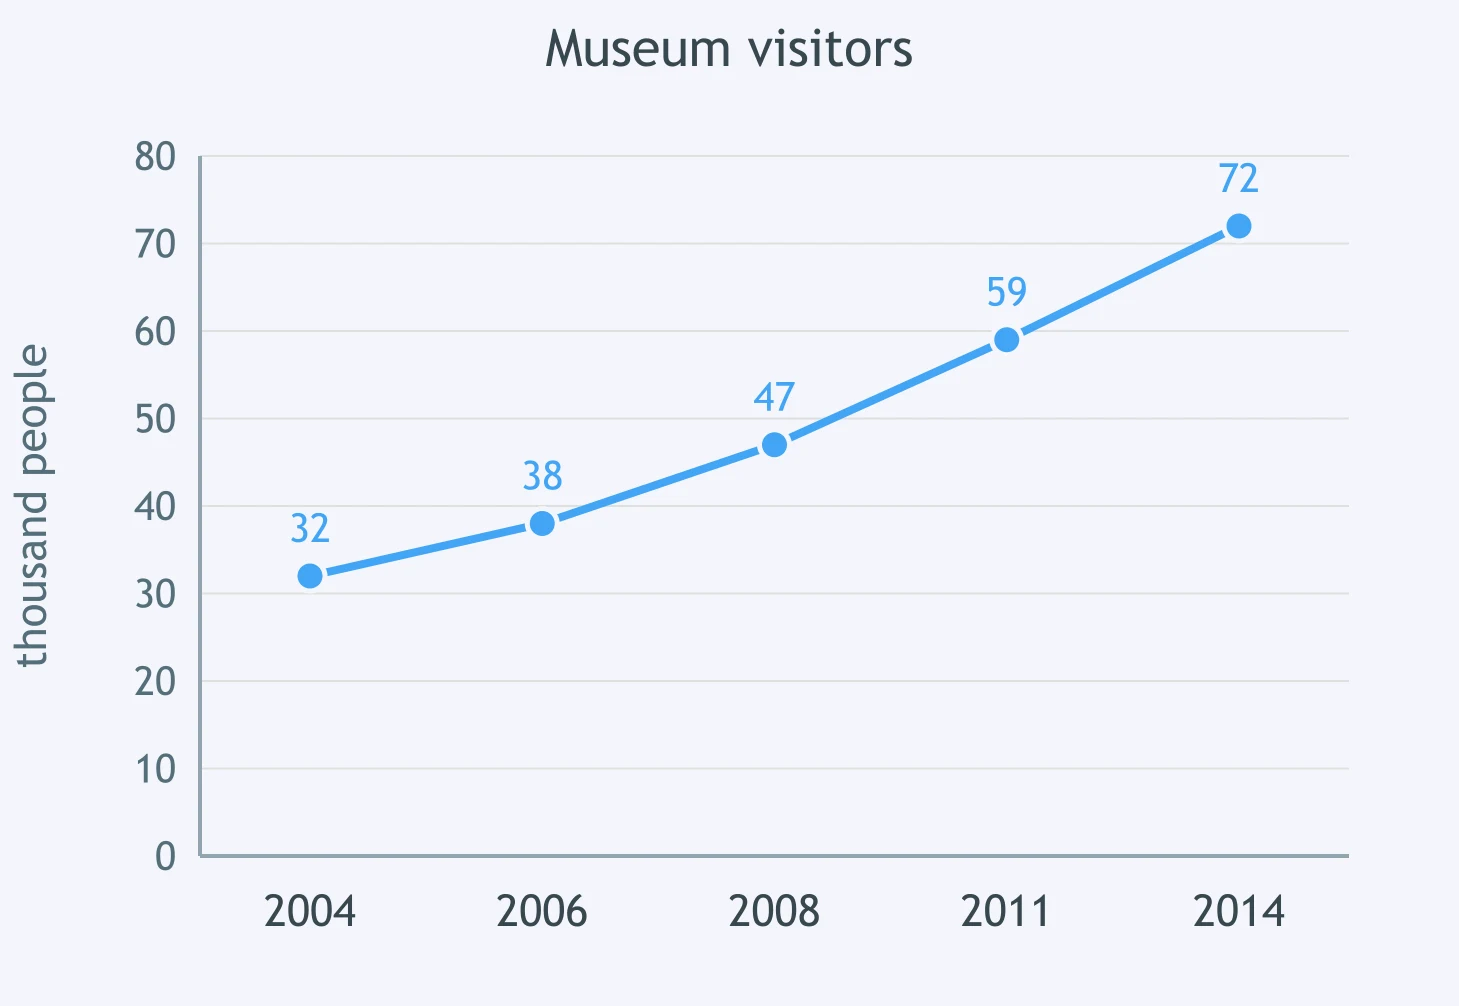
Use the chart for museum visitors. Fill the blank: Visitor numbers went up ___ 2004 to 2014.
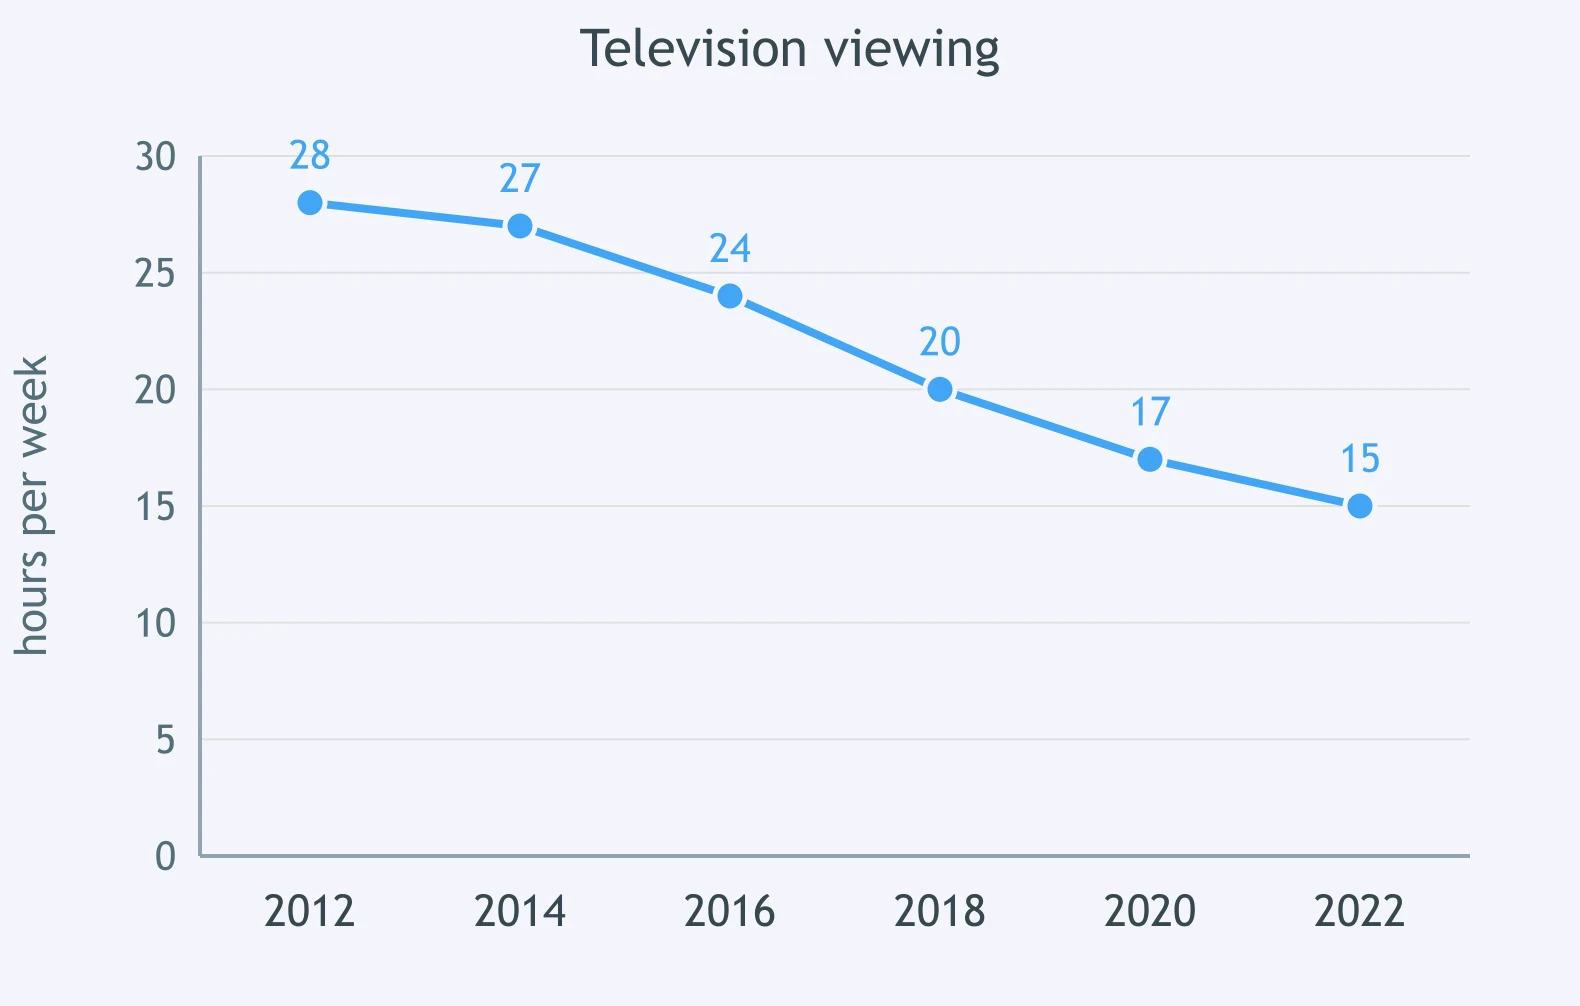
The figure tracks television viewing. Viewing time fell overall ___ 2012 and 2022. Choose the best preposition.
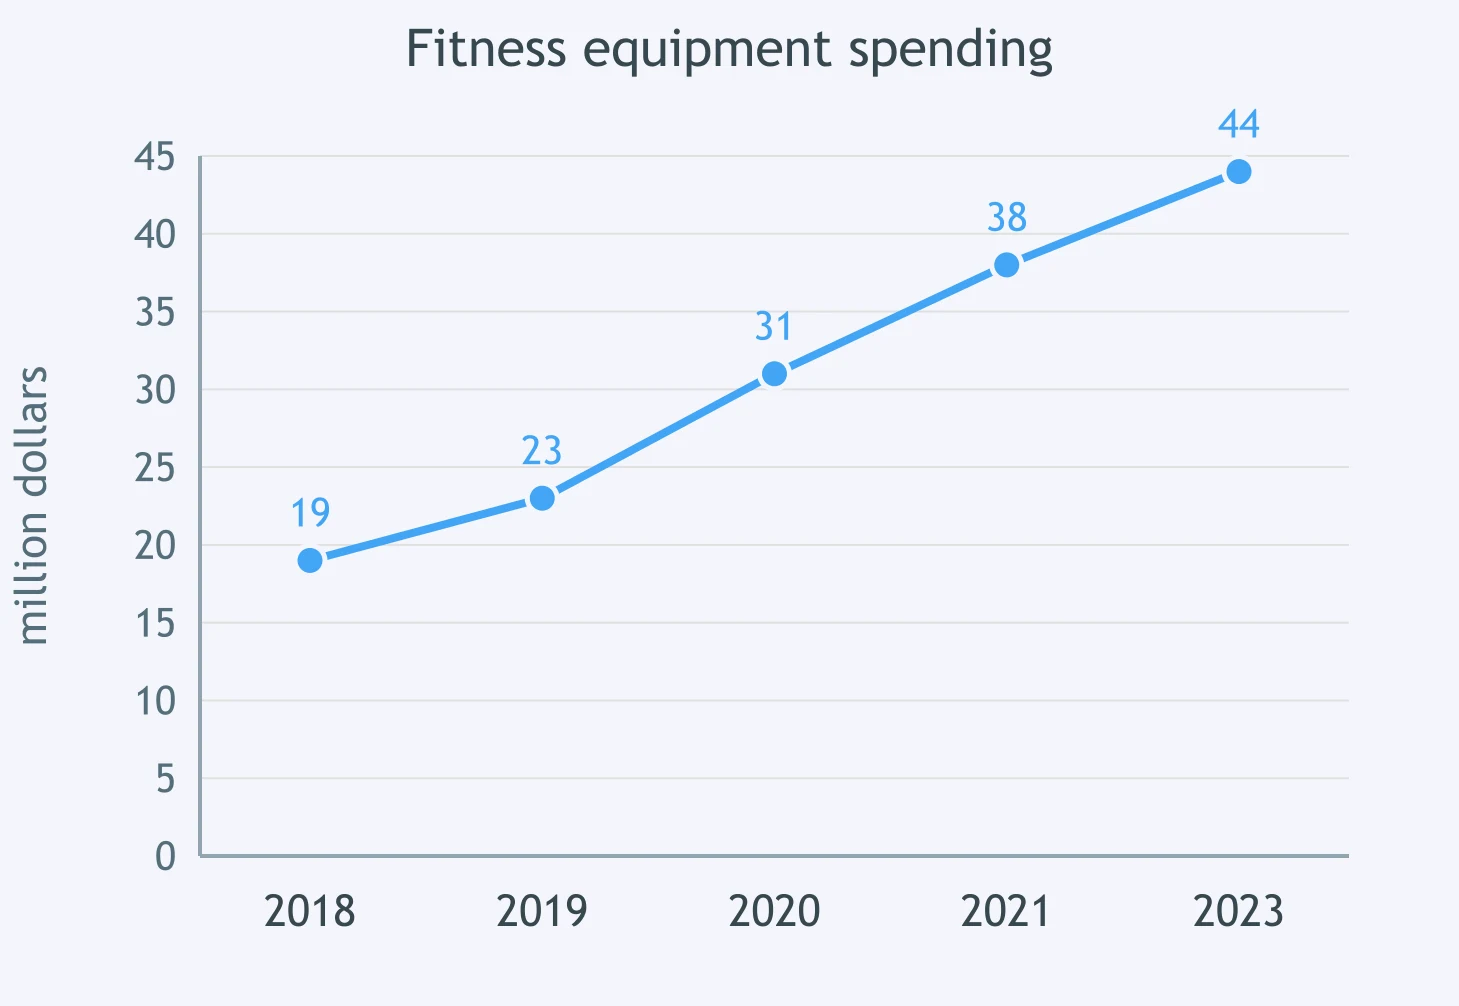
Look at spending on fitness equipment. Complete the sentence: Spending rose ___ 44 million dollars in 2023.
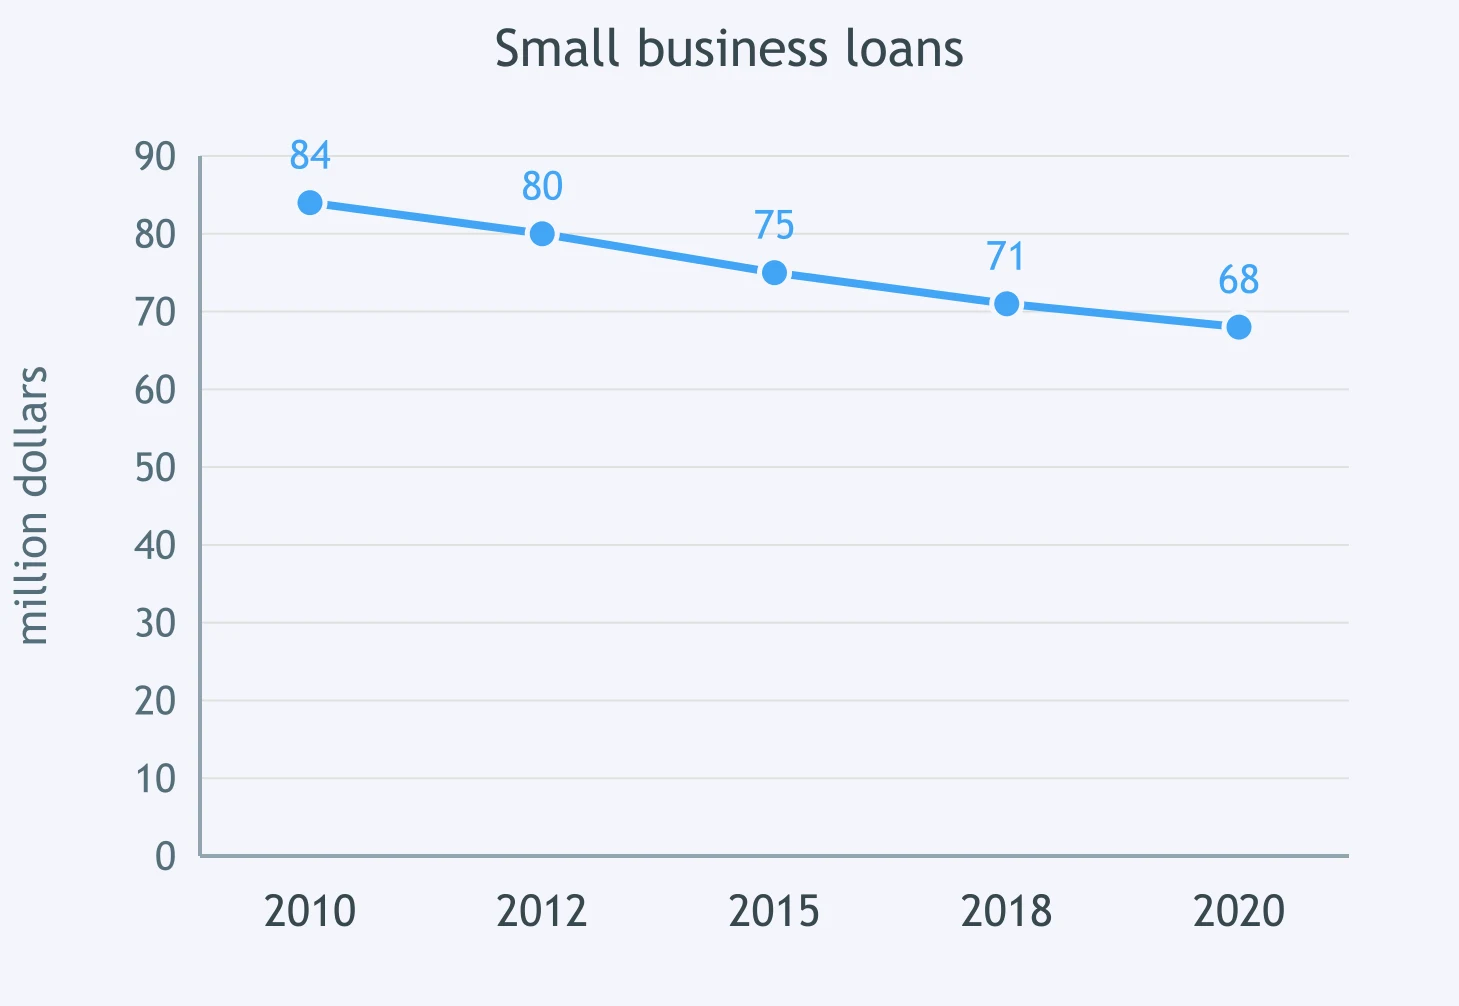
The figure is about small business loans. Complete: The total declined ___ 16 million dollars from 2010 to 2020.
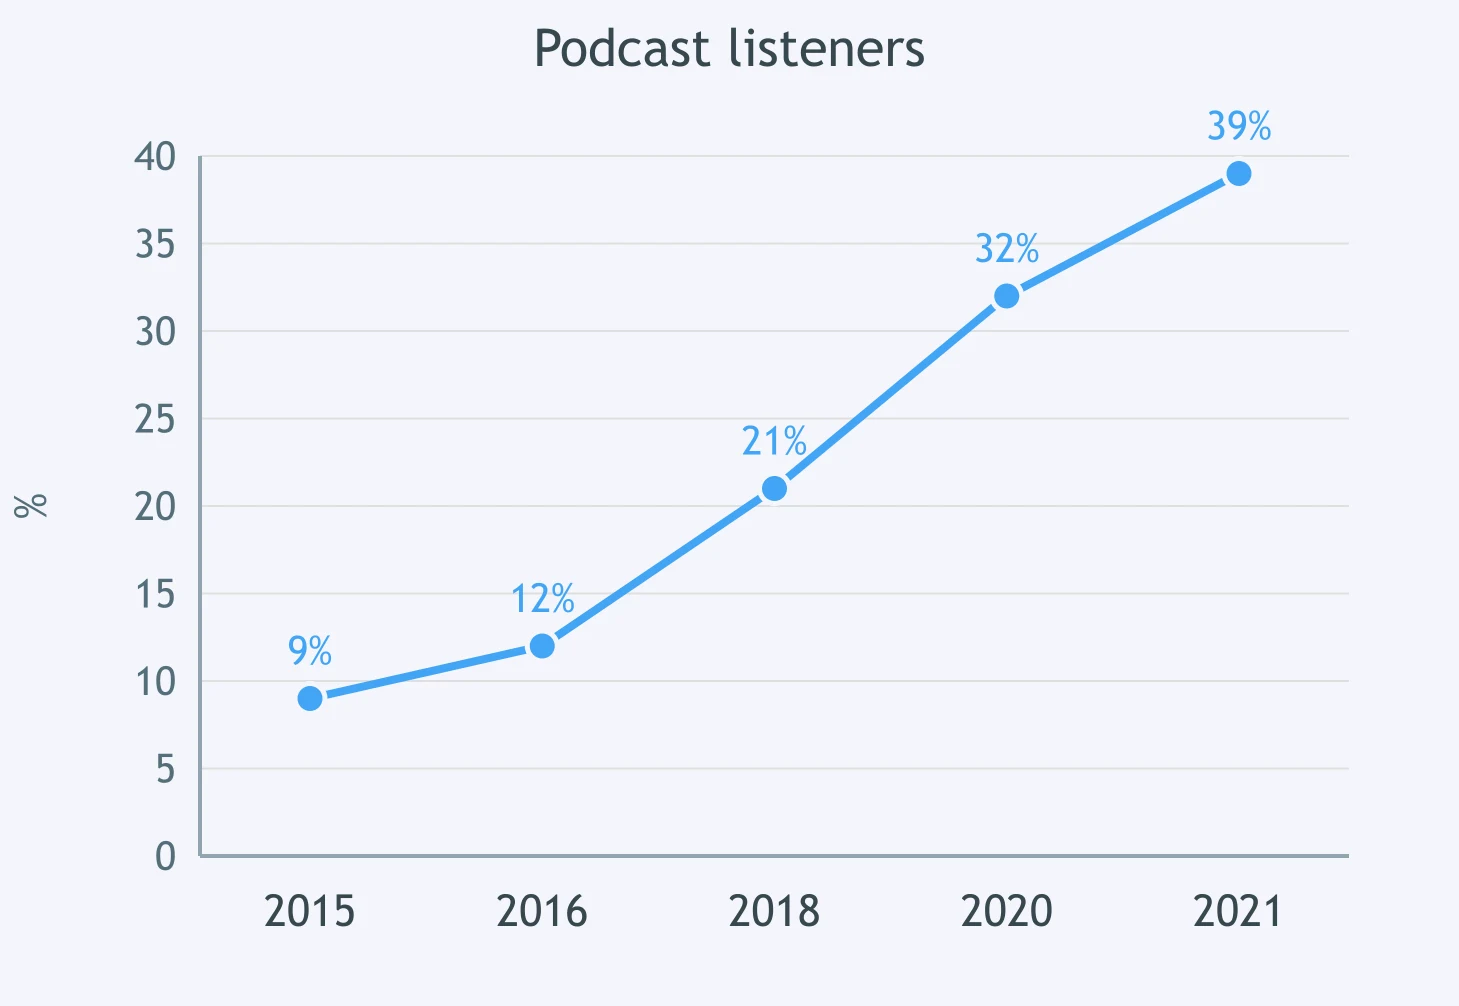
Read the chart showing podcast listeners. Complete: The percentage rose ___ 2015 to 2021.
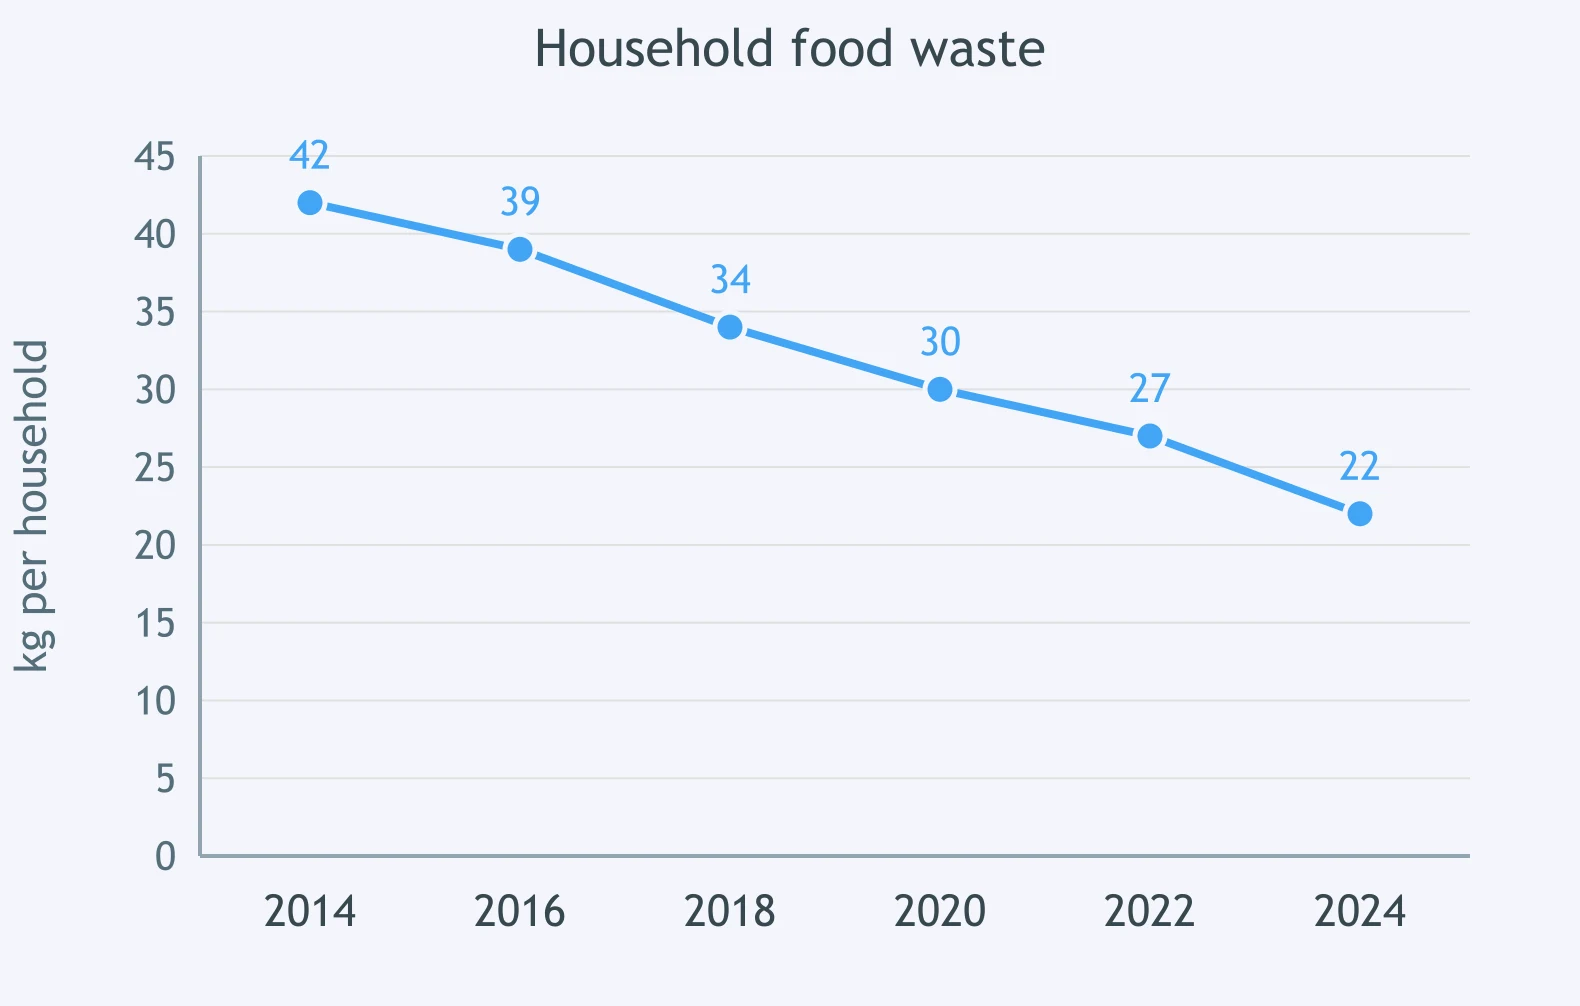
The chart follows household food waste. Food waste dropped clearly ___ 2014 and 2024. Which preposition is needed?
Crack the passcode before the zombies get in.
Answer, then swat bugs for bonus points.
Race through questions at your own speed.
Same question on every screen. Fastest wins.

Pick a tile, answer, hit bonuses and steals.
Accurate Data Sentence - IELTS 5.0 W T1
40 questions