Loading
by BlastRoom
IELTS Academic Writing Task 1. rise, fall, level off, fluctuate.
#writing_task_1#ielts_5_0
40 questions
One question set, multiple game modes. Tap any game to see it in action. Not sure which to pick?
Answer to place stones and capture territory.
Outrun the snow together.
Earn blasts, then hunt the other team.
Answer to earn energy, then climb.

The class blasts through walls together.
Bid on mystery lots. Most money wins.
Sell tours. Nice, standard, or a total scam.

Answer, restock, and serve the rush.
More correct answers pulls the rope your way.
Answer, then shoot down the alien wave.
Answer, then tap to leap the frozen ridge.
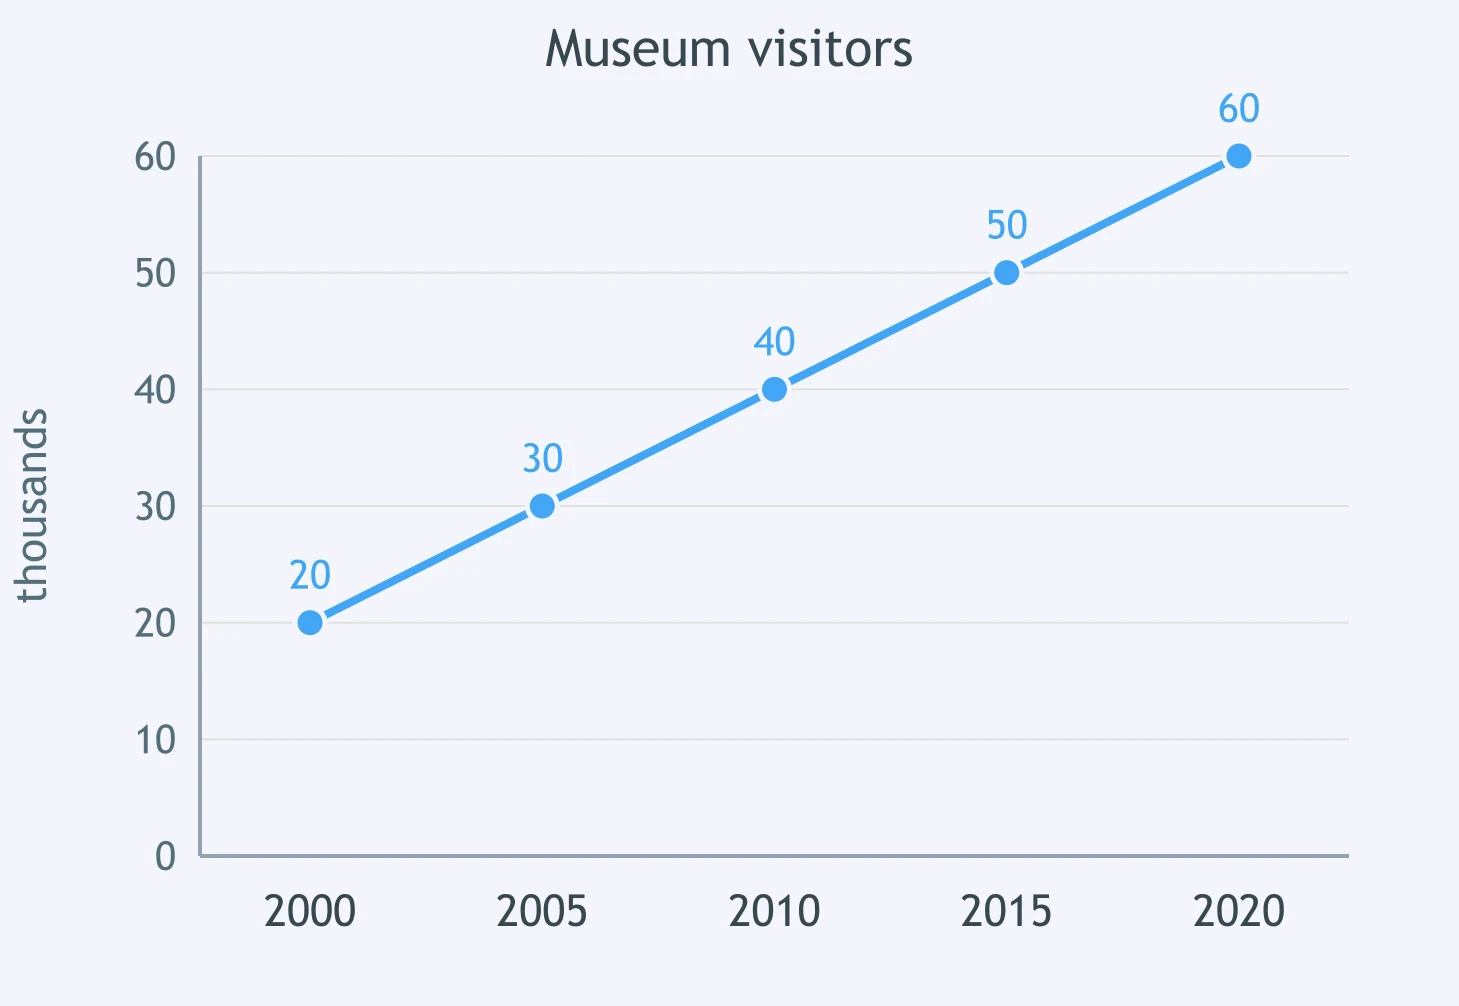
The line graph shows museum visitors from 2000 to 2020. Over this period, figures ___.
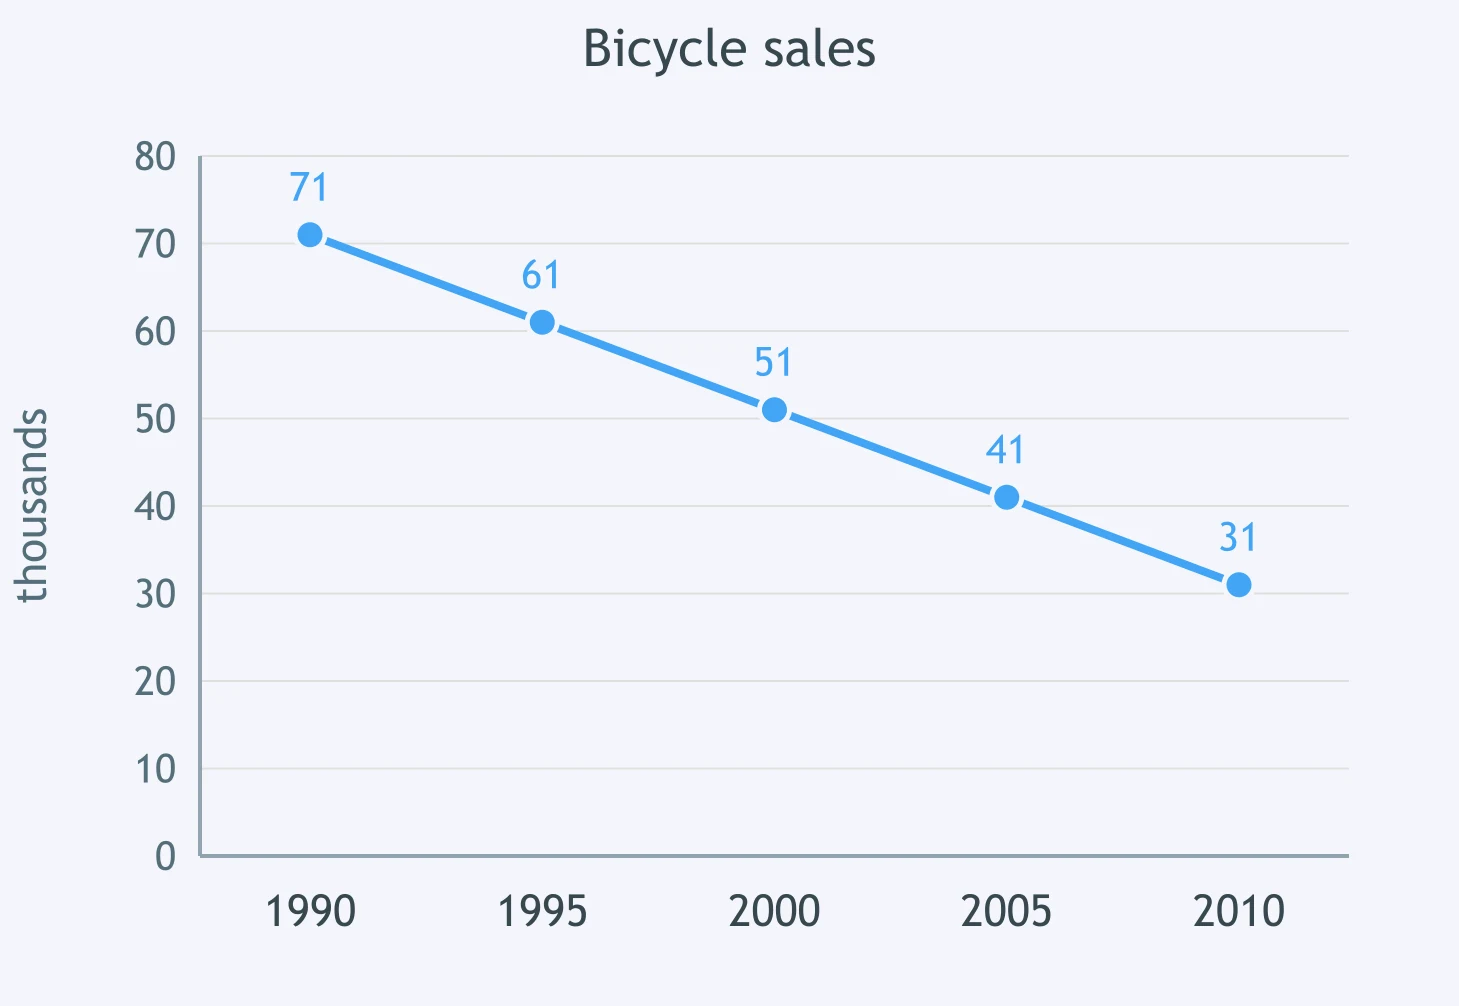
Look at the chart. Between 1990 and 2010, bicycle sales ___.
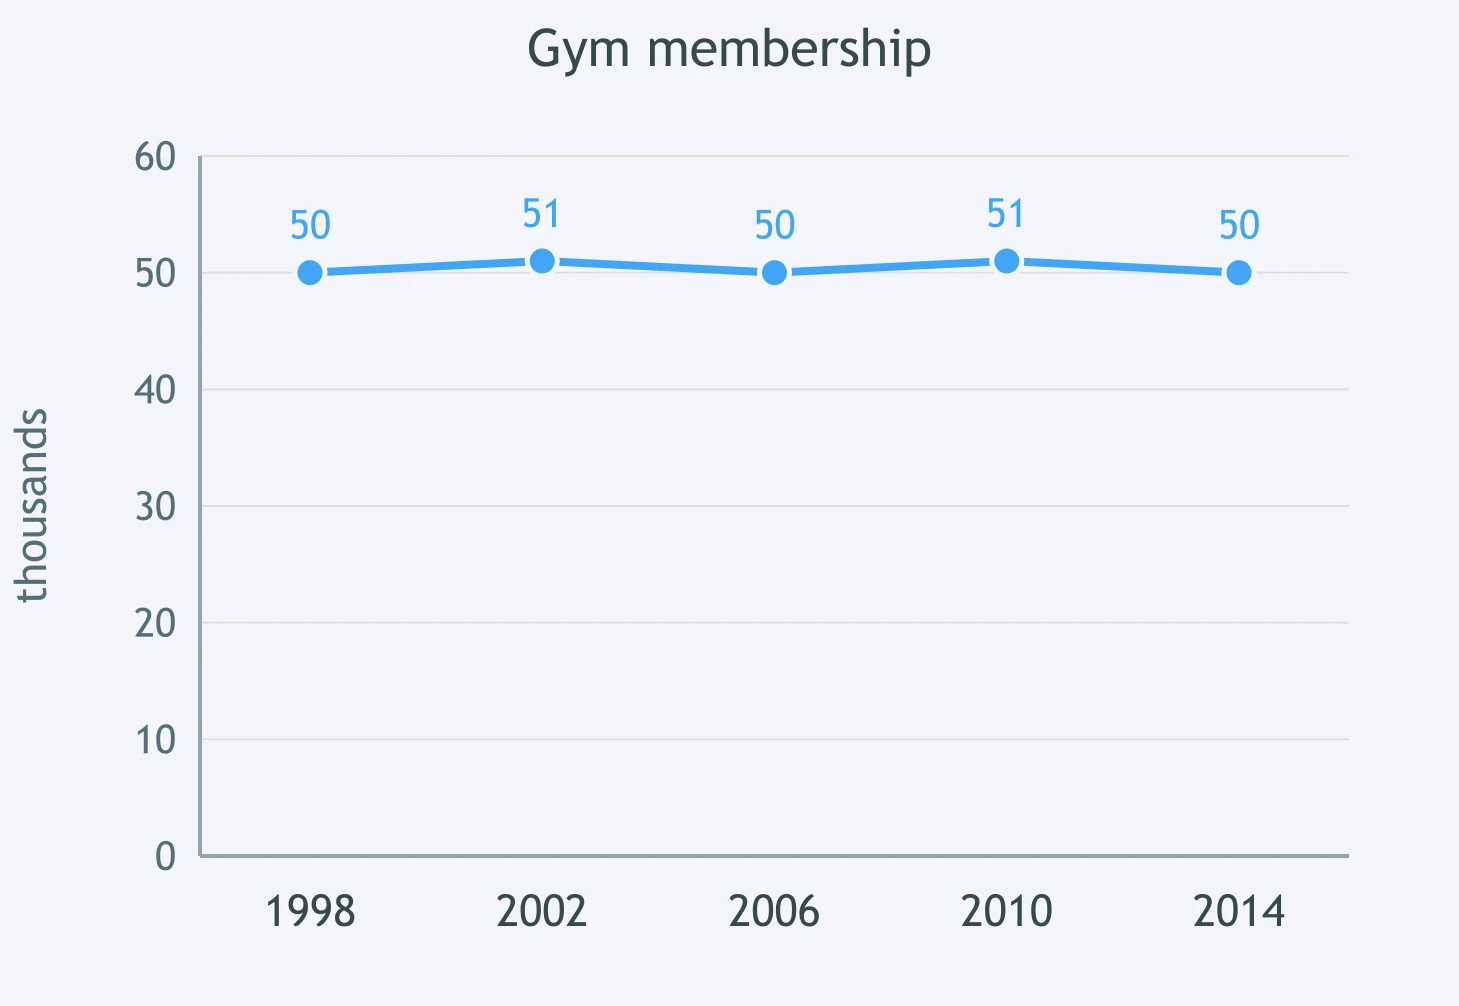
Complete the description of the graph: gym membership ___ across the period from 1998 to 2014.
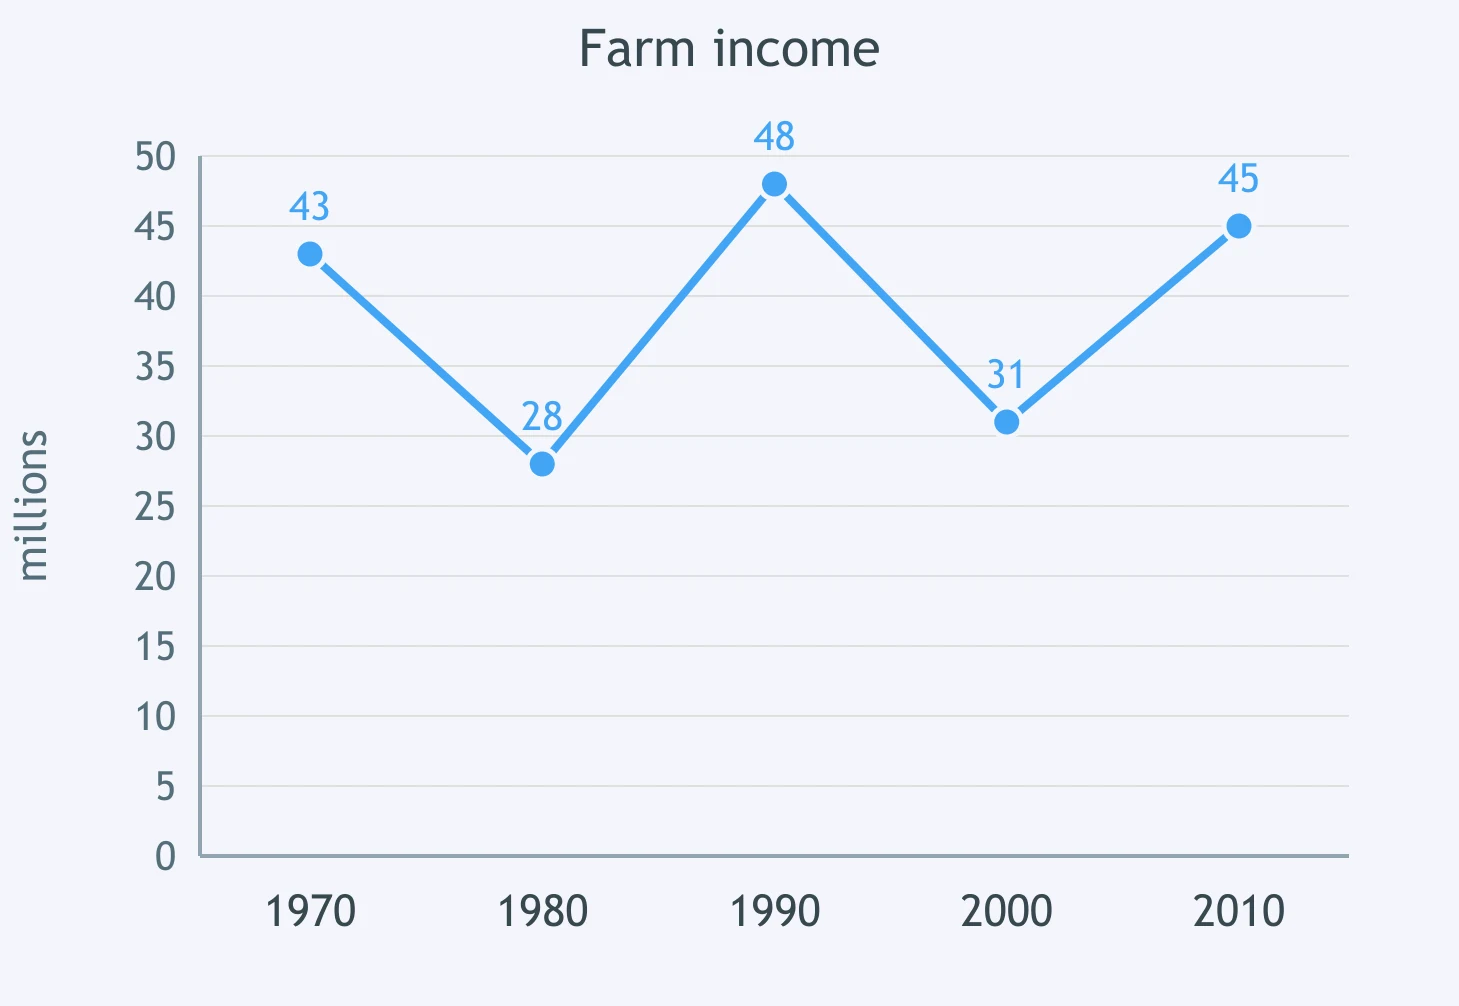
Farm income ___ over the 40-year period from 1970 to 2010.
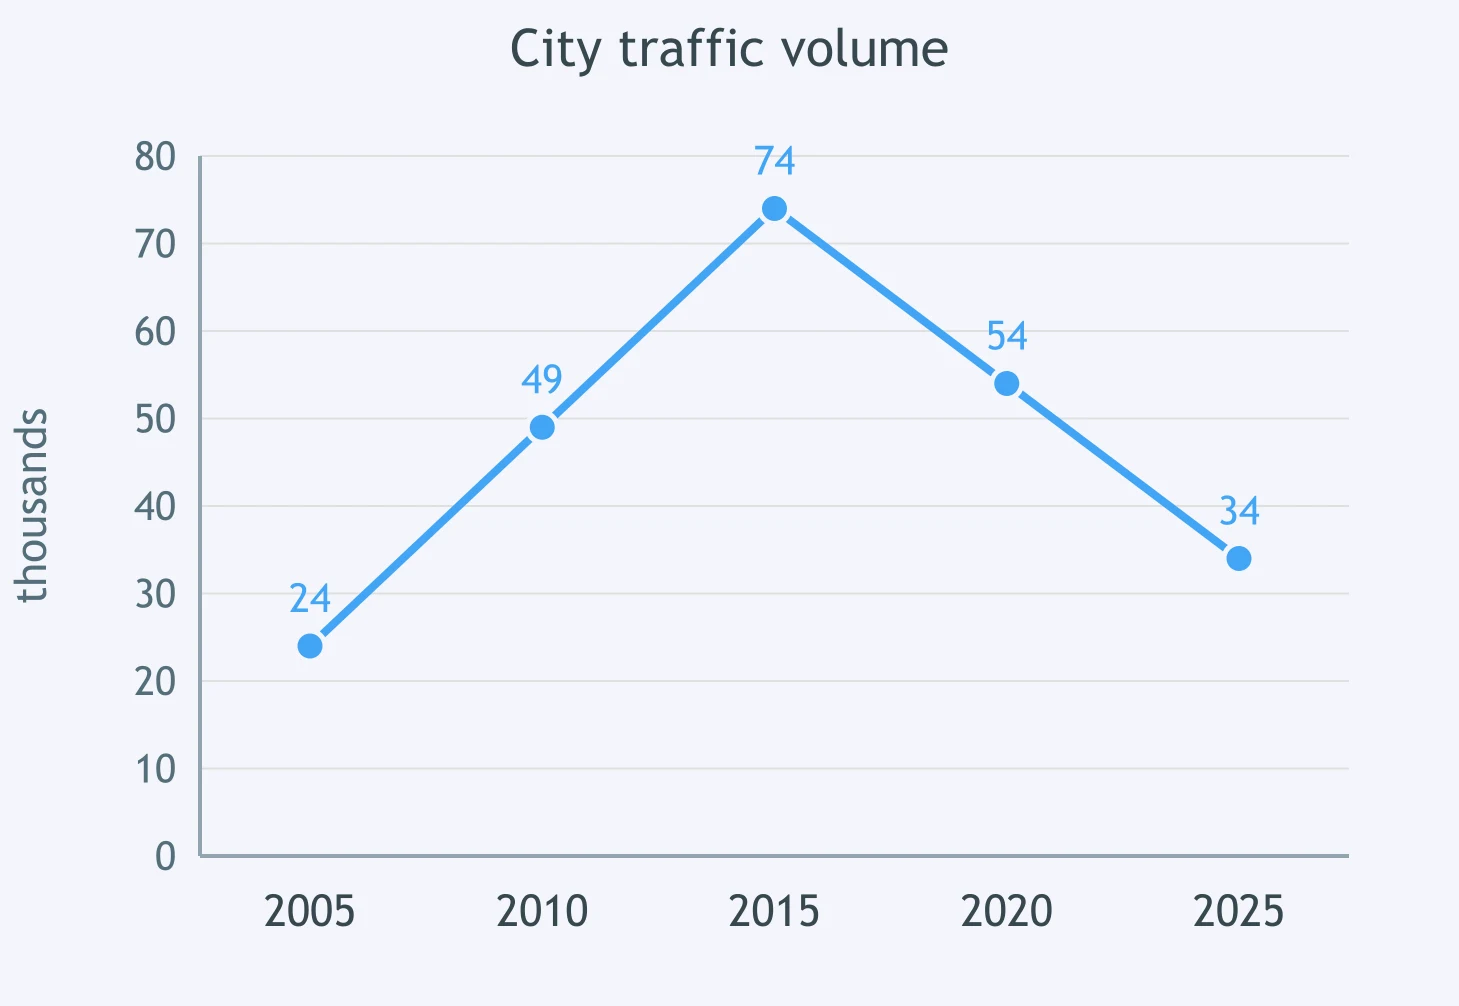
Look at the chart of city traffic. Traffic ___.
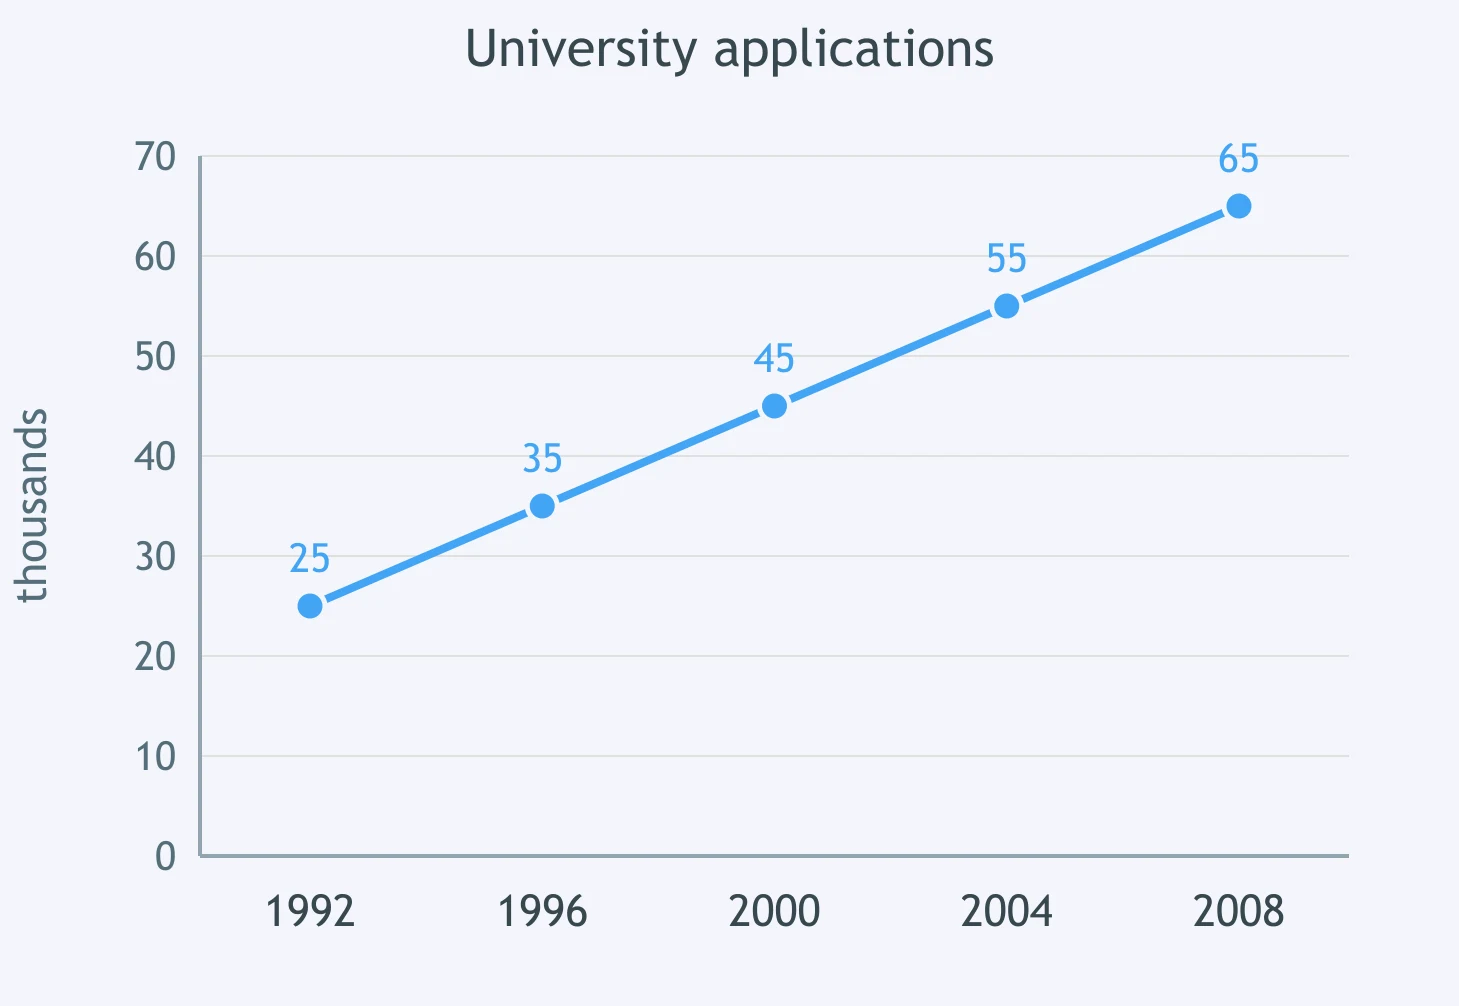
The line graph shows university applications from 1992 to 2008. Over this period, figures ___.
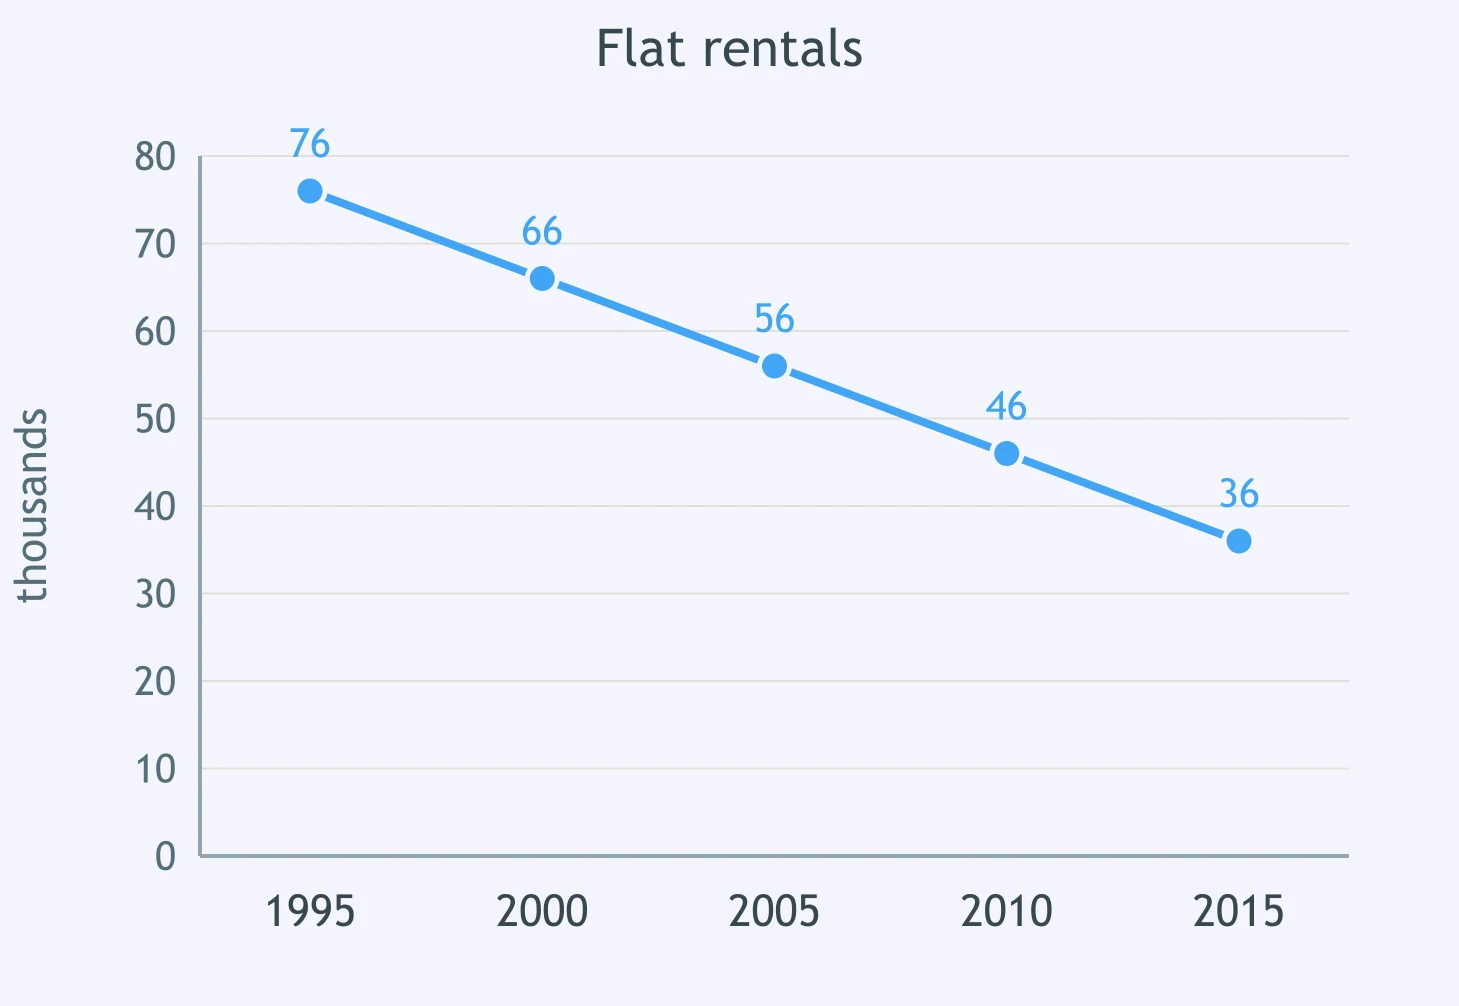
Look at the chart. Between 1995 and 2015, flat rentals ___.
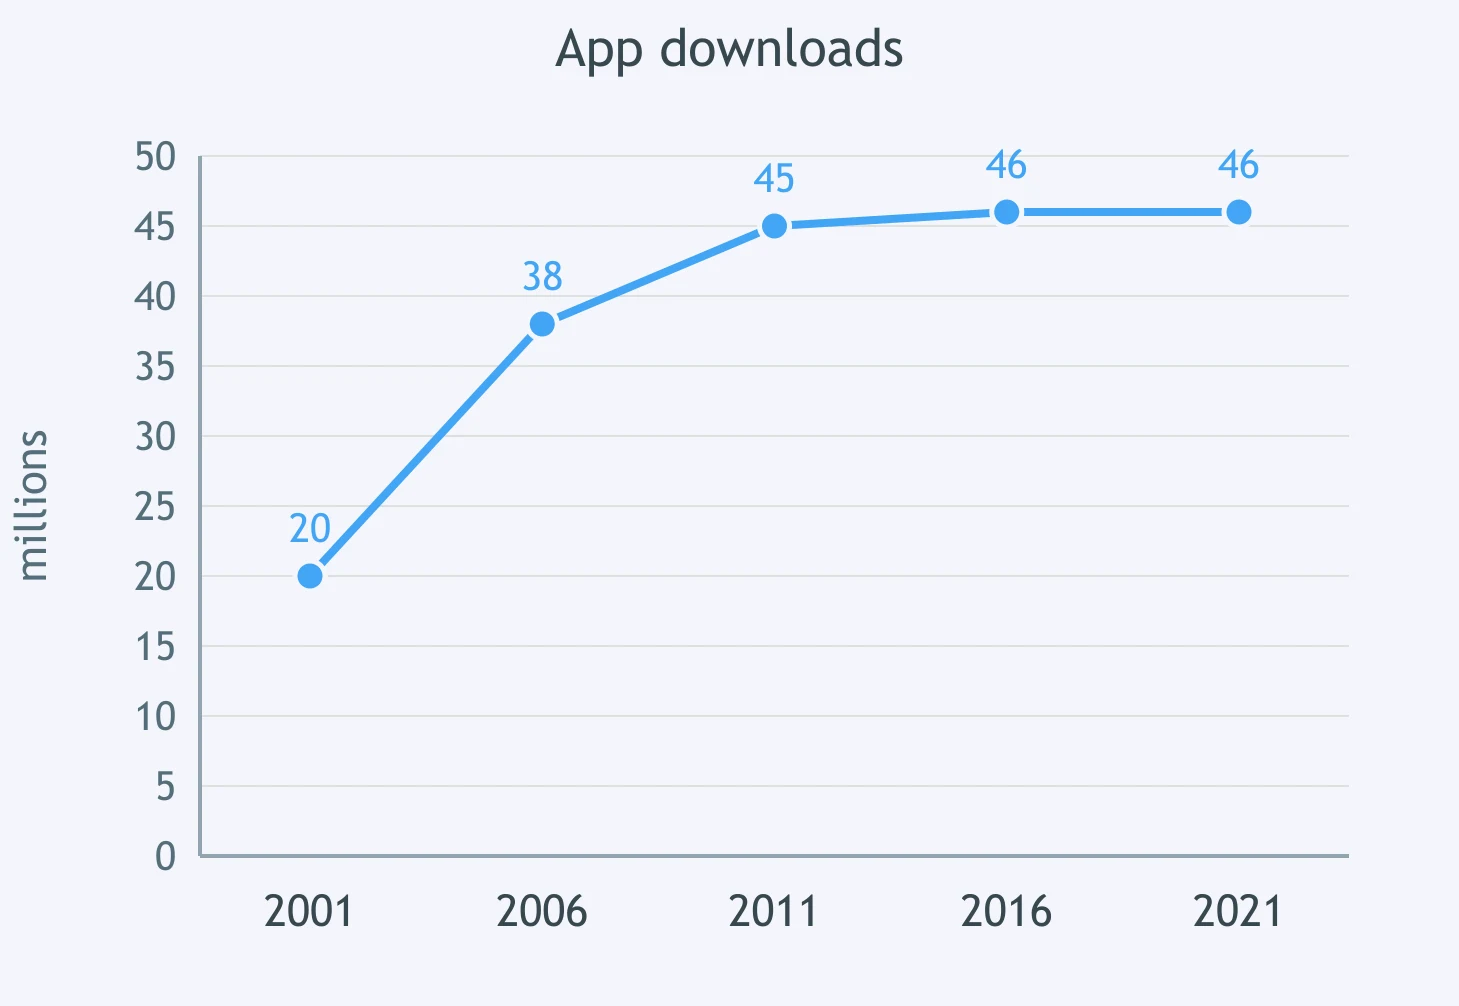
Complete the description of the graph: app downloads ___ across the period from 2001 to 2021.
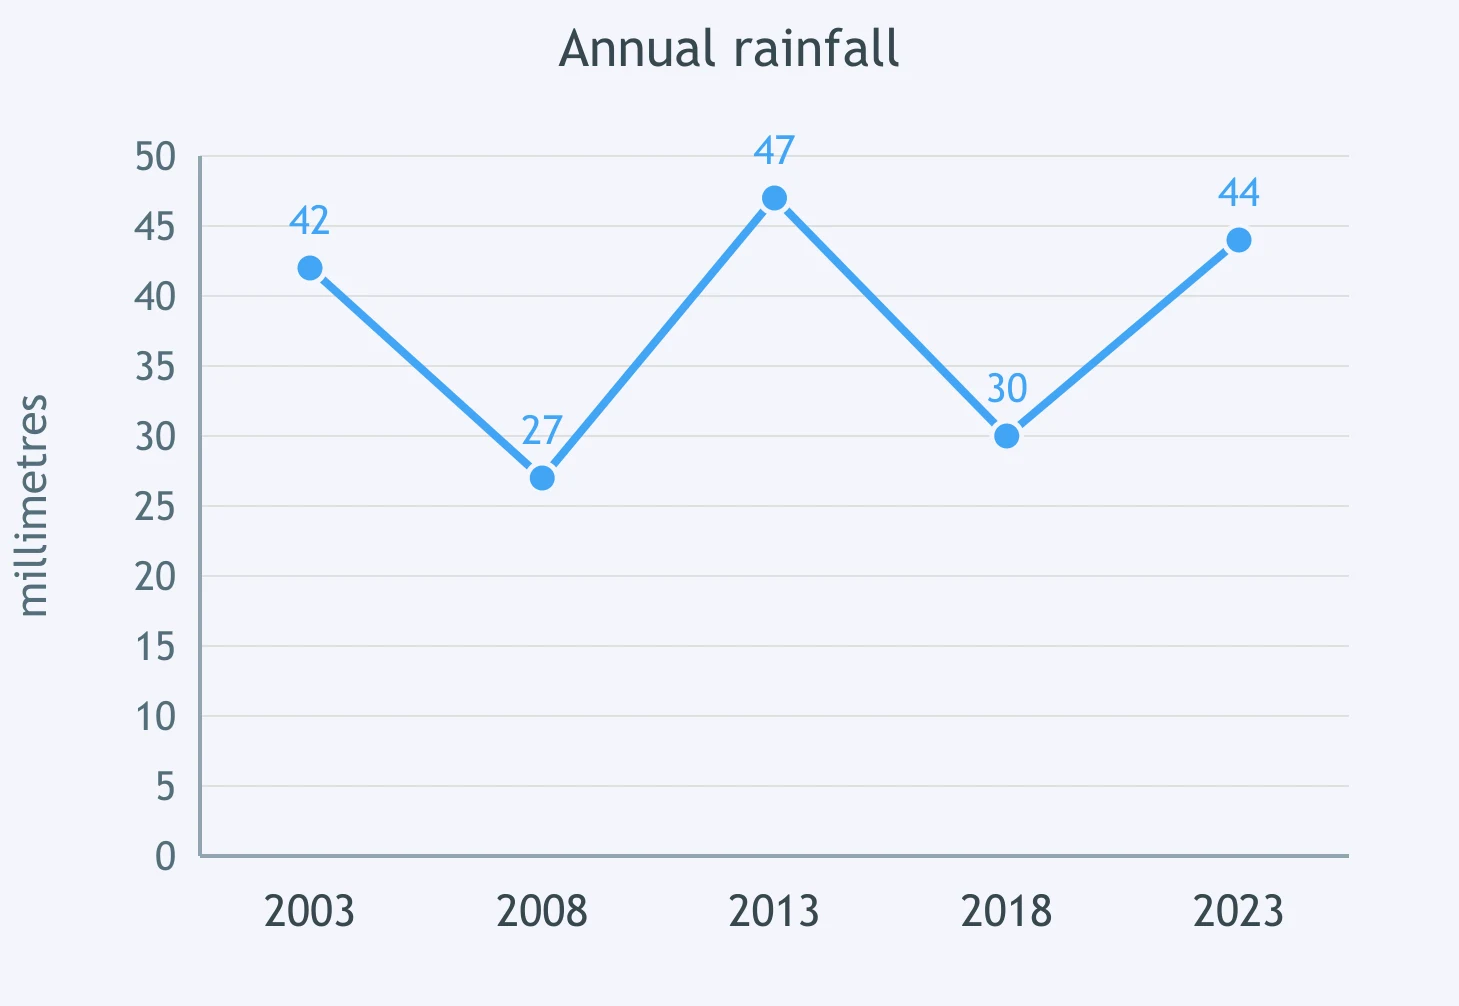
Rainfall ___ over the 20-year period from 2003 to 2023.
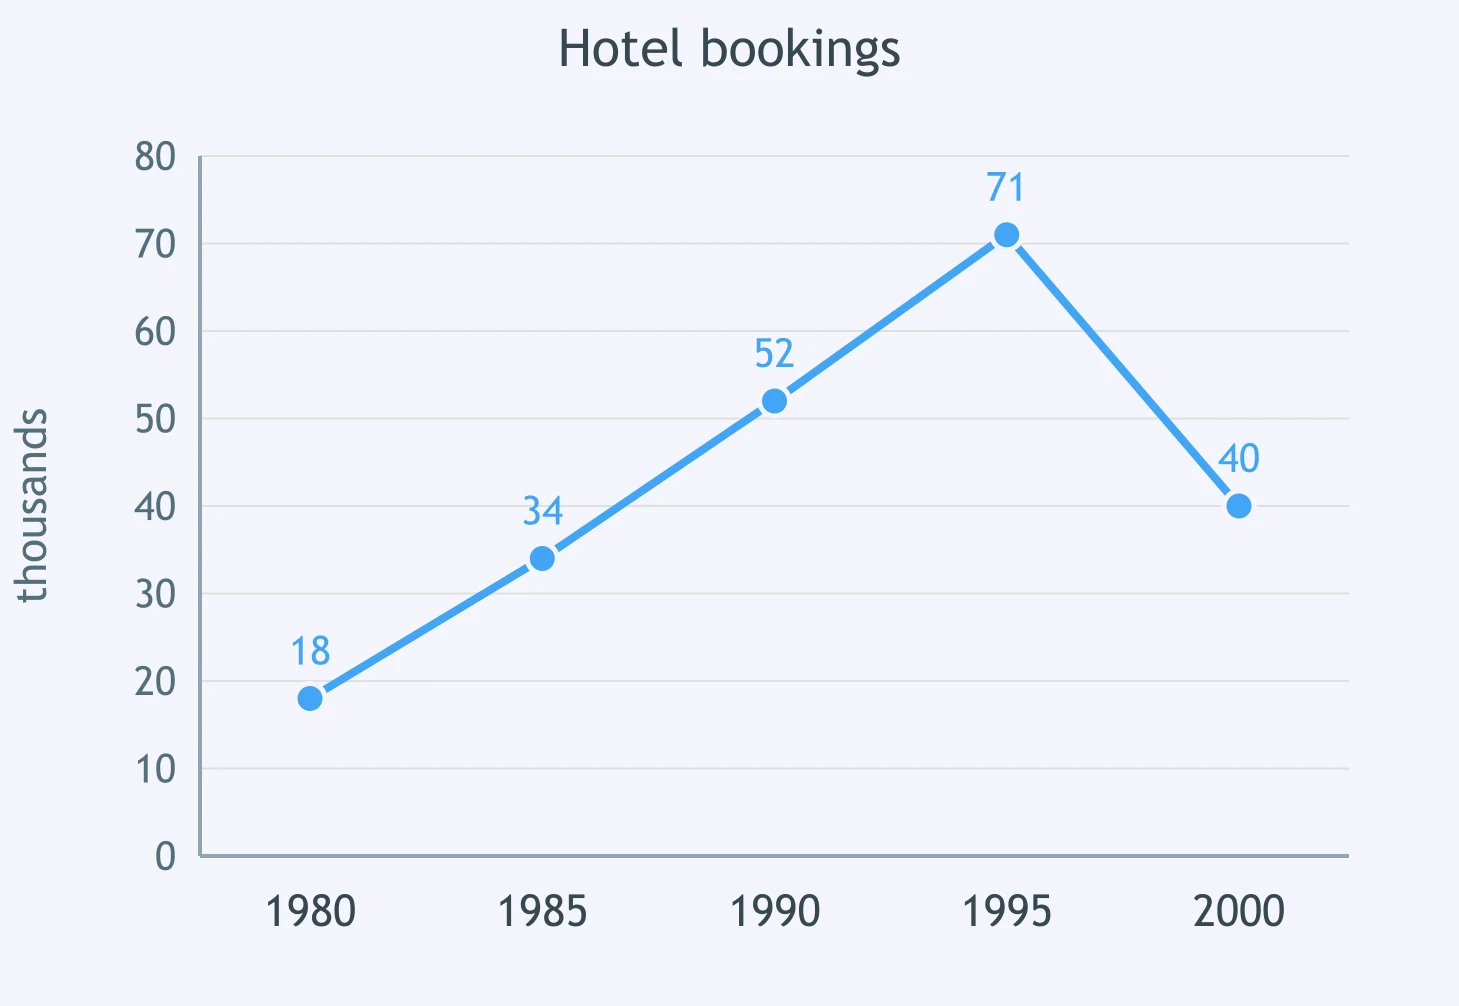
The graph tracks hotel bookings. Hotel bookings ___.
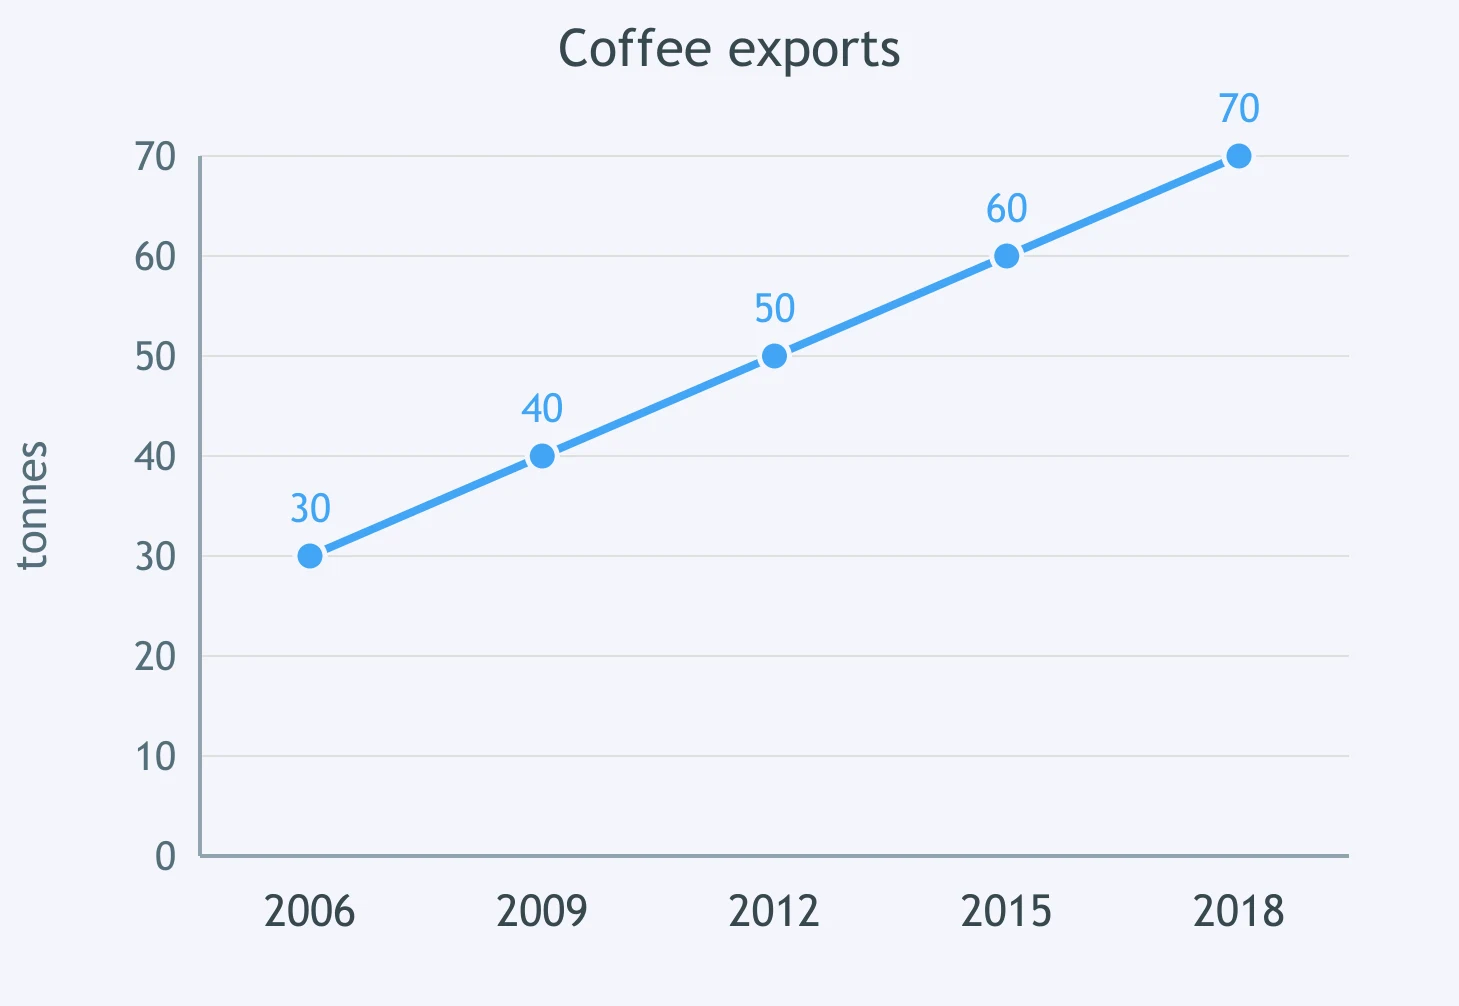
The line graph shows coffee exports from 2006 to 2018. Over this period, figures ___.
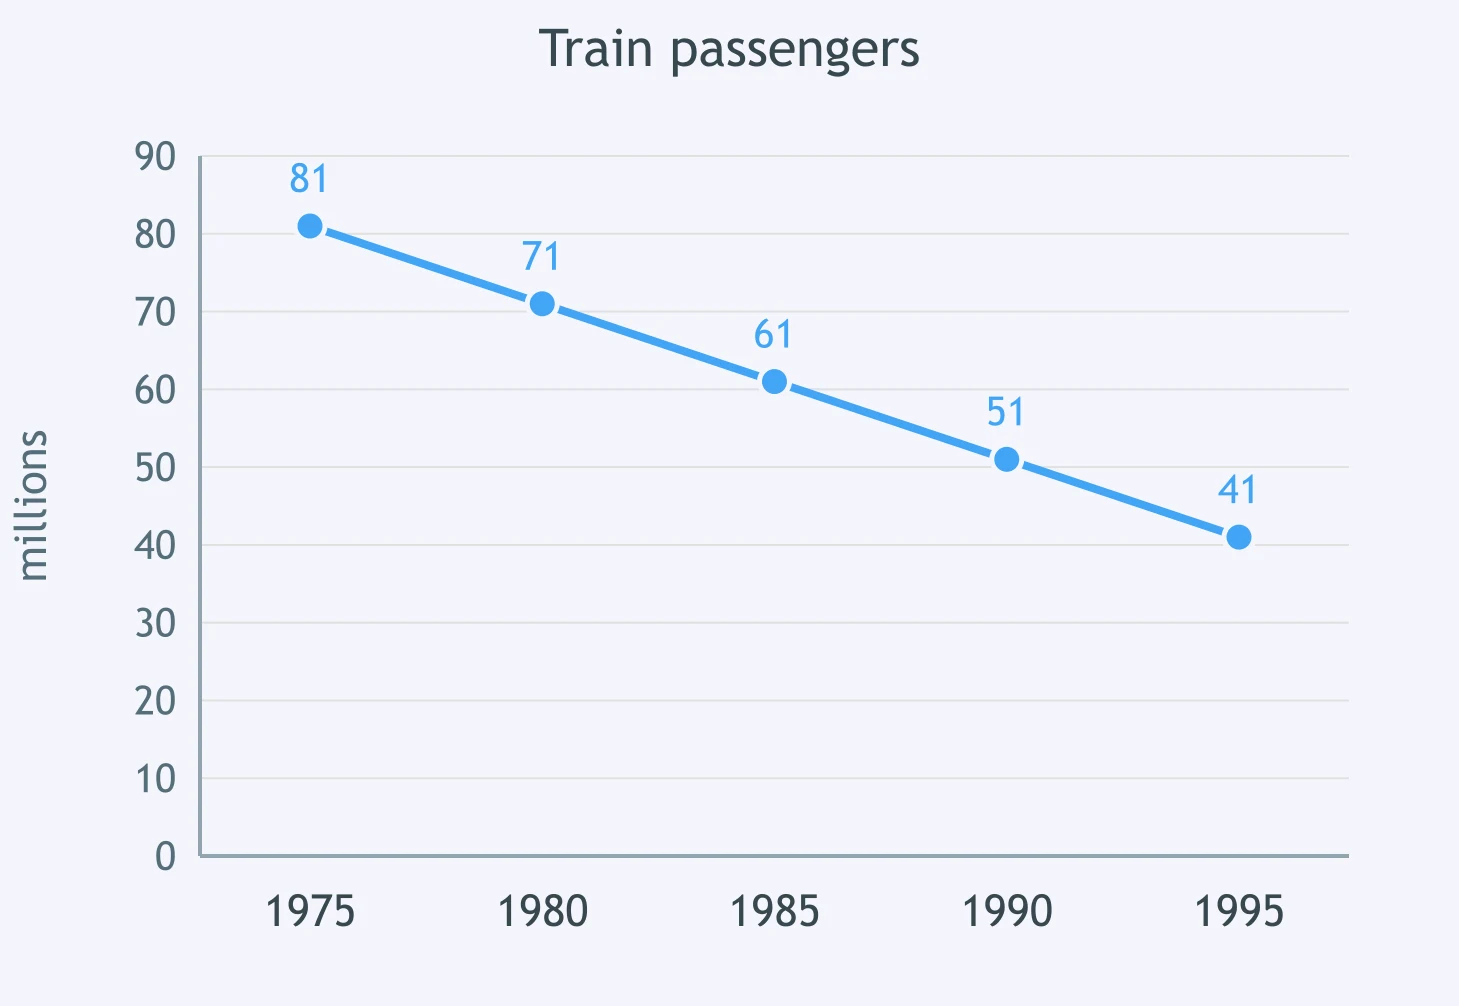
Look at the chart. Between 1975 and 1995, train passengers ___.
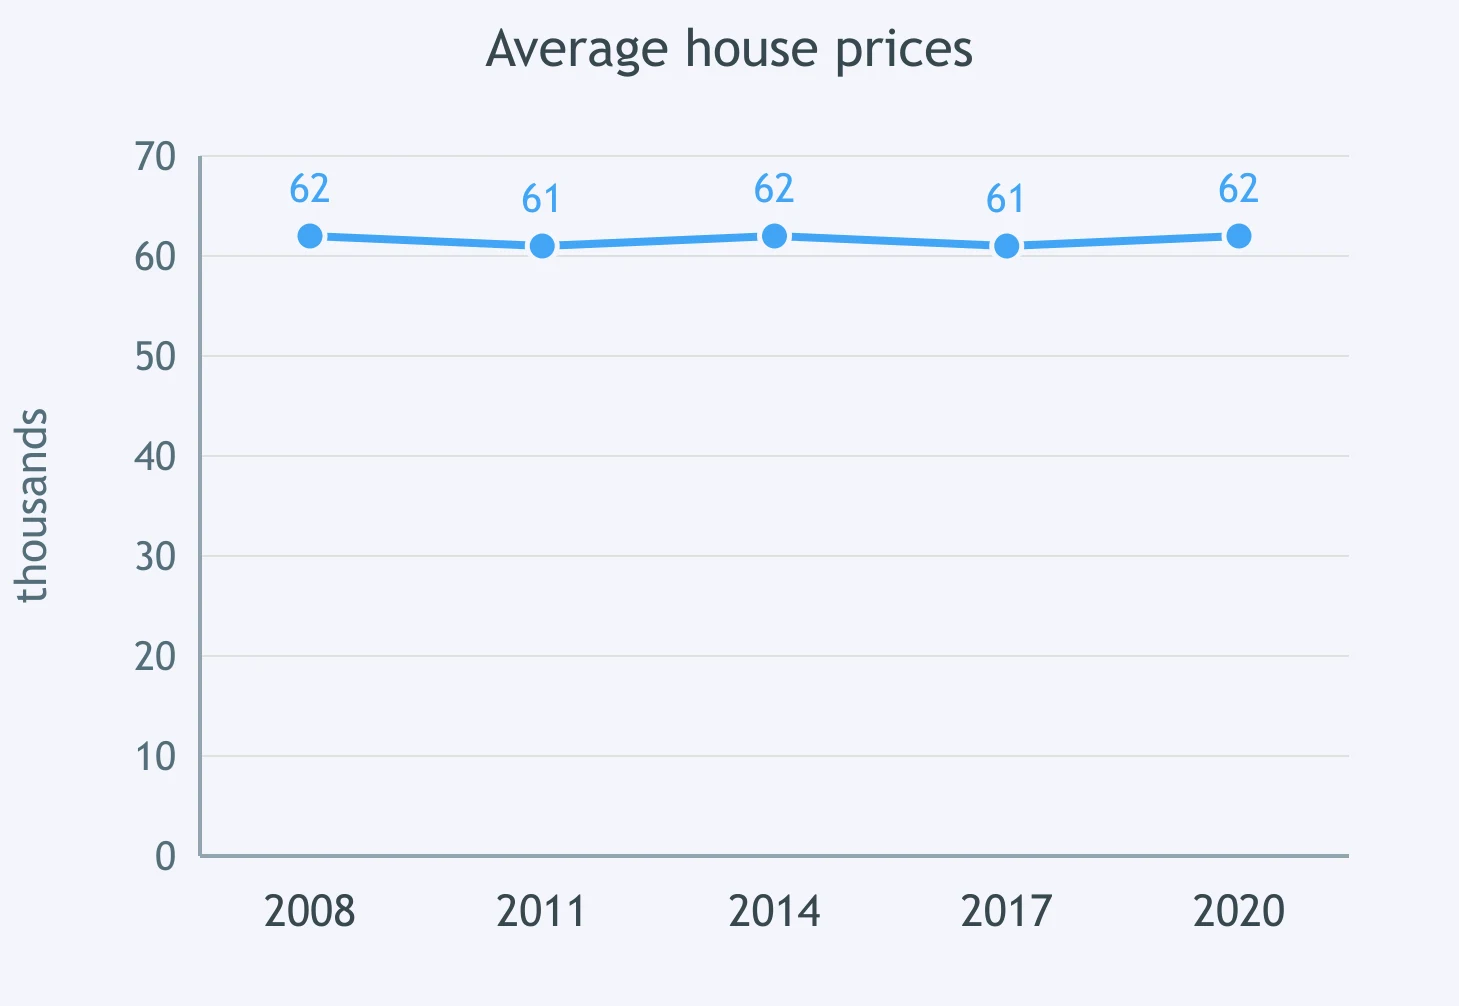
Complete the description of the graph: house prices ___ across the period from 2008 to 2020.
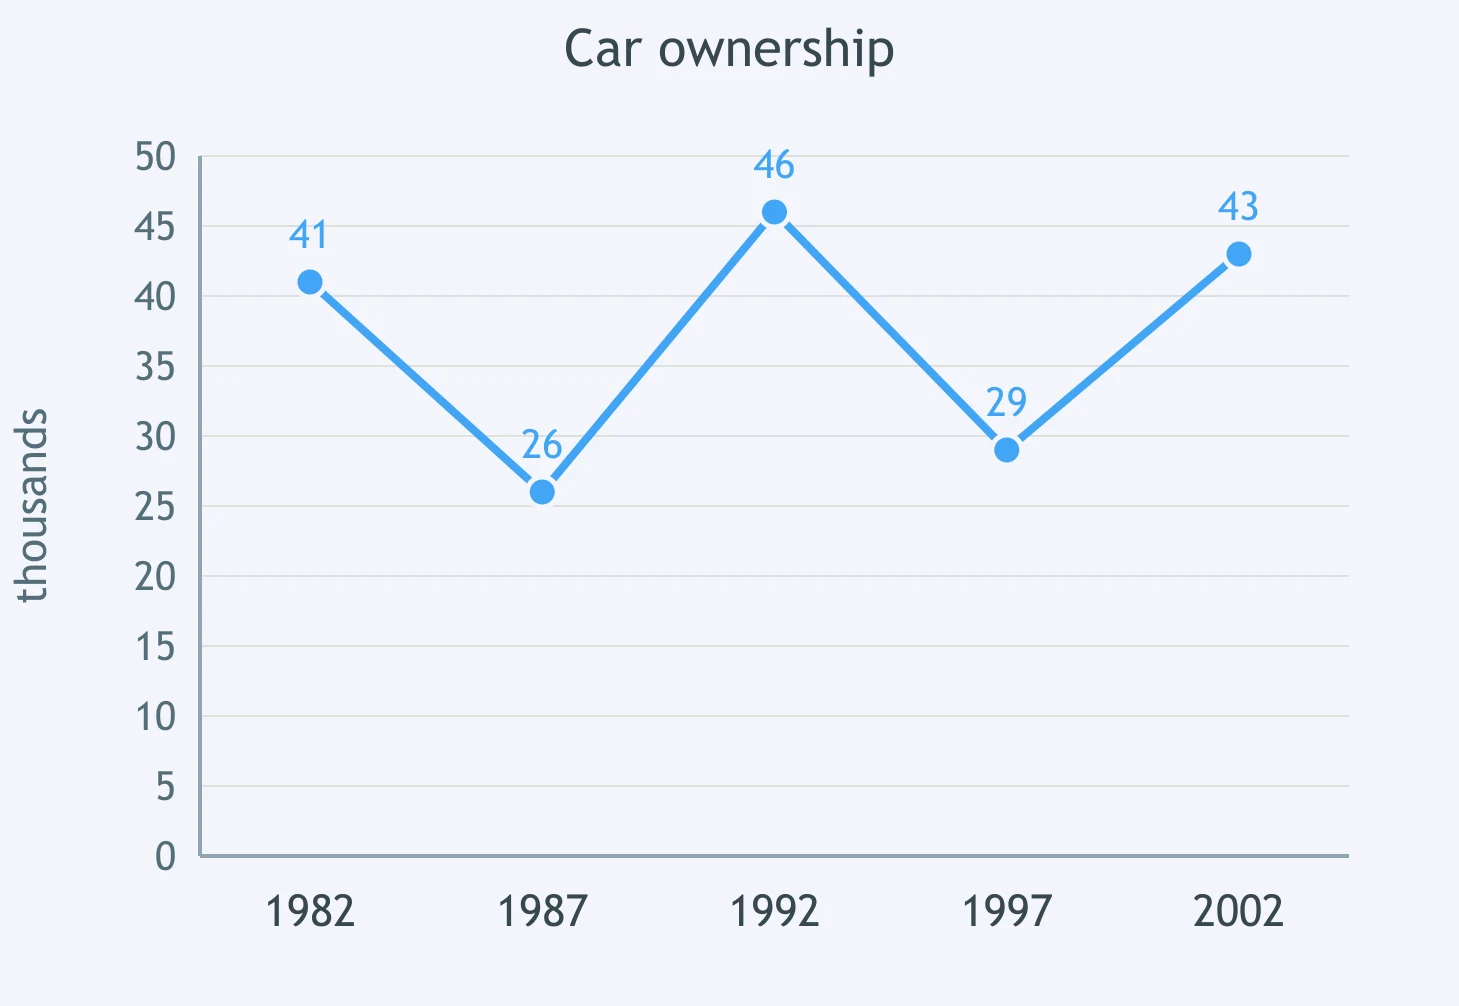
Car ownership ___ over the 20-year period from 1982 to 2002.
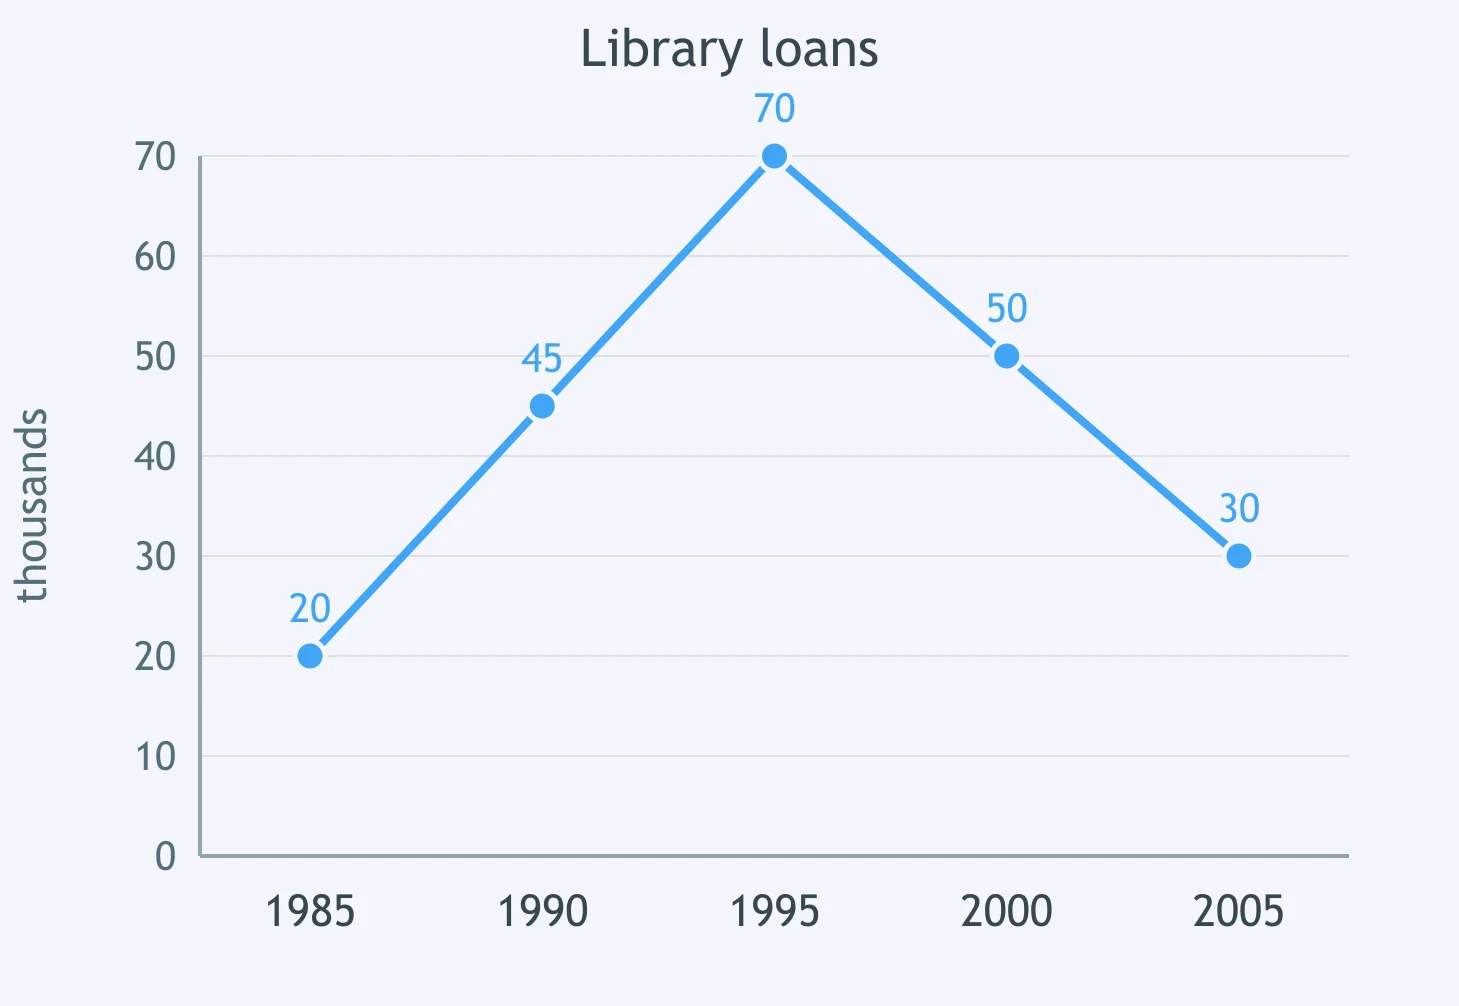
Describe the shape of this graph: library loans ___.
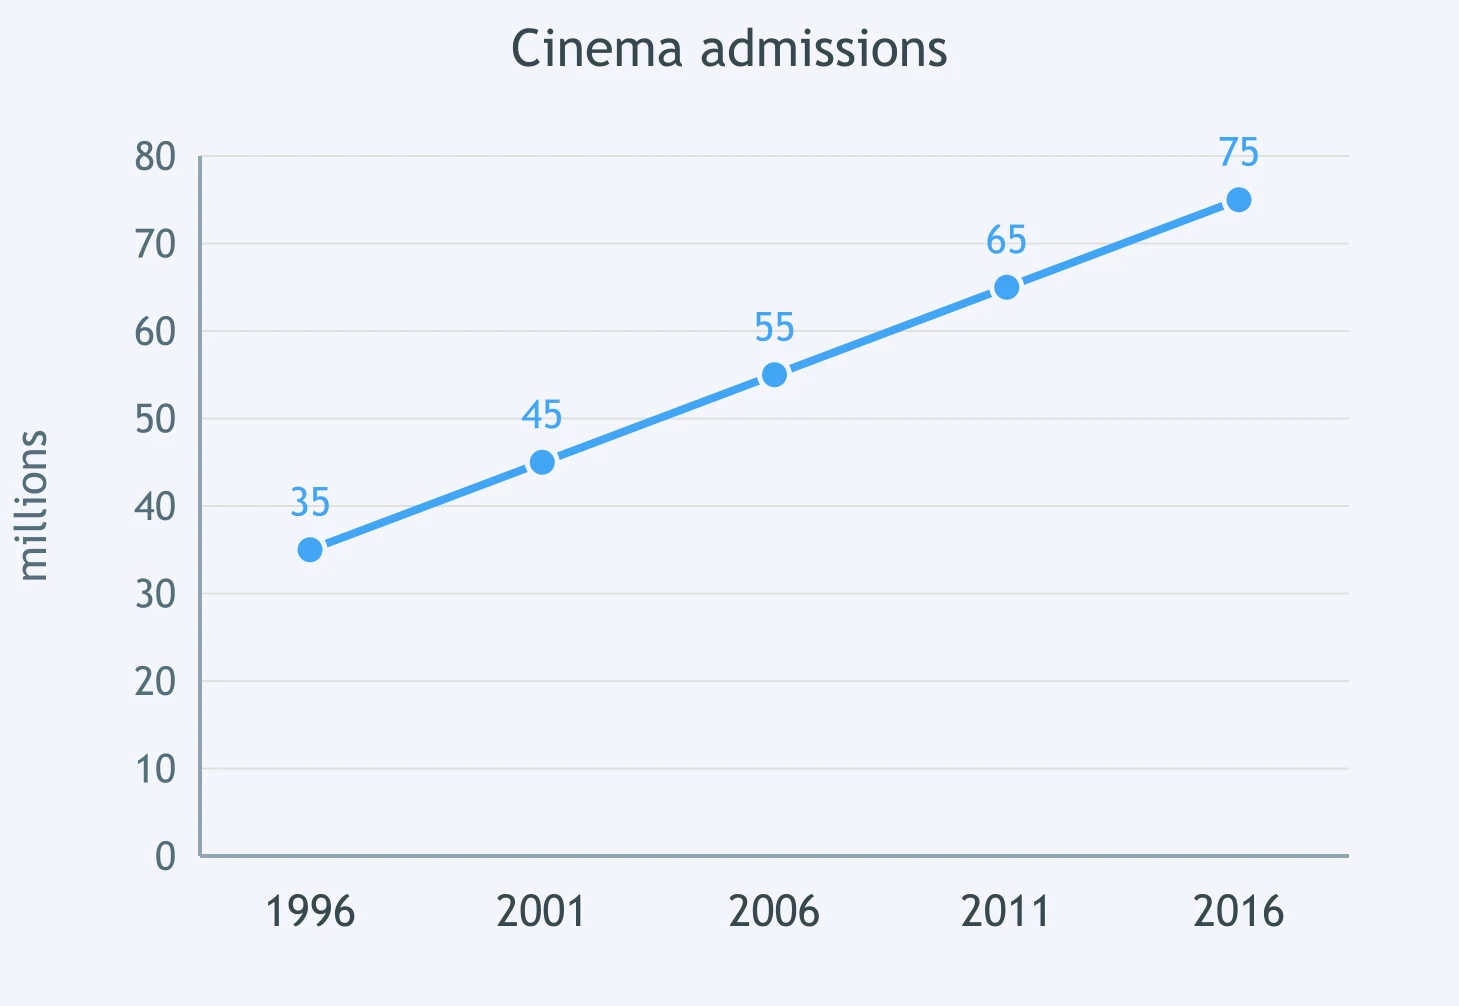
The line graph shows cinema admissions from 1996 to 2016. Over this period, figures ___.
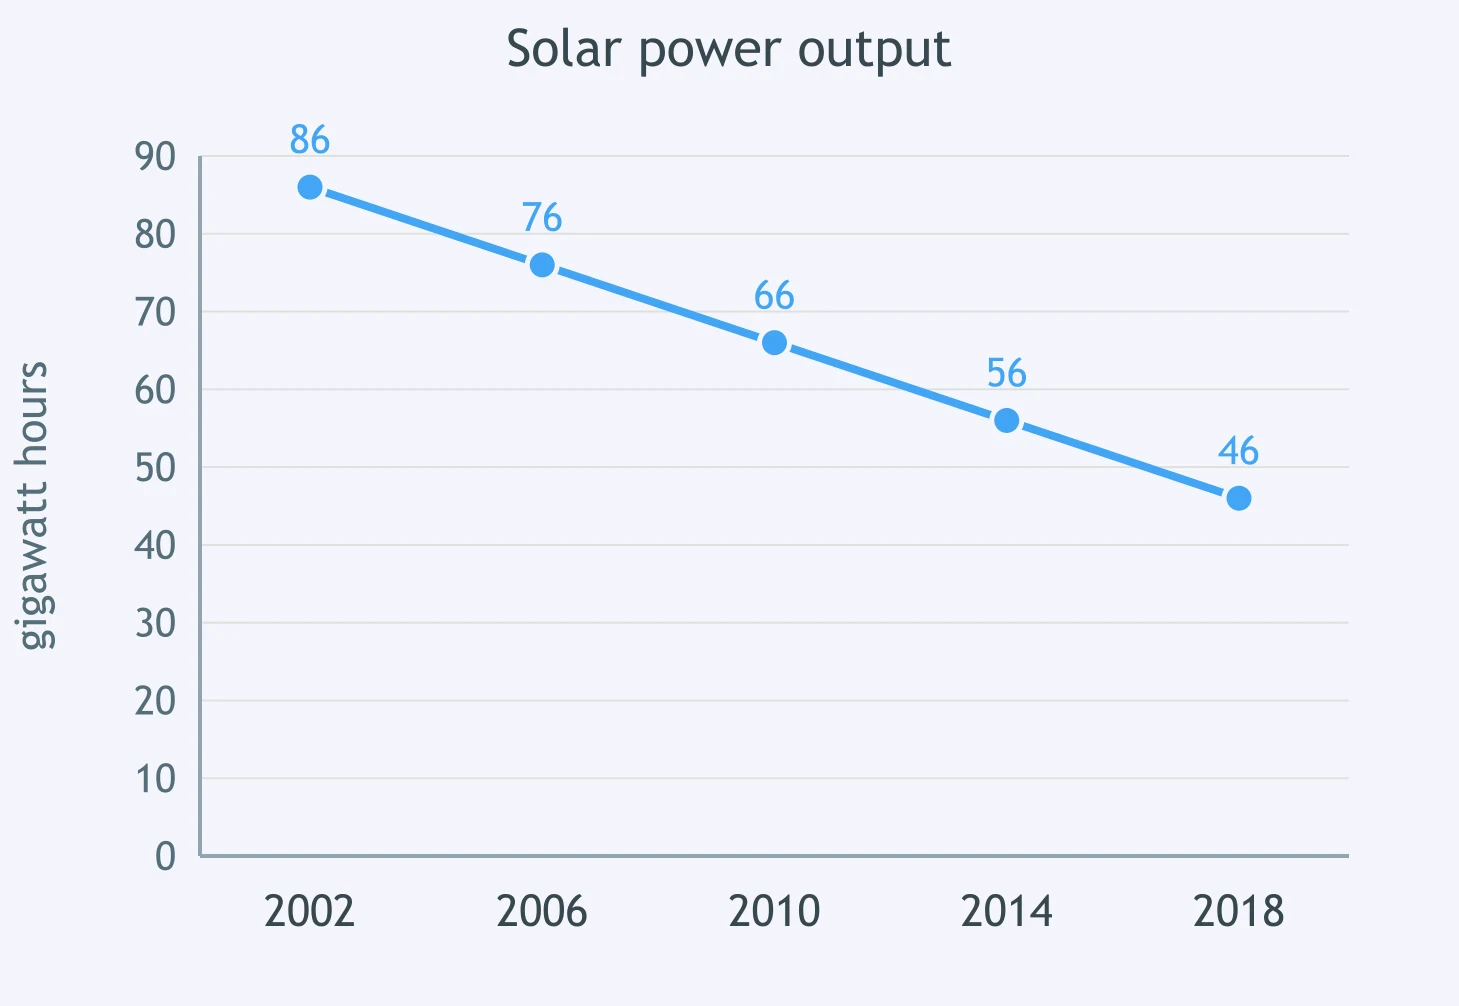
Look at the chart. Between 2002 and 2018, solar output ___.
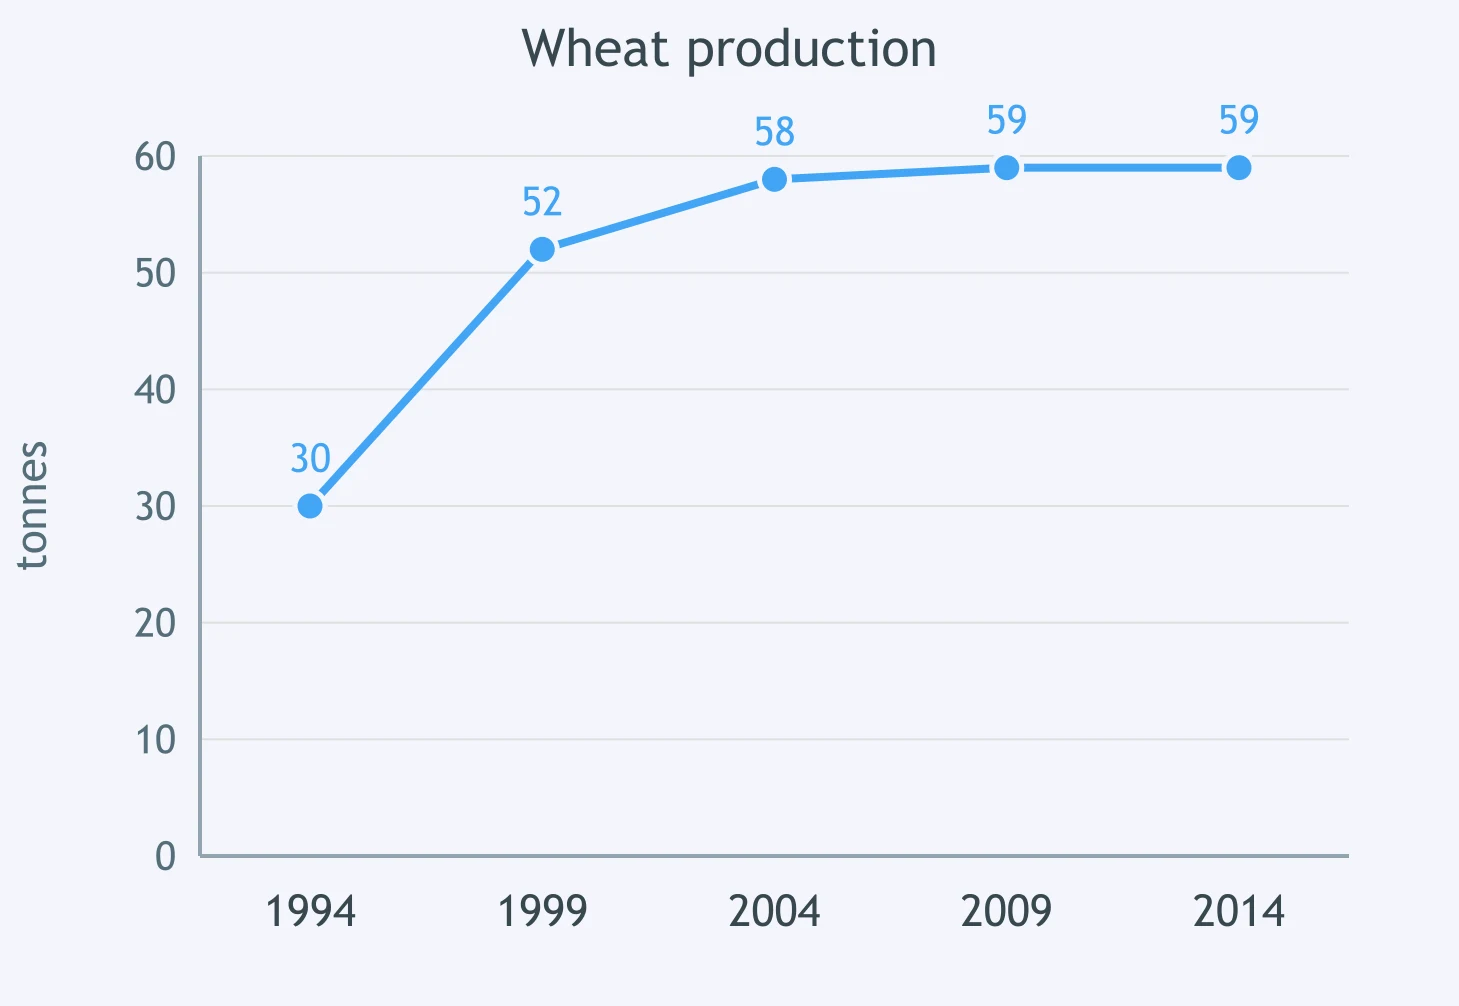
Complete the description of the graph: wheat production ___ across the period from 1994 to 2014.
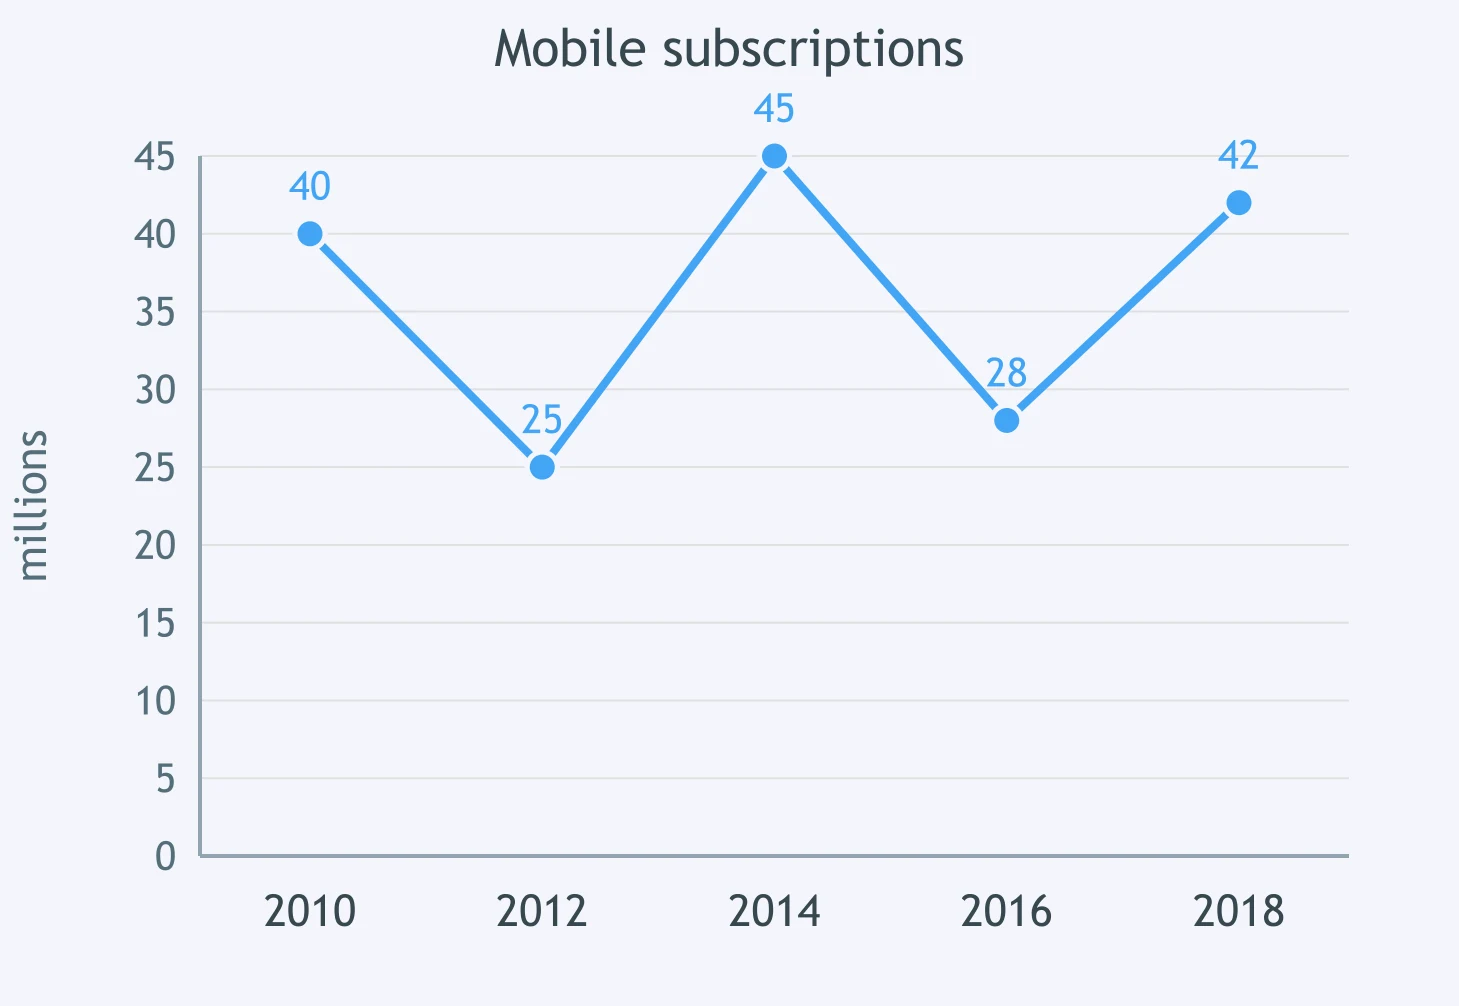
Mobile subscriptions ___ over the 8-year period from 2010 to 2018.
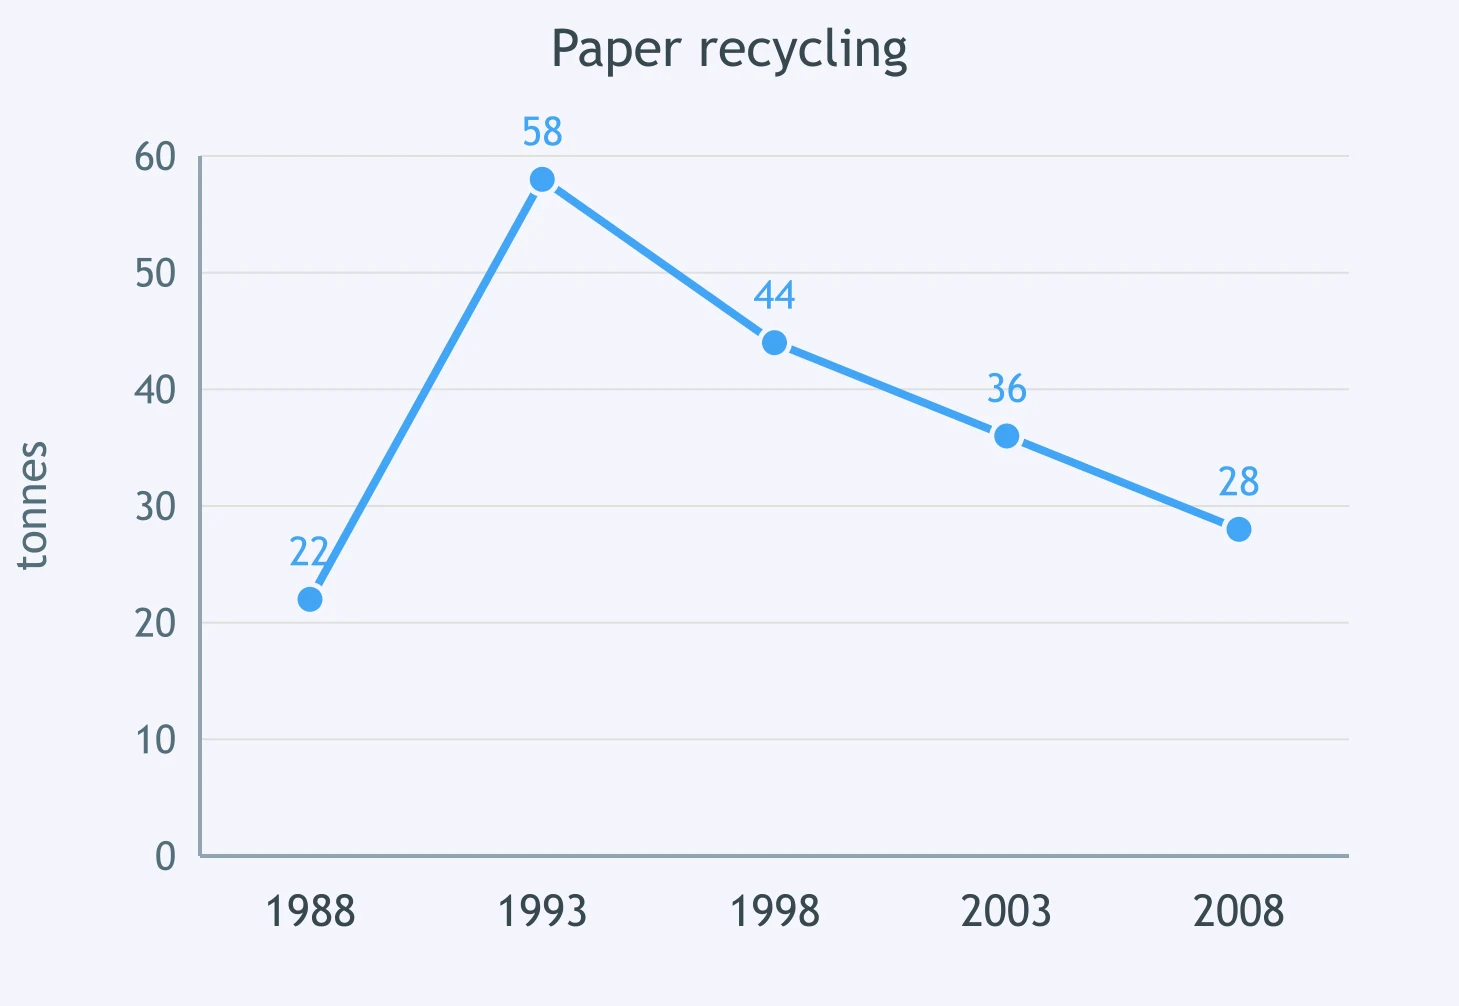
Read the graph carefully. Paper recycling ___.
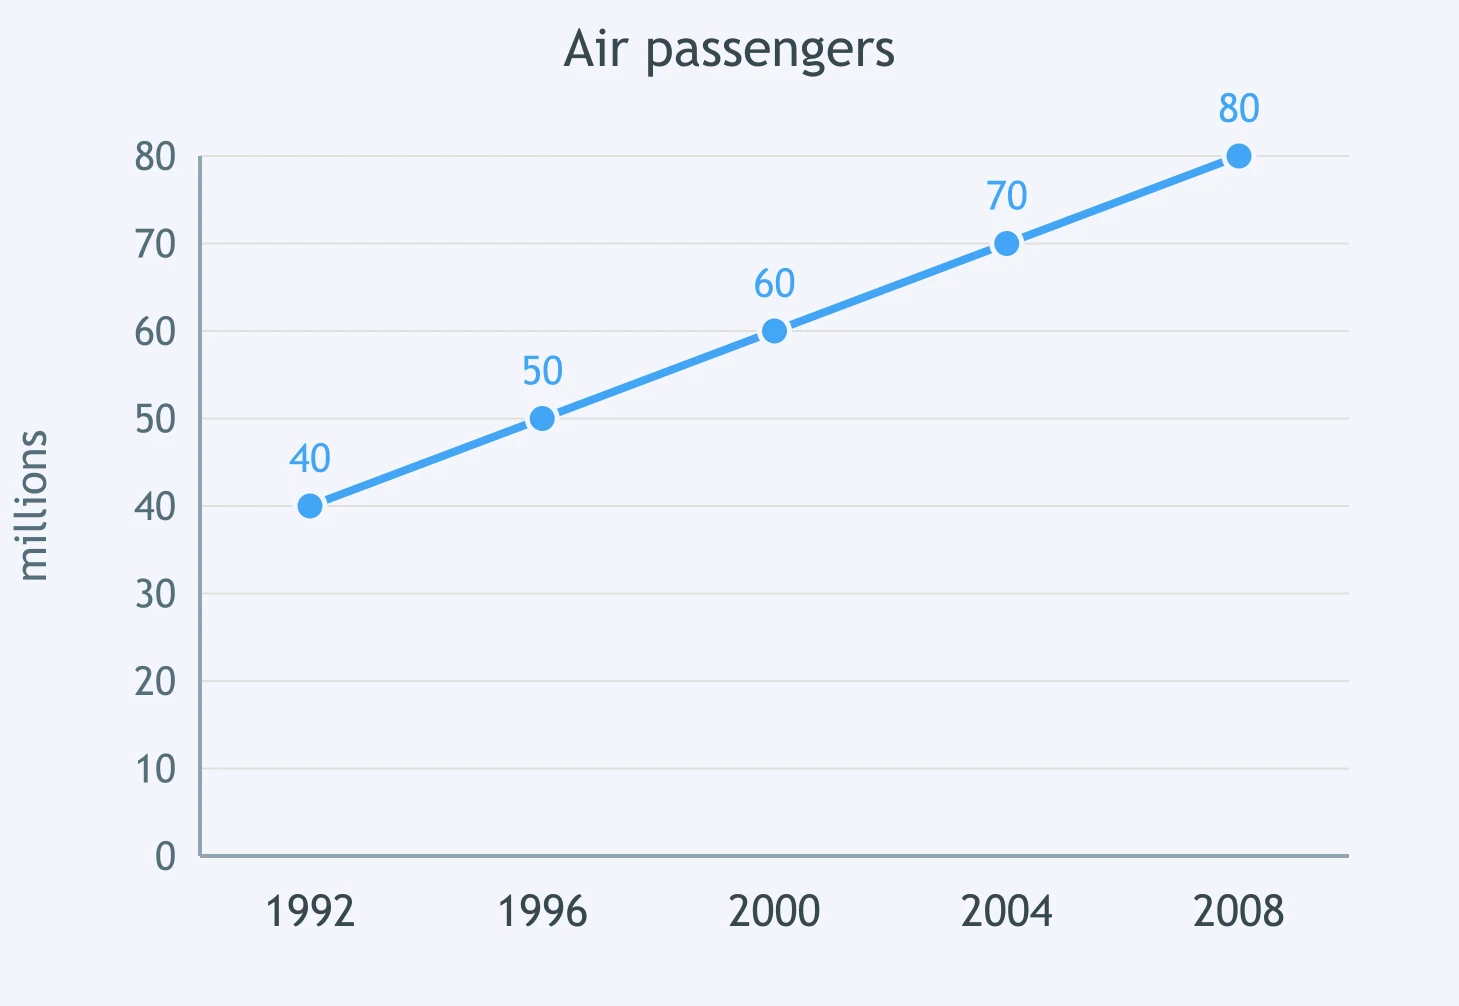
The line graph shows air passengers from 1992 to 2008. Over this period, figures ___.
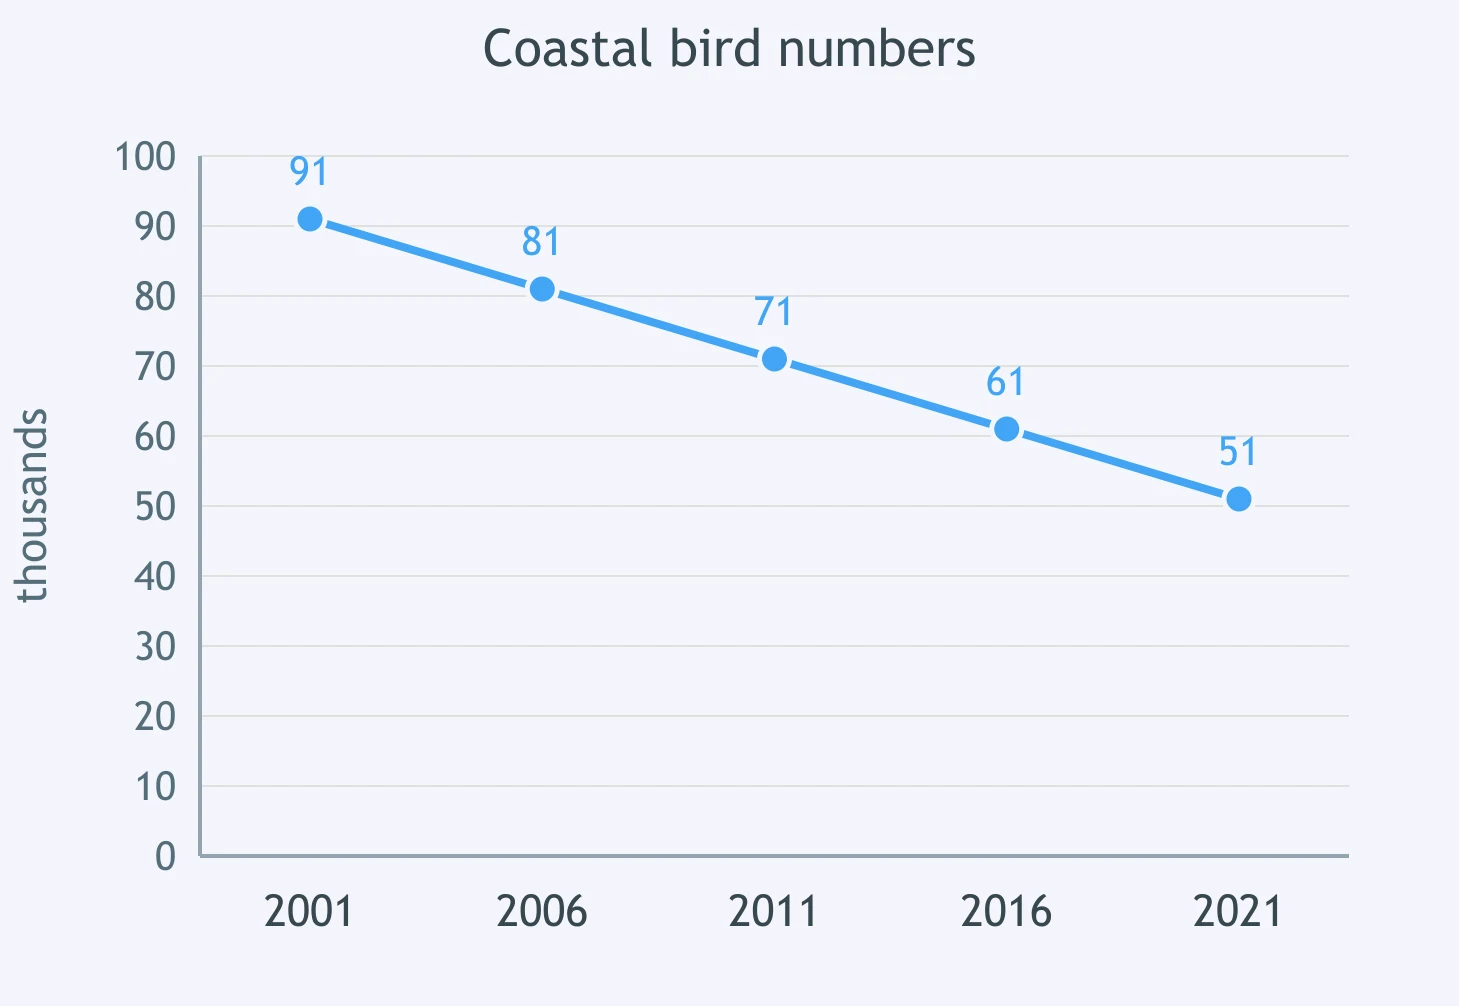
Look at the chart. Between 2001 and 2021, bird numbers ___.
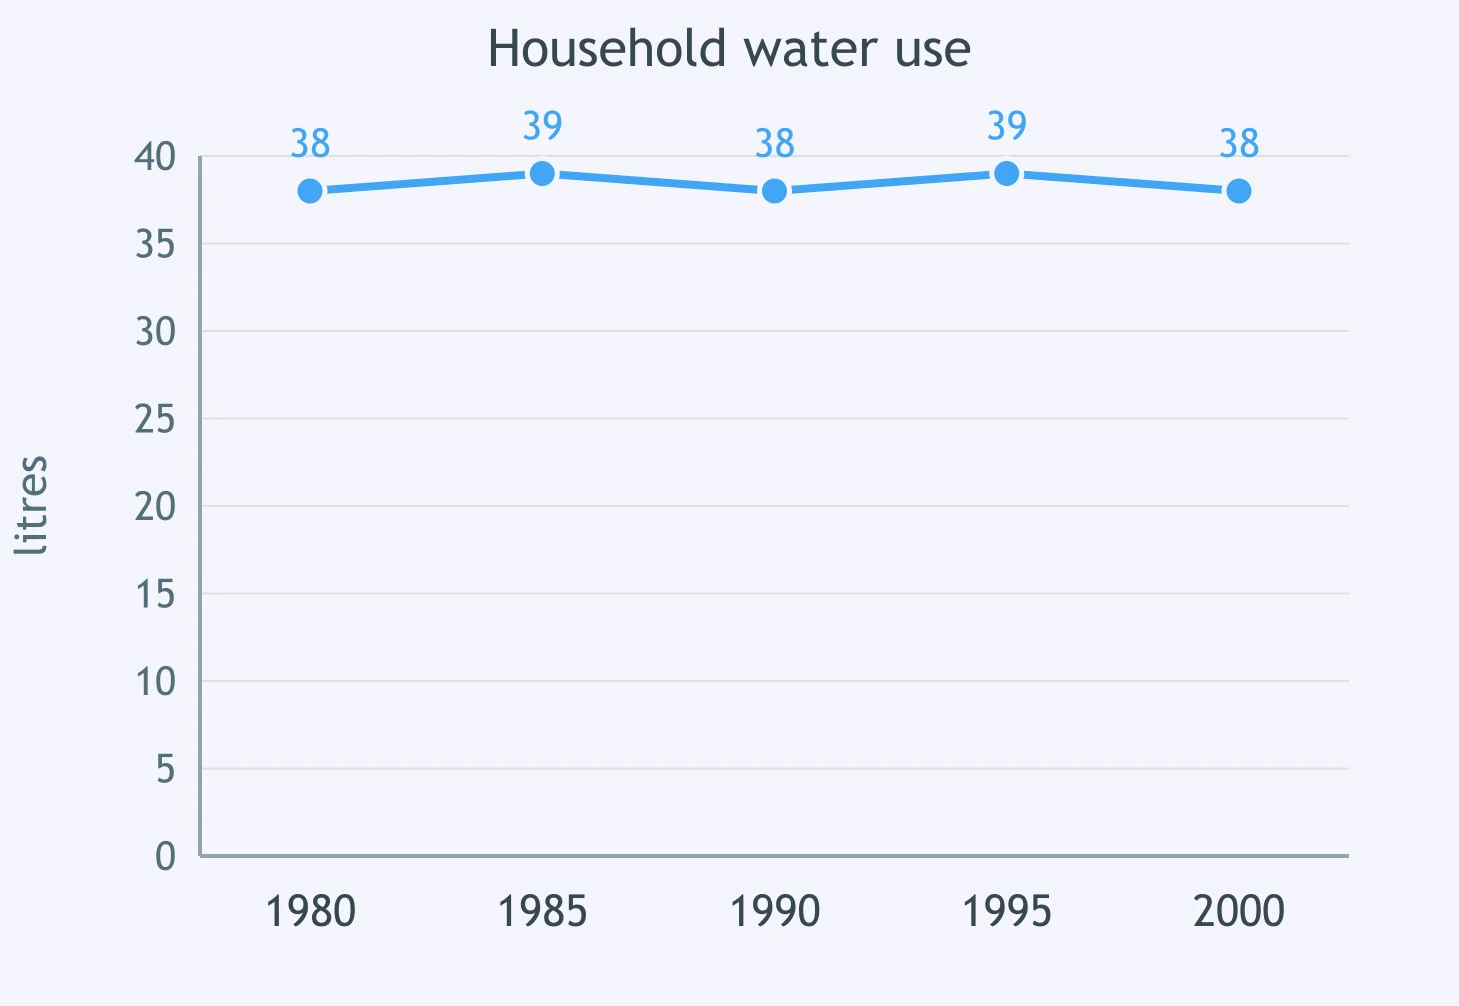
Complete the description of the graph: water use ___ across the period from 1980 to 2000.
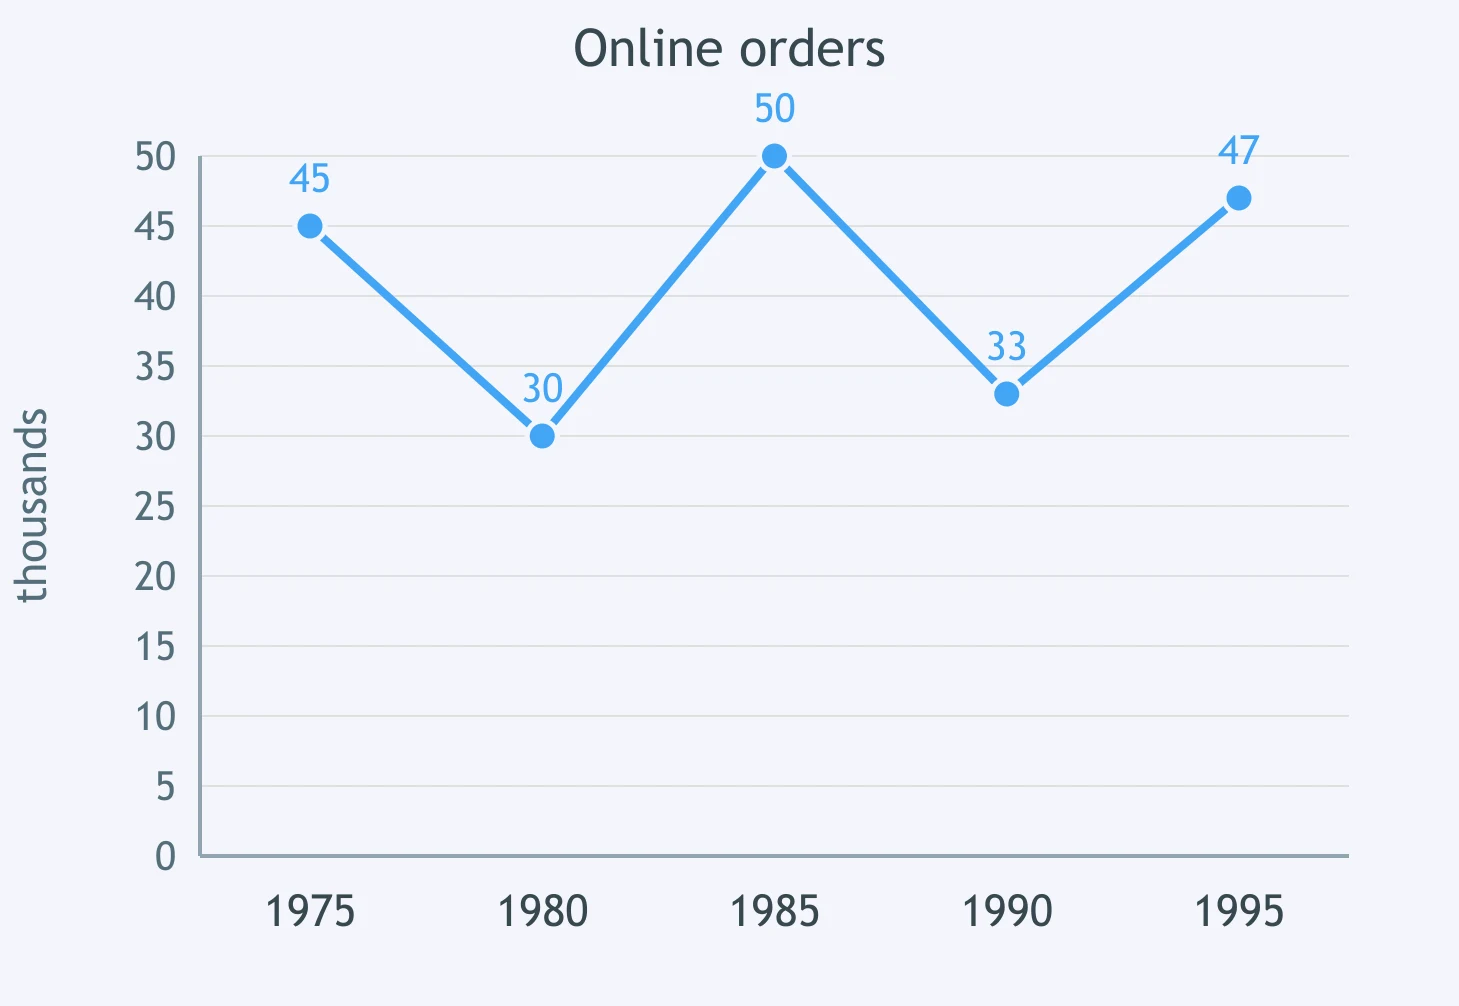
Online orders ___ over the 20-year period from 1975 to 1995.
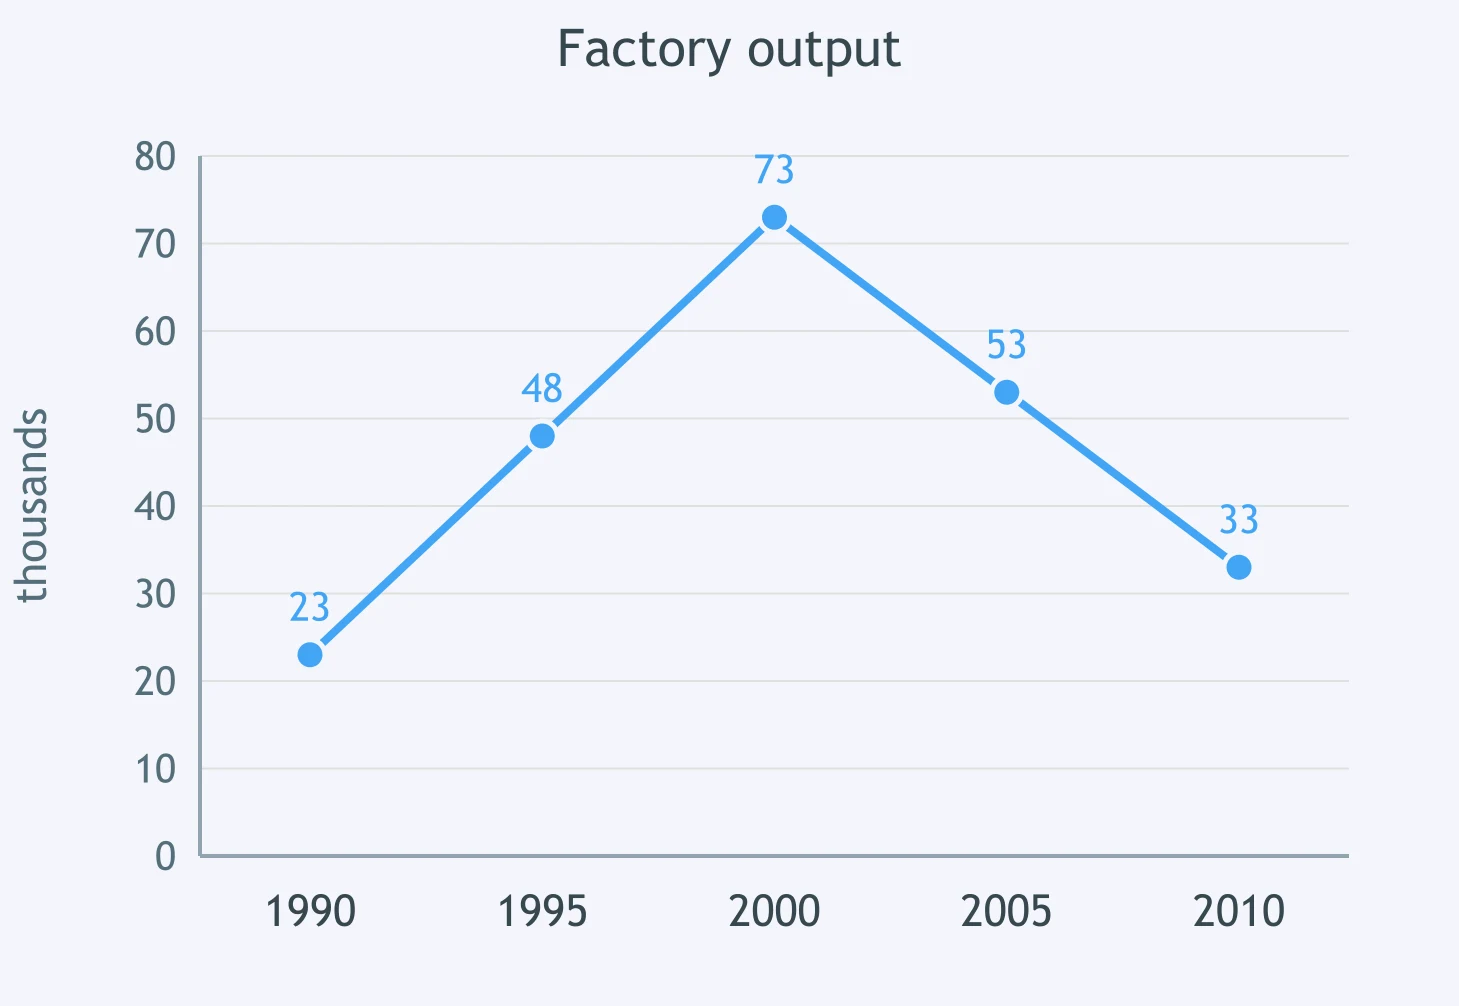
Look at the chart of factory output. Factory output ___.
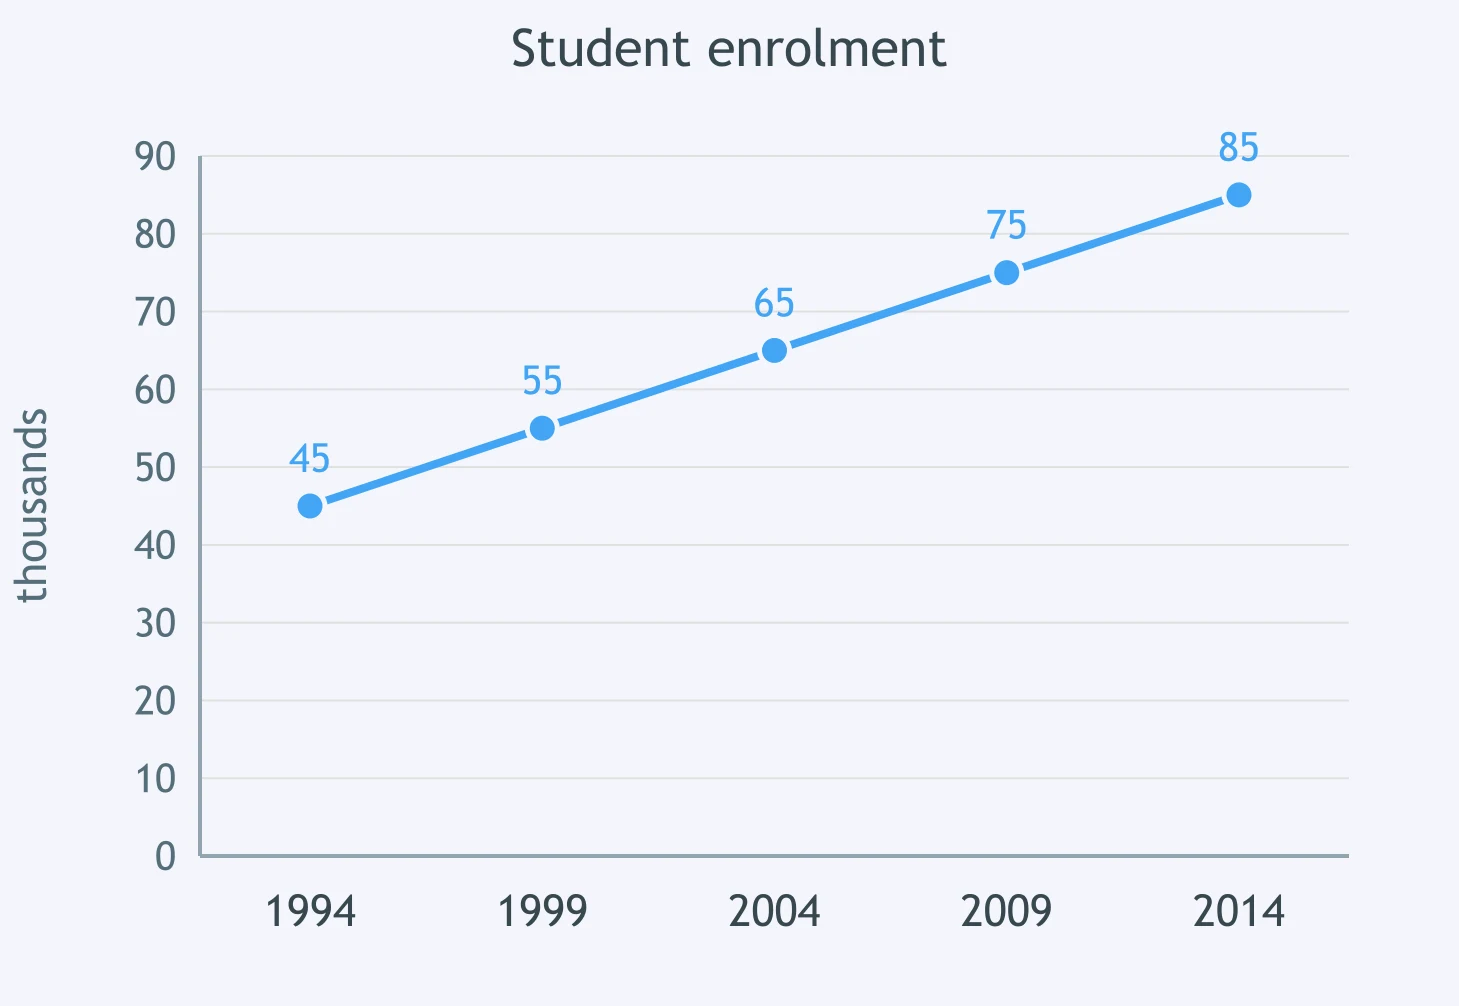
The line graph shows student enrolment from 1994 to 2014. Over this period, figures ___.
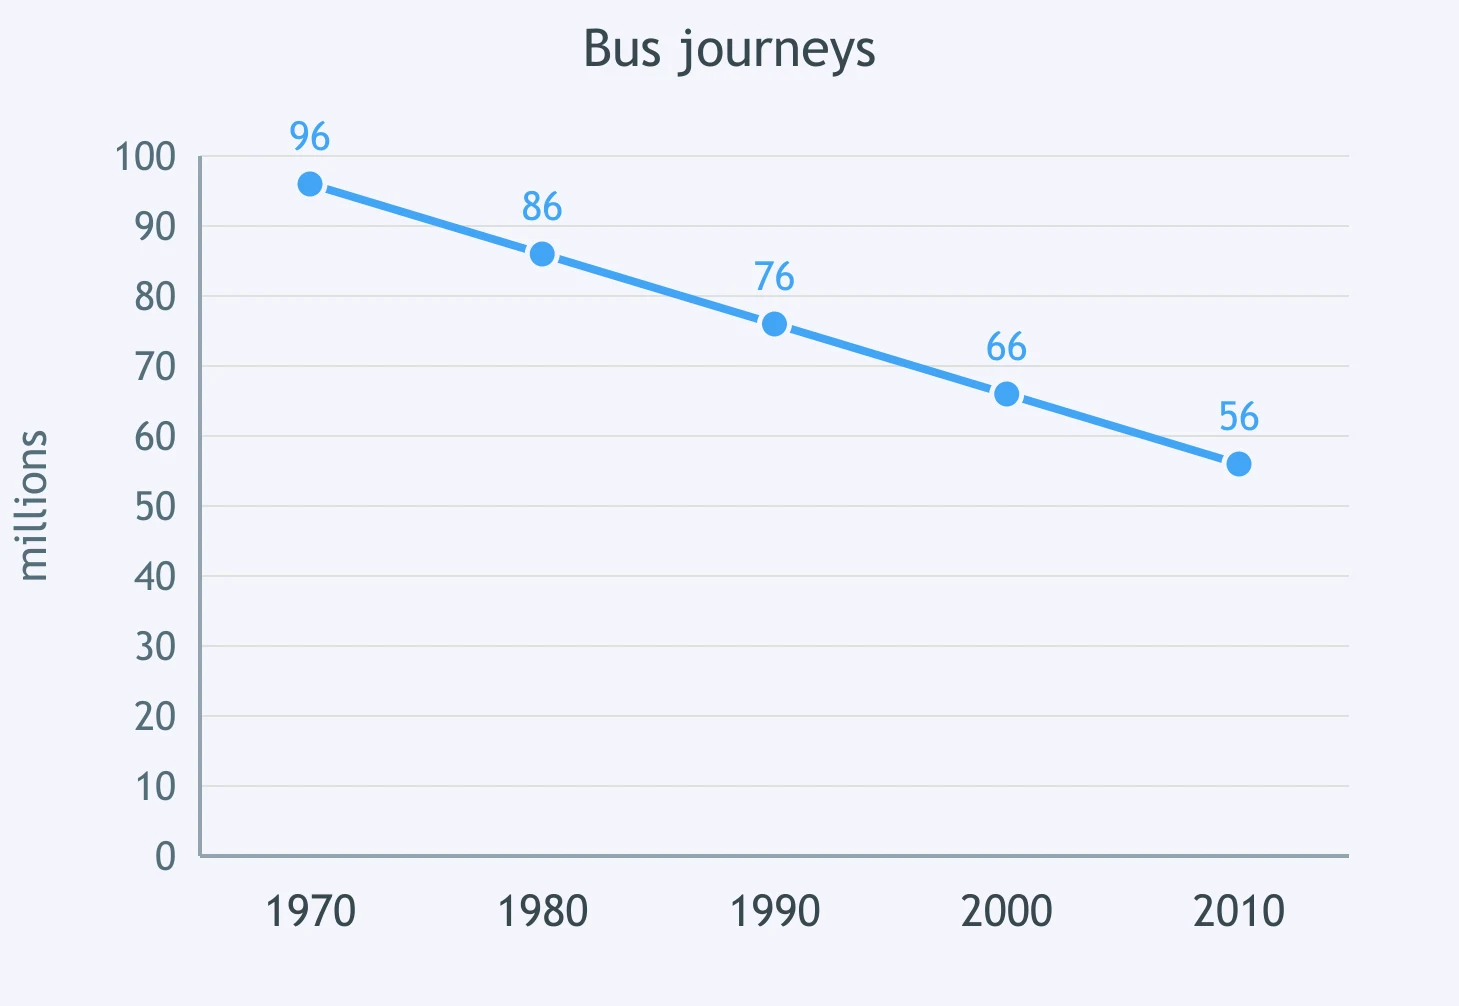
Look at the chart. Between 1970 and 2010, bus journeys ___.
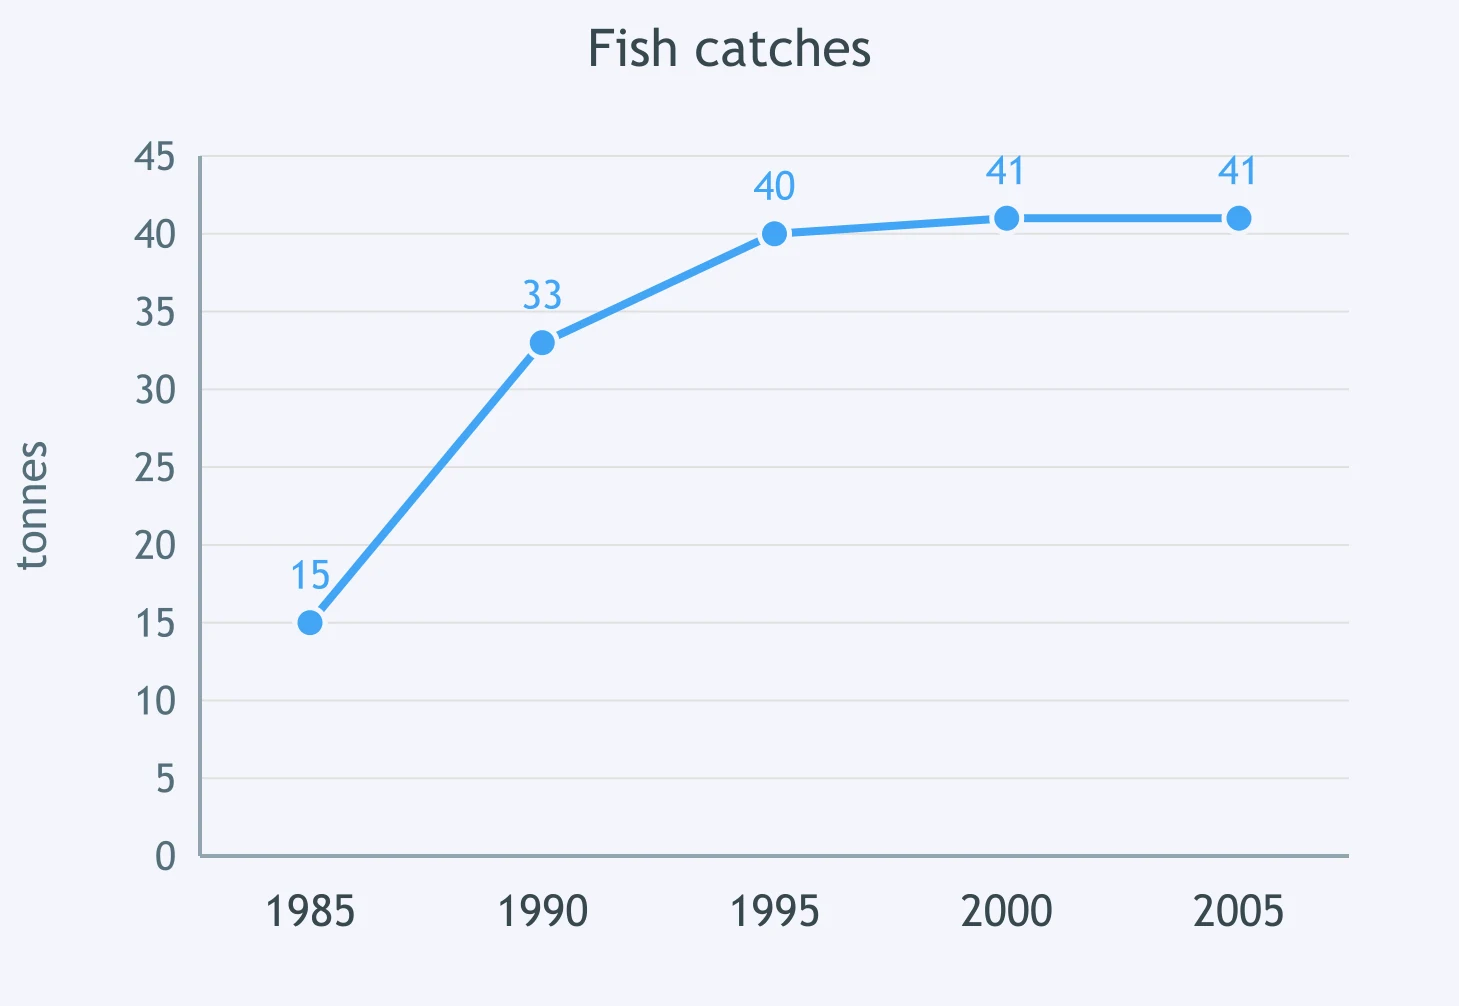
Complete the description of the graph: fish catches ___ across the period from 1985 to 2005.
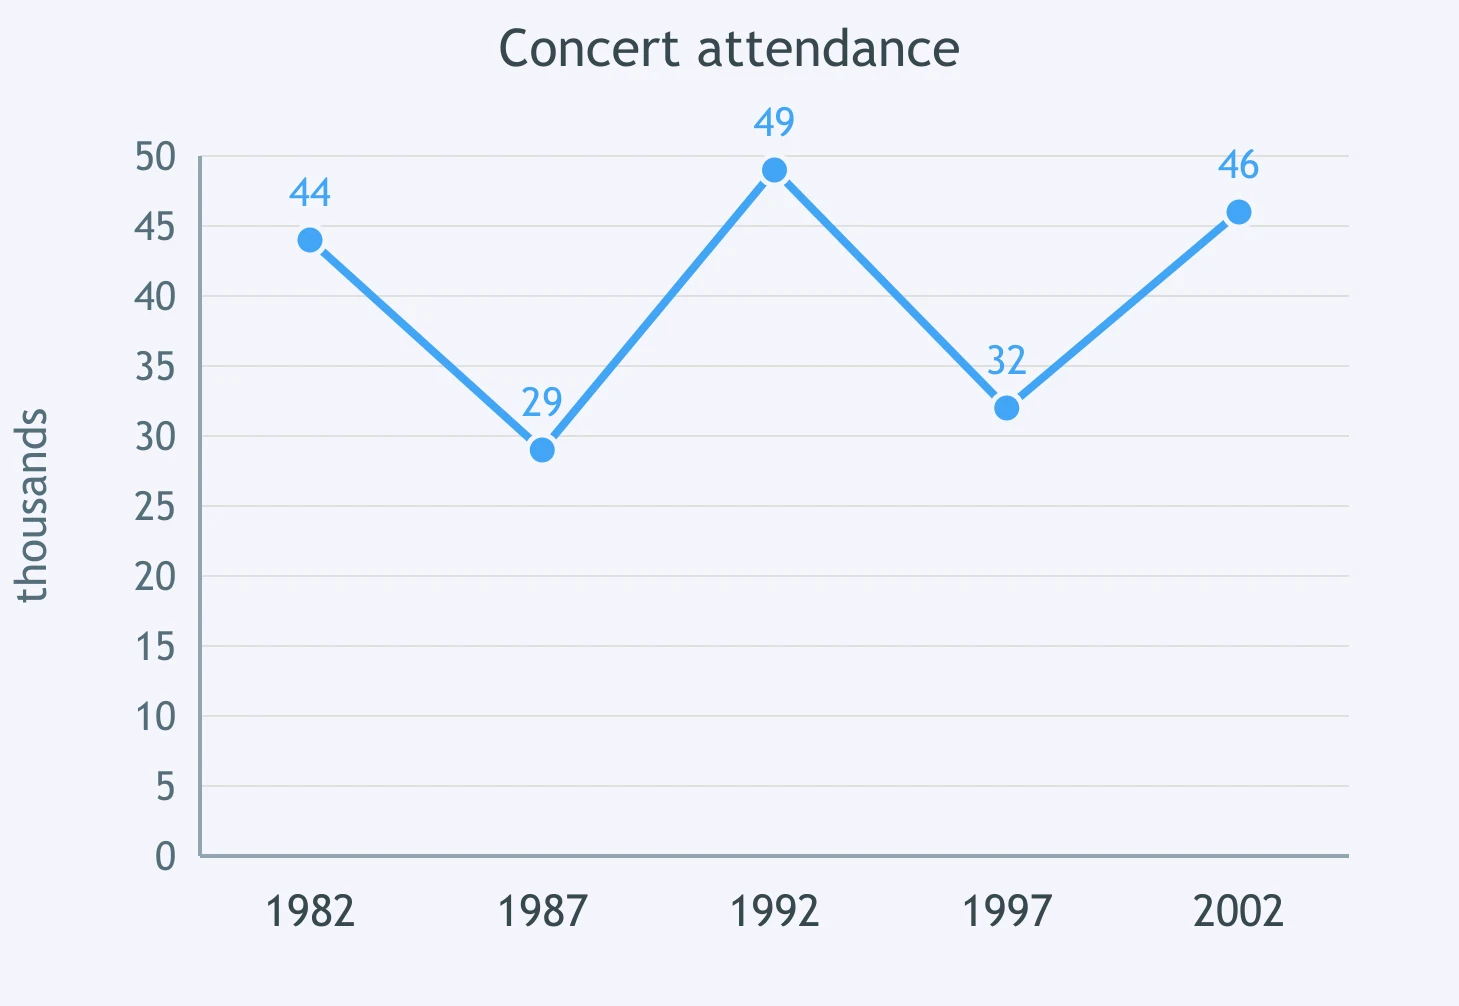
Concert attendance ___ over the 20-year period from 1982 to 2002.
The graph tracks steel imports. Steel imports ___.
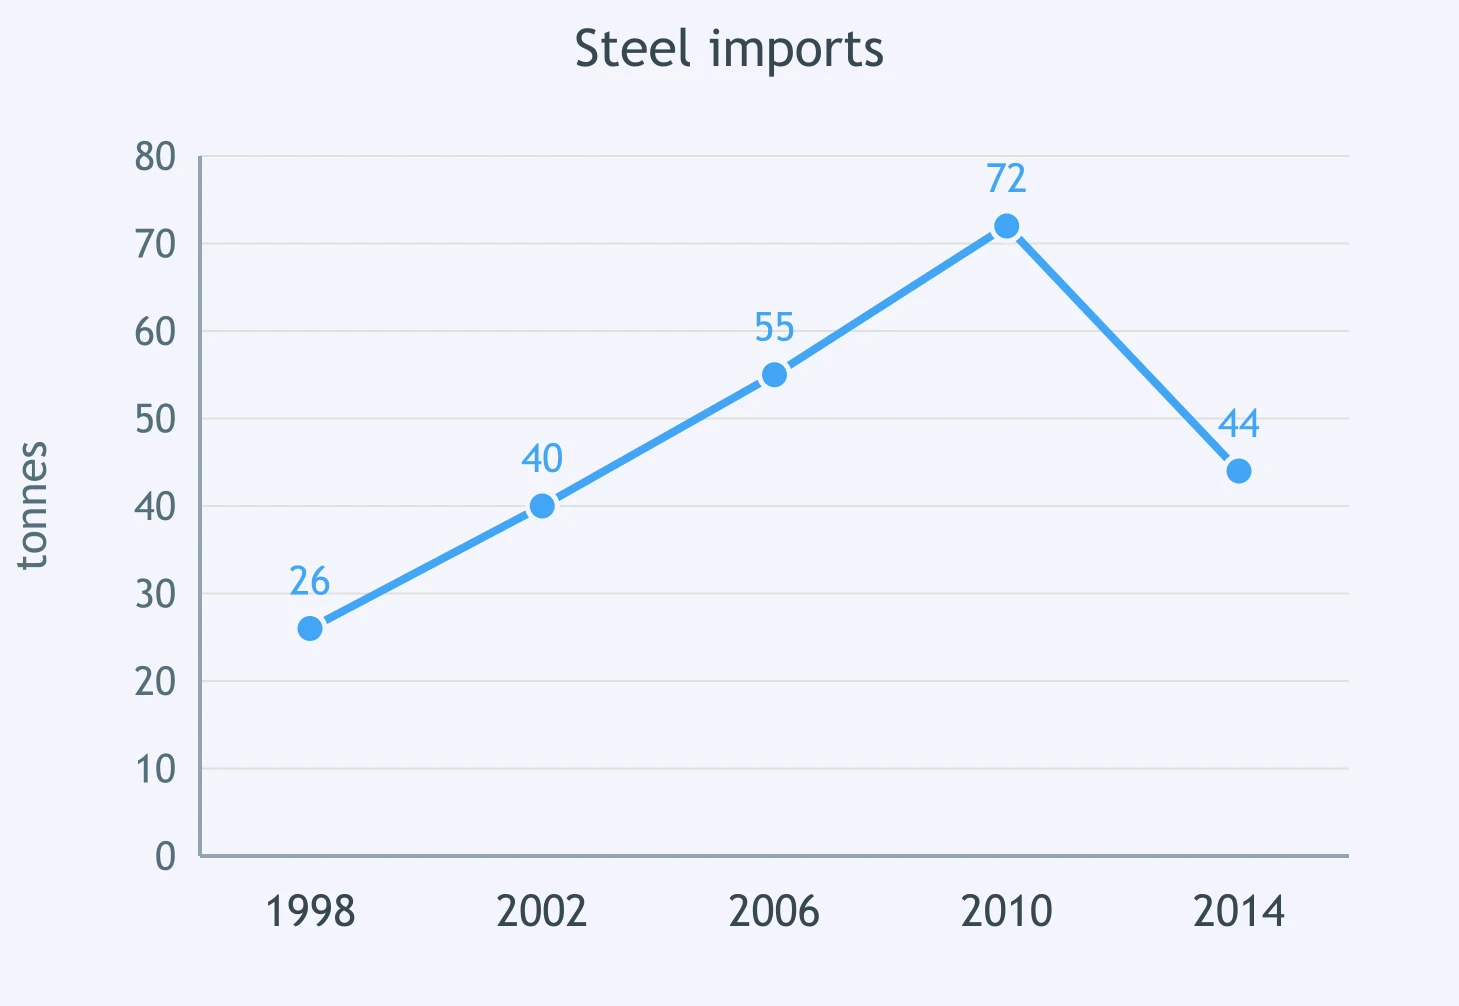
The line graph shows newspaper sales from 2000 to 2020. Over this period, figures ___.
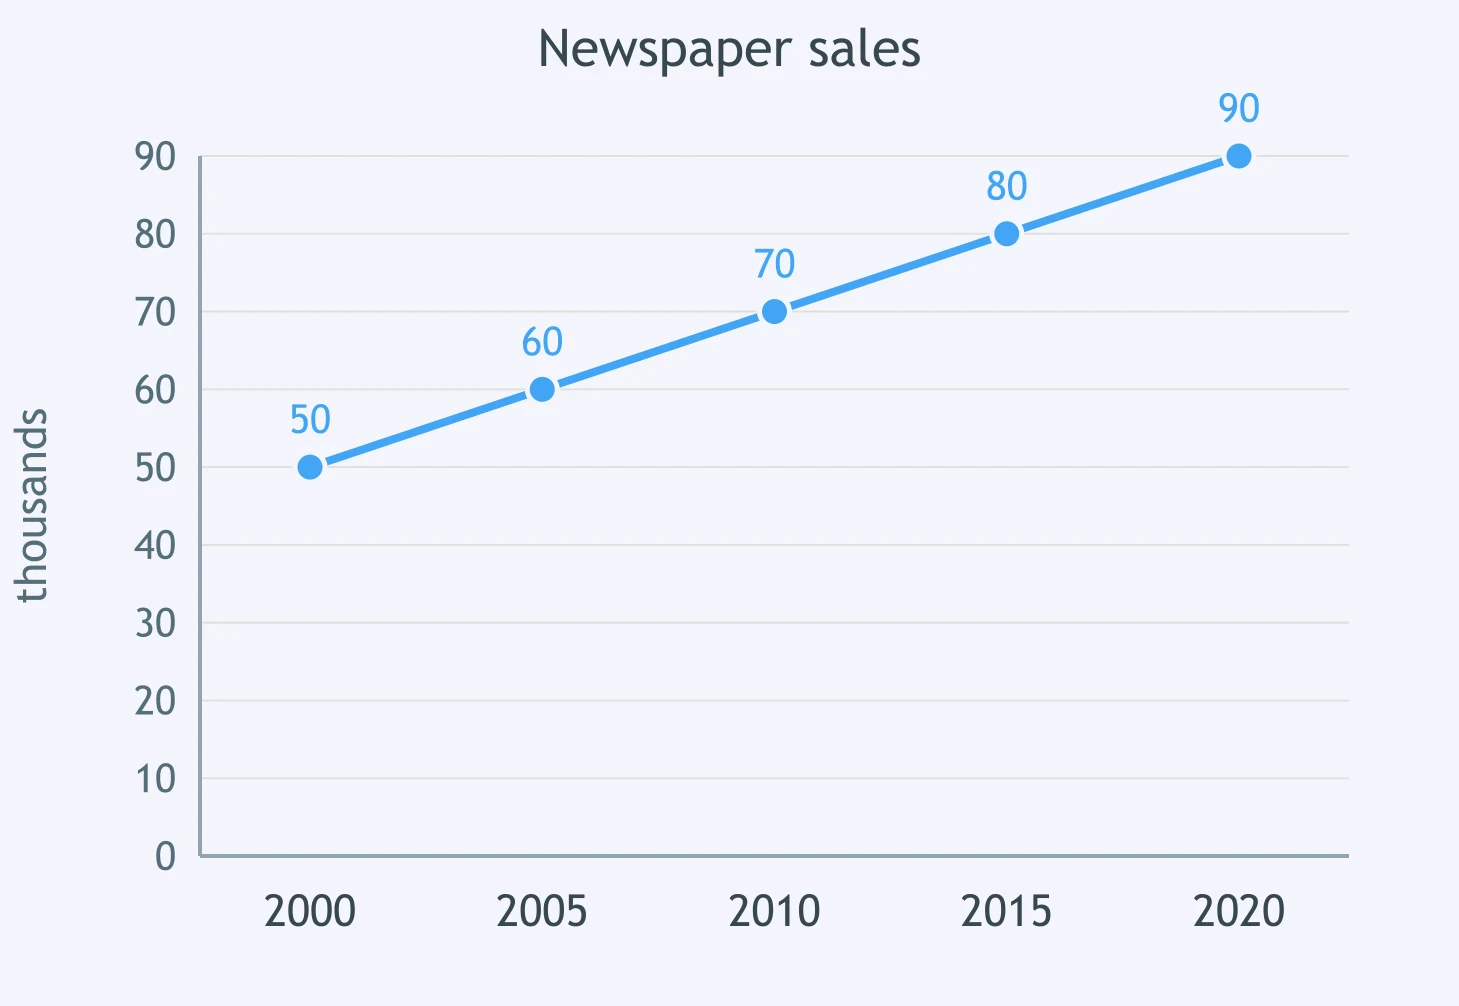
Look at the chart. Between 2010 and 2018, energy consumption ___.
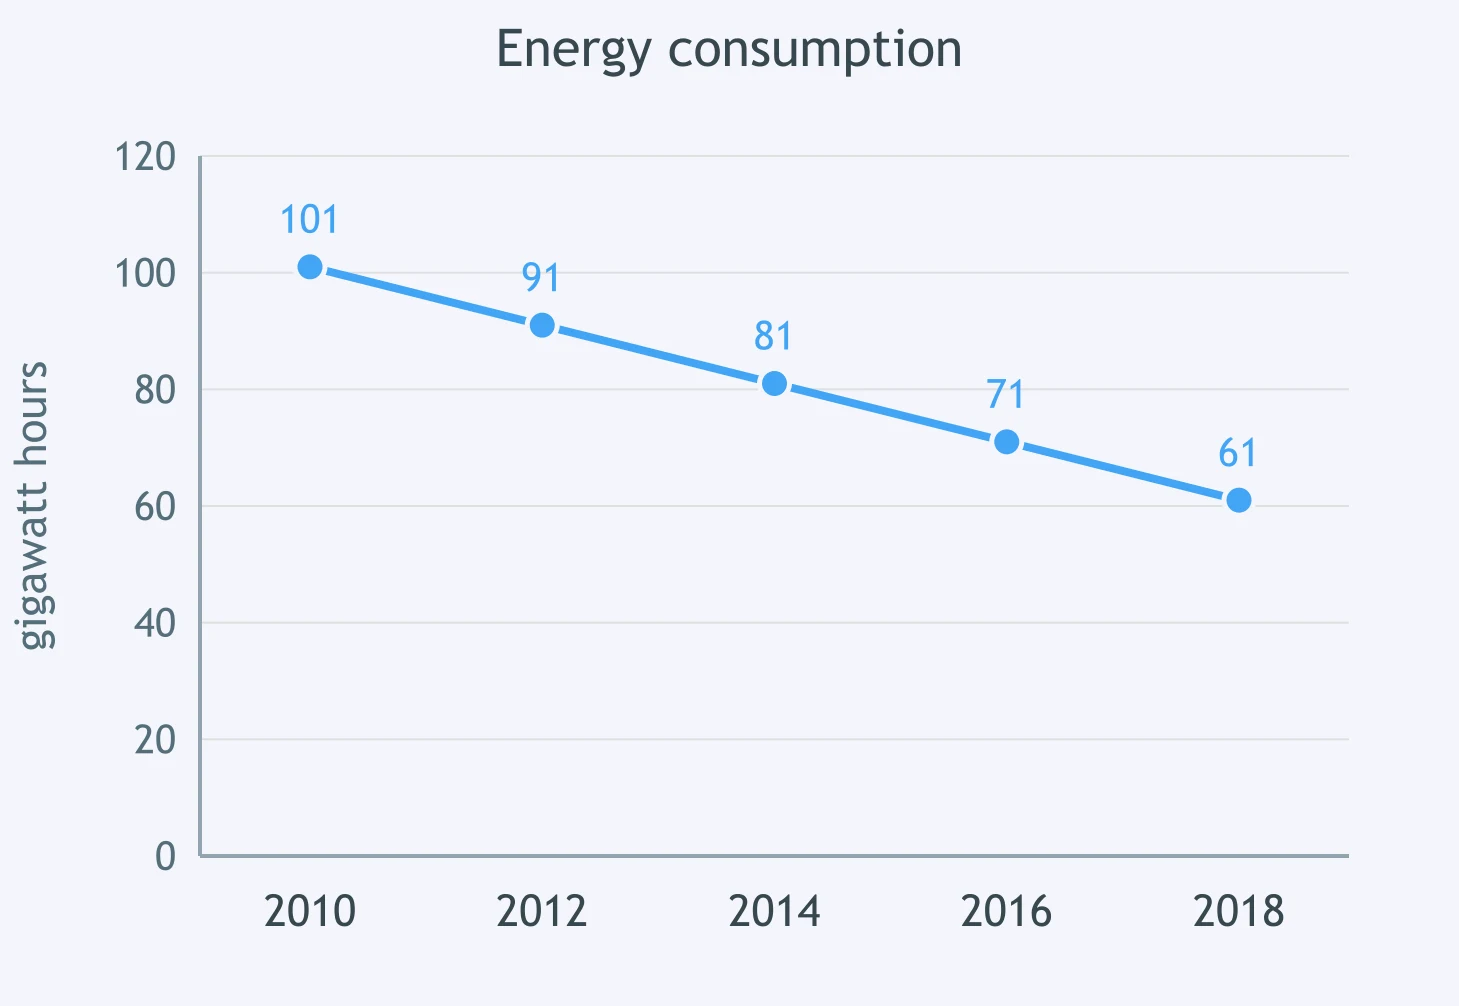
Complete the description of the graph: tourist arrivals ___ across the period from 1988 to 2008.
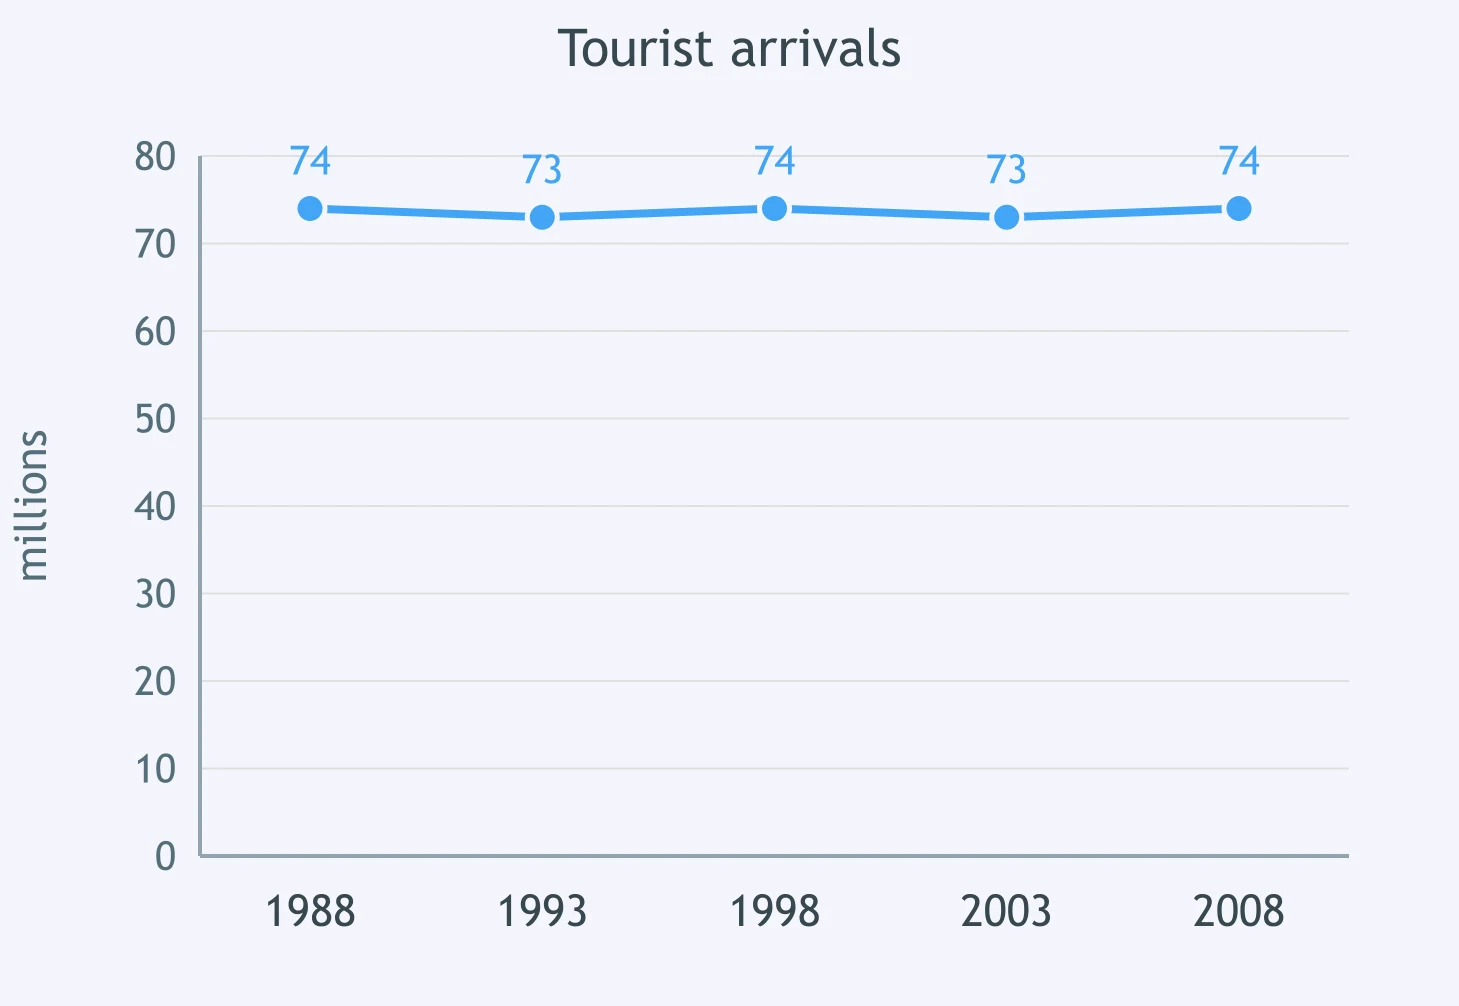
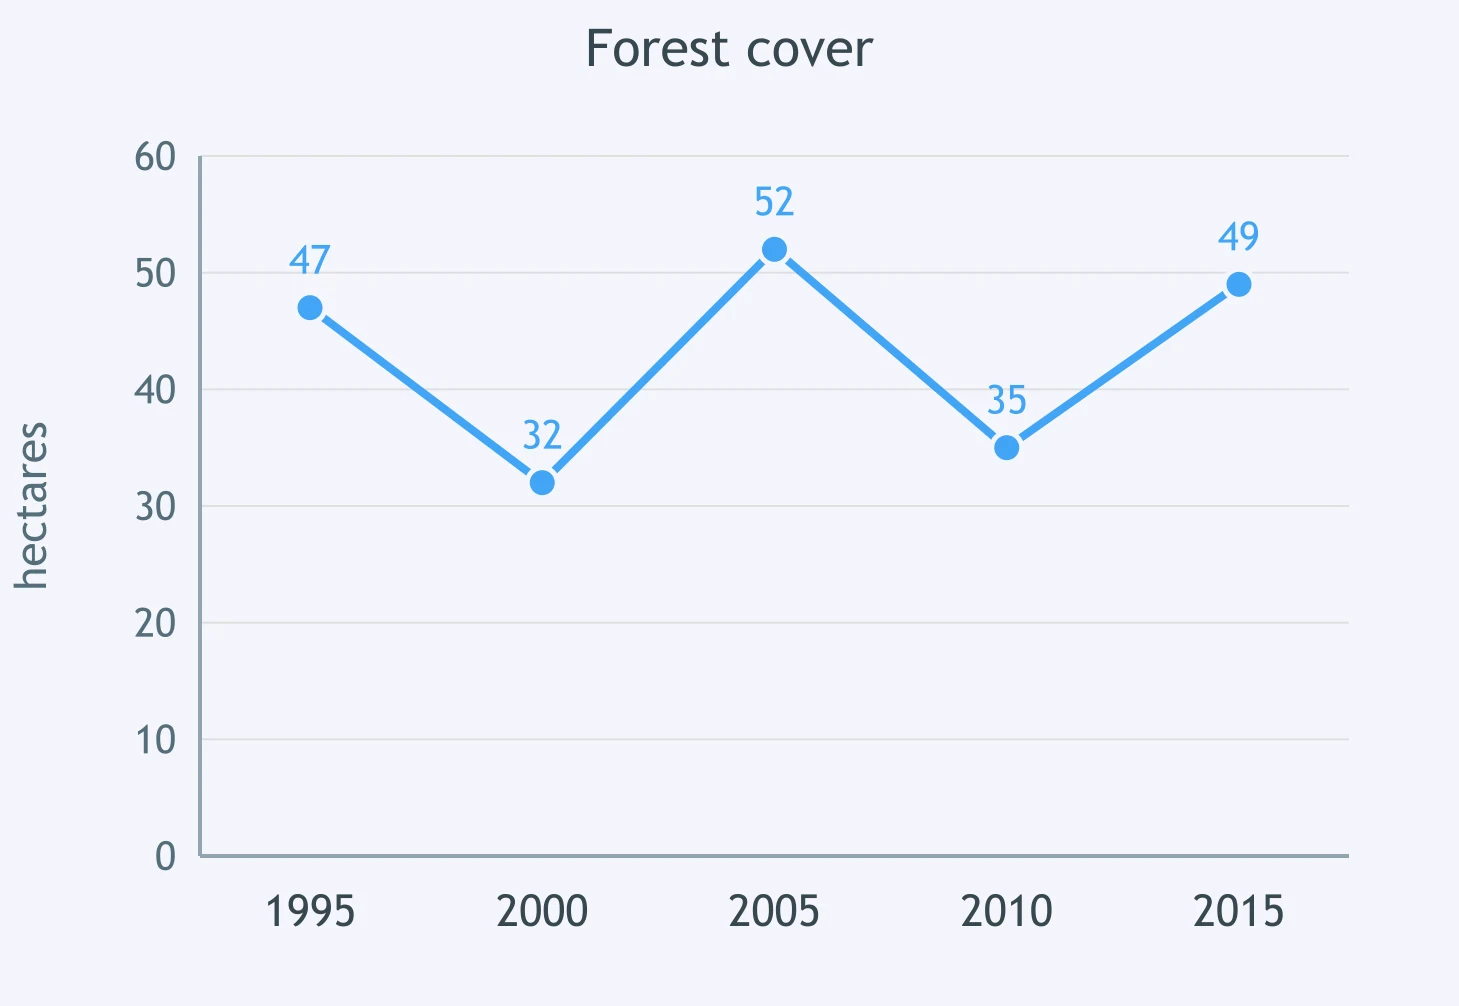
Forest cover ___ over the 20-year period from 1995 to 2015.
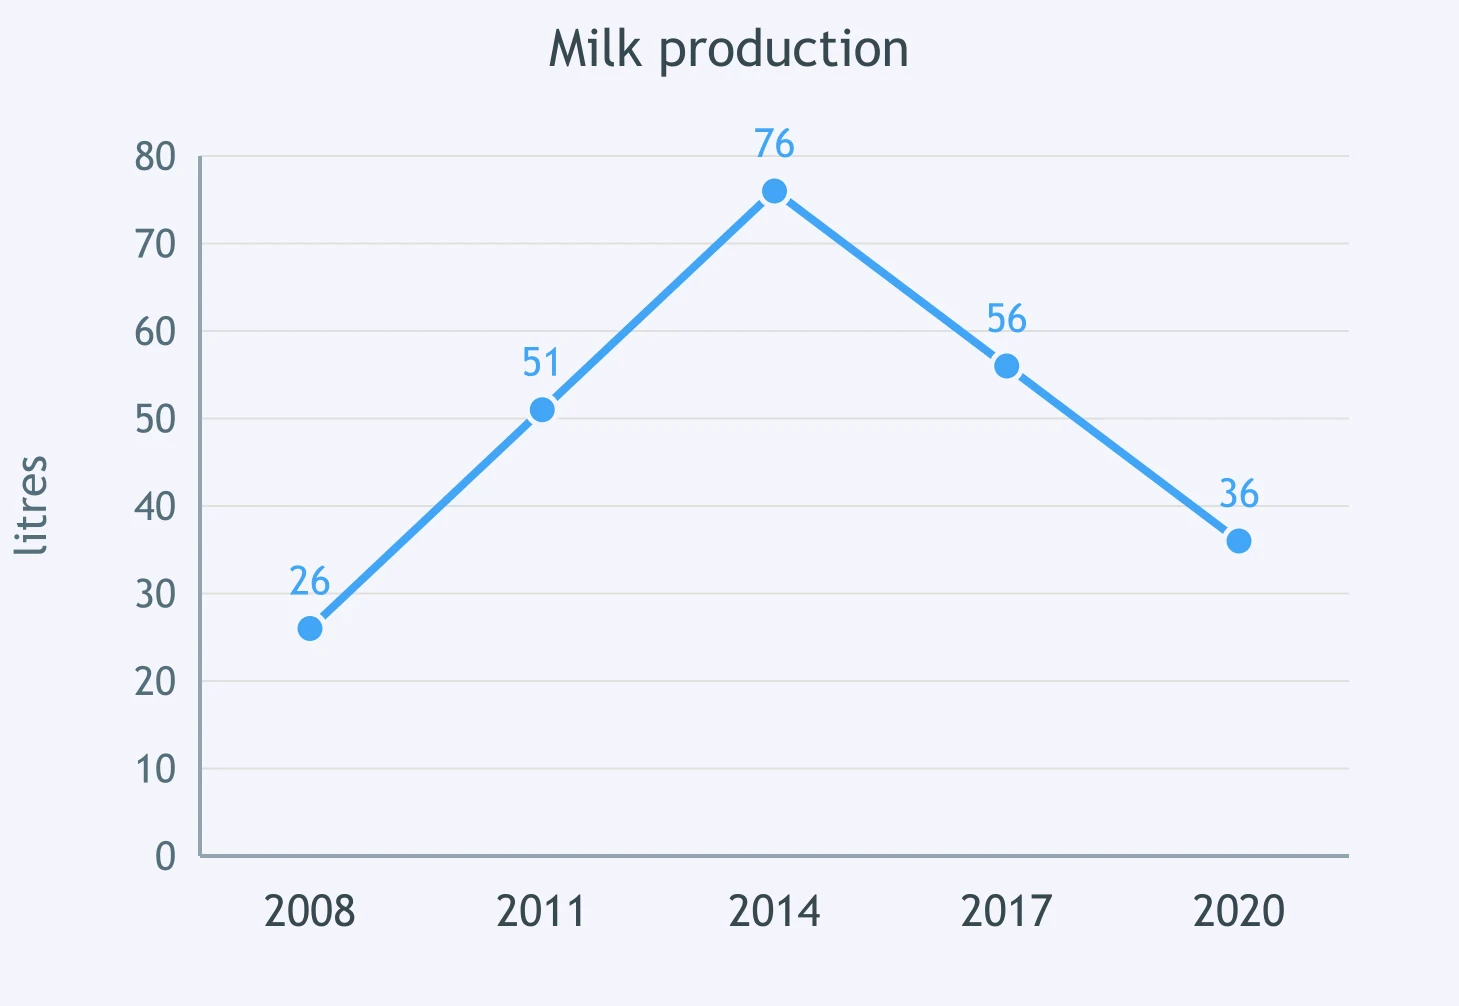
Describe the shape of this graph: milk production ___.
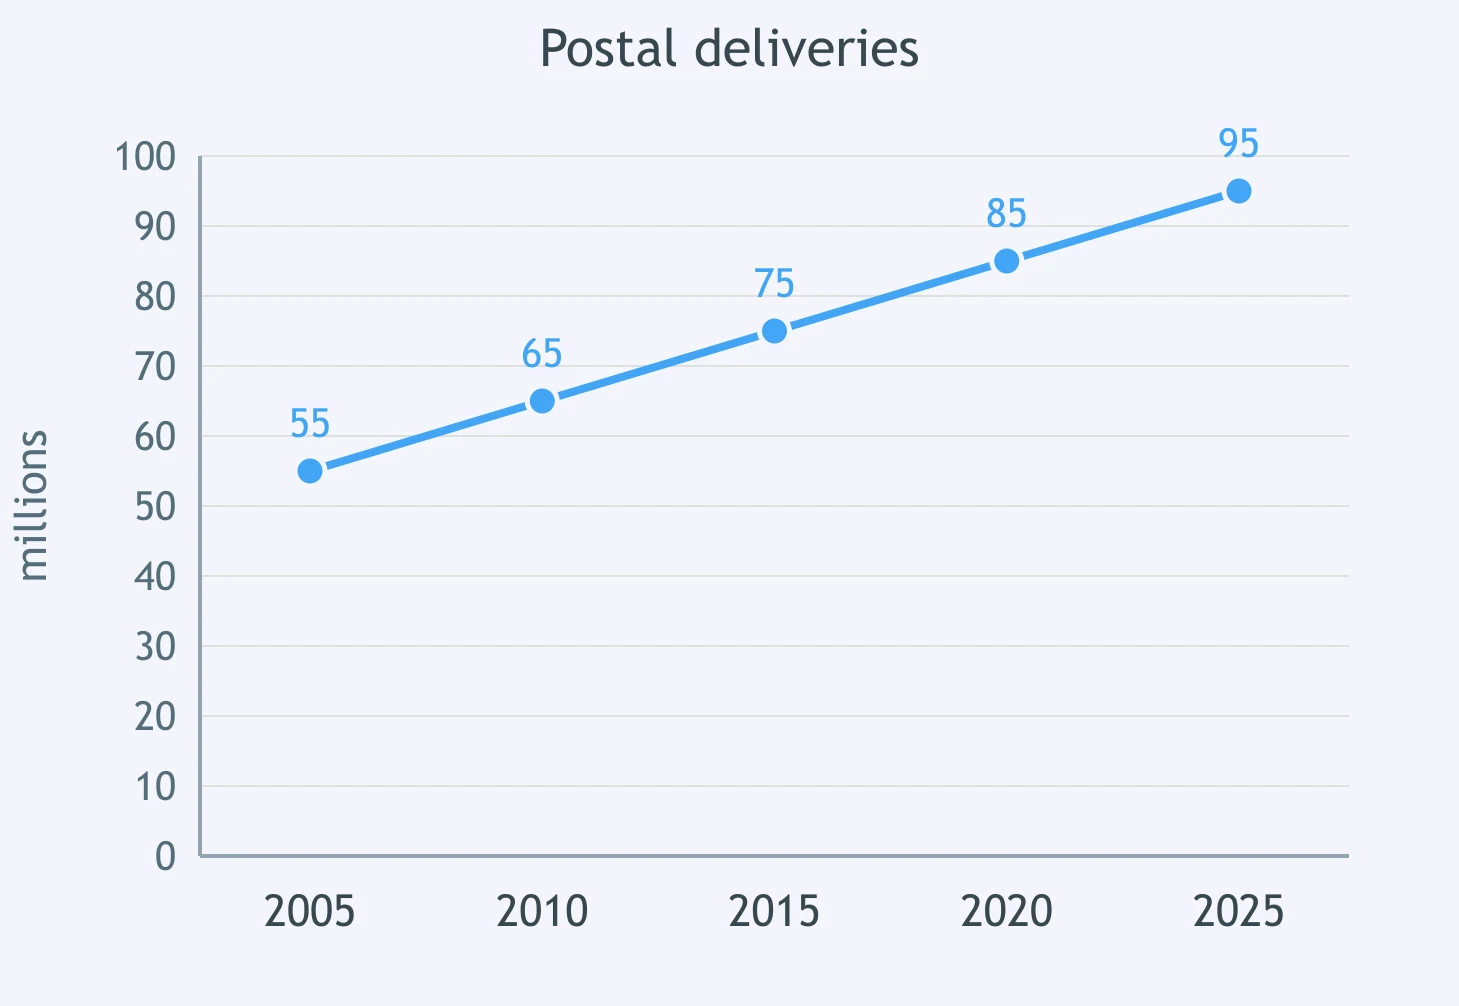
The line graph shows postal deliveries from 2005 to 2025. Over this period, figures ___.
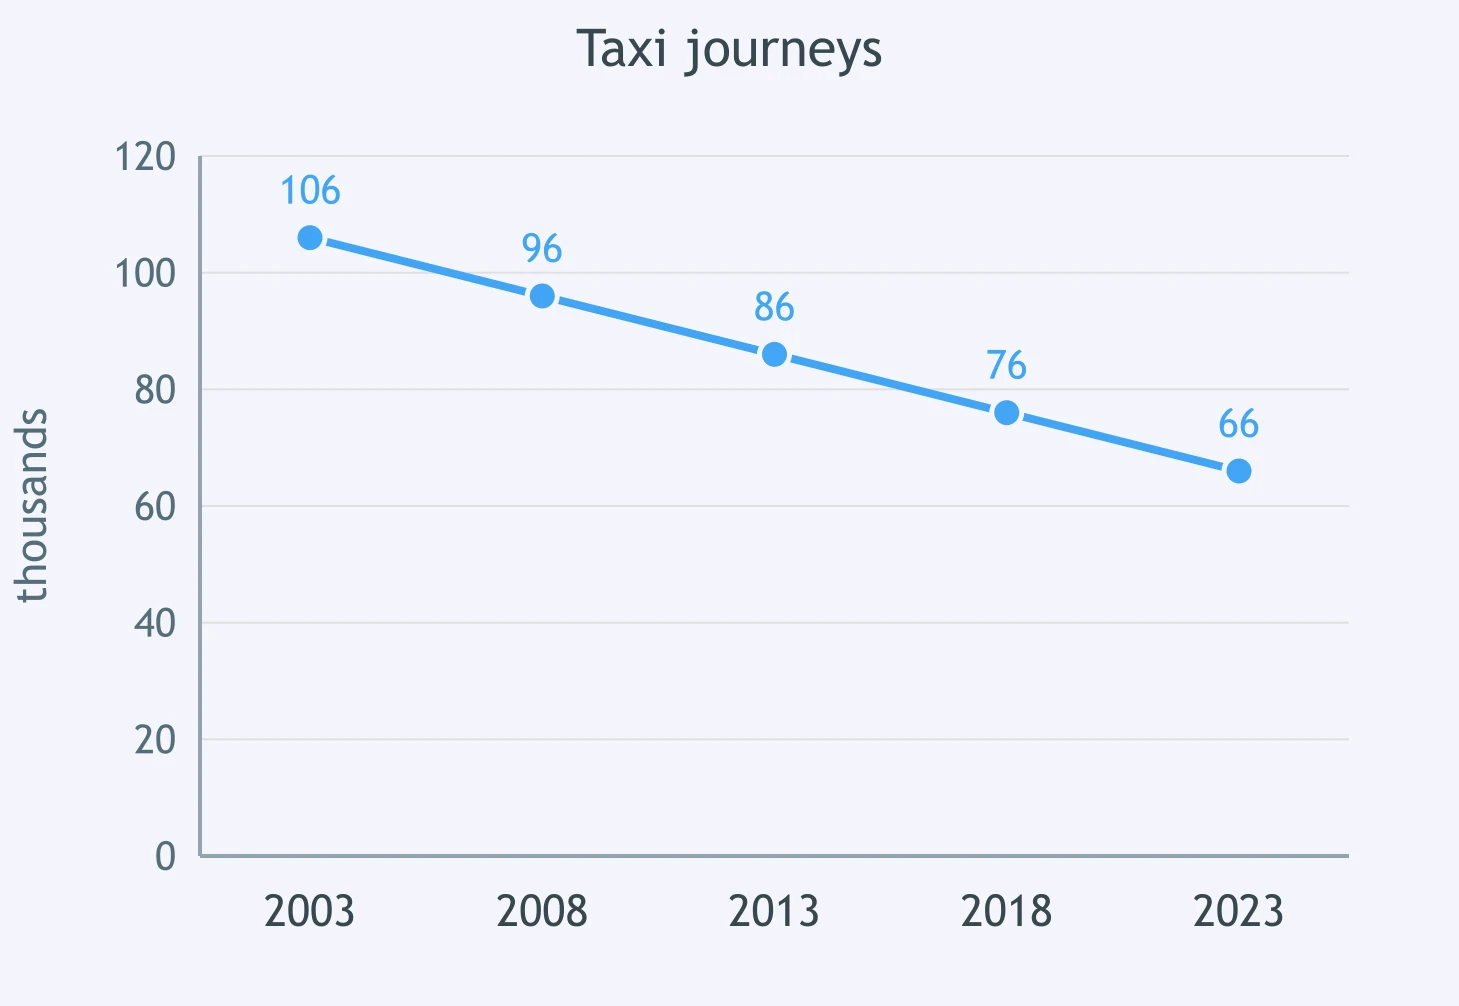
Look at the chart. Between 2003 and 2023, taxi journeys ___.
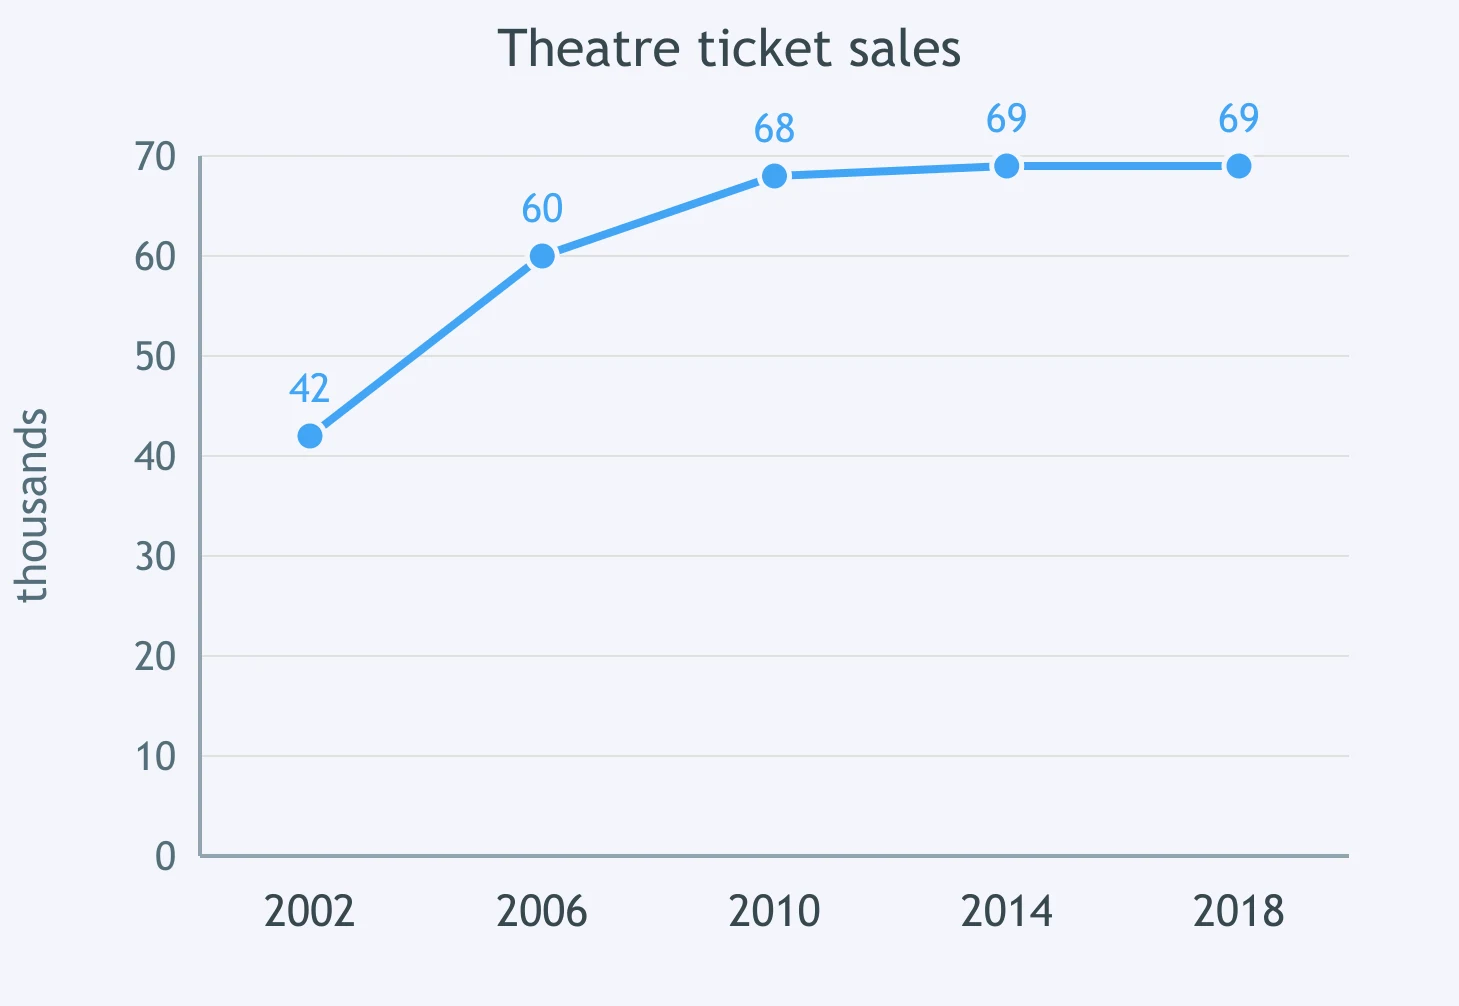
Complete the description of the graph: theatre ticket sales ___ across the period from 2002 to 2018.
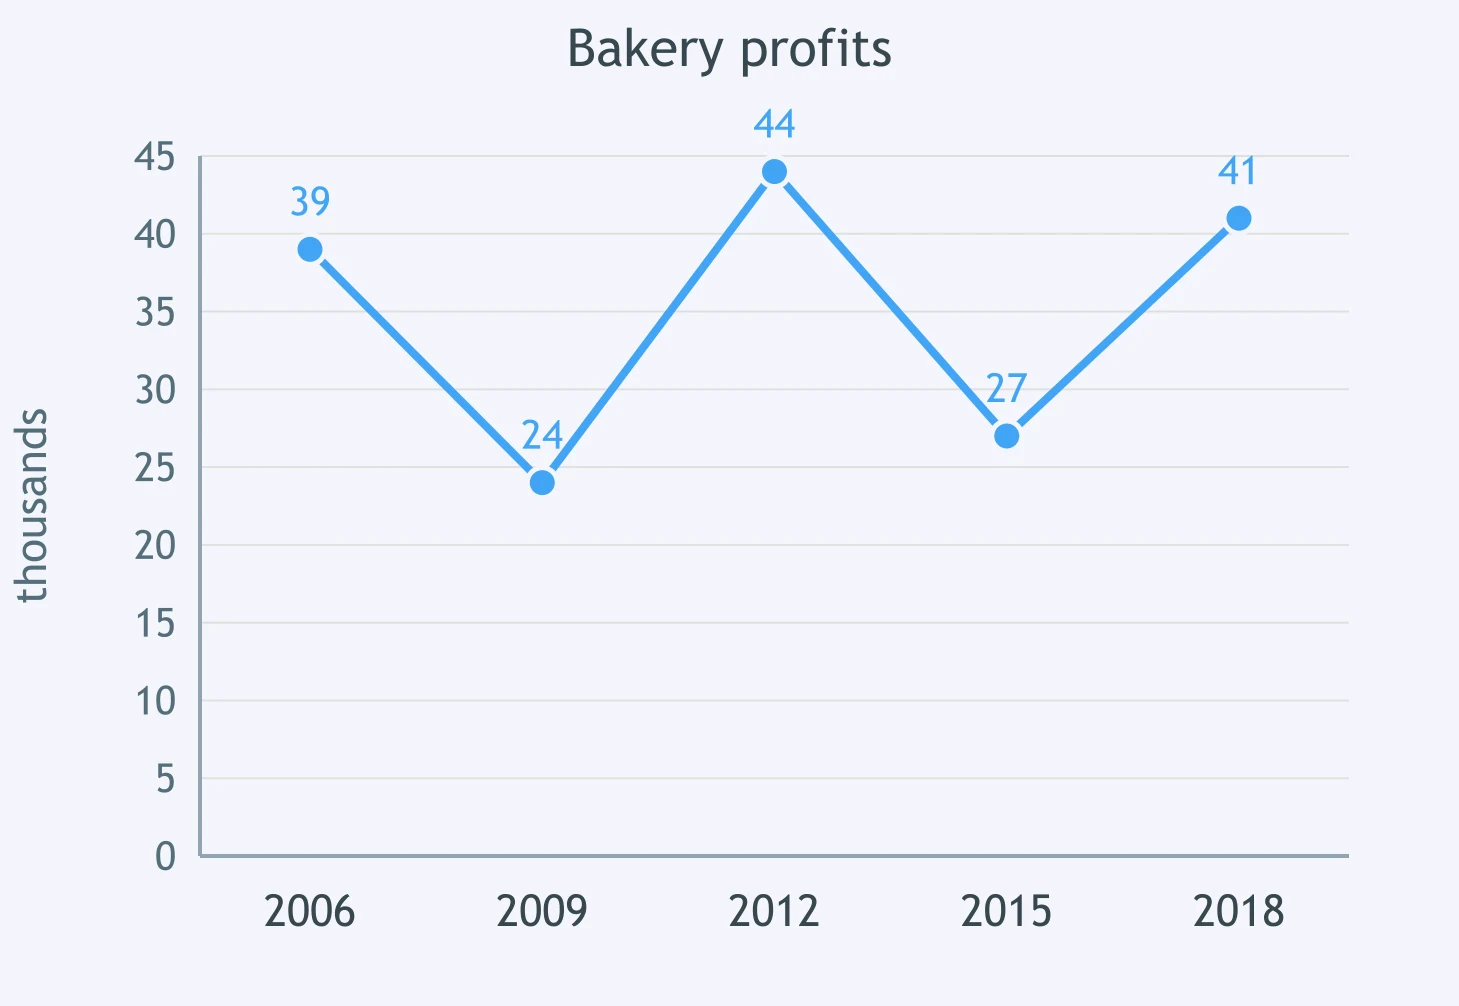
Bakery profits ___ over the 12-year period from 2006 to 2018.
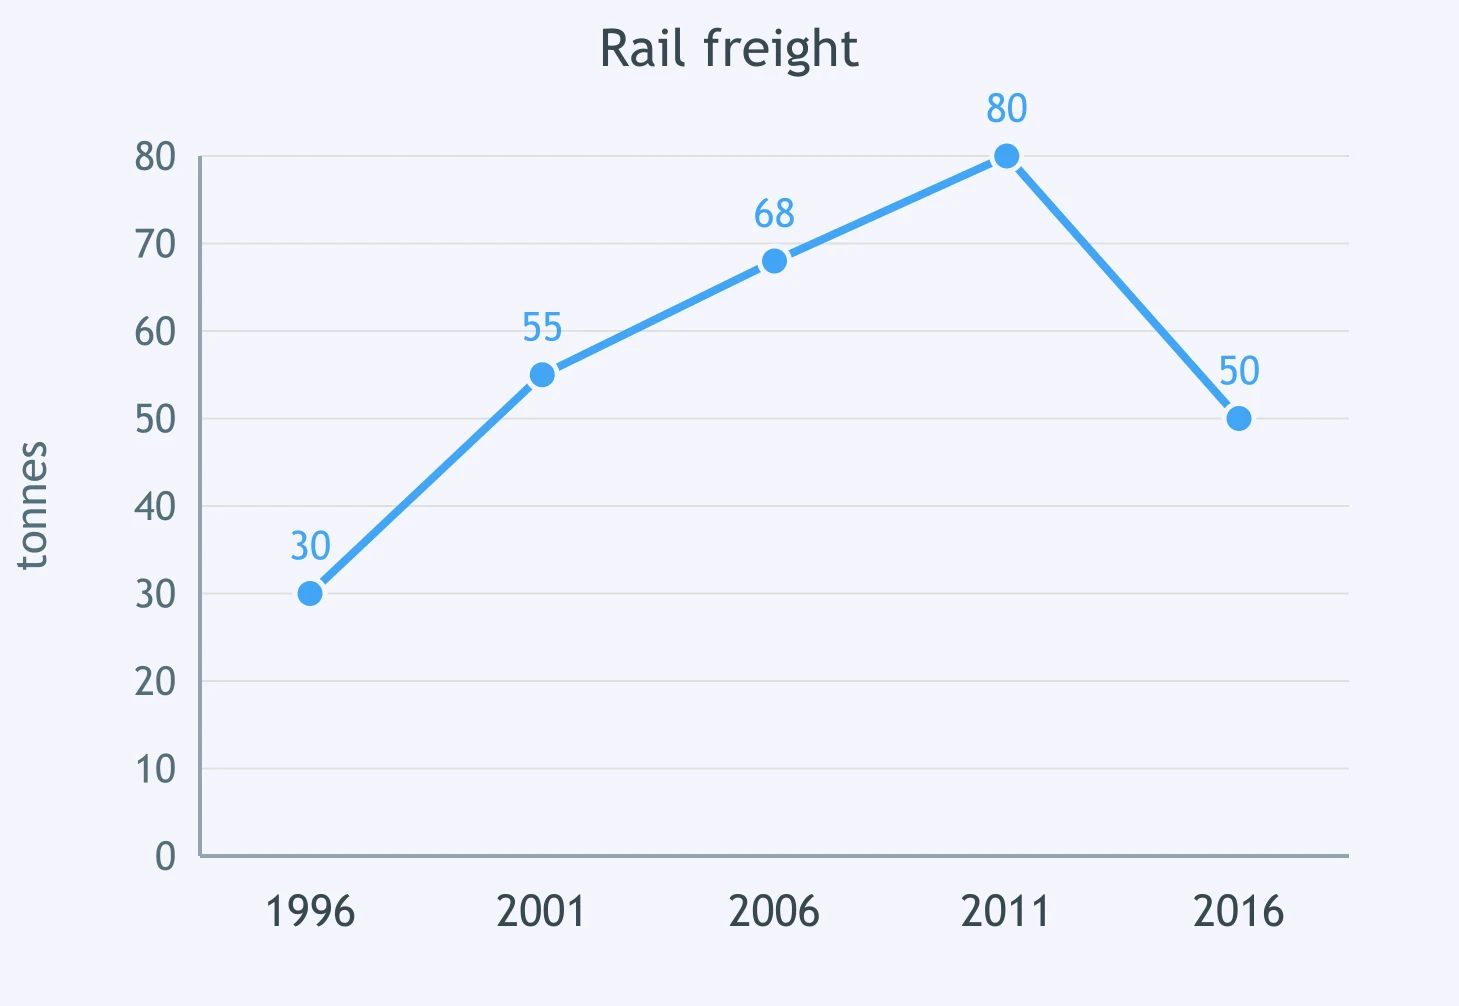
Read the graph carefully. Rail freight ___.
Crack the passcode before the zombies get in.
Answer, then swat bugs for bonus points.
Race through questions at your own speed.
Same question on every screen. Fastest wins.

Pick a tile, answer, hit bonuses and steals.
Increased BY or Increased TO: Task 1 Prepositions - IELTS 5.0 W T1
30 questions