Loading
by BlastRoom
Practice selecting key features and comparisons from bar charts for IELTS Task 1.
#writing_task_1#ielts_5_0

30 questions
One question set, multiple game modes. Tap any game to see it in action. Not sure which to pick?
Answer to place stones and capture territory.
Outrun the snow together.
Earn blasts, then hunt the other team.
Answer to earn energy, then climb.

The class blasts through walls together.
Bid on mystery lots. Most money wins.
Sell tours. Nice, standard, or a total scam.

Answer, restock, and serve the rush.
More correct answers pulls the rope your way.
Answer, then shoot down the alien wave.
Answer, then tap to leap the frozen ridge.
The bar chart shows how students travel to college. Which sentence matches the tallest bar?
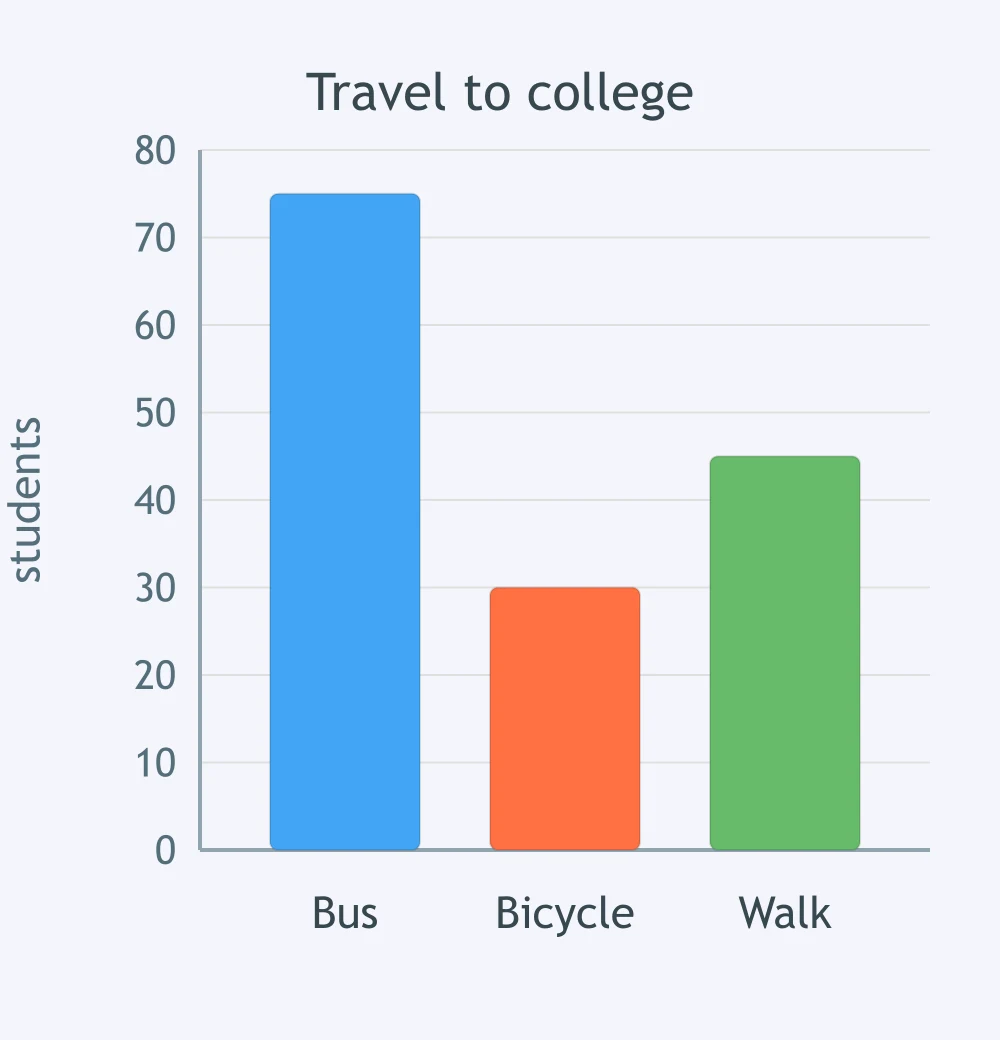
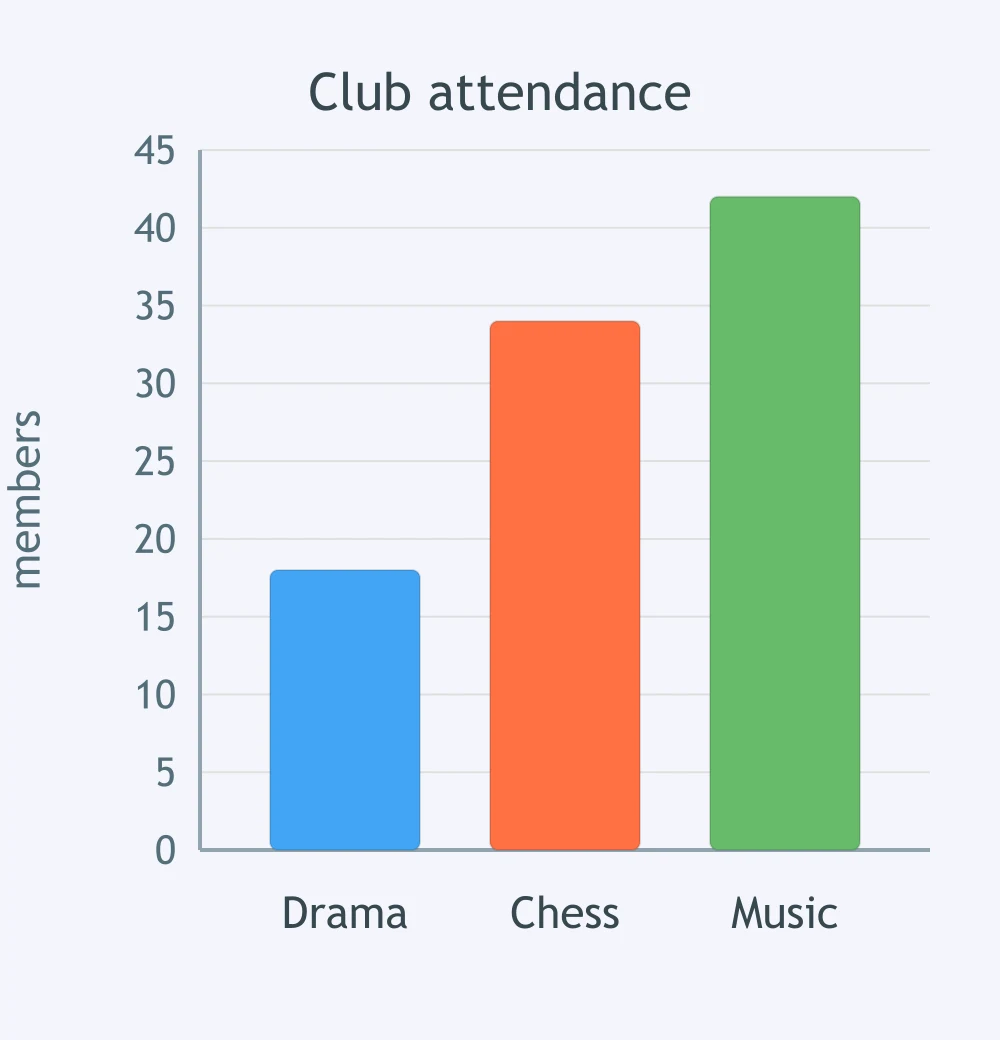
The bar chart shows attendance at three clubs. Which sentence matches the shortest bar?
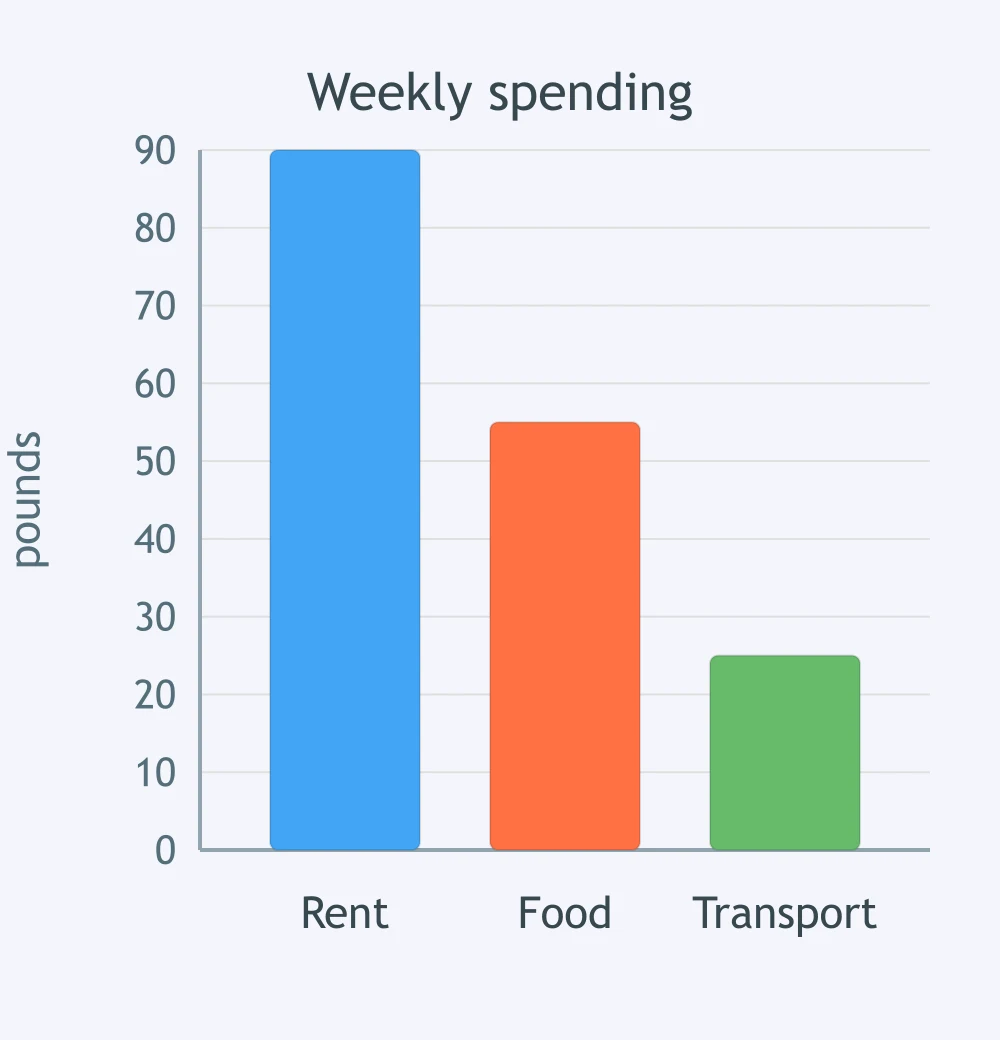
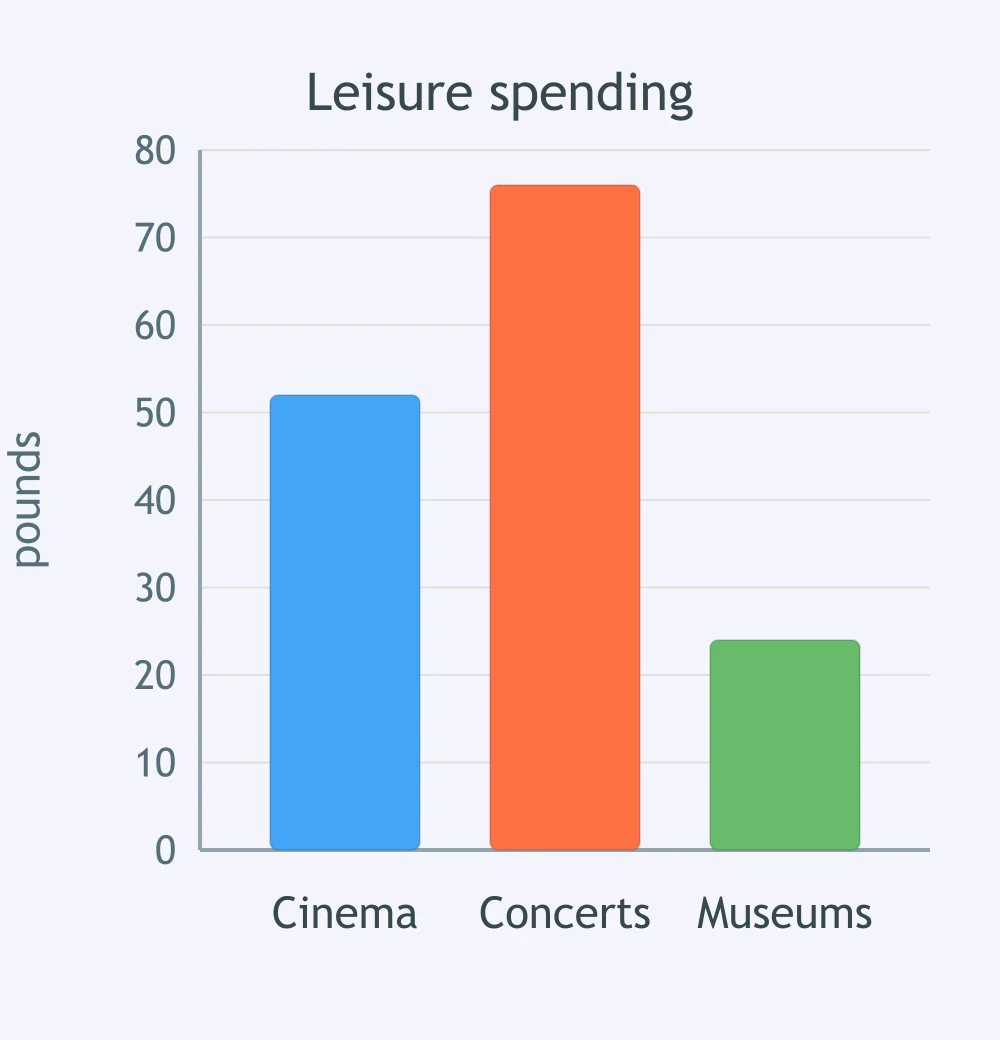
The chart shows weekly spending in three areas. Which sentence describes the highest bar?
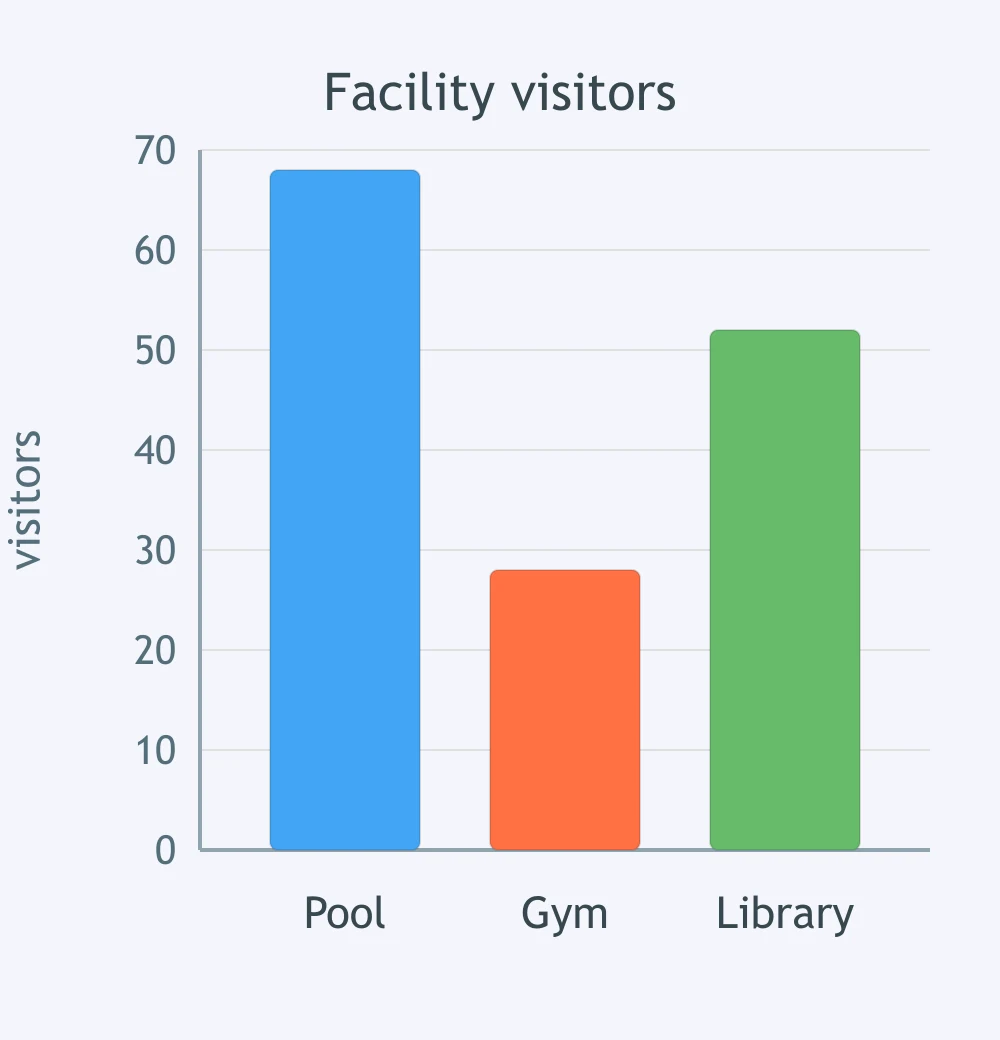
The bar chart compares visitors to three facilities. Which sentence matches the smallest bar?
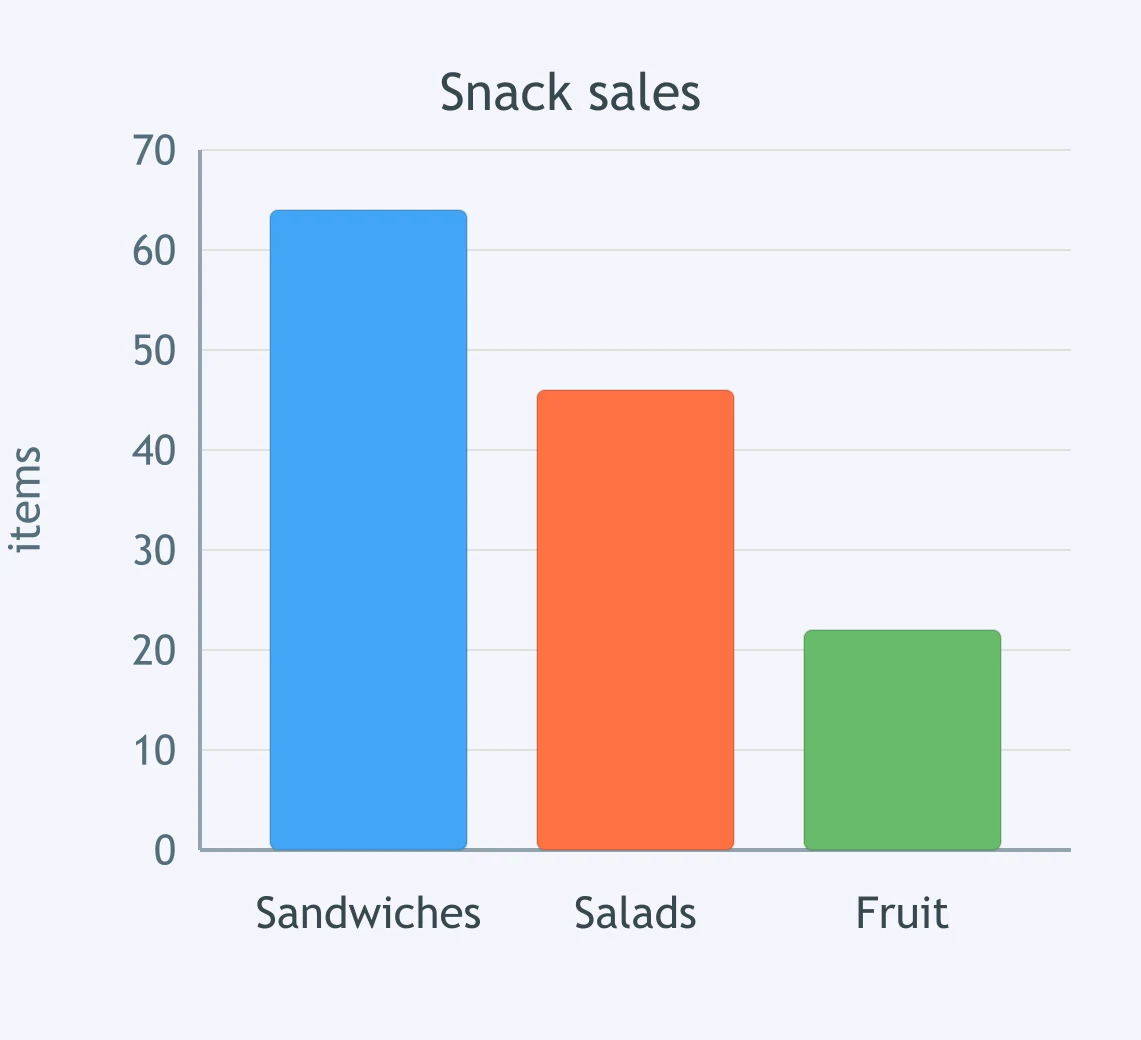
The chart shows sales of three snacks. Which sentence identifies the leading item?
The chart compares reasons for using a language app. Which sentence matches the least common reason?
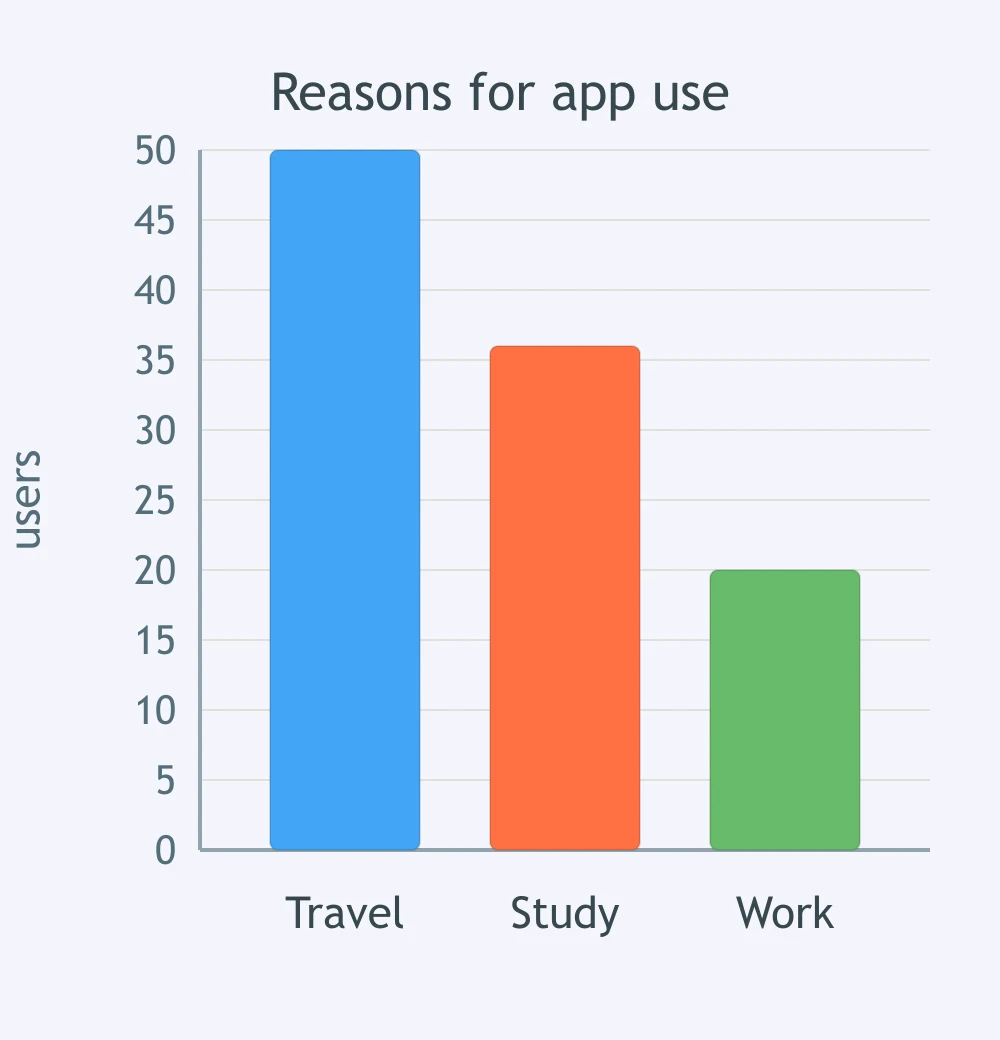
The bar chart shows preferred weekend activities. Which sentence names the most popular activity?
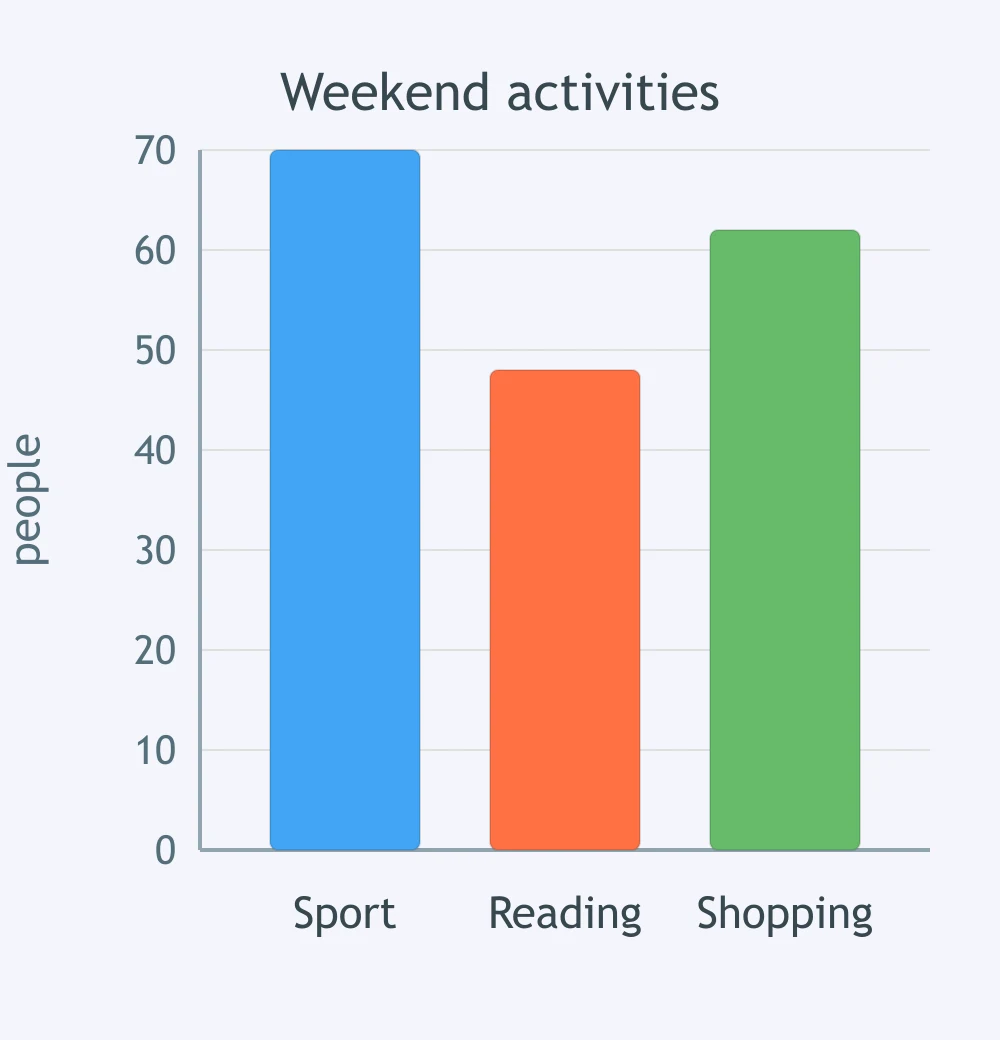
Compare the bars for coffee and tea. Which sentence matches the chart?
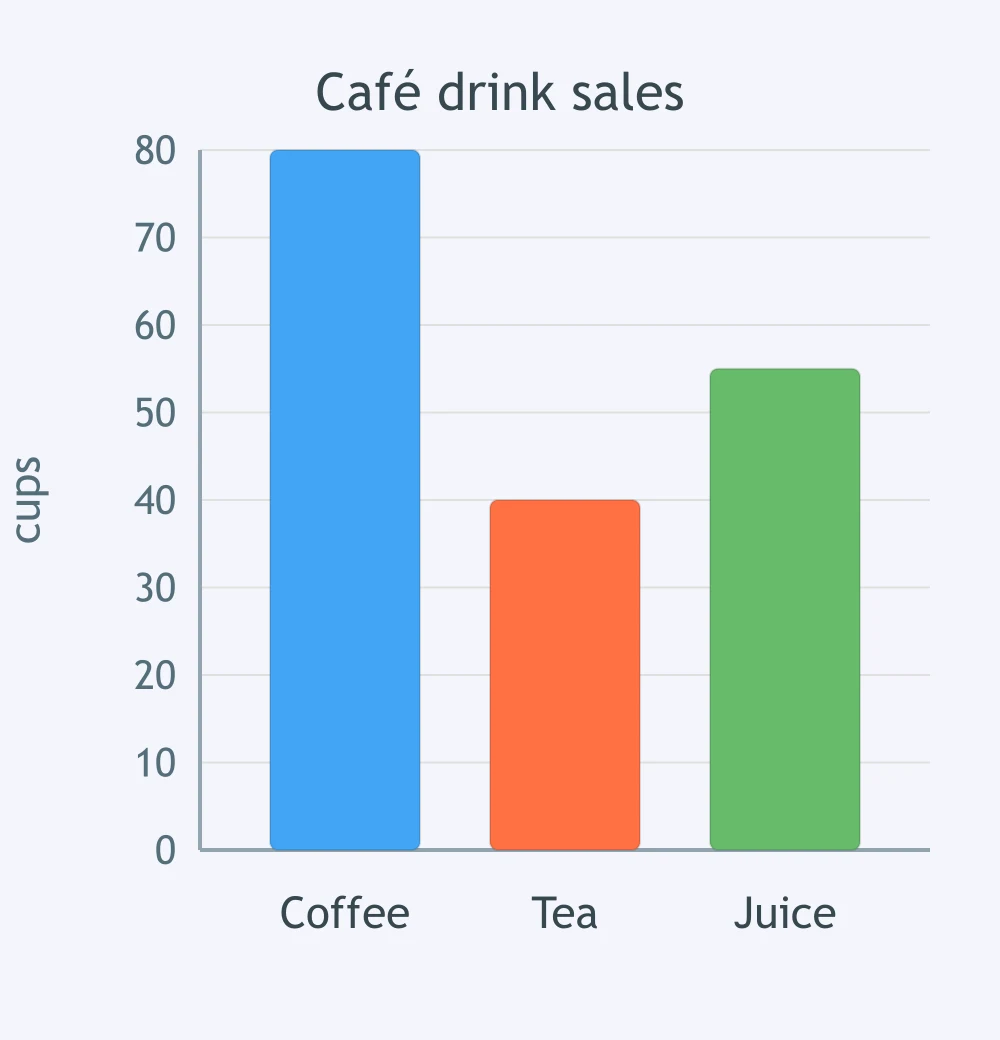
Look at the bars for buses and trains. Which sentence best describes the comparison?
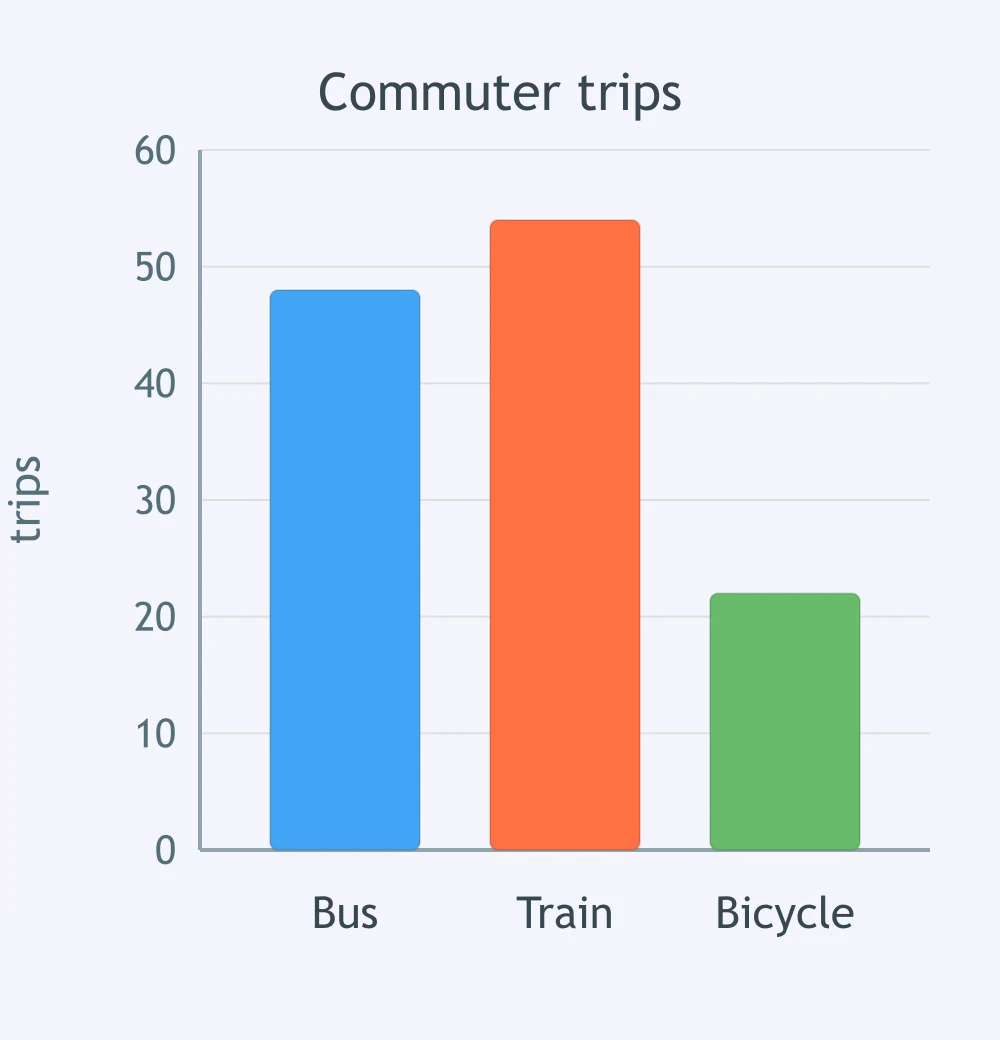
Compare the bars for rent and bills. Which sentence matches the chart?
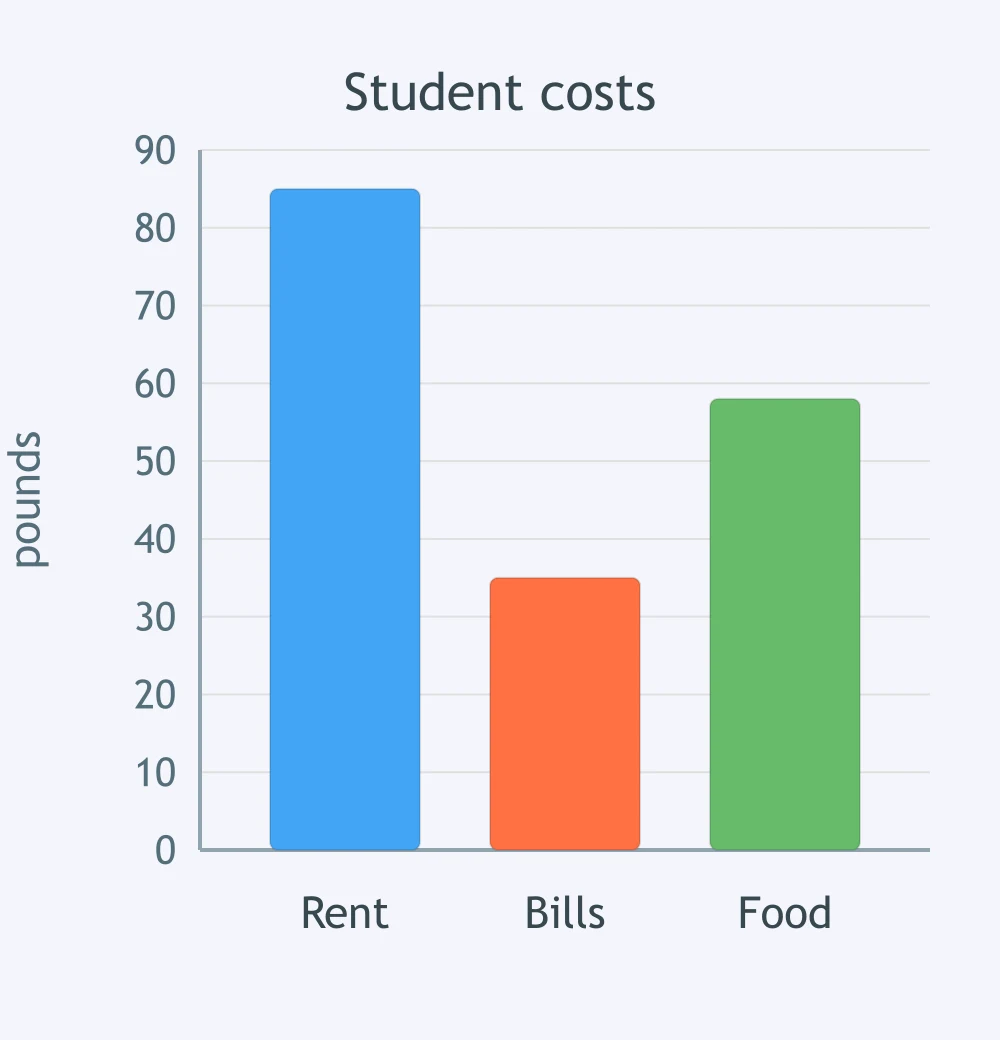
The chart shows enrolments in three courses. Compare art and computing. Which sentence is accurate?
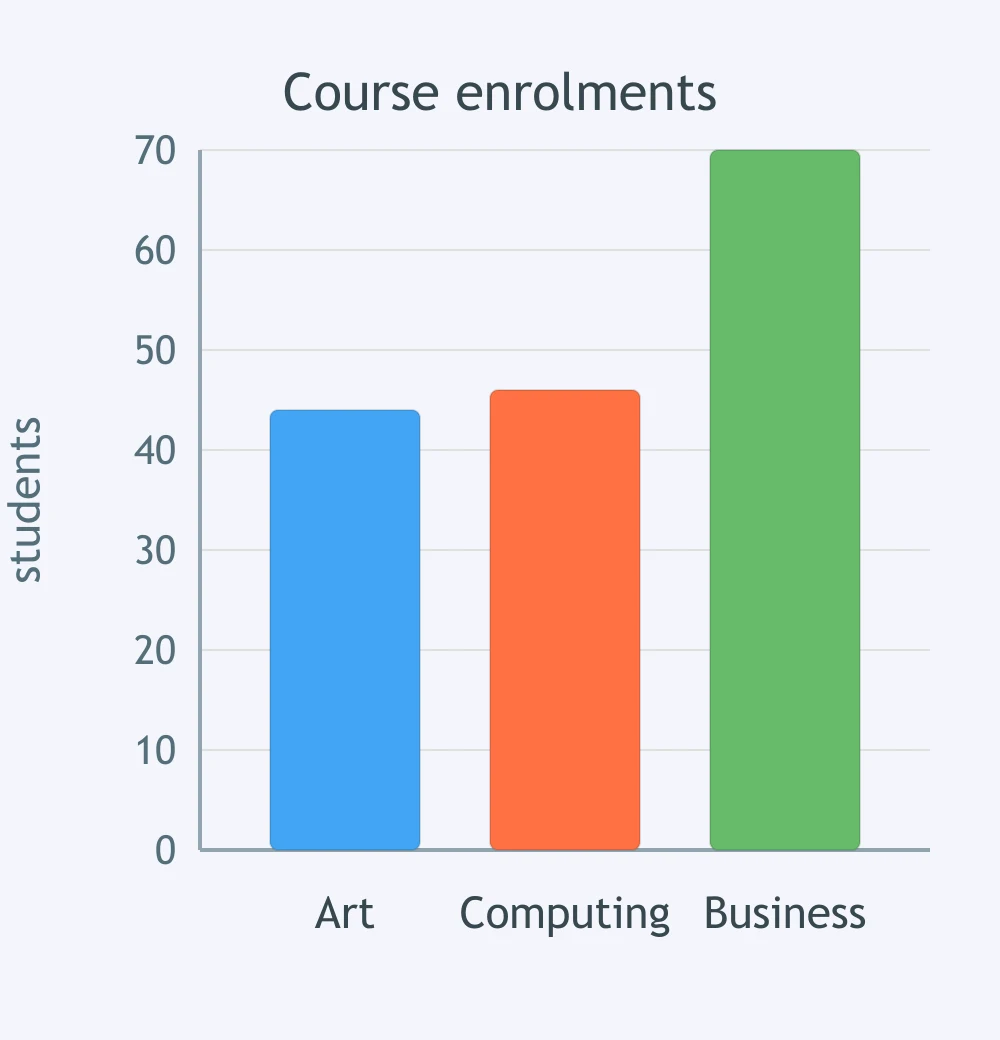
Compare the bars for online and in-store sales. Which sentence matches the chart?
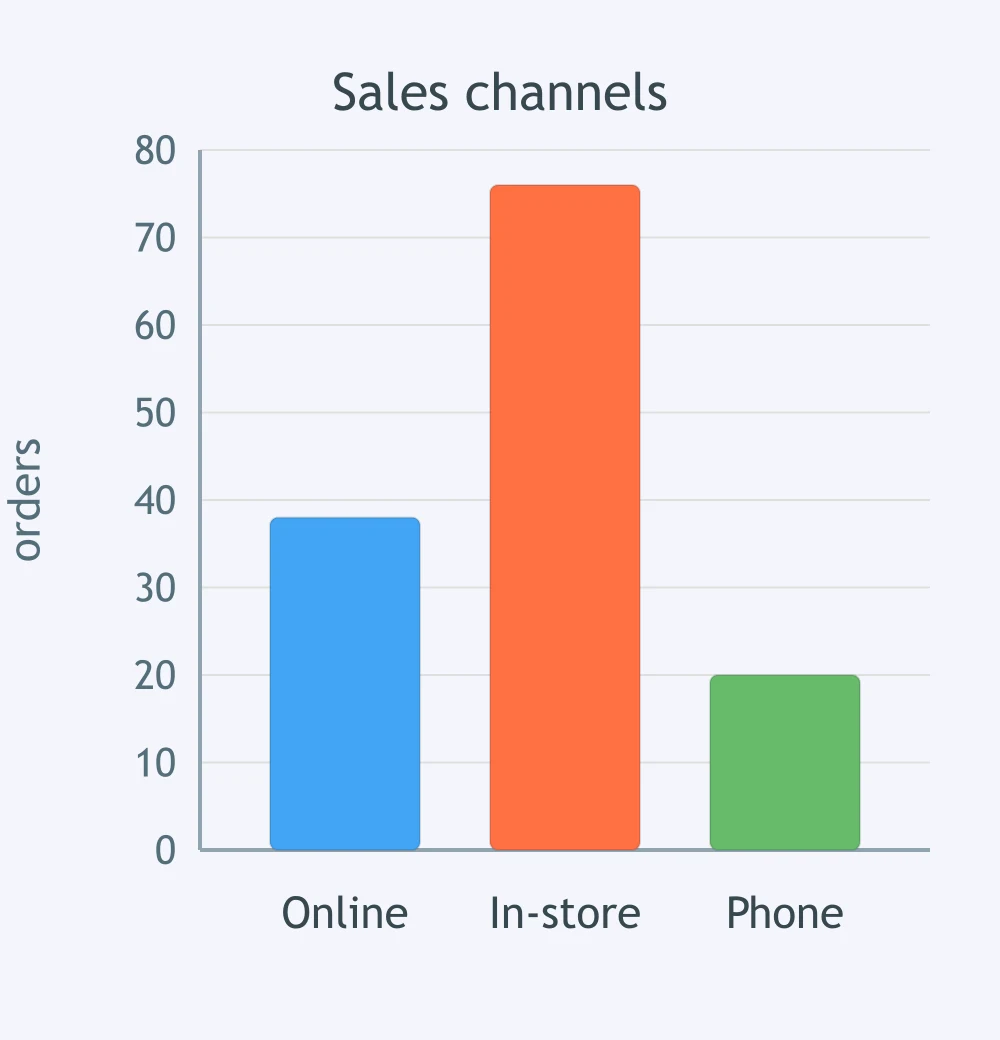
In the chart, compare the bars for apples and bananas. Which sentence is supported?
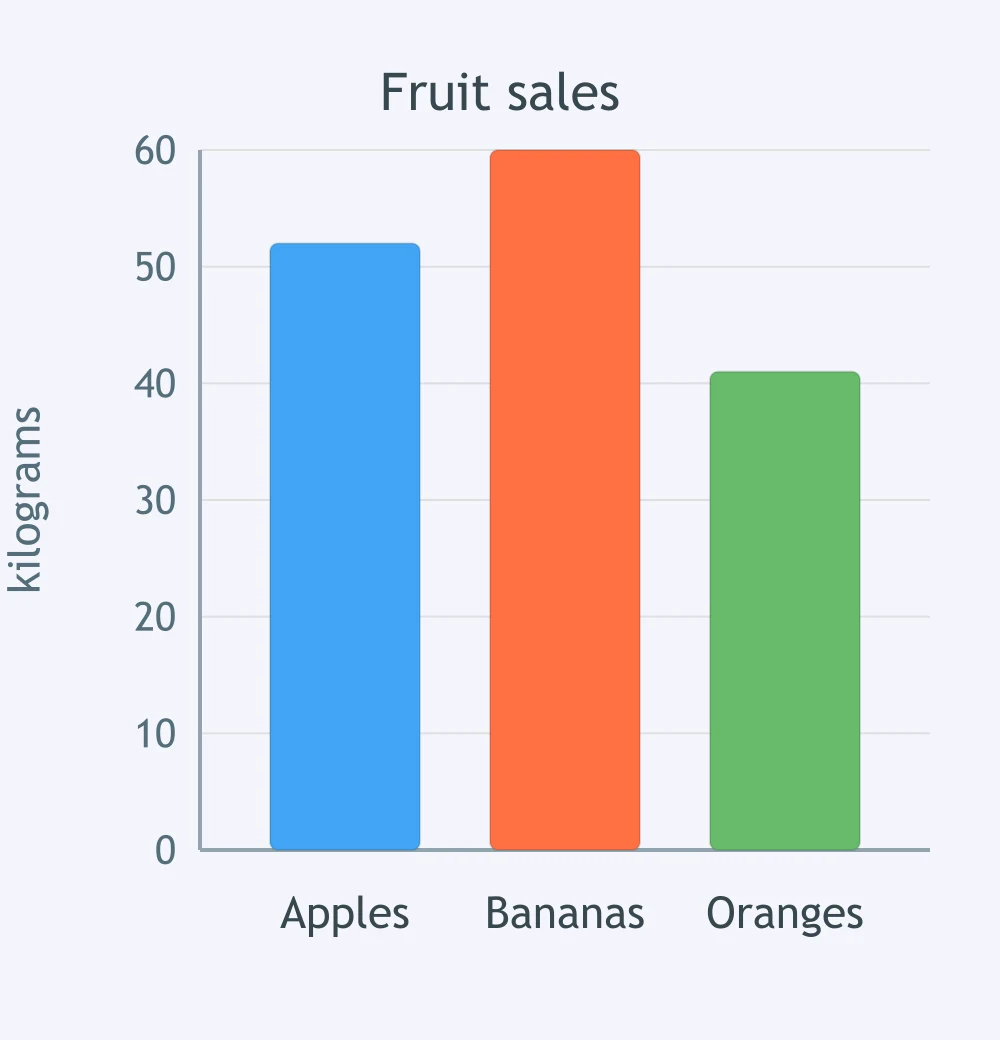
Compare the bars for morning and evening gym visits. Which sentence fits the chart?
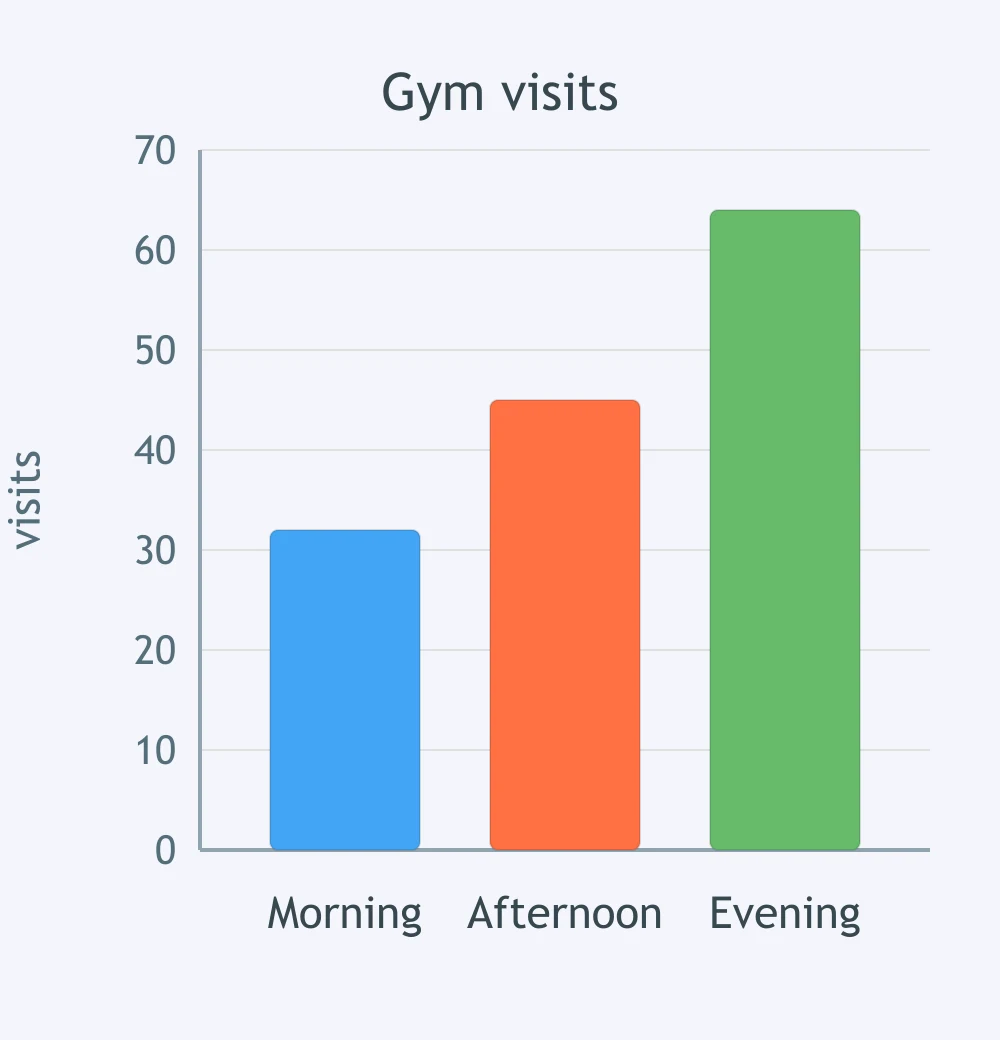
The chart compares three age groups. Compare under-25s and over-55s. Which sentence is accurate?
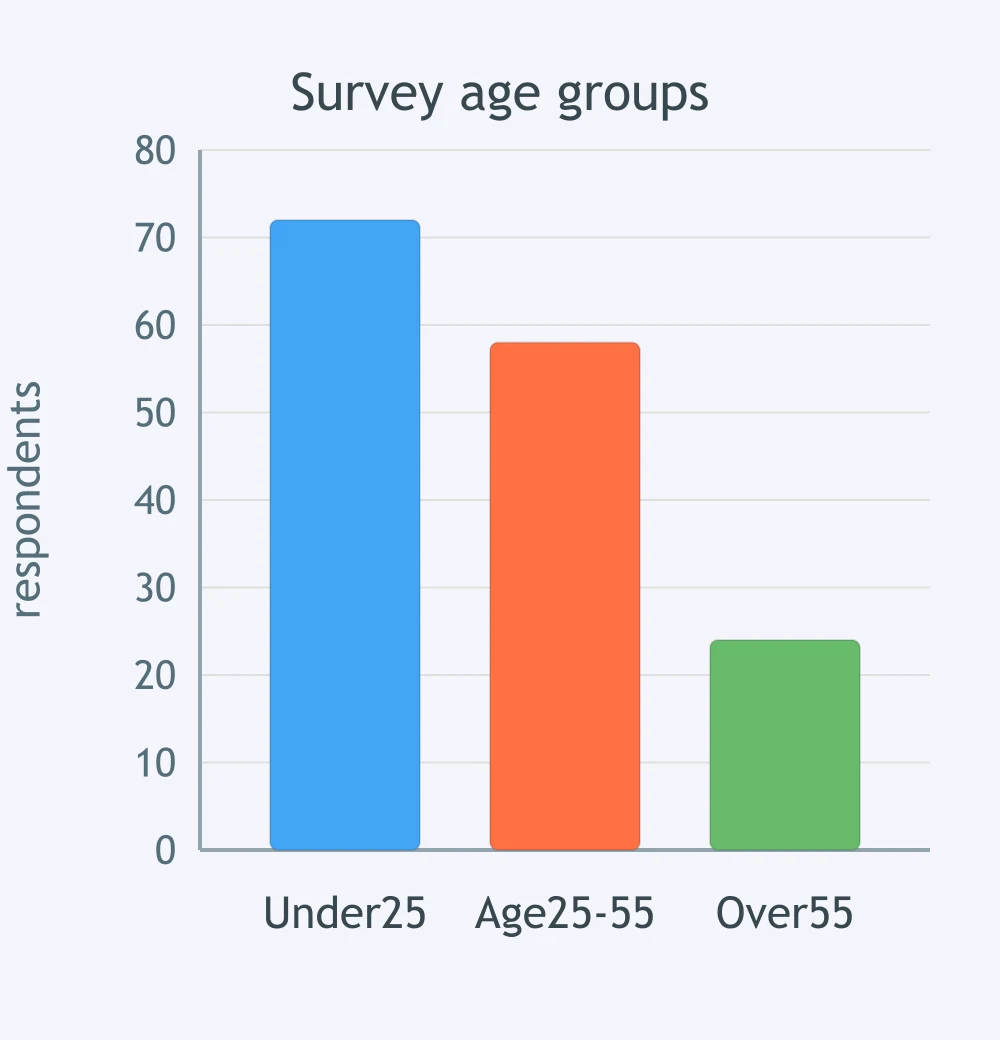
Each category has bars for 2015 and 2025. Which sector shows the largest increase?
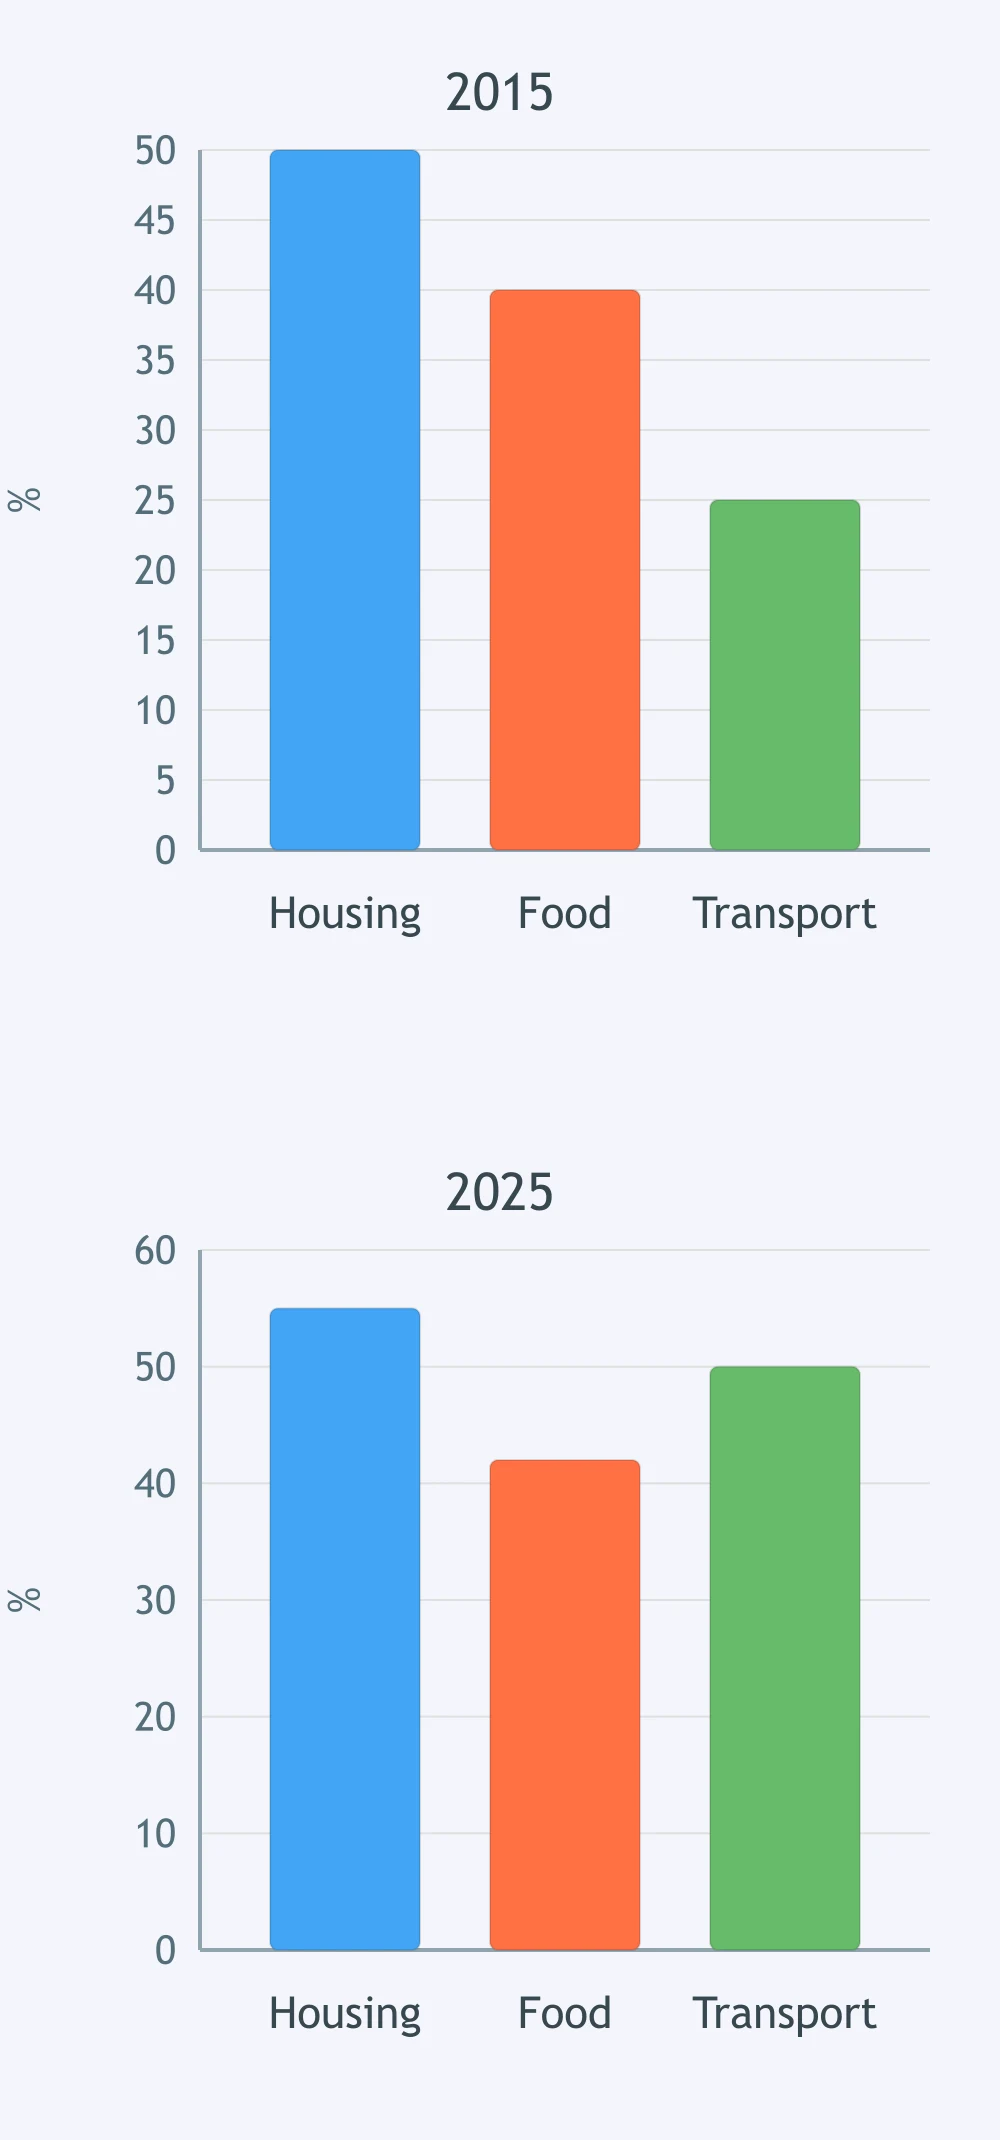
The grouped bars show 2010 and 2020 results. Which country changed the least?
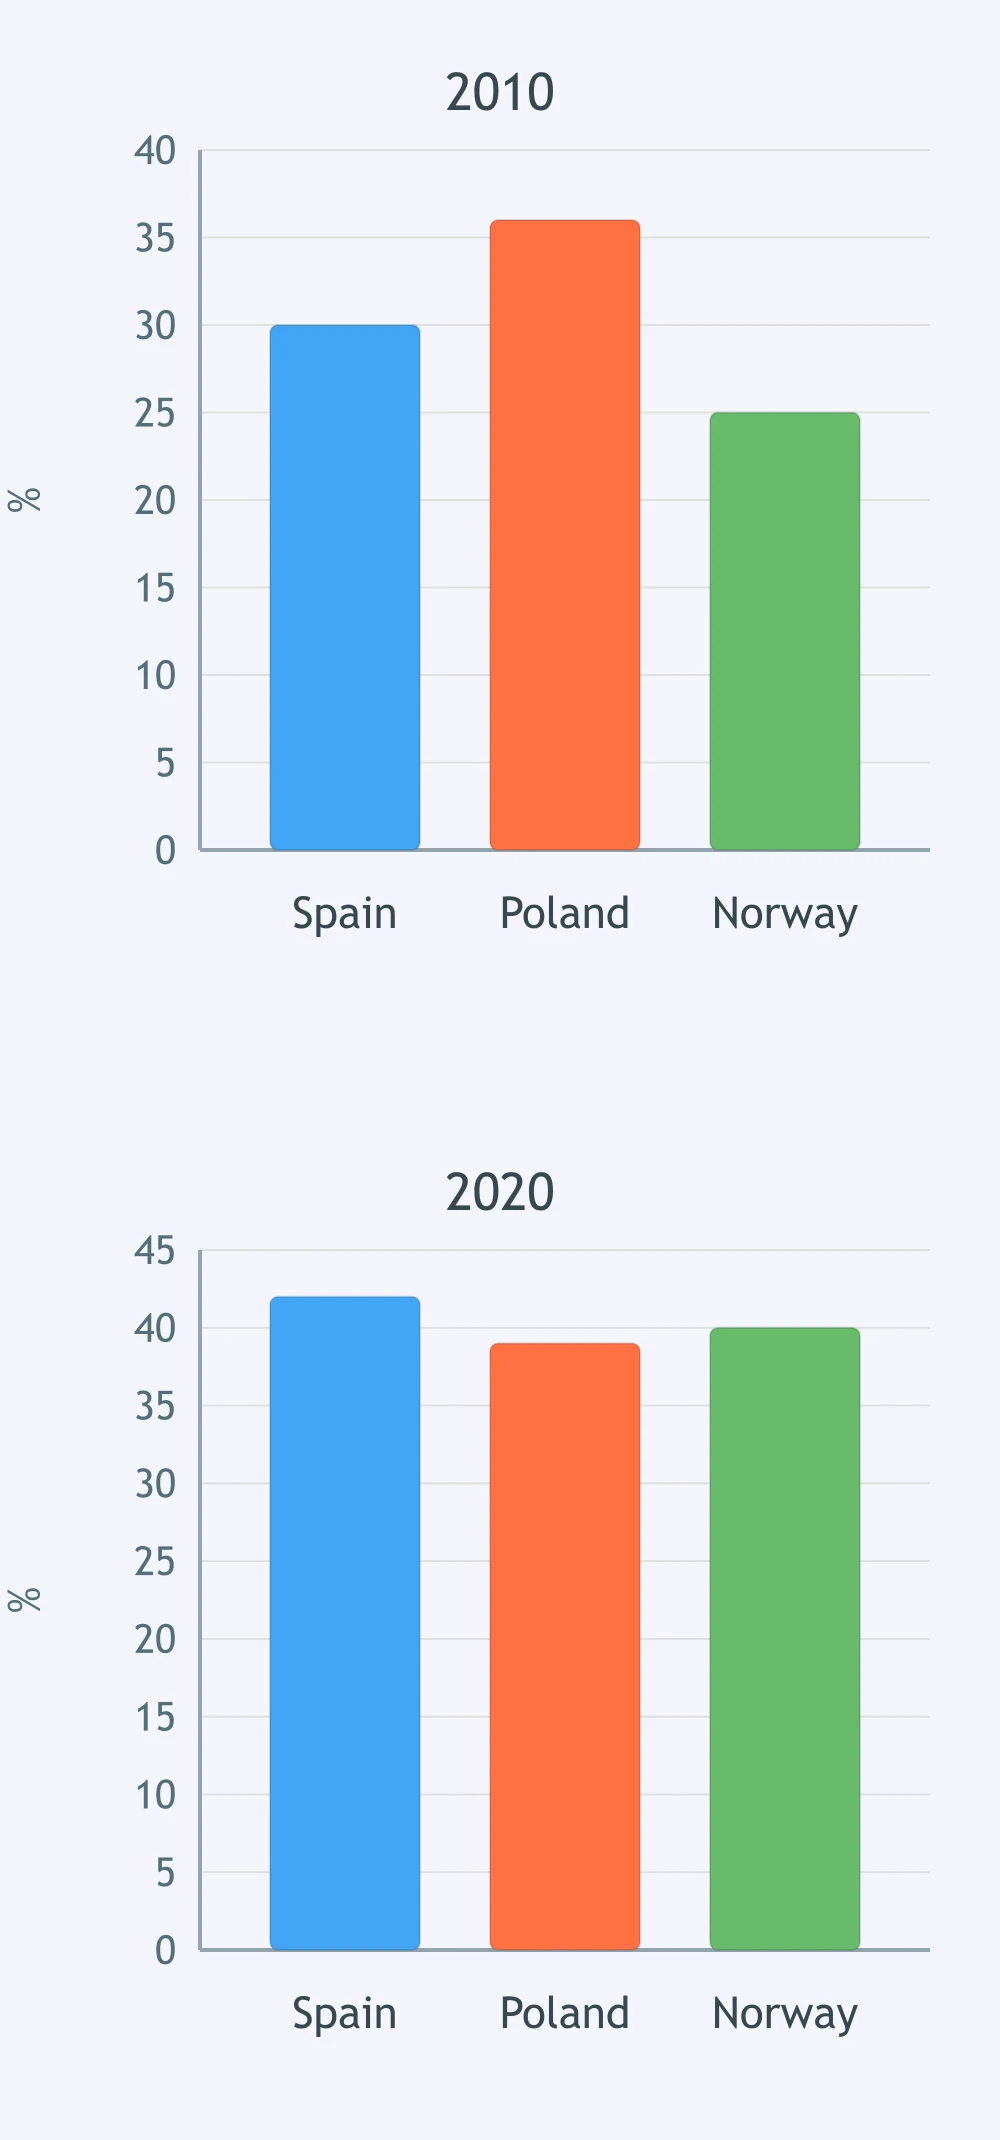
Each product has bars for April and May. Which product had the greatest fall?
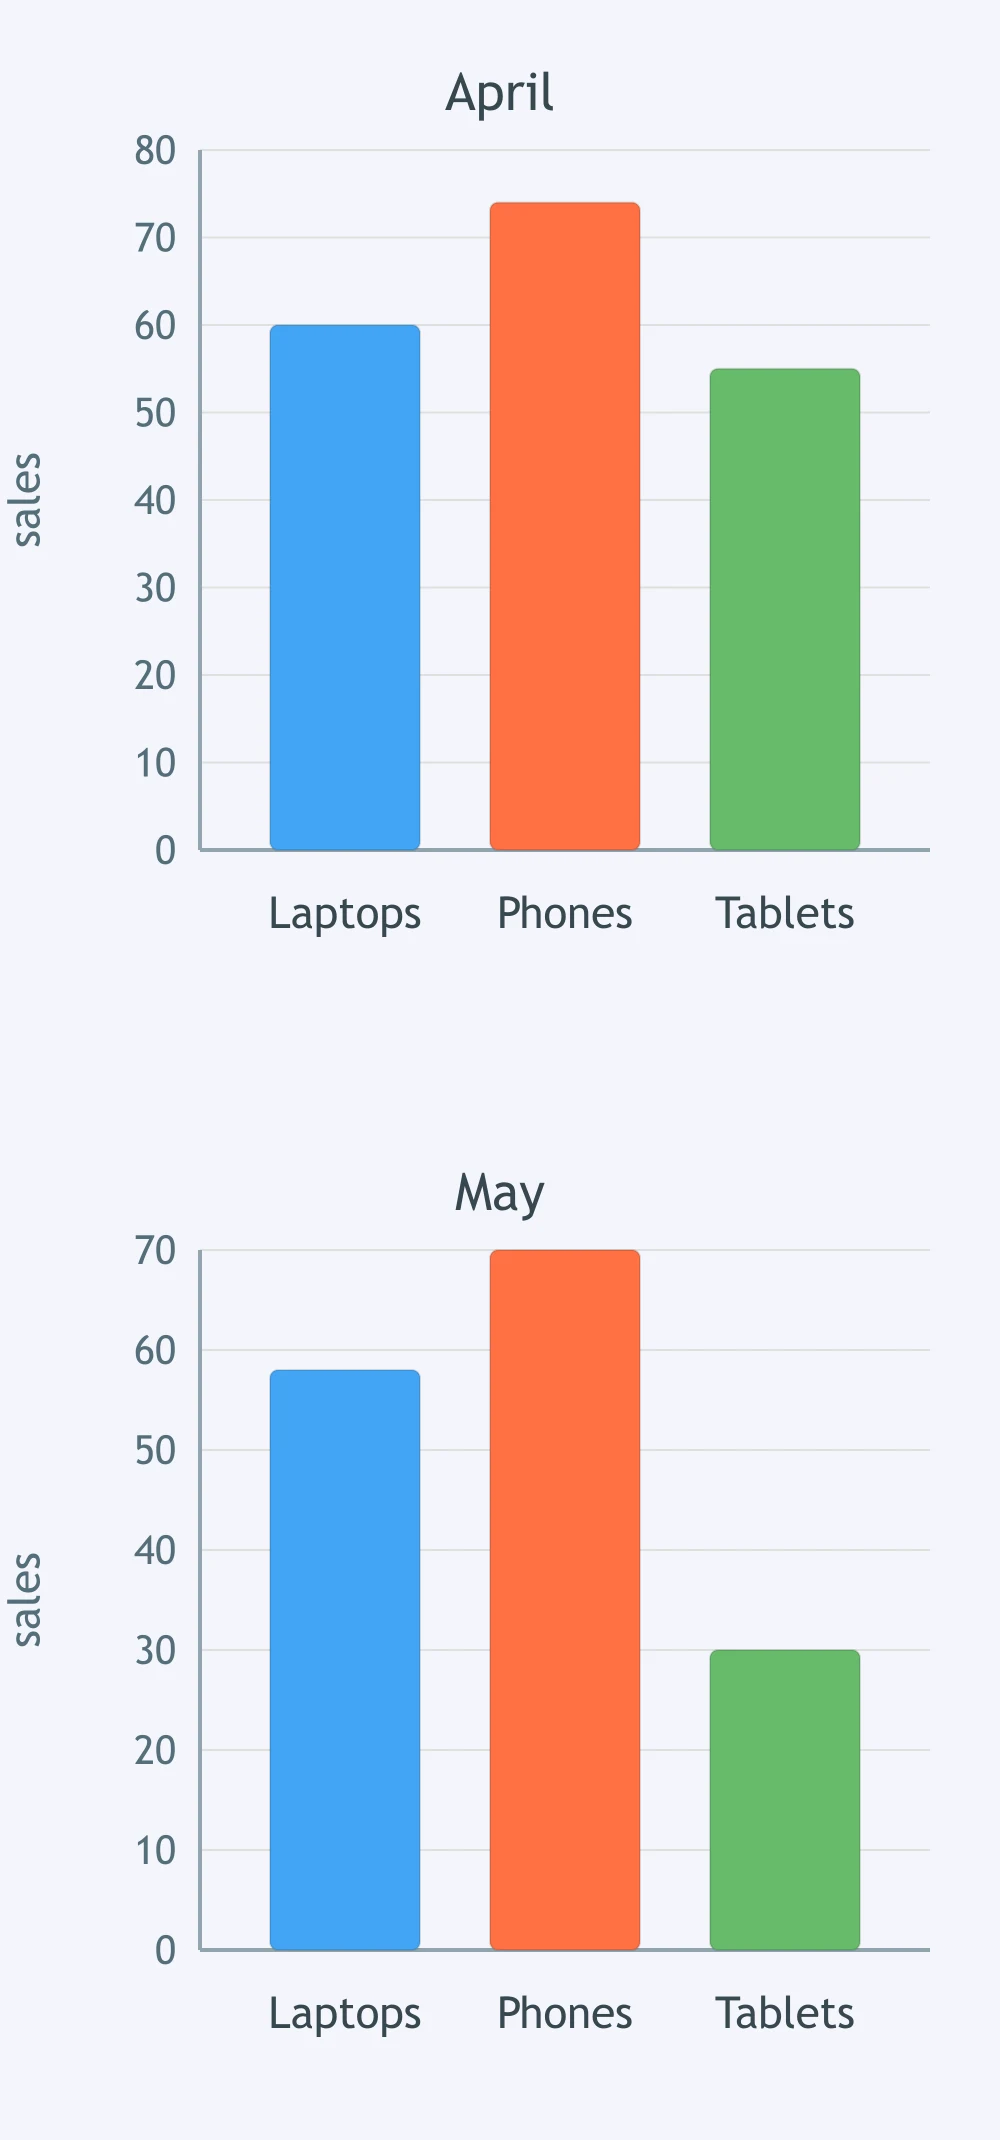
The chart has bars for men and women in each activity. Which activity shows the smallest gender gap?
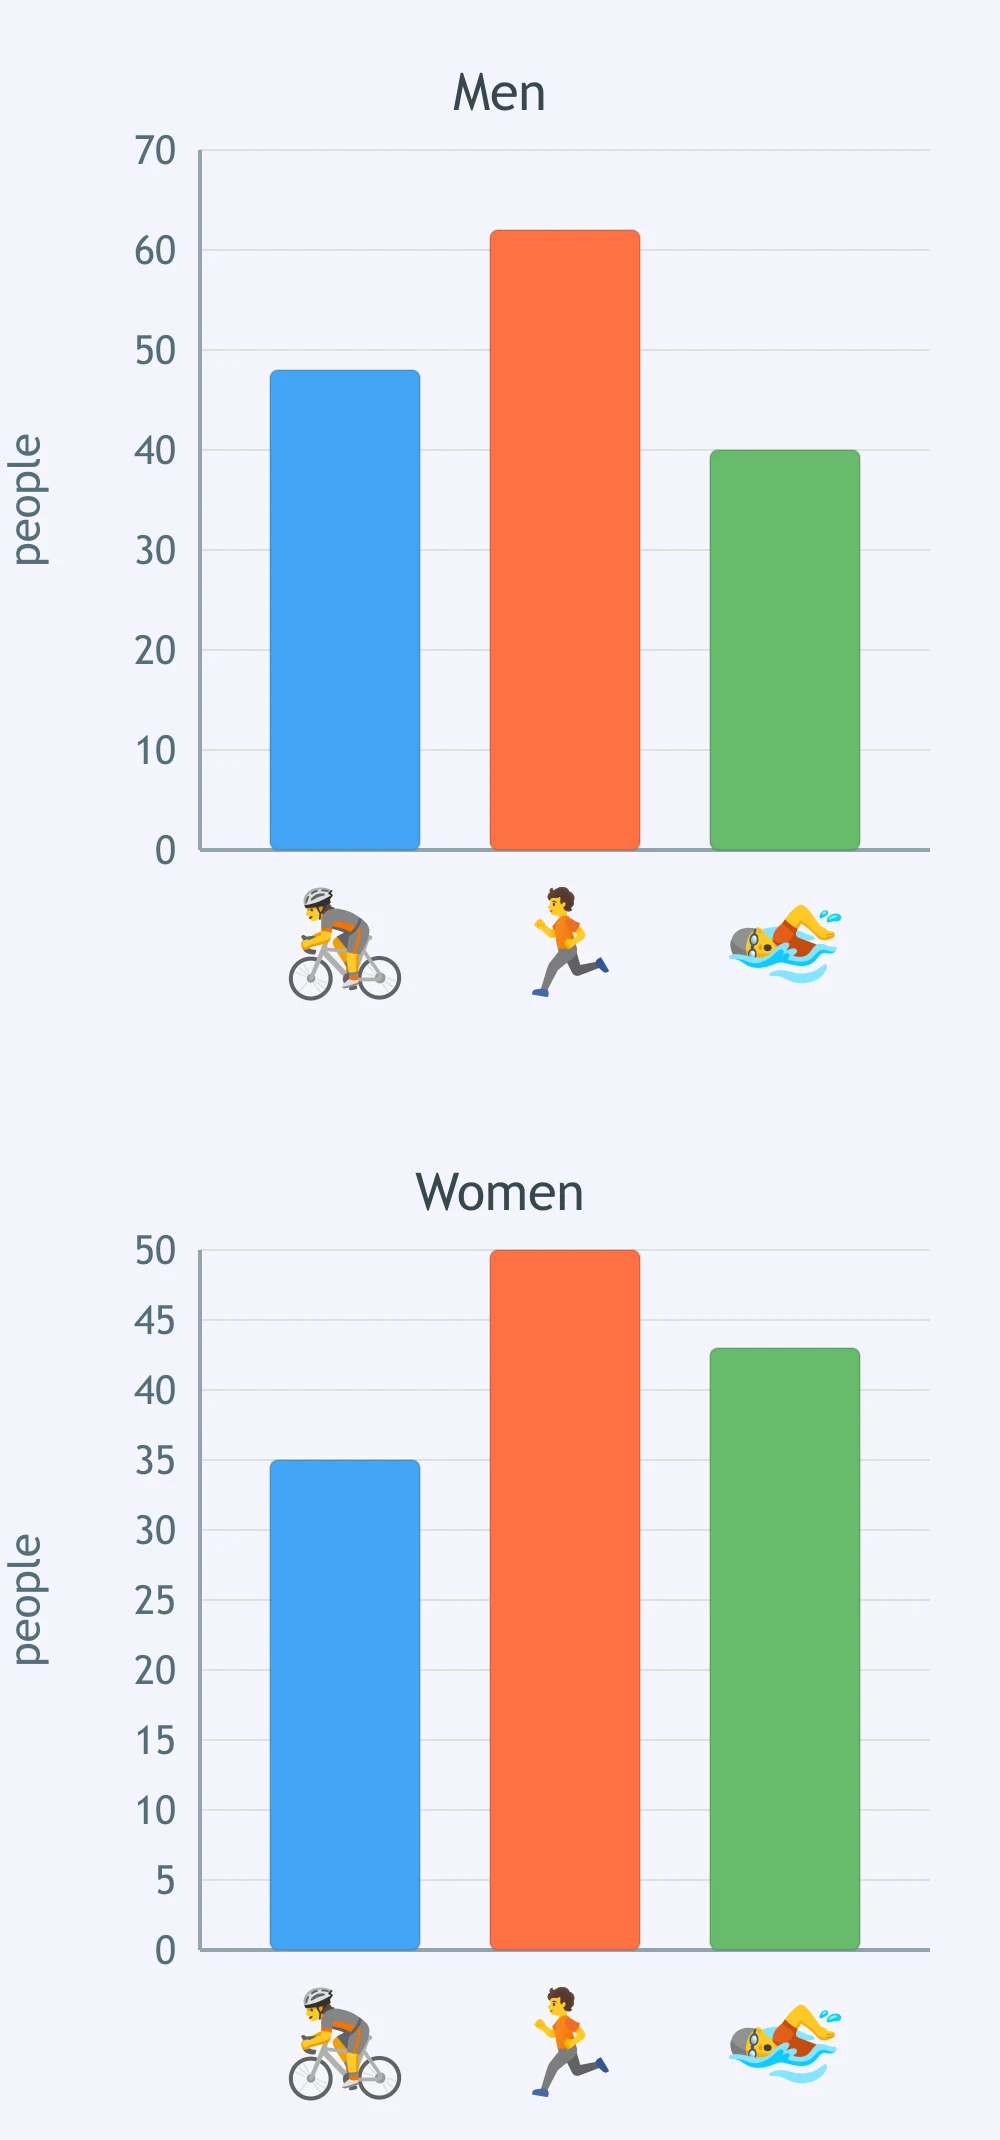
Each region has bars for 2018 and 2022. Which region shows the strongest growth?
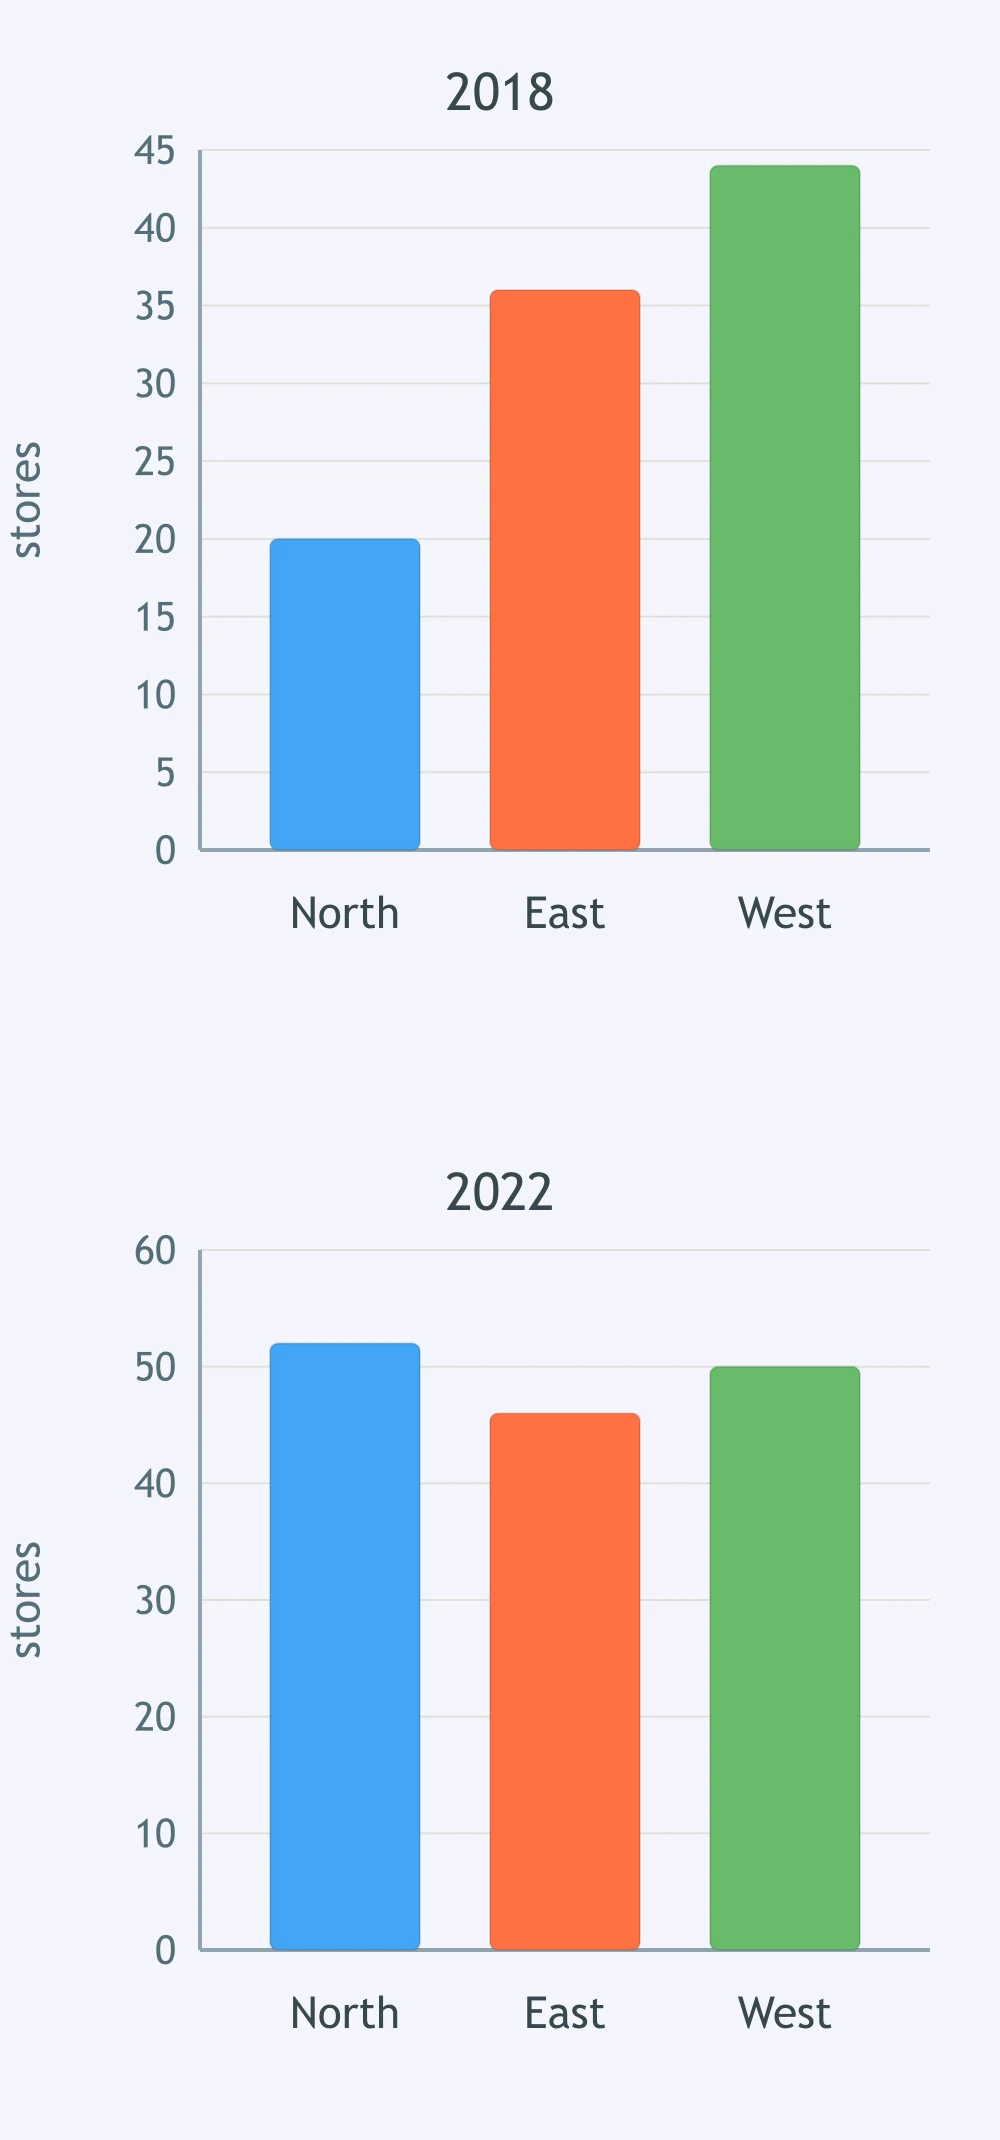
The grouped bars compare weekdays and weekends. Which activity is more popular at weekends than on weekdays?
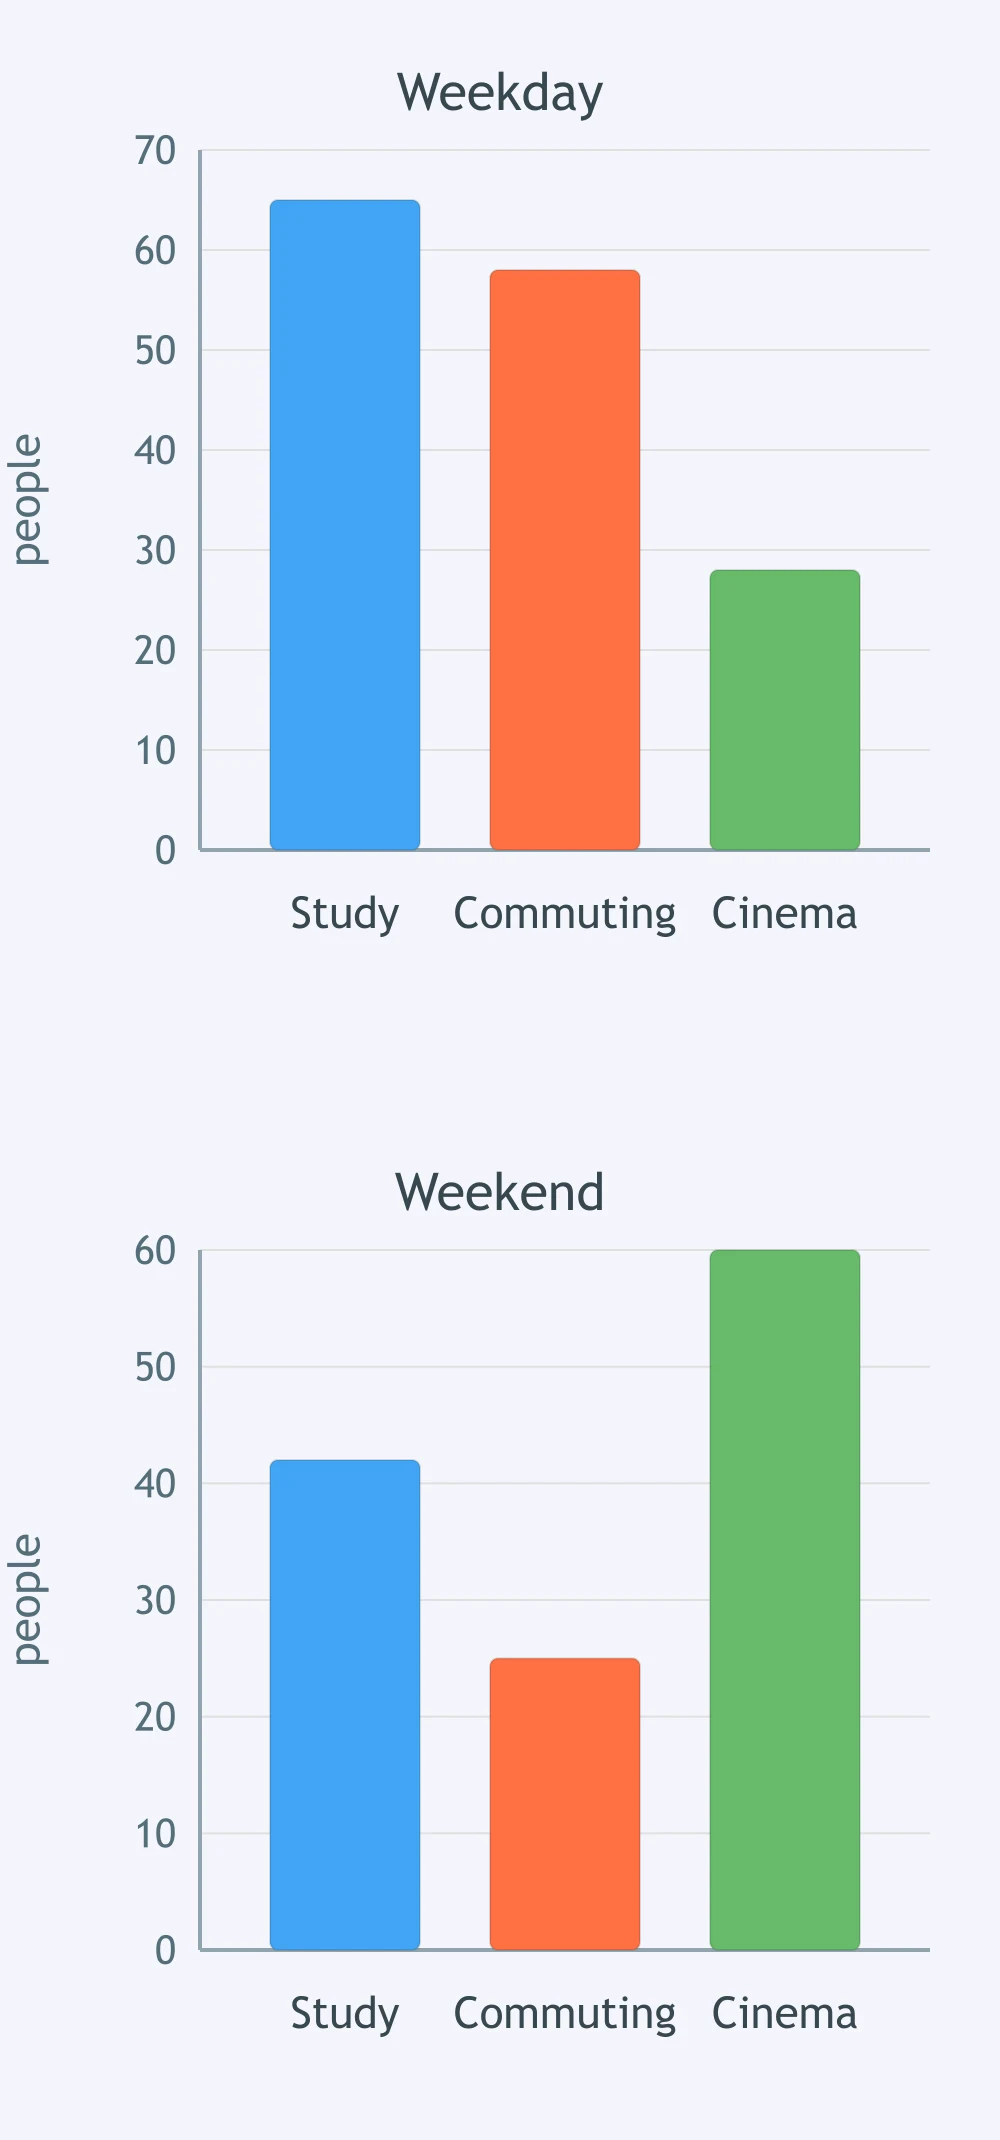
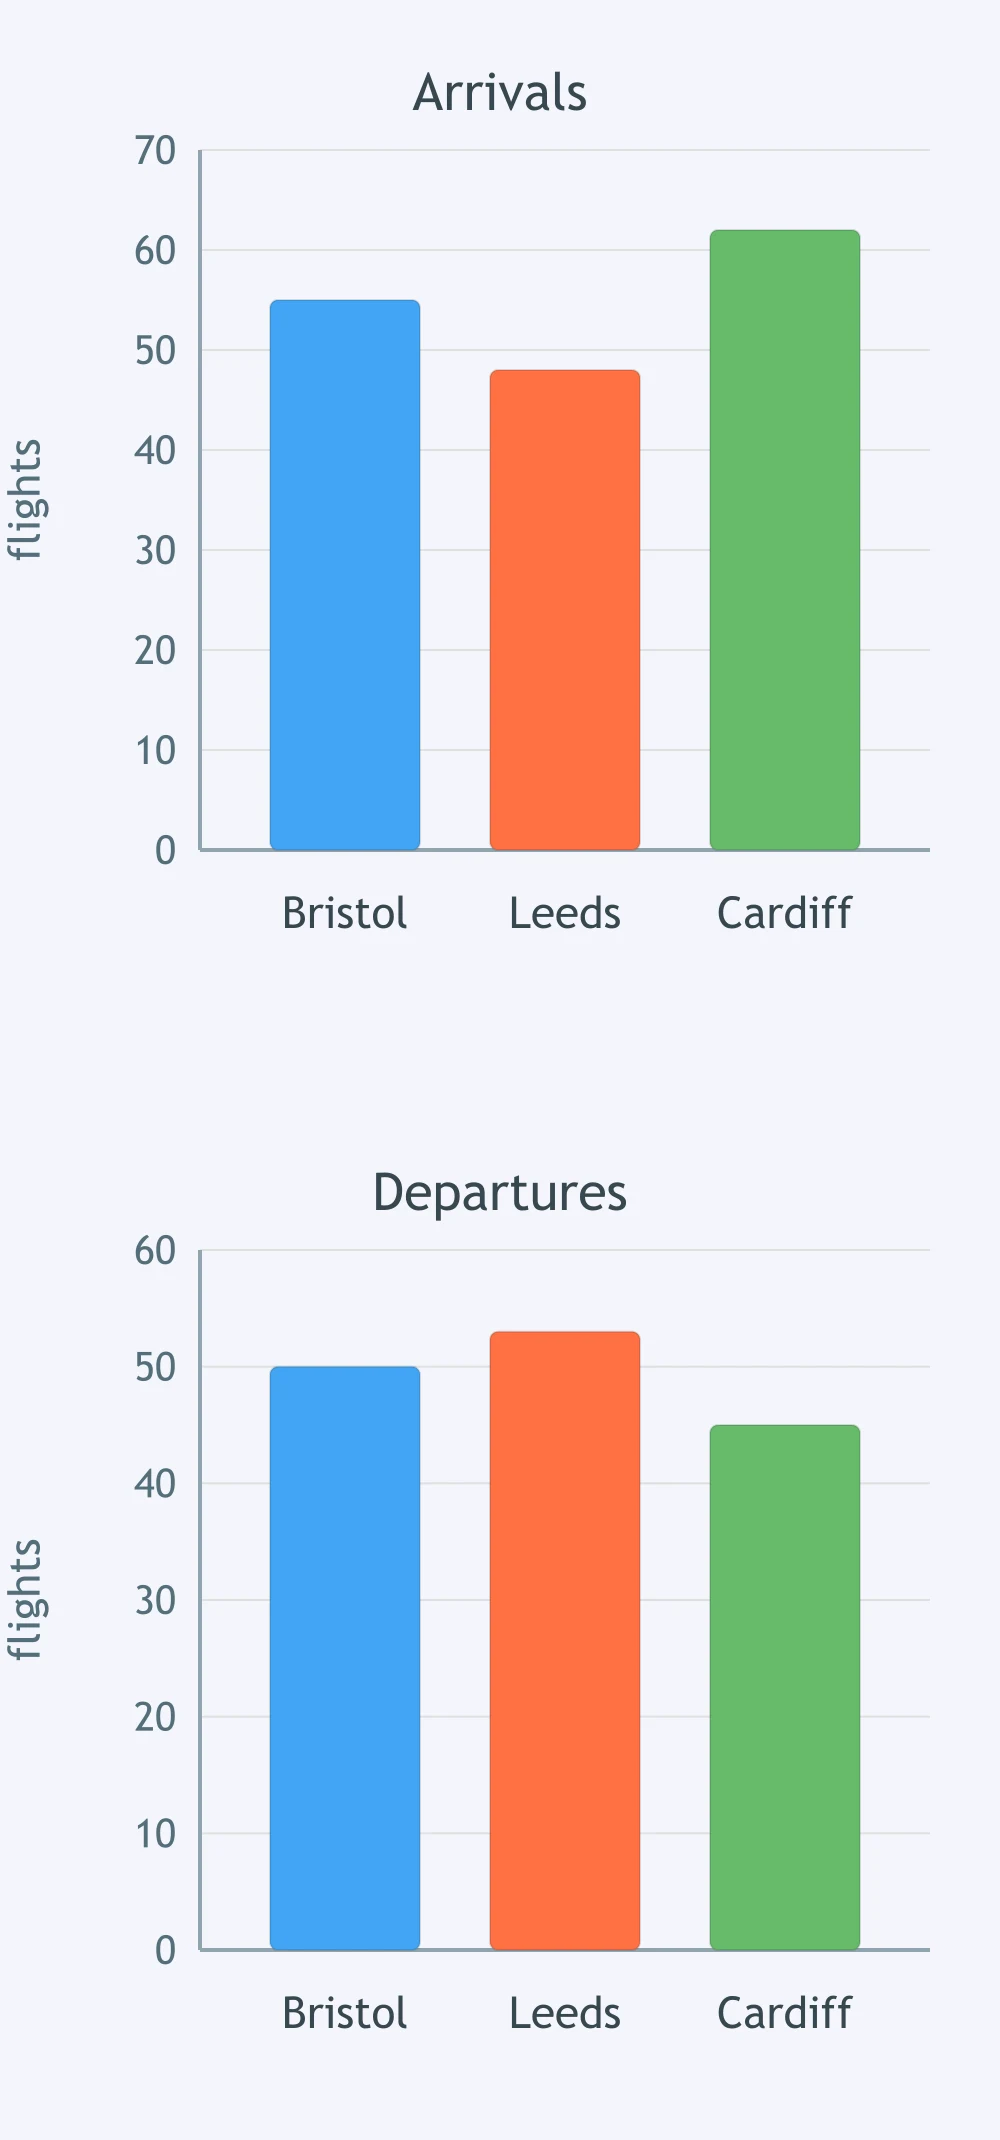
Each city has bars for arrivals and departures. Which city has departures slightly above arrivals?
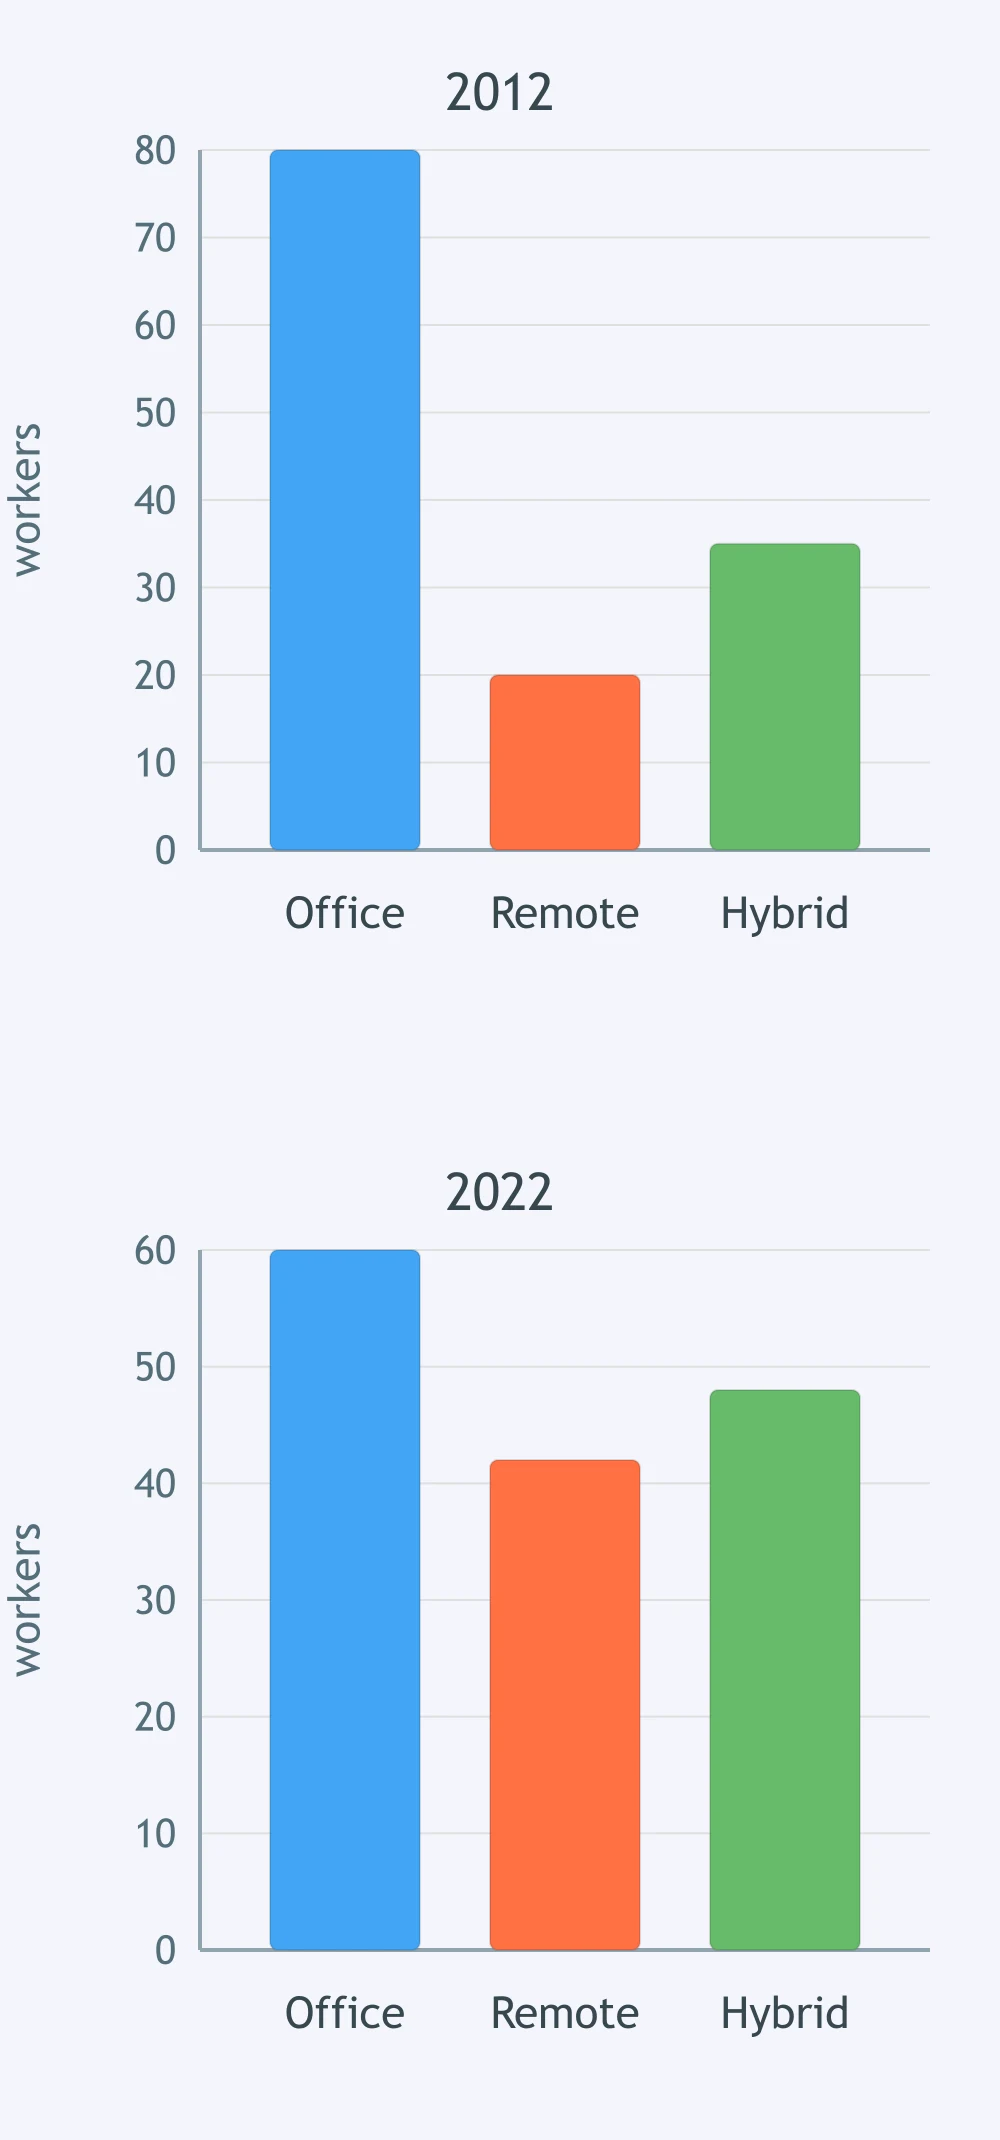
The grouped chart compares 2012 and 2022. Which category roughly doubled?
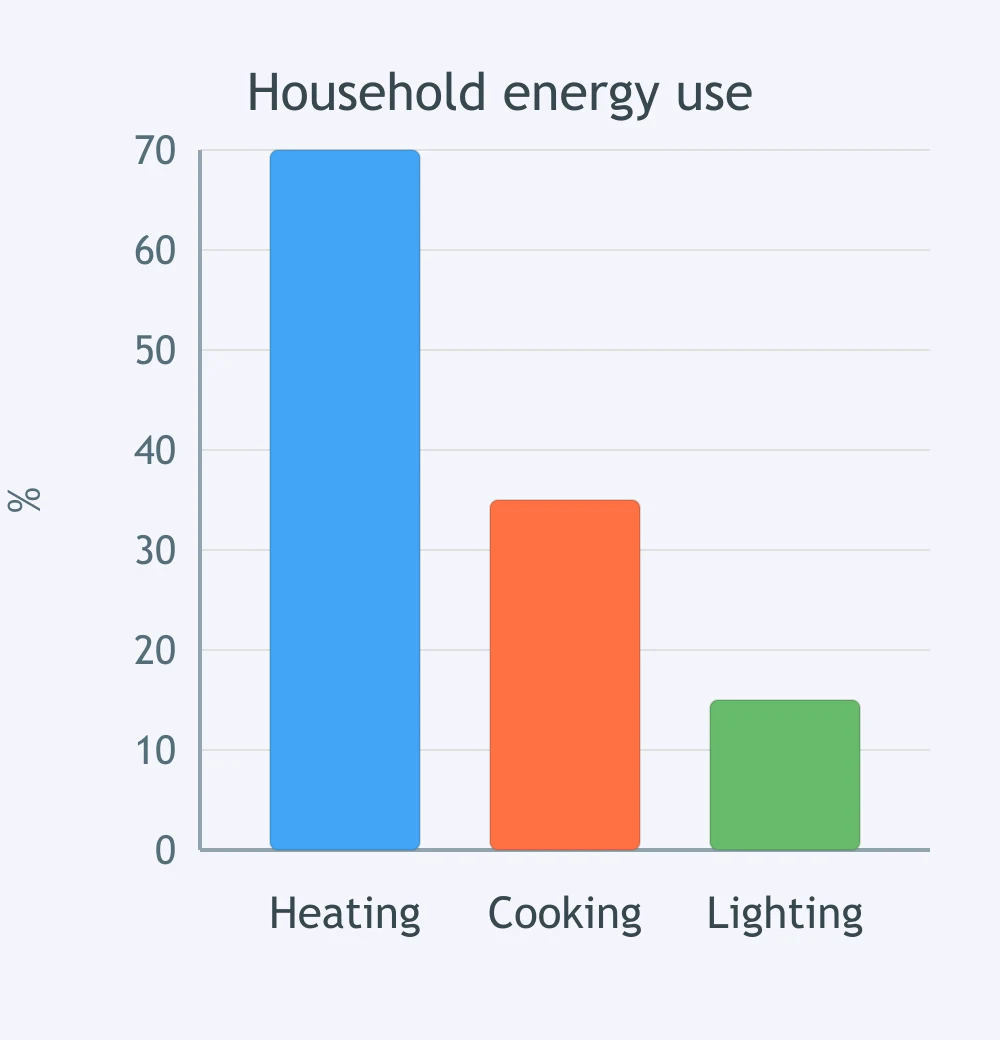
The bar chart shows household energy use by sector. Which overview sentence do the bars support?
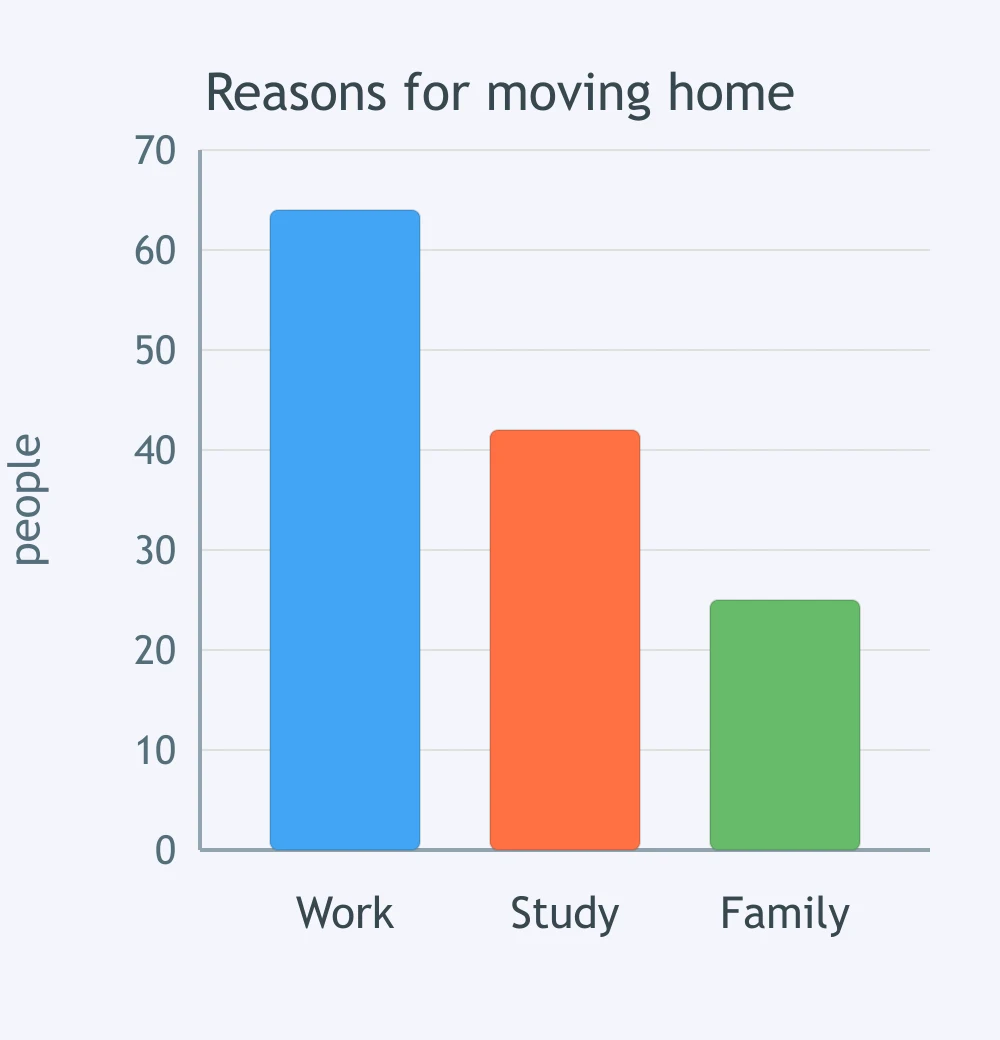
The chart compares reasons for moving home. Which overview best matches the bars?
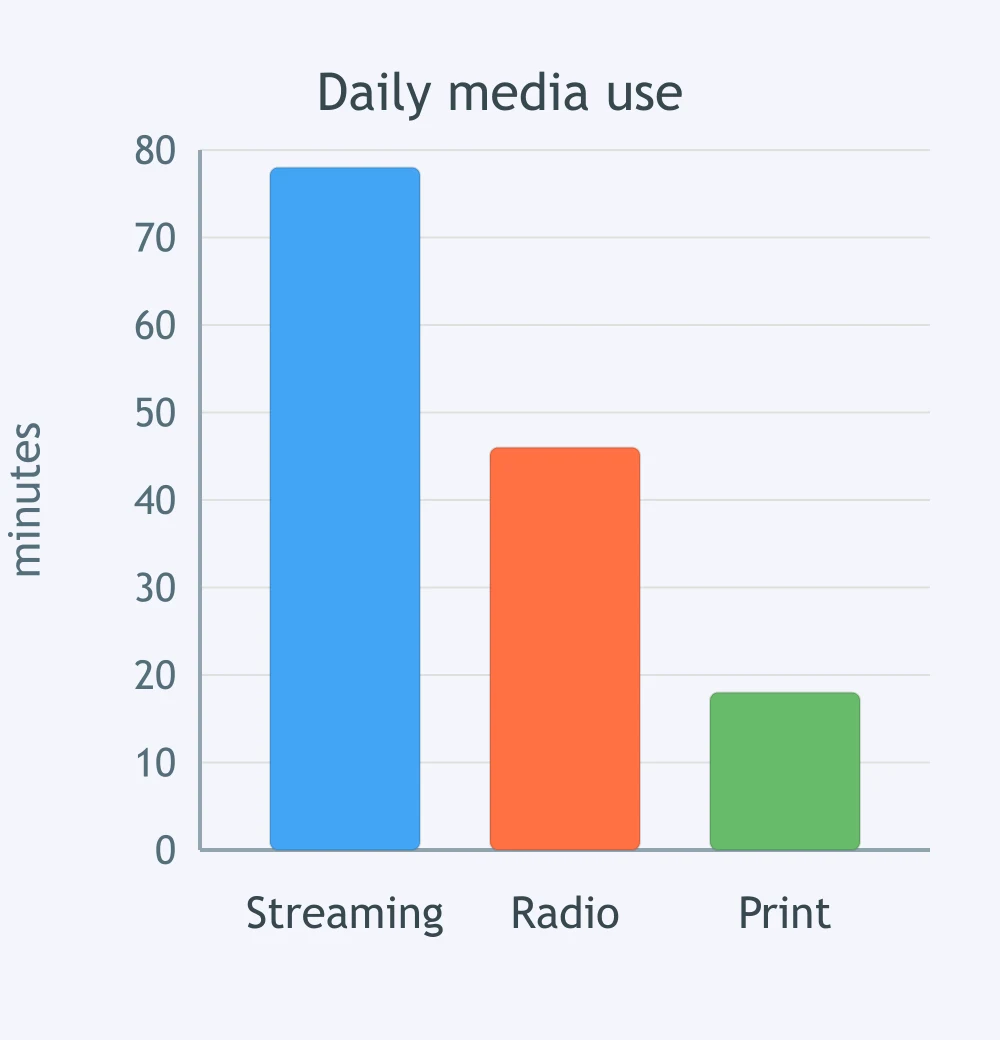
The chart shows time spent on three media types. Which overview is supported?
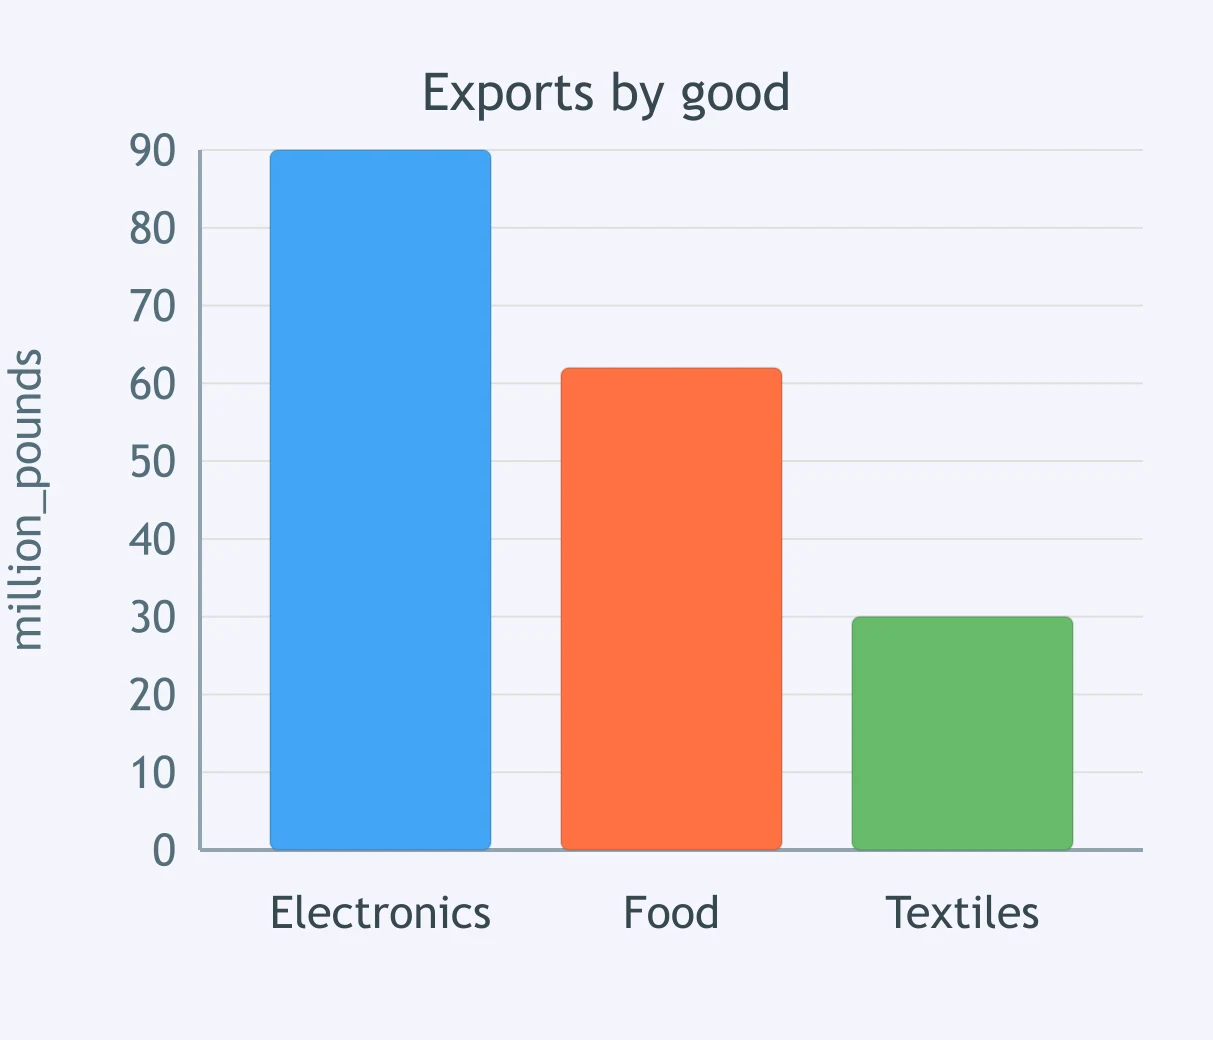
The chart compares exports of three goods. Which overview sentence fits the figure?
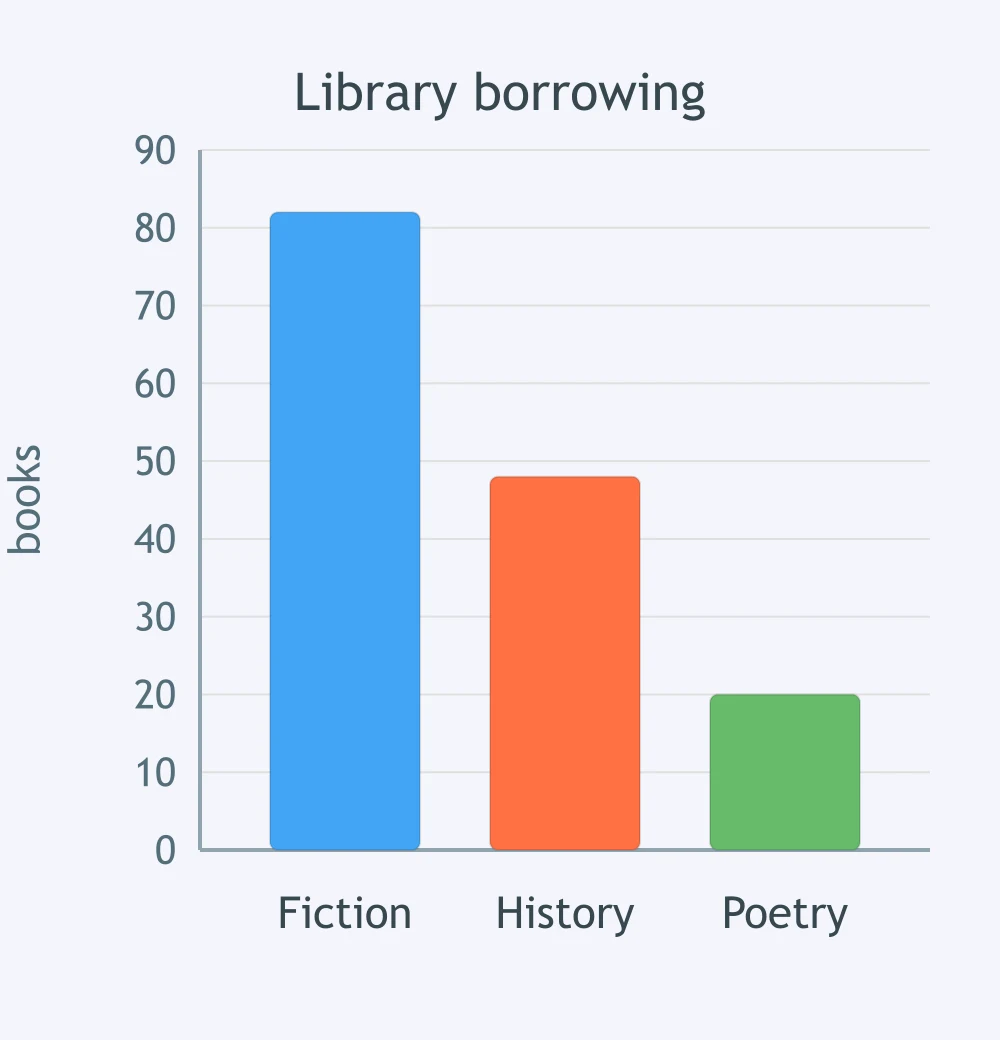
The chart shows library borrowing by genre. Which overview is most accurate?
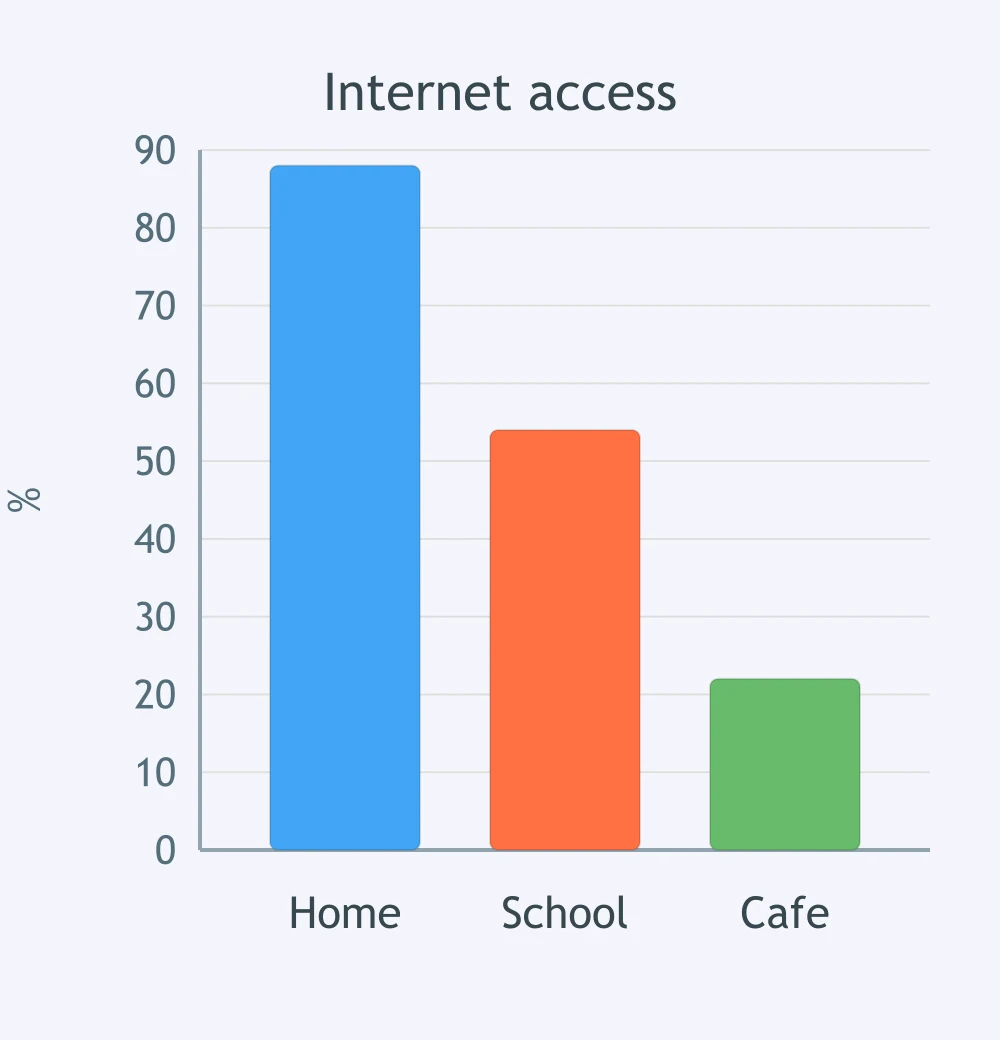
The chart compares internet access in three places. Which overview does it support?
The bar chart shows spending on three leisure services. Which overview sentence matches the data?
Crack the passcode before the zombies get in.
Answer, then swat bugs for bonus points.
Race through questions at your own speed.
Same question on every screen. Fastest wins.

Pick a tile, answer, hit bonuses and steals.
Reading a Pie Chart: Simple Proportions - IELTS 5.0 W T1
30 questions