Loading
by BlastRoom
Greenhouse processes and measured evidence for present climate change.
#earth_space_science
40 questions
One question set, multiple game modes. Tap any game to see it in action. Not sure which to pick?
Answer to place stones and capture territory.
Outrun the snow together.
Earn blasts, then hunt the other team.
Answer to earn energy, then climb.

The class blasts through walls together.
Bid on mystery lots. Most money wins.
Sell tours. Nice, standard, or a total scam.

Answer, restock, and serve the rush.
More correct answers pulls the rope your way.
Answer, then shoot down the alien wave.
Answer, then tap to leap the frozen ridge.
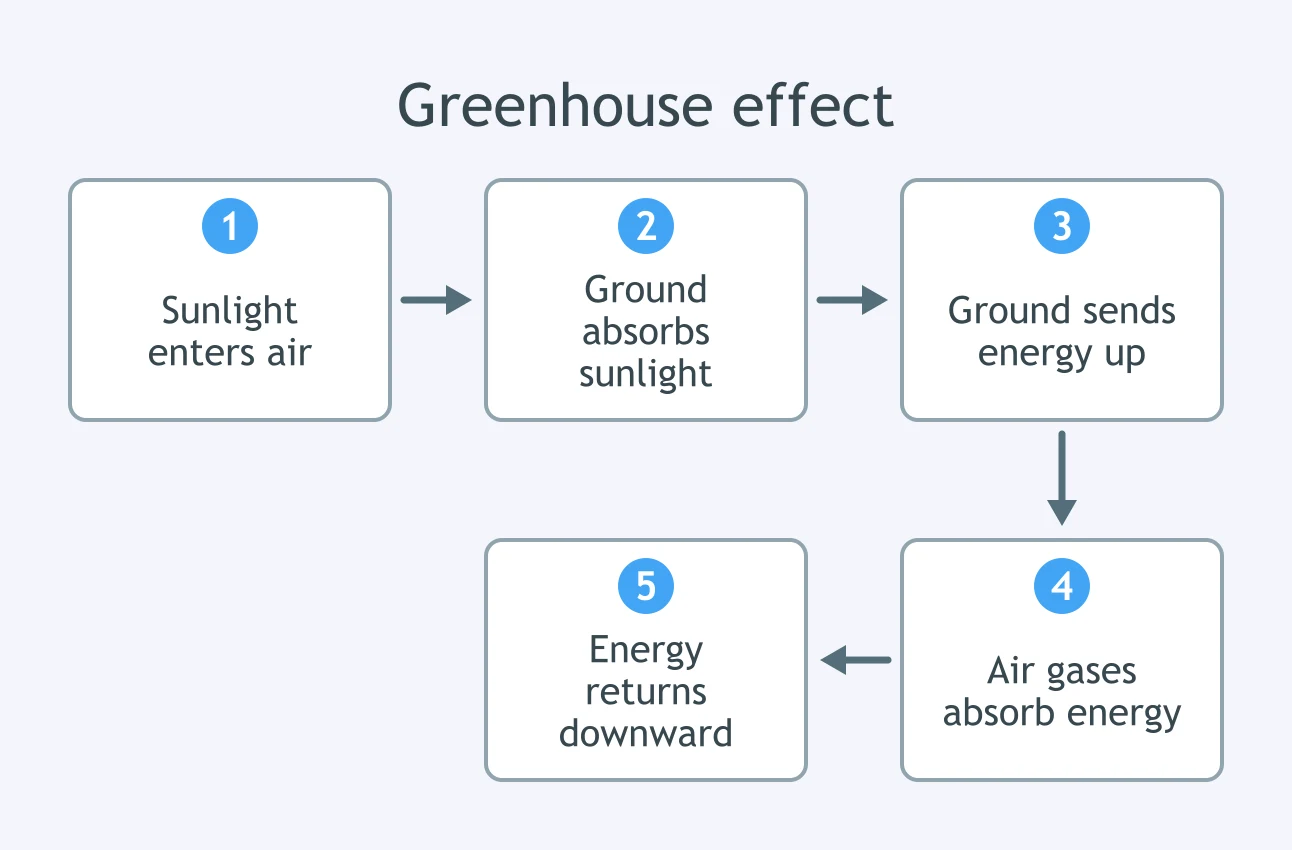
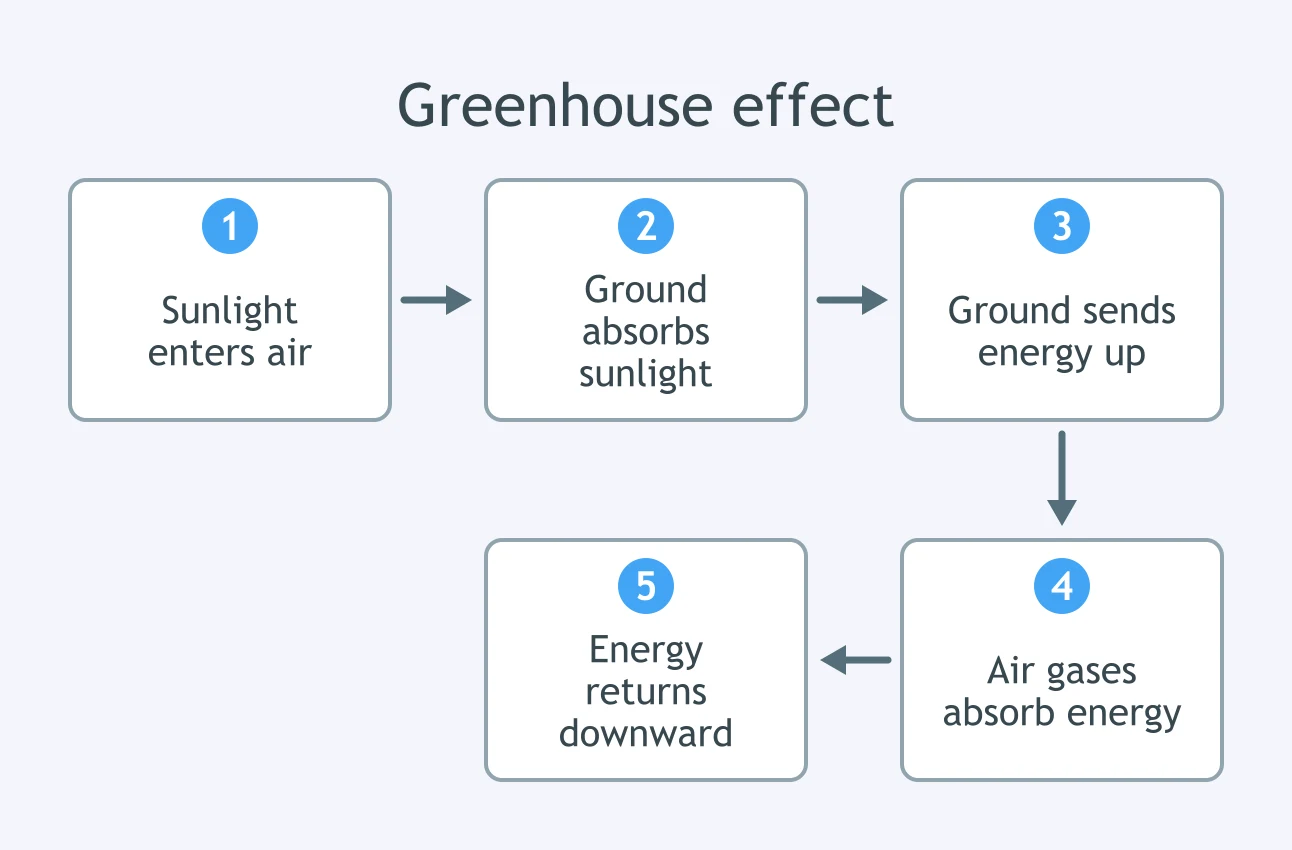
In the greenhouse-effect process diagram, stage 4 shows gases in the air absorbing energy sent upward by the ground. Which gases do most of that absorbing?
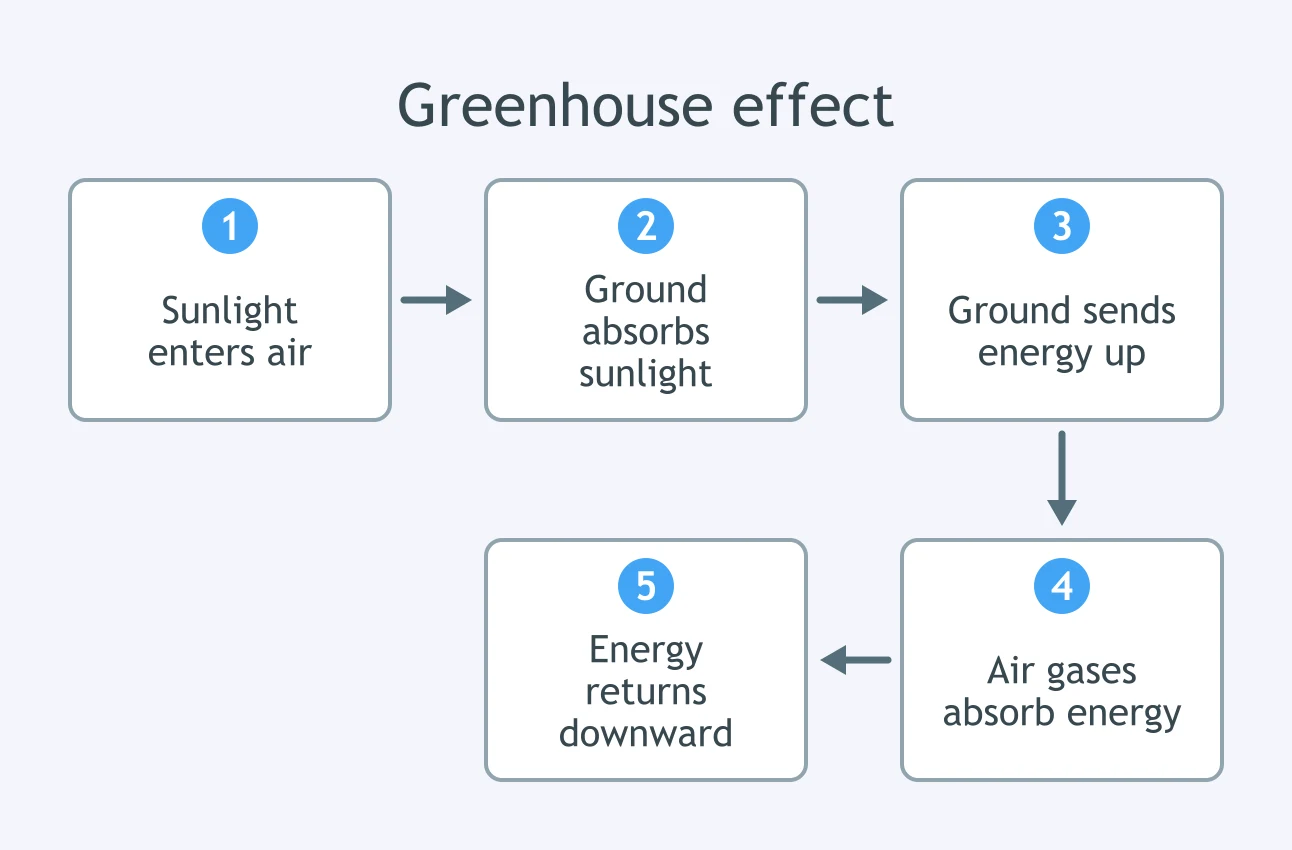
The process diagram begins with sunlight passing through the atmosphere to Earth's surface. What kind of energy is this incoming radiation mostly called in climate models?
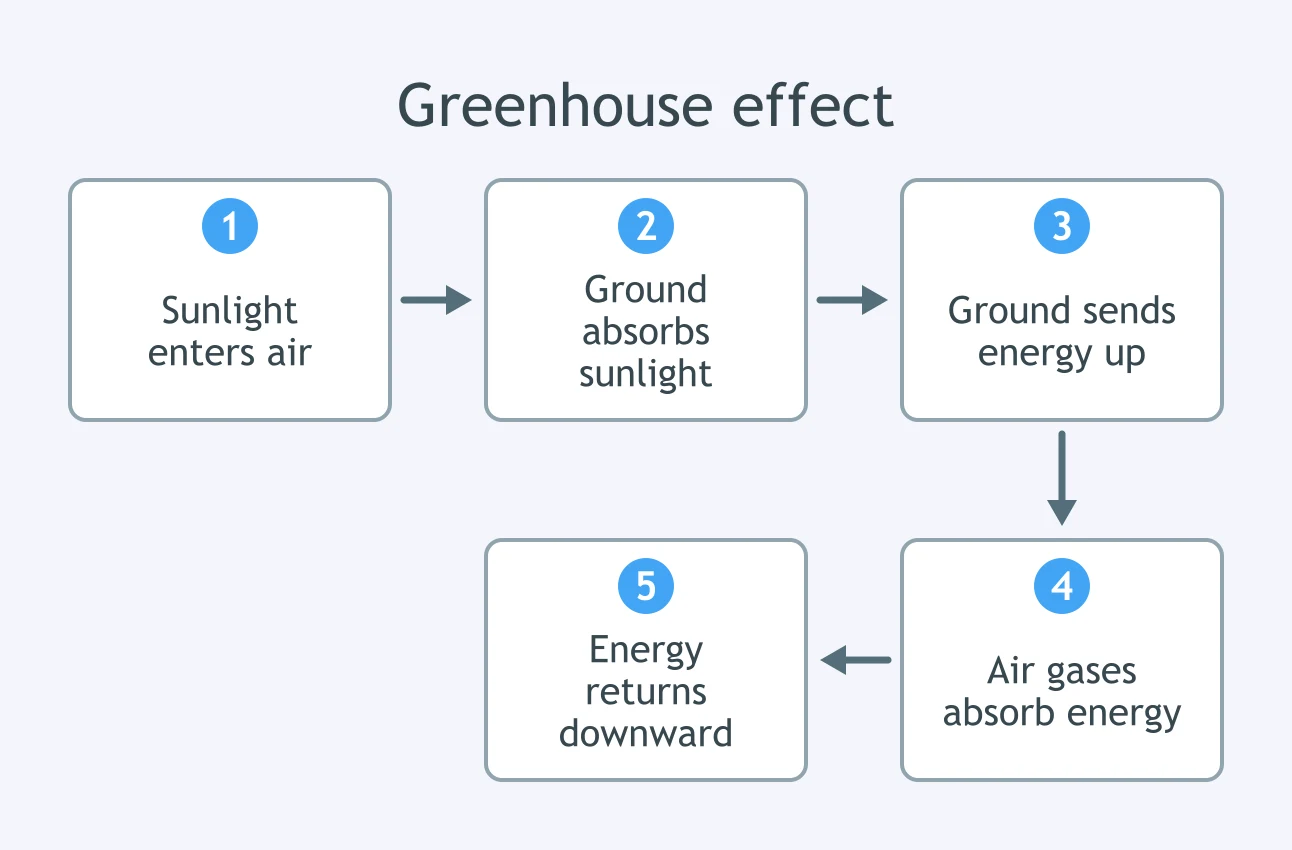
In the process diagram, stage 3 is energy leaving the warmed ground and moving upward. What form does most of that outgoing energy take?
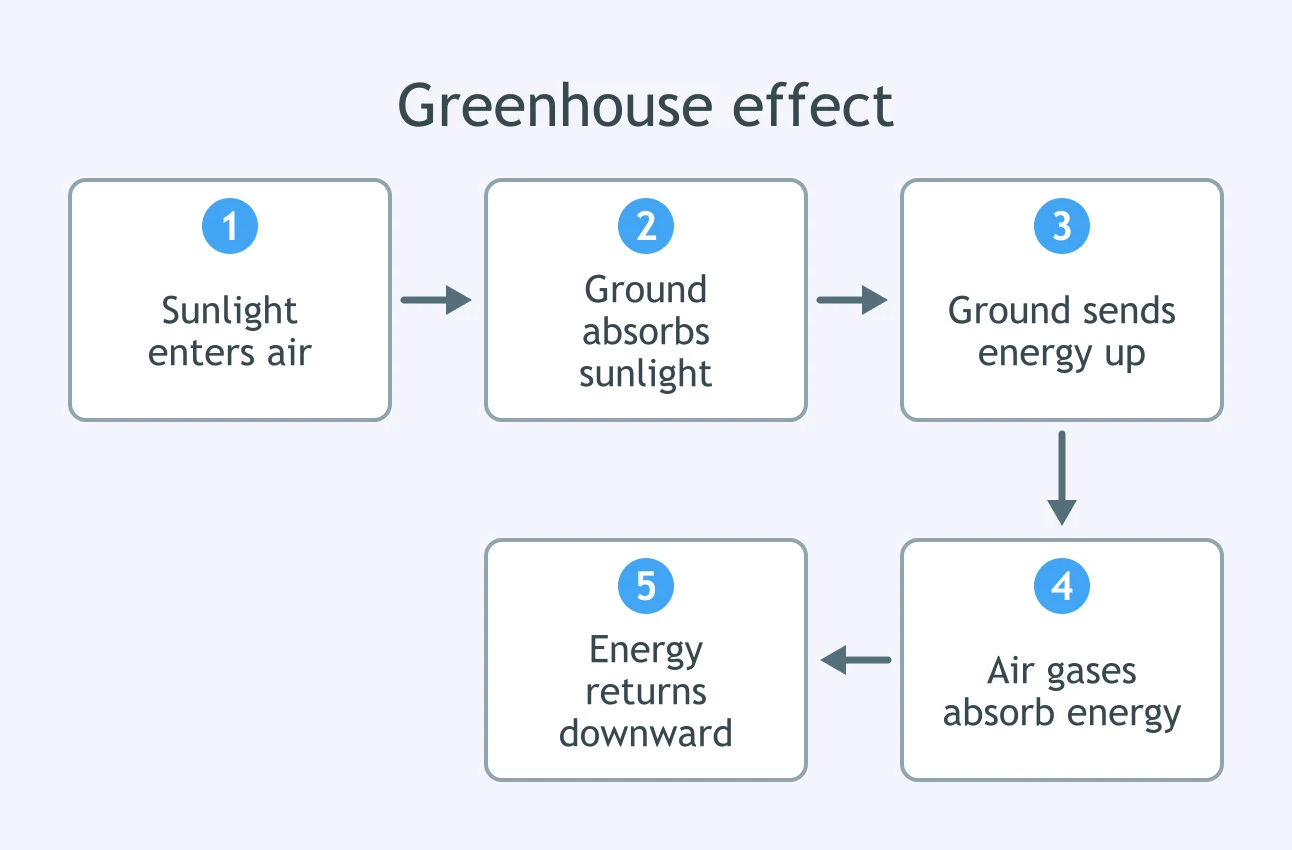
Stage 5 in the process diagram shows some absorbed energy returning downward. What is the direct effect at Earth's surface?
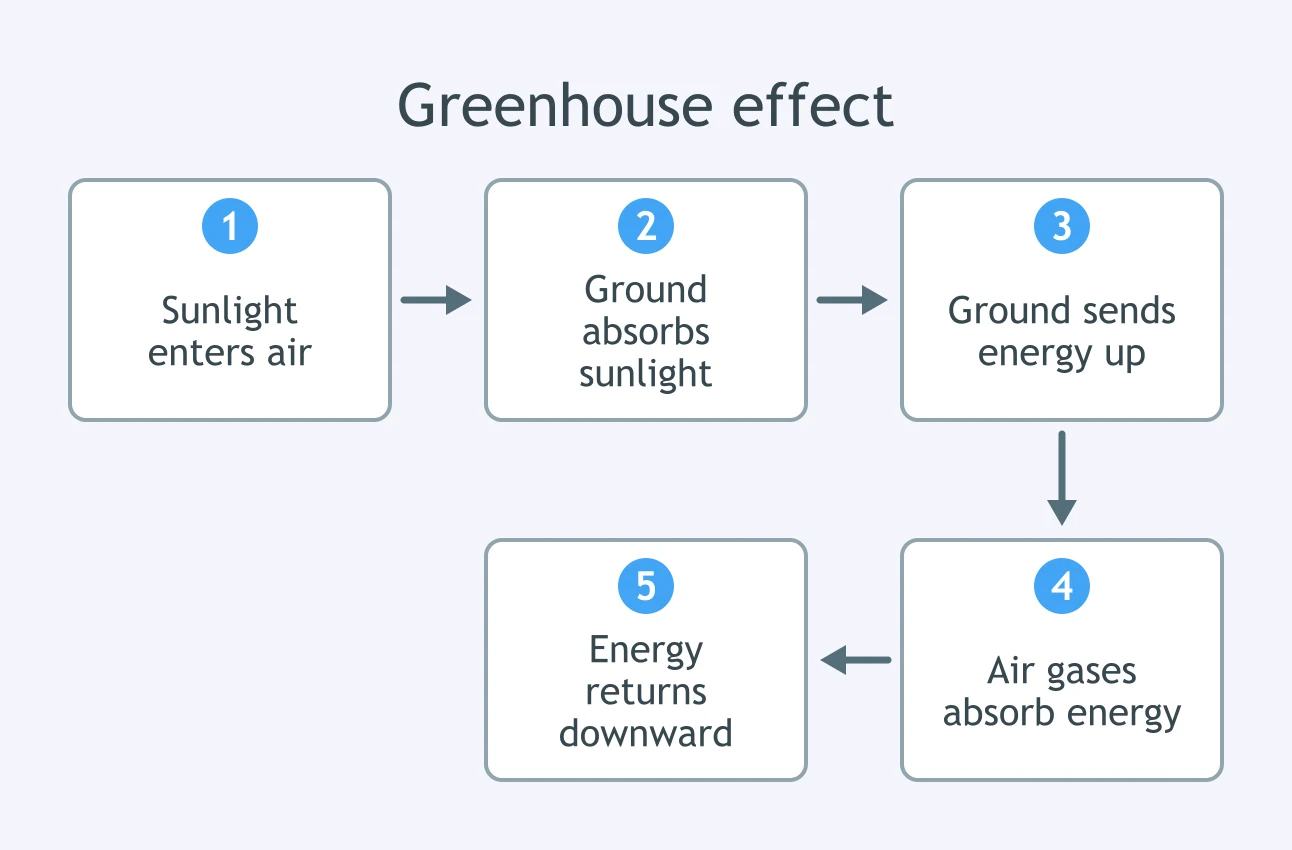
If stage 4 in the greenhouse-effect diagram were much weaker, what would happen to more of Earth's outgoing energy?
Nitrogen and oxygen make up most dry air, but they are not the main gases in stage 4. Why are they poor greenhouse gases?
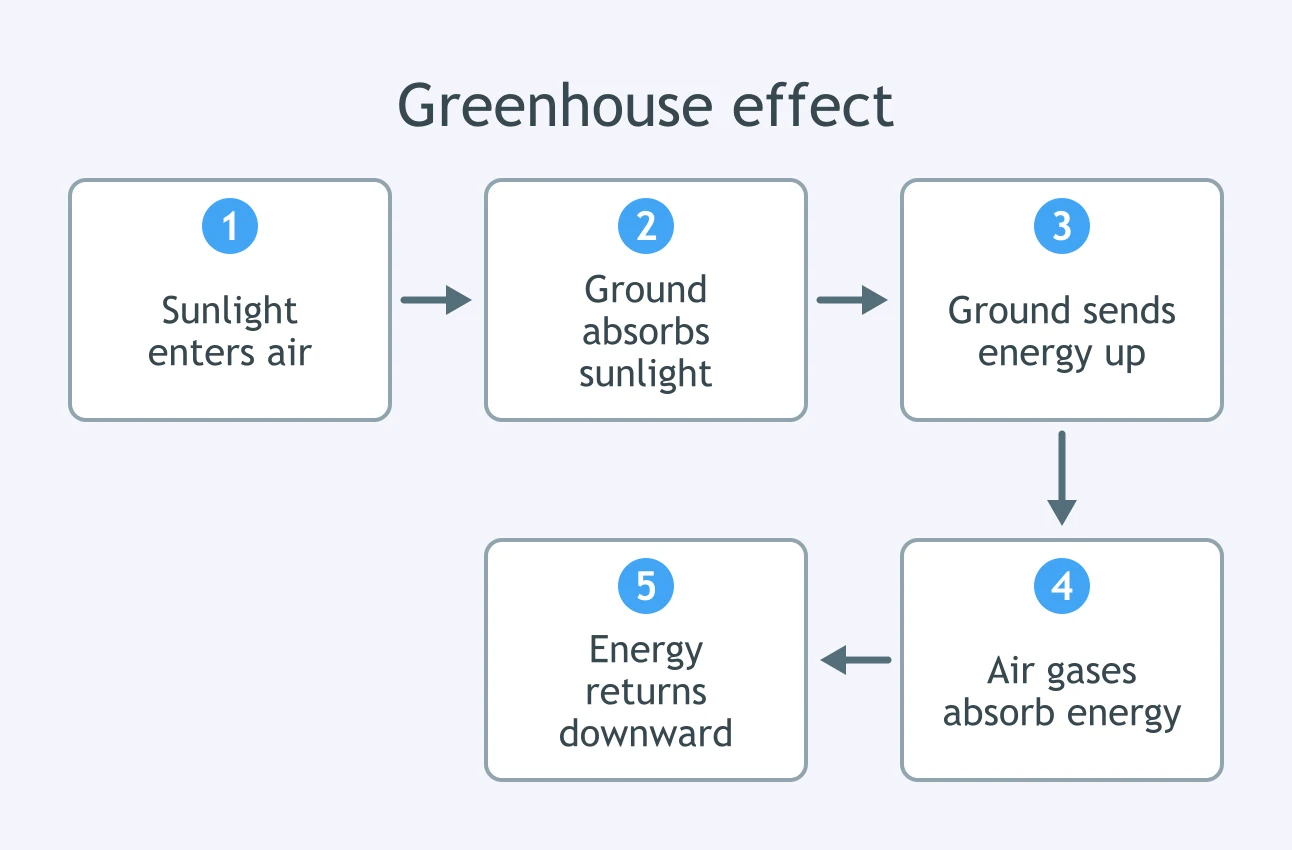
Human burning of coal, oil, and natural gas adds CO₂ to the air. In the process diagram, which step is strengthened first by that added CO₂?
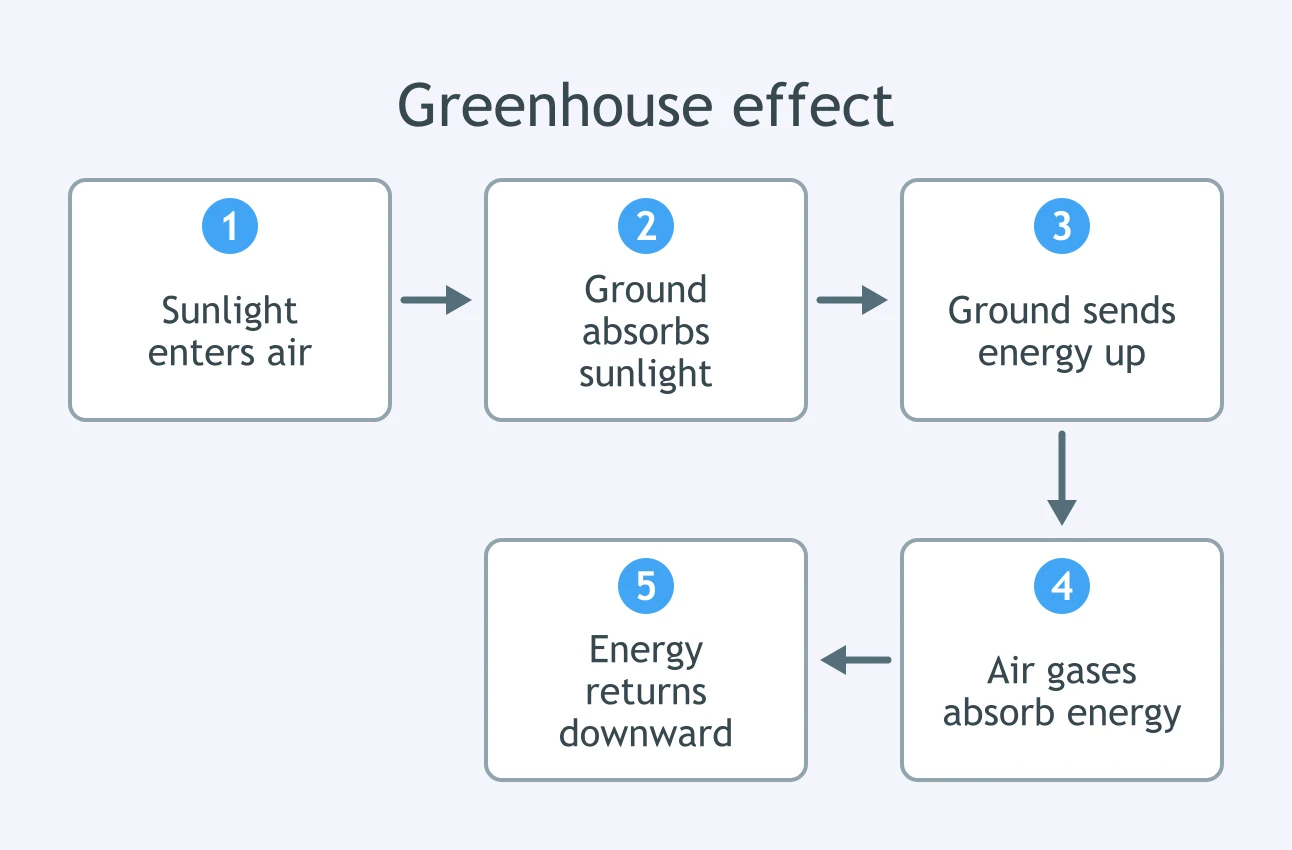
Suppose a brighter surface reflects more sunlight before stage 2 of the diagram. What happens to the energy absorbed by the ground?
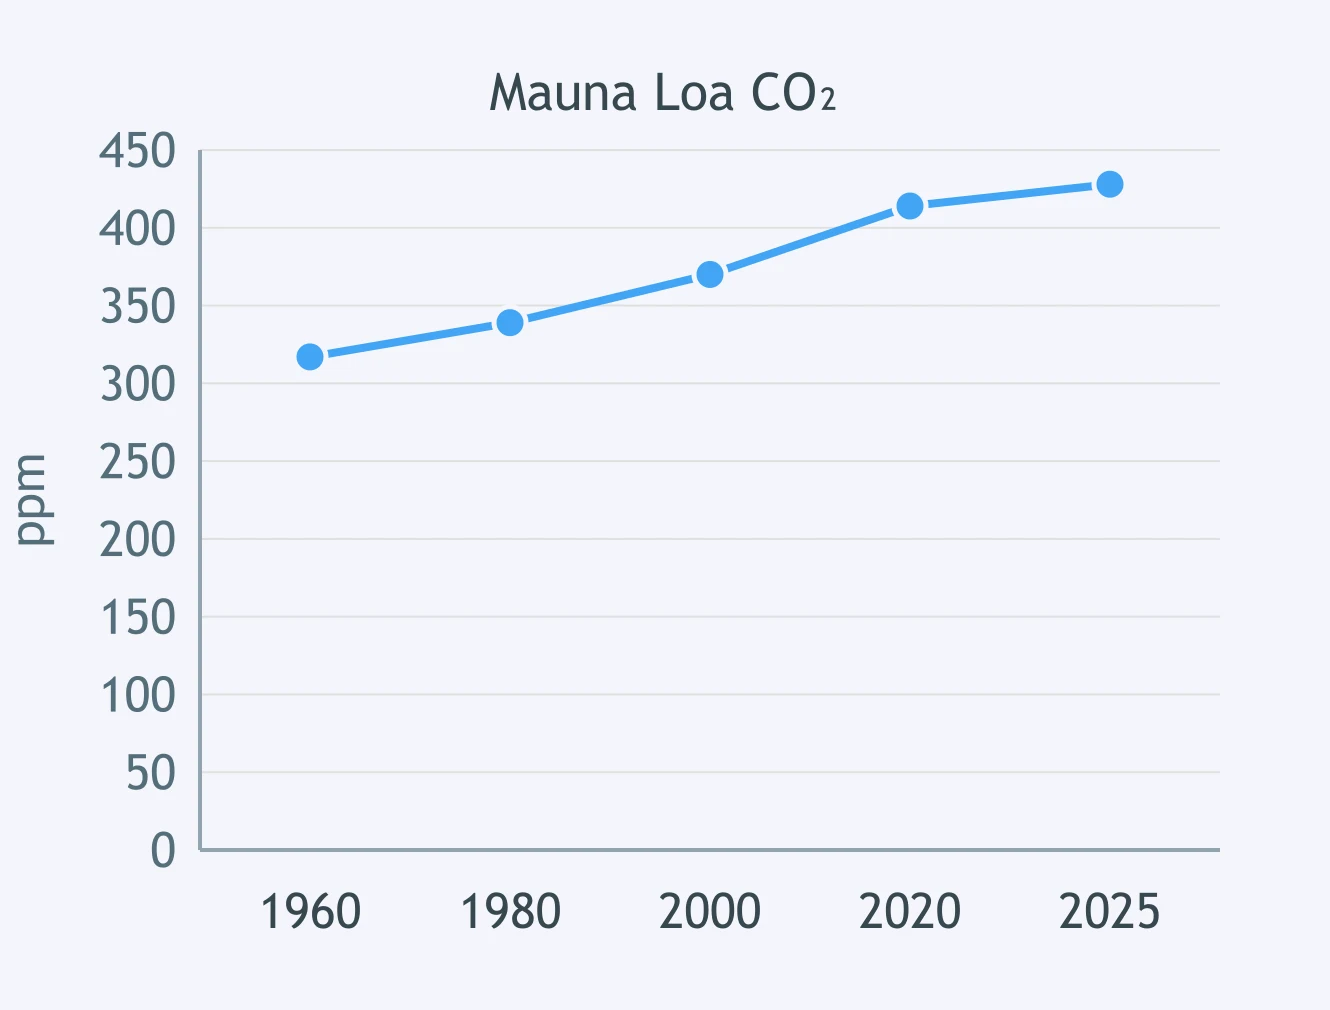
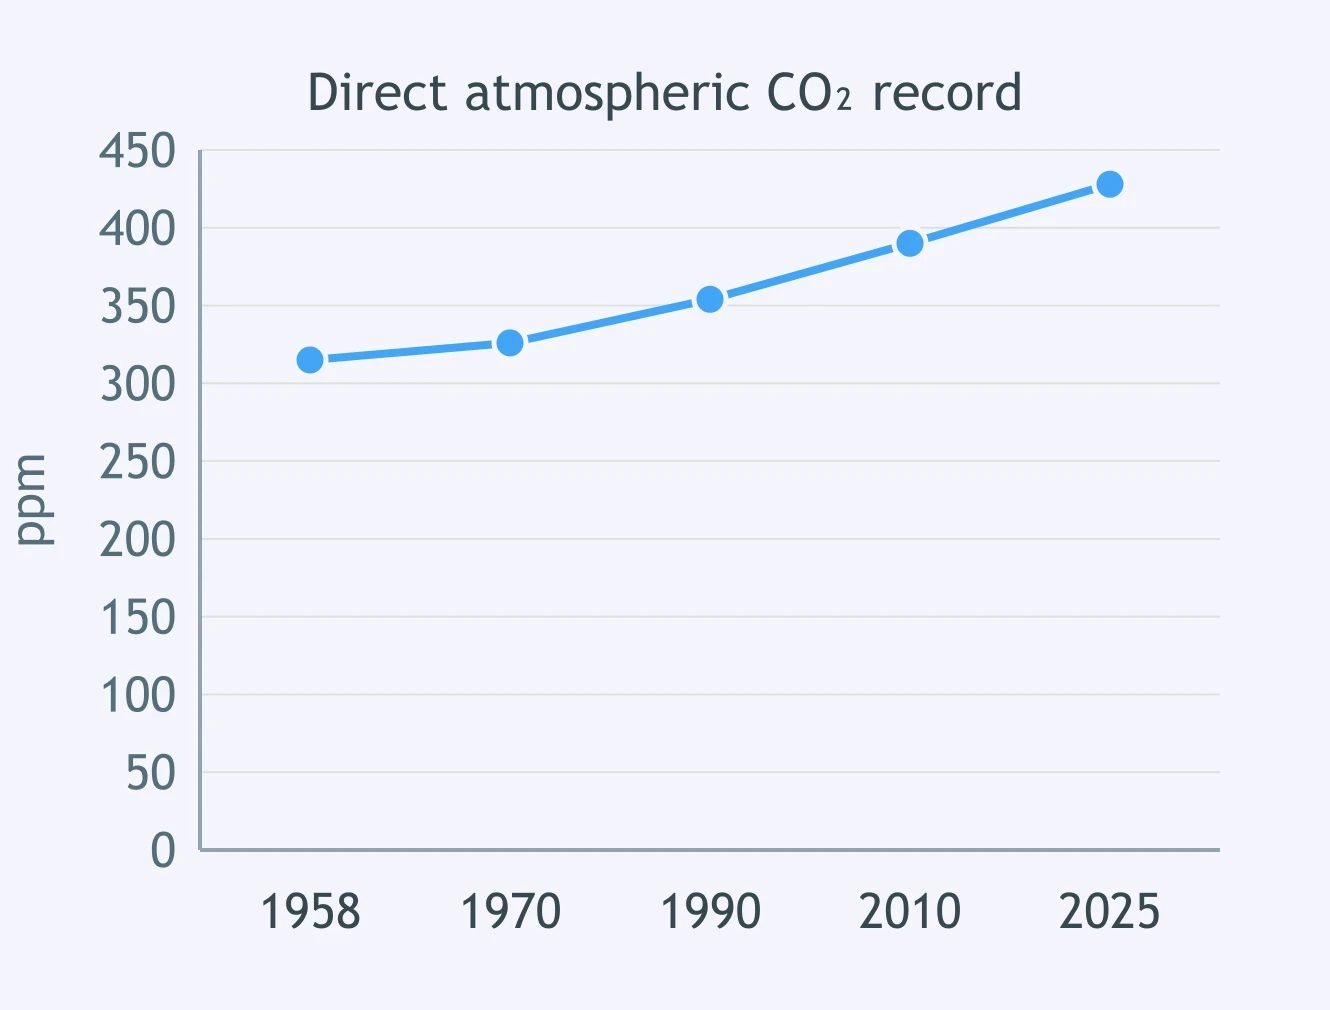
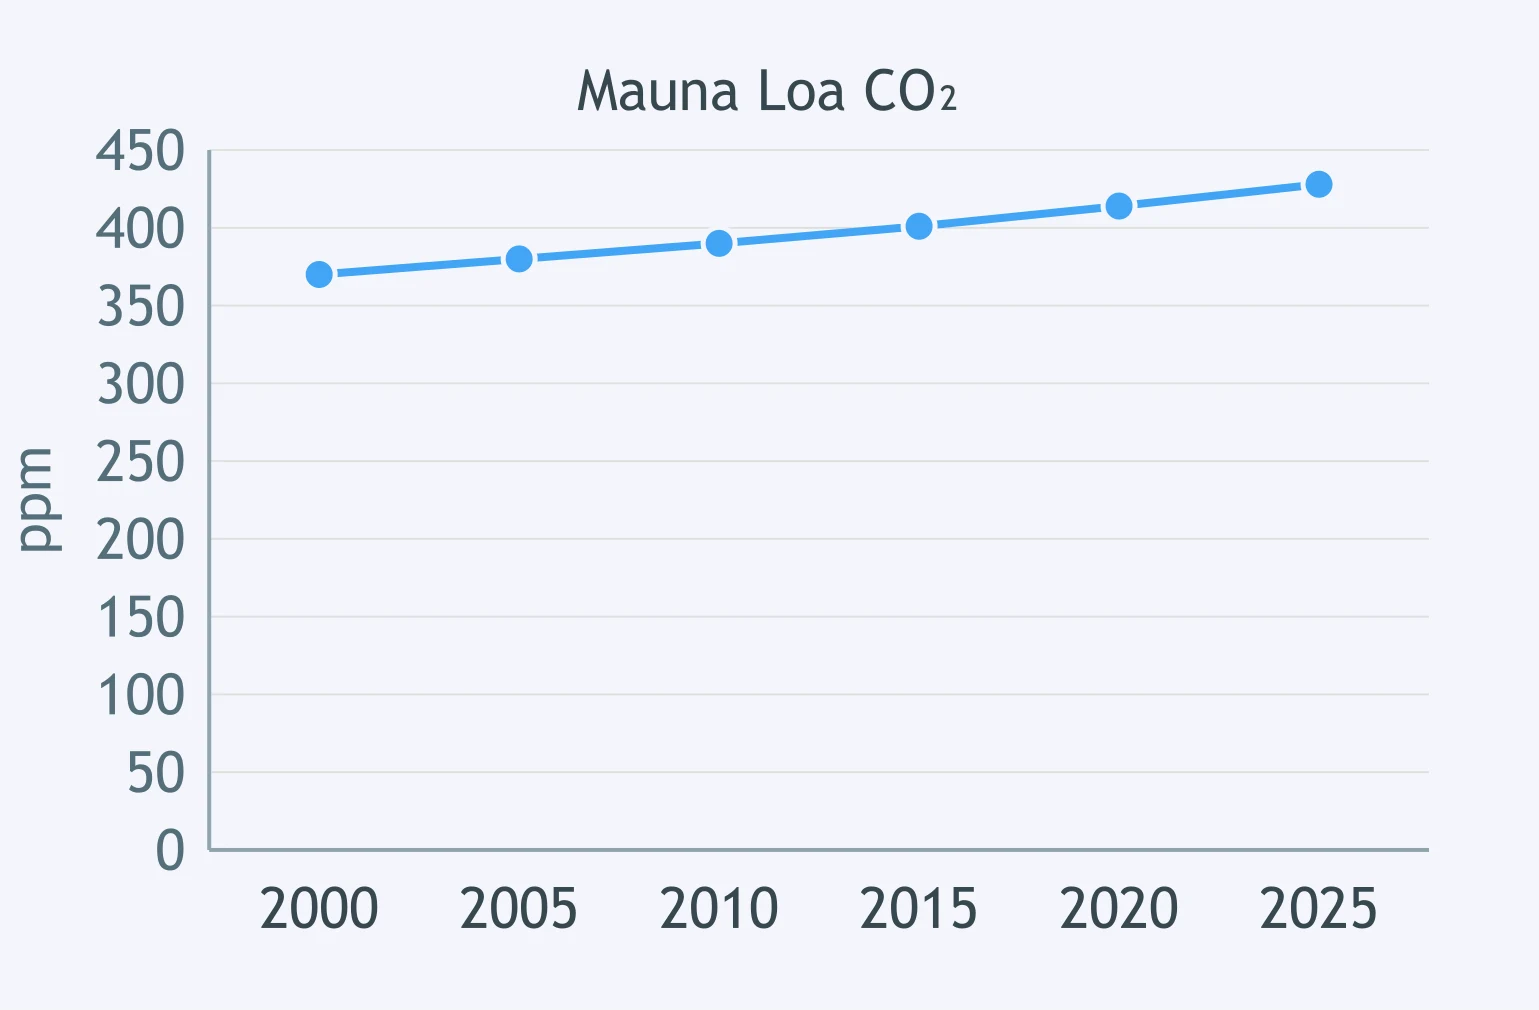
Use the Mauna Loa CO₂ graph. About what concentration is plotted for 2025?
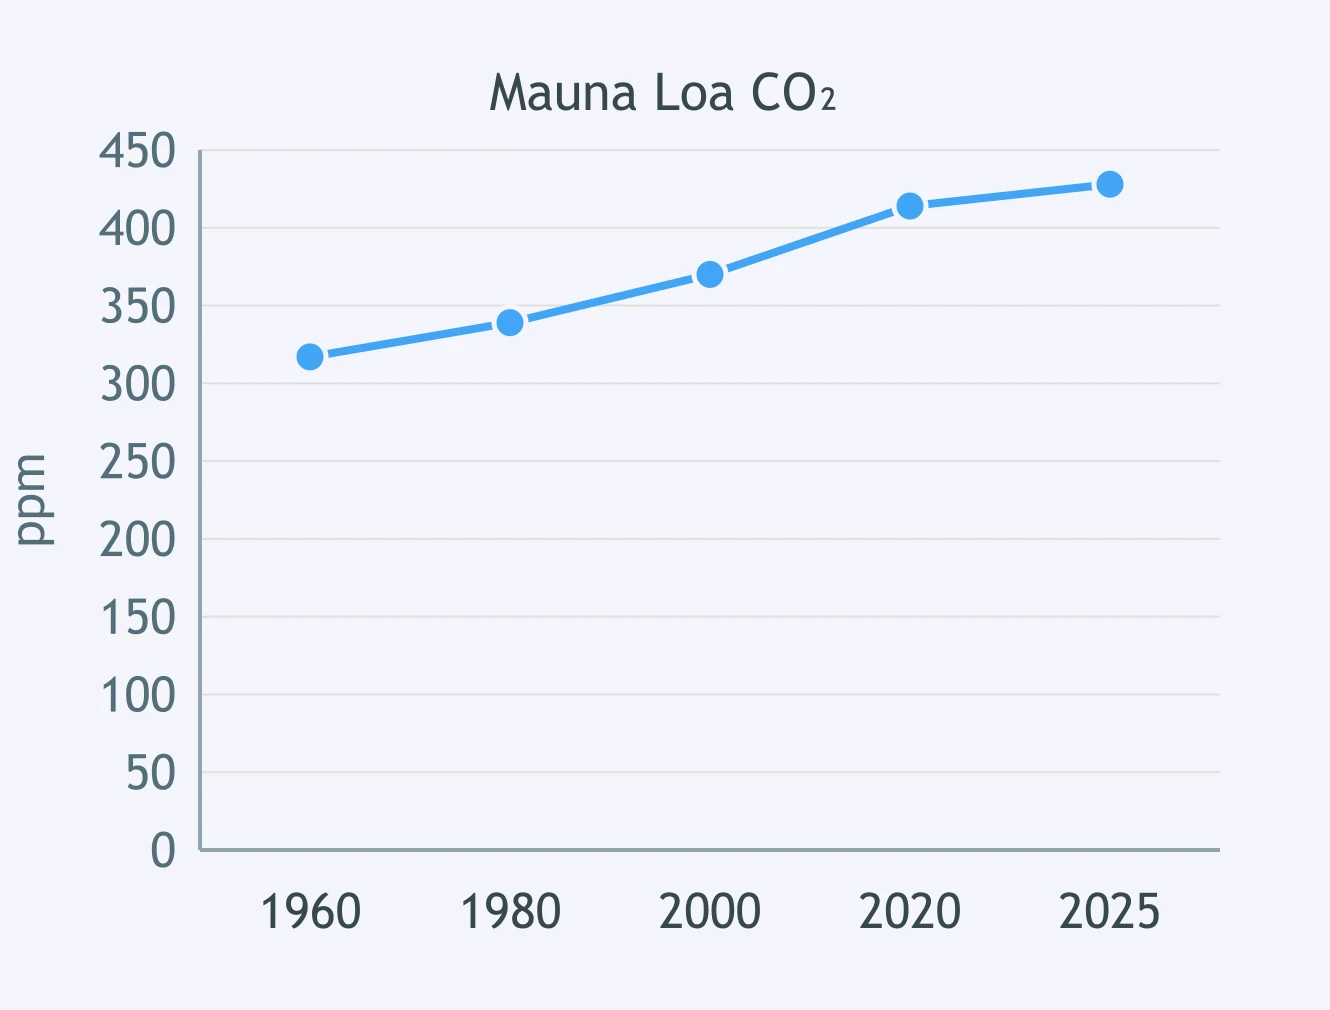
Use the Mauna Loa CO₂ graph. Which plotted year is closest to 370 ppm?
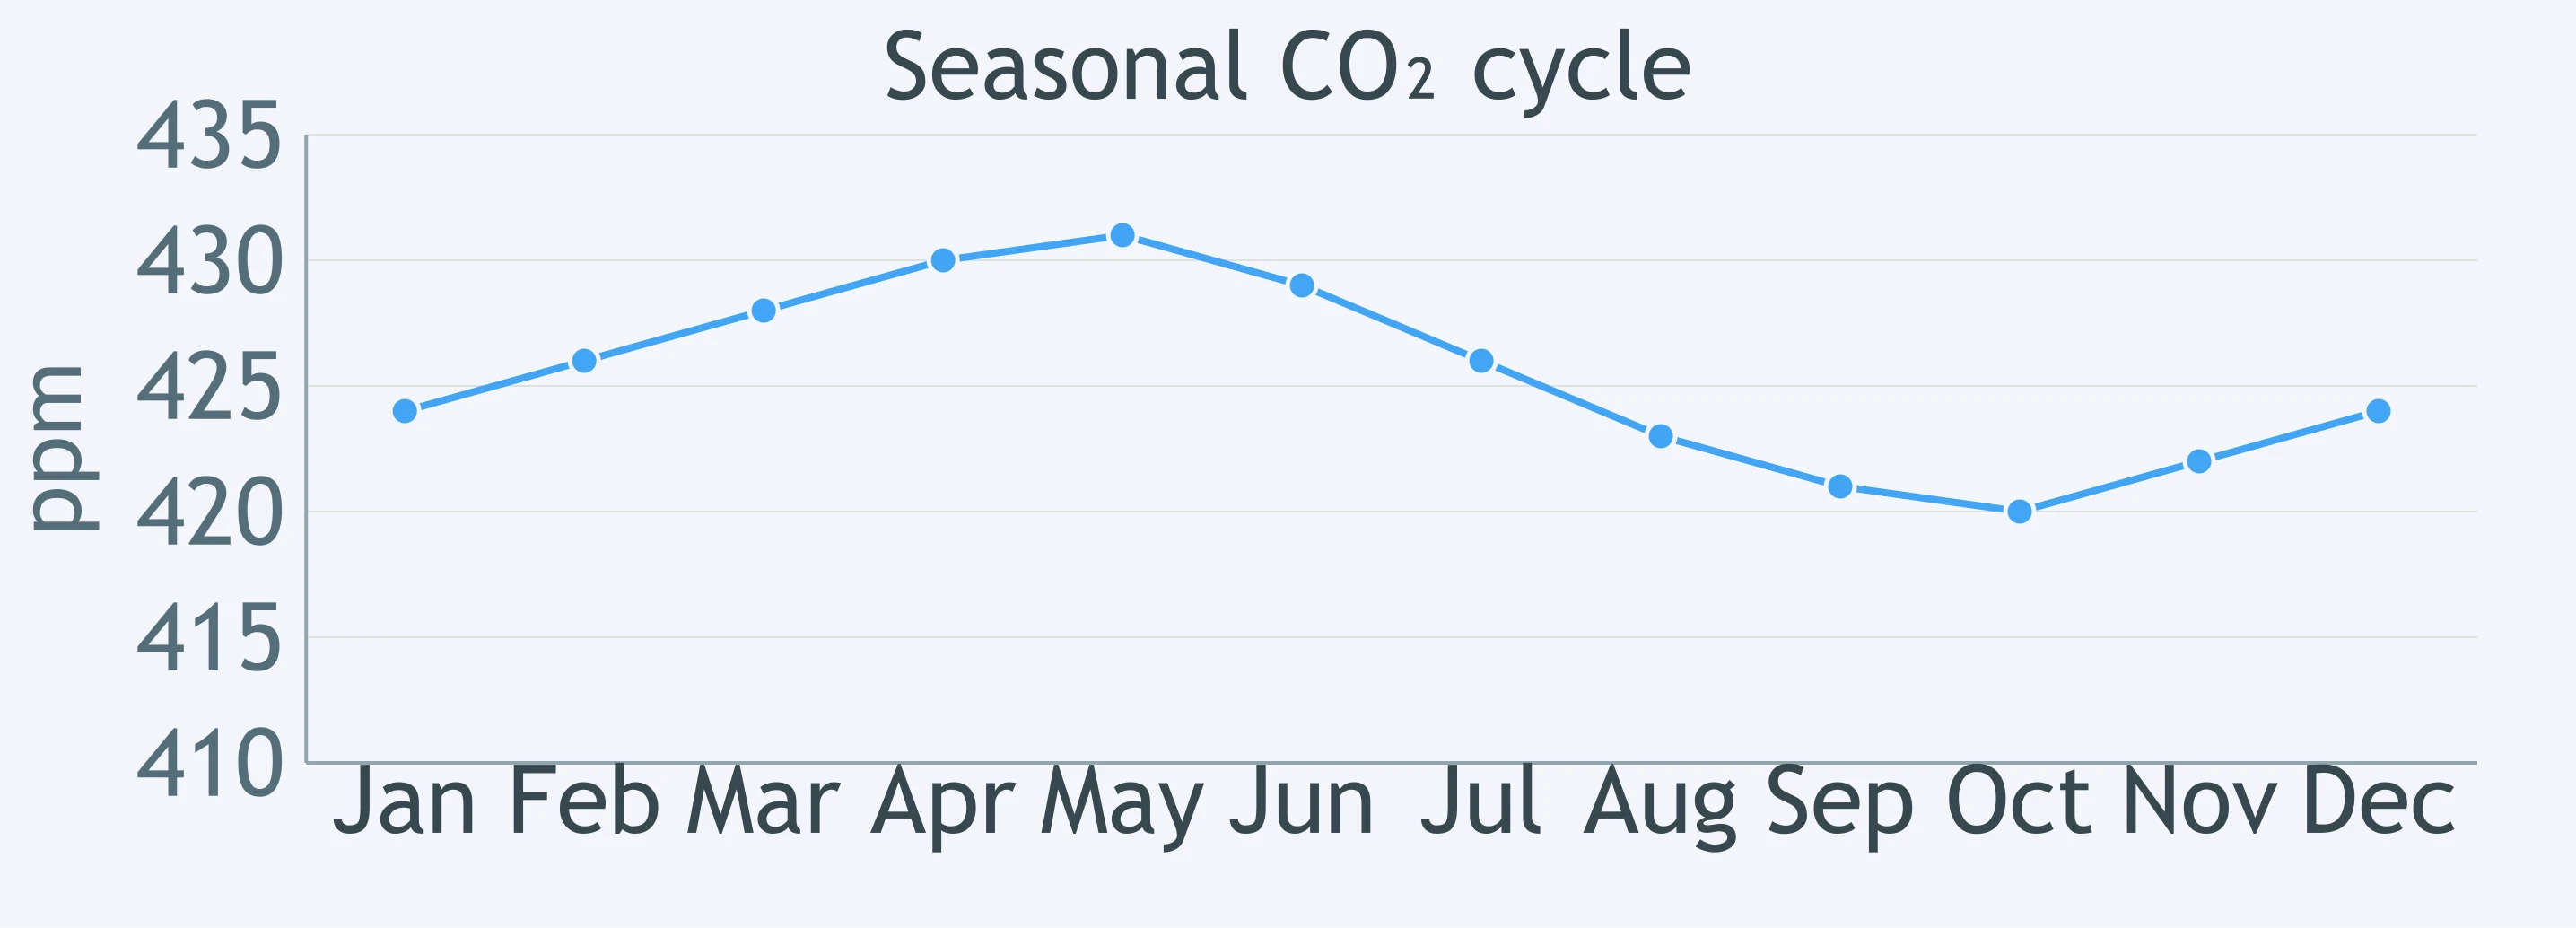
Use the monthly CO₂ graph. During which month is the seasonal concentration highest?
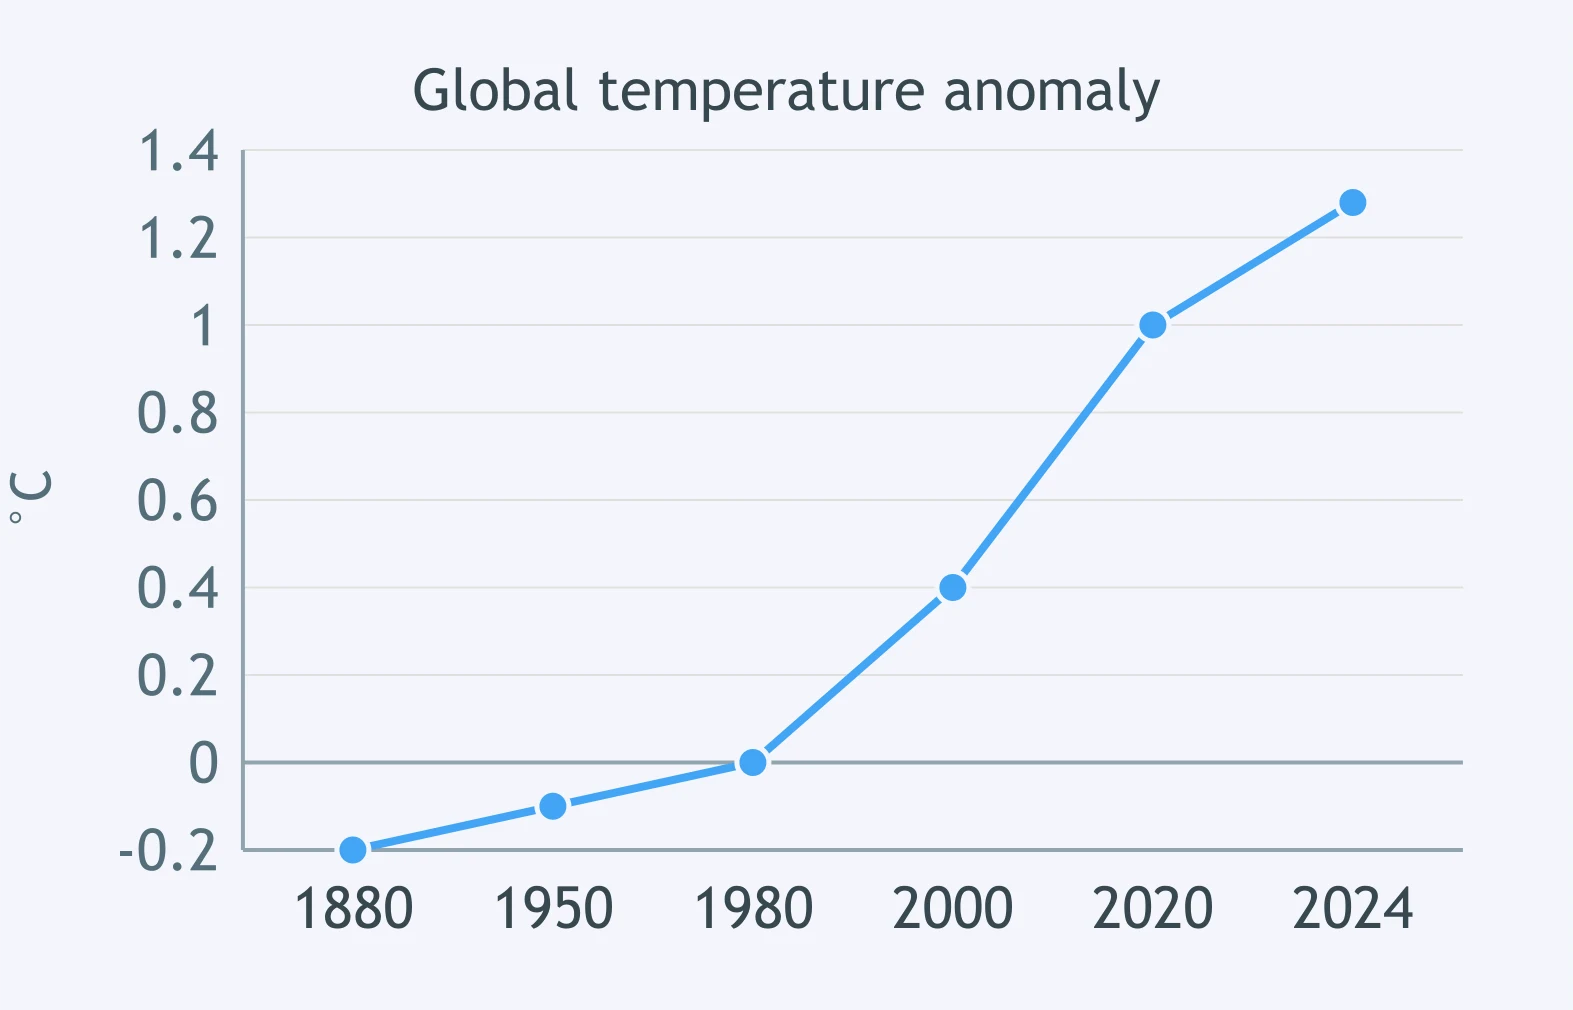
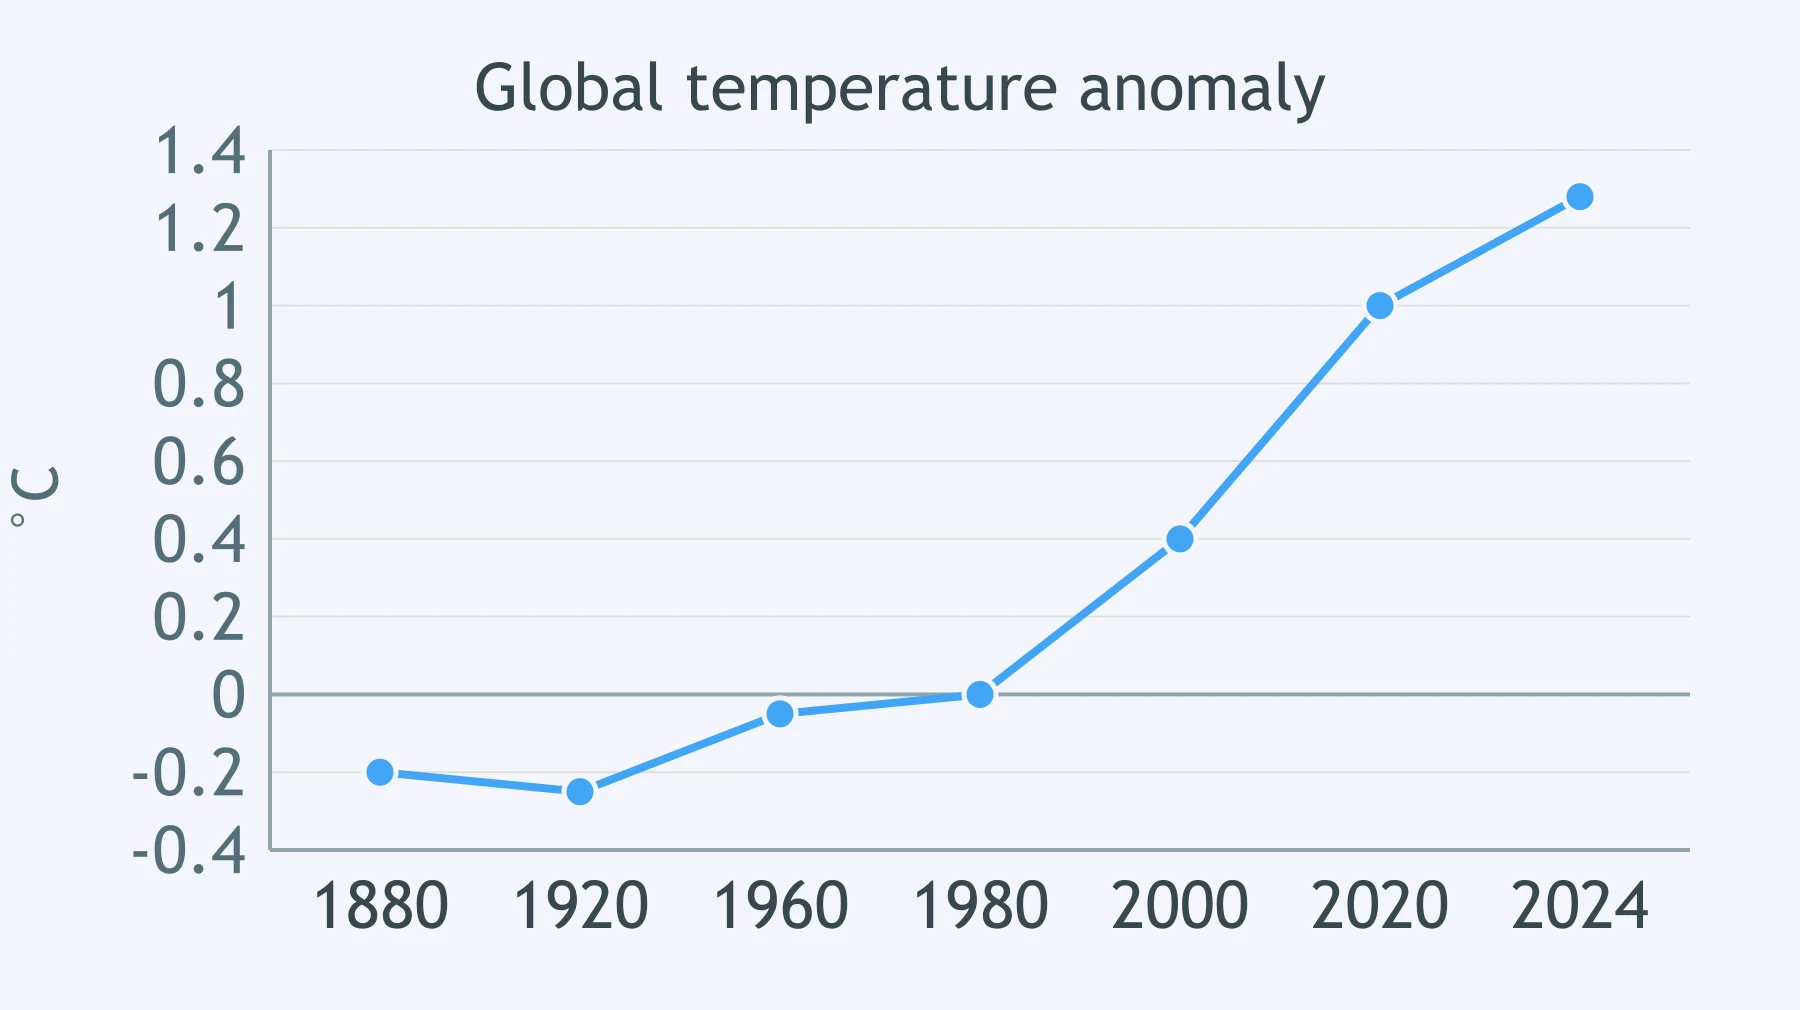
Use the global temperature-anomaly graph. About what anomaly is plotted for 2024?
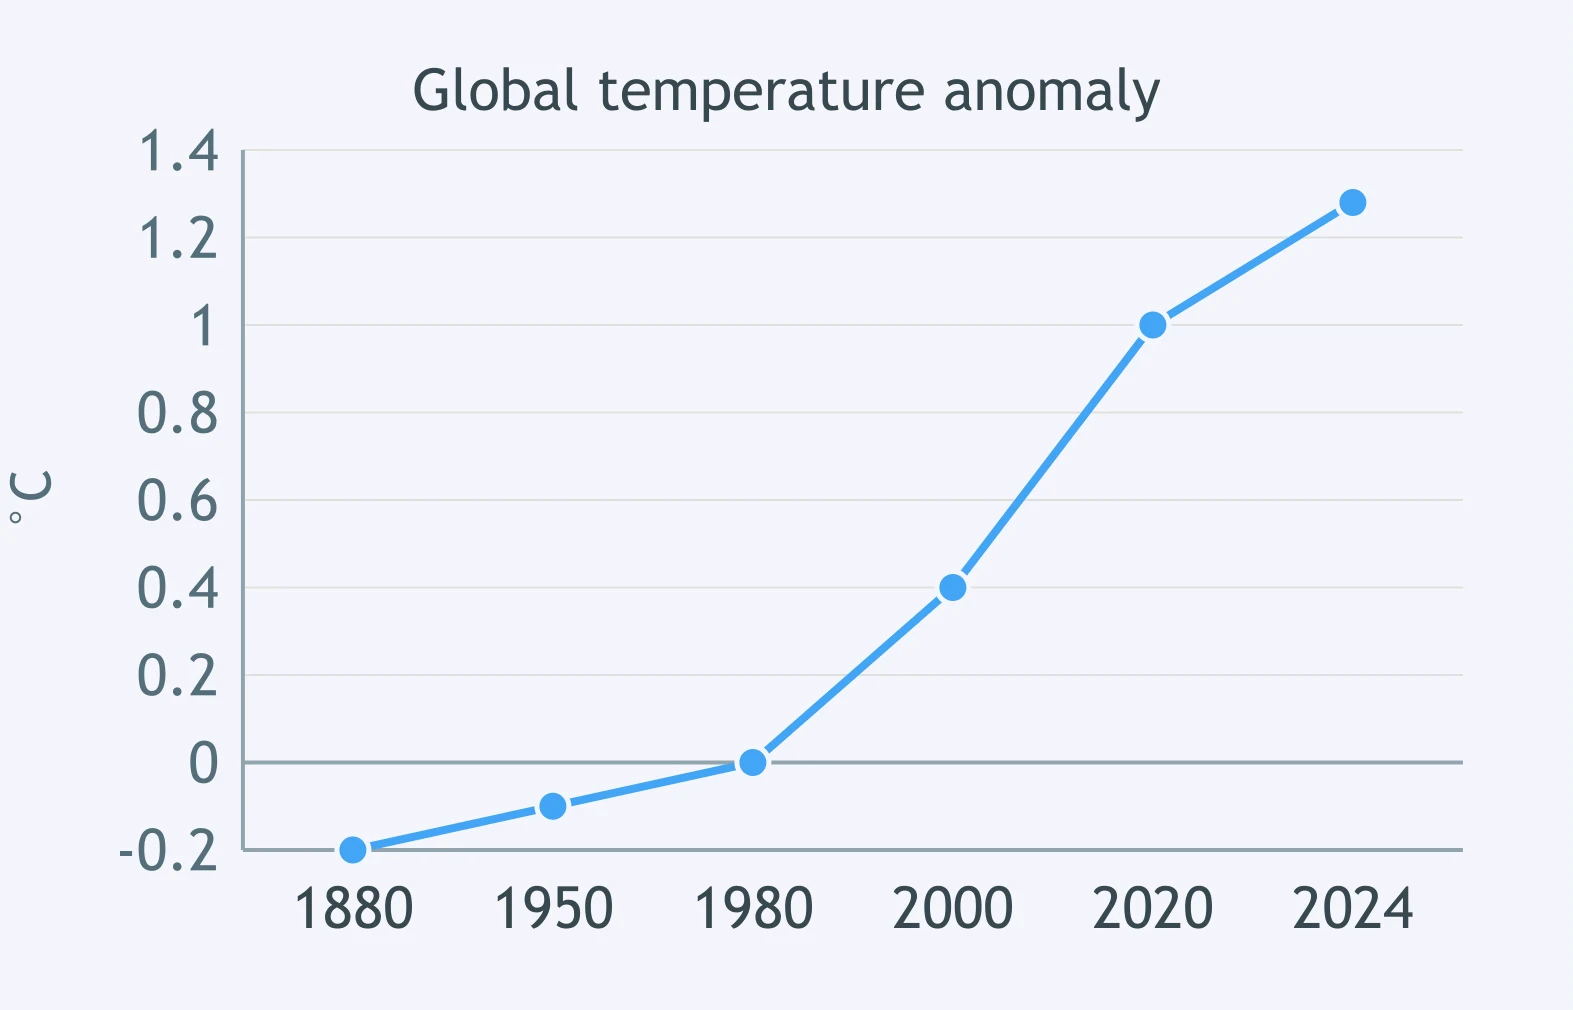
Use the global temperature-anomaly graph. Which plotted year is closest to a 0.4 °C anomaly?
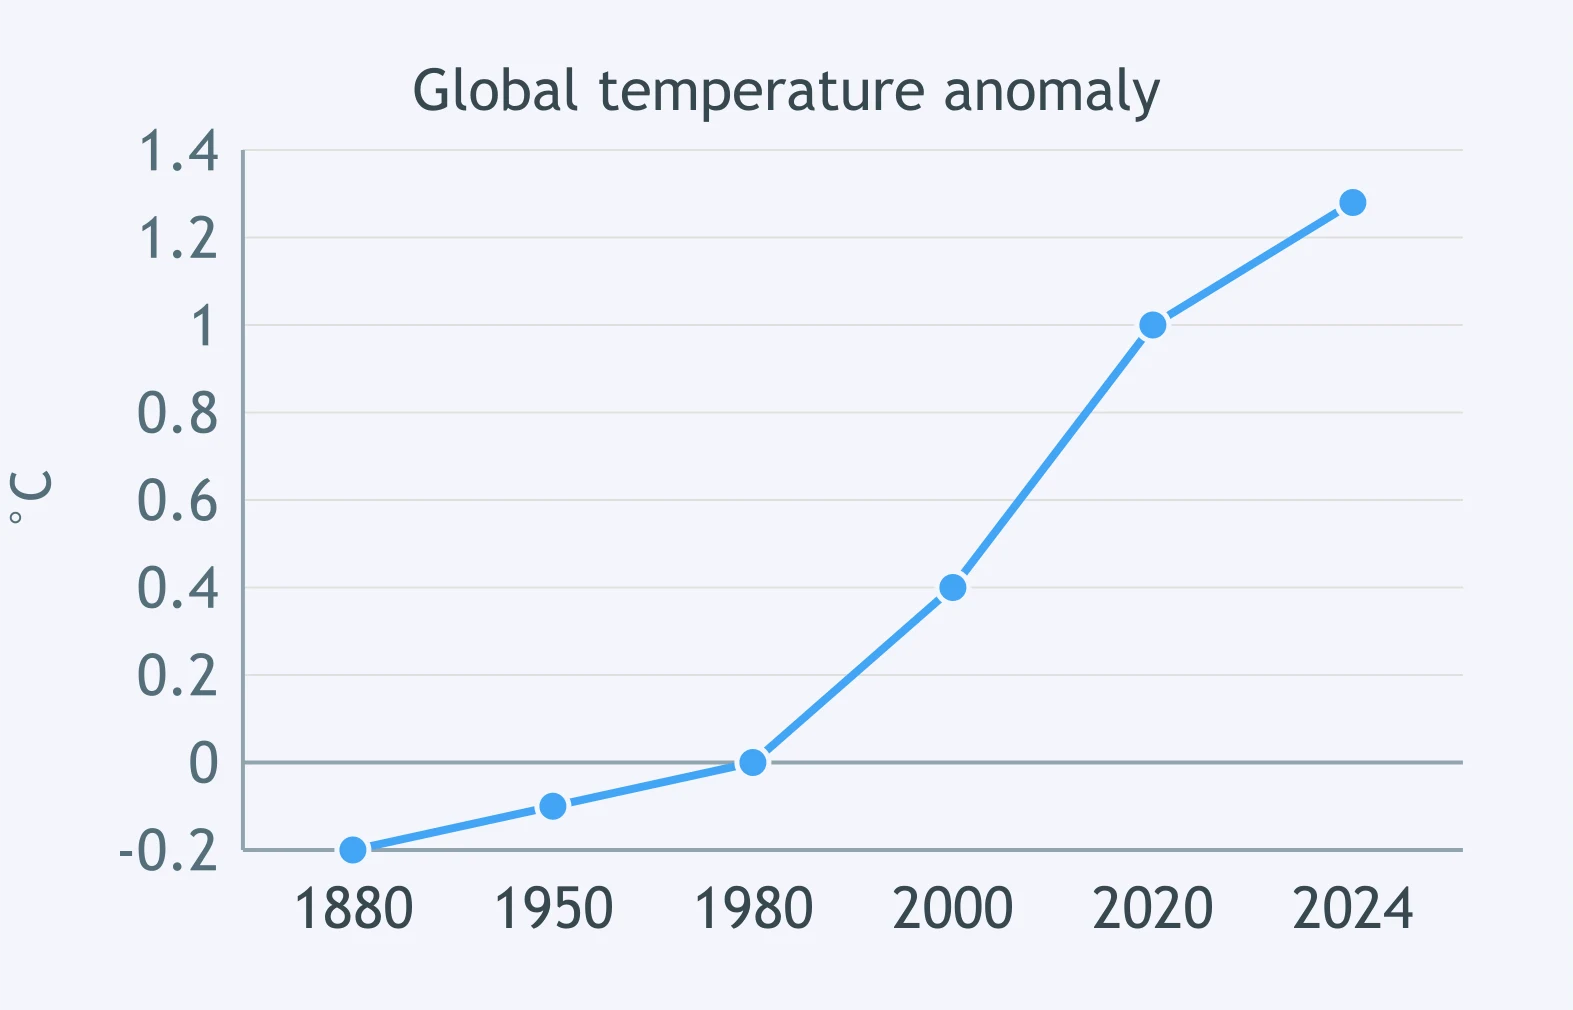
Use the global temperature-anomaly graph. Which plotted year is closest to a 1.0 °C anomaly?
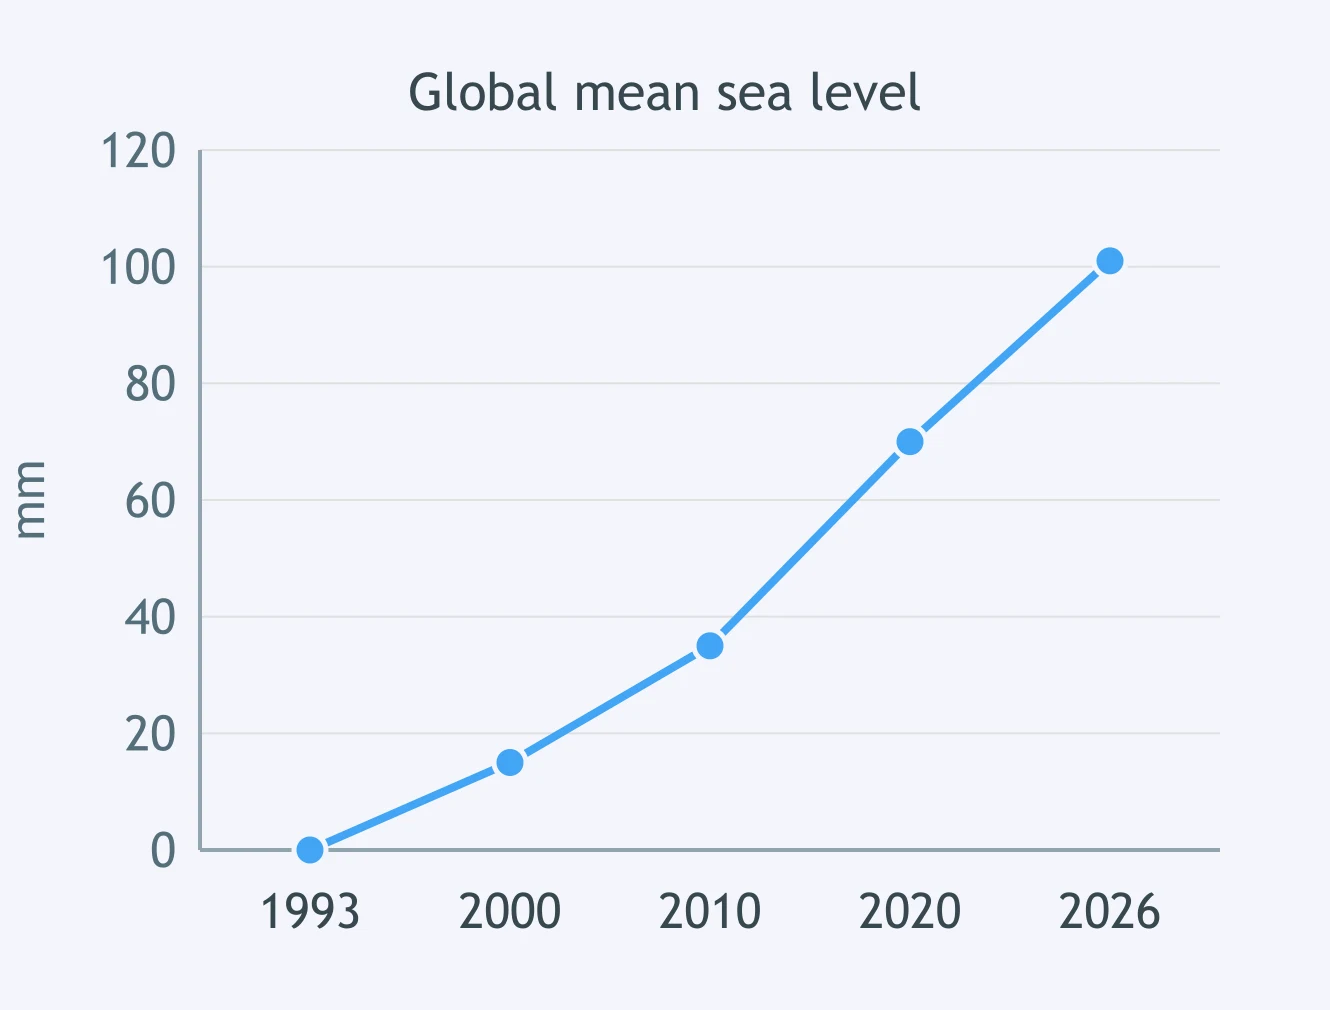
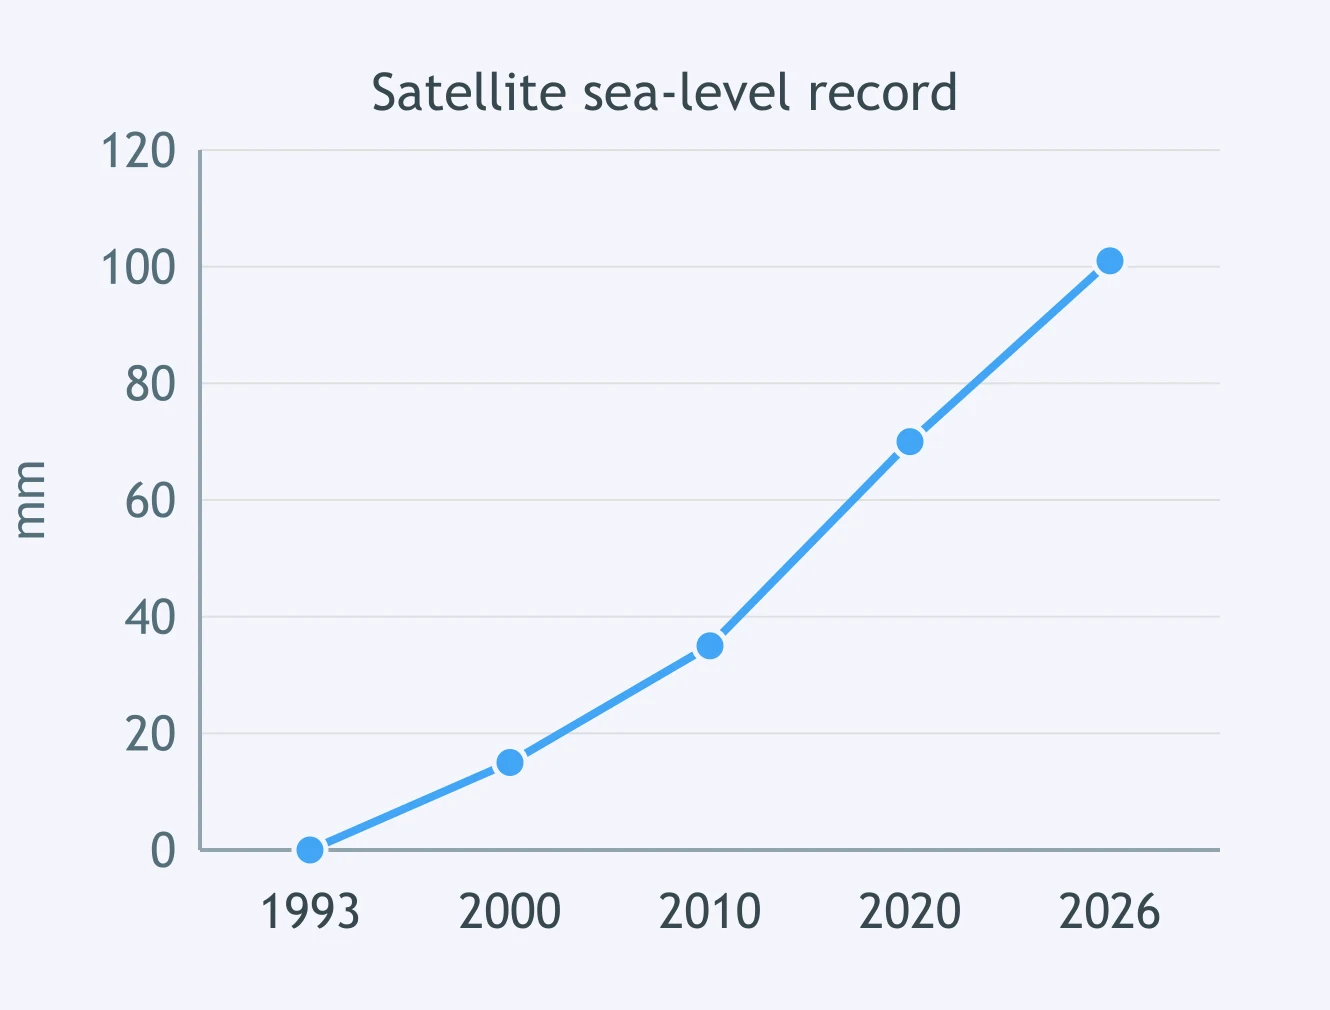
Use the satellite sea-level graph. About how much global mean sea level rise is plotted for 2026?
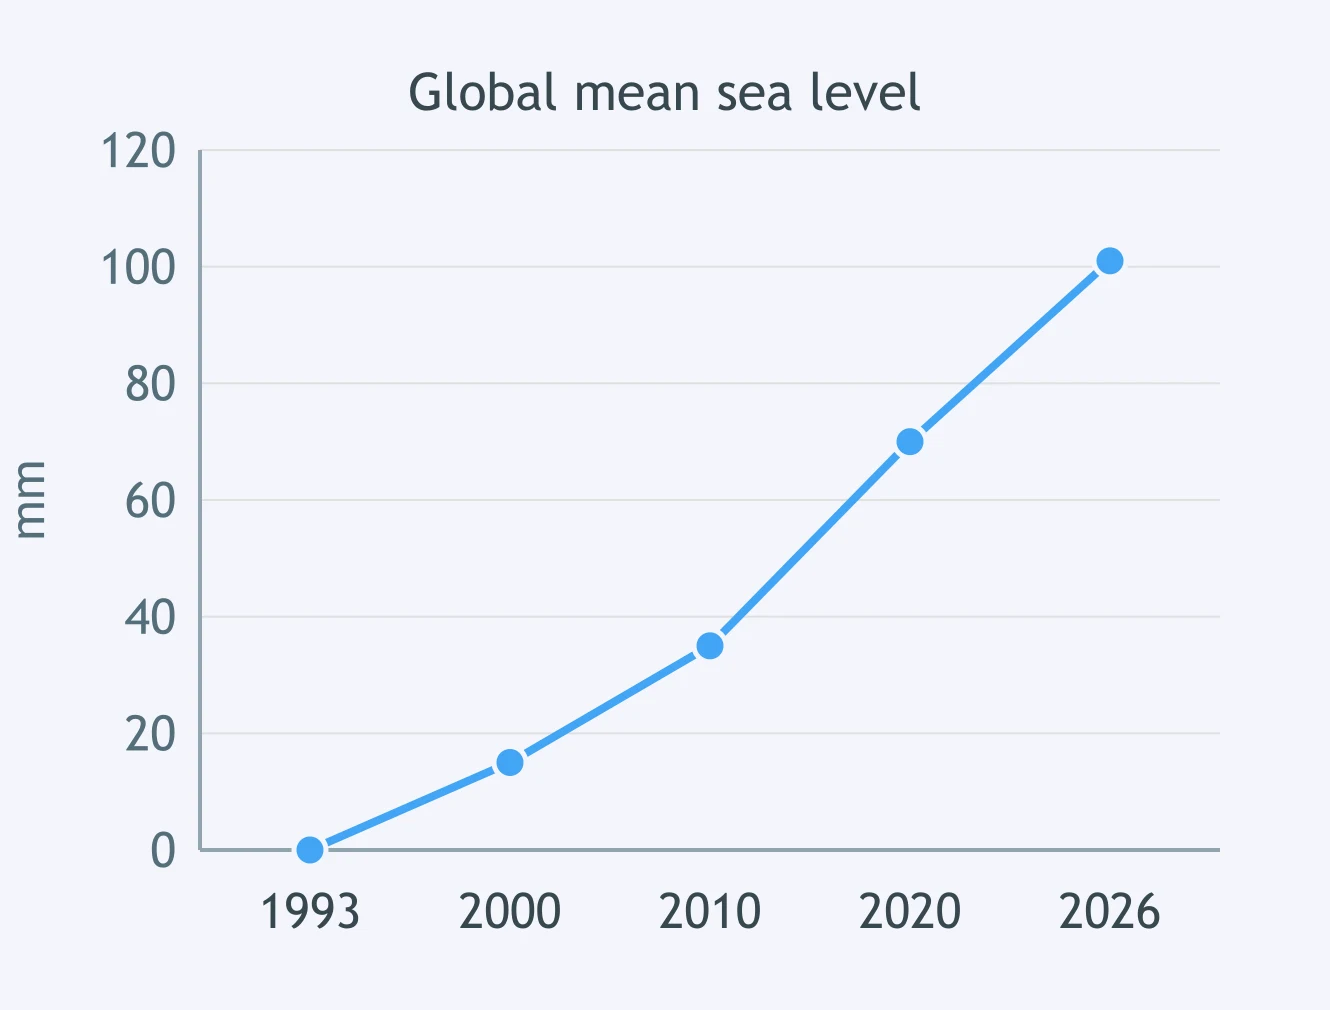
Use the satellite sea-level graph. About what rise is plotted for 2010?
Use the satellite sea-level graph. Which plotted year is nearest 70 mm of rise?
Use the satellite sea-level graph. Which plotted year is the first one above 50 mm of rise?
Coal burning, oil burning, natural gas burning, deforestation, and cement production all add a long-lived greenhouse gas to air. What gas is it?
Wetlands, landfills, rice paddies, fossil-fuel leaks, and cattle digestion release a greenhouse gas with formula CH₄. What gas is it?
Fertilizer use, soil microbes, wastewater treatment, and some combustion release the greenhouse gas N₂O. What gas is N₂O?
A greenhouse gas is the most abundant in the atmosphere, but its amount mainly rises as warmer air holds more moisture. What gas is it?
Older refrigerants and spray-can propellants included synthetic greenhouse gases that do not occur naturally and also damage stratospheric ozone. What group is this?
A gas makes up most of dry air but absorbs little outgoing infrared radiation, so it is not a major greenhouse gas. What gas is it?
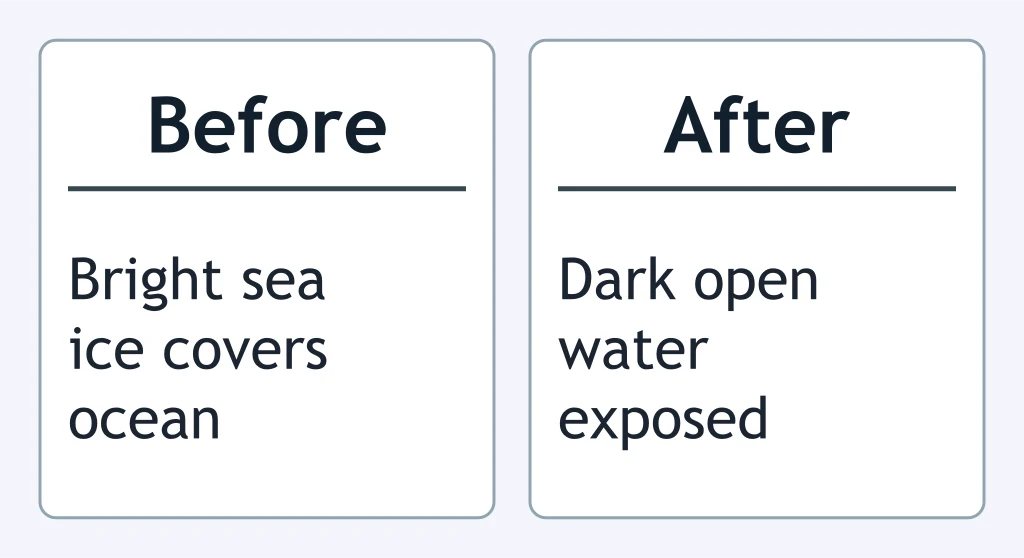
The comparison figure shows bright sea ice replaced by dark open ocean. How does this change affect absorbed insolation in the Arctic?
As air temperature rises, evaporation increases and warmer air can hold more moisture. How does this water-vapor feedback affect warming?
Thawing permafrost can release methane and carbon dioxide from once-frozen organic matter. What climate feedback can this create?
Ocean water expands as it warms. If the ocean gains heat for decades, what direct consequence follows for global mean sea level?
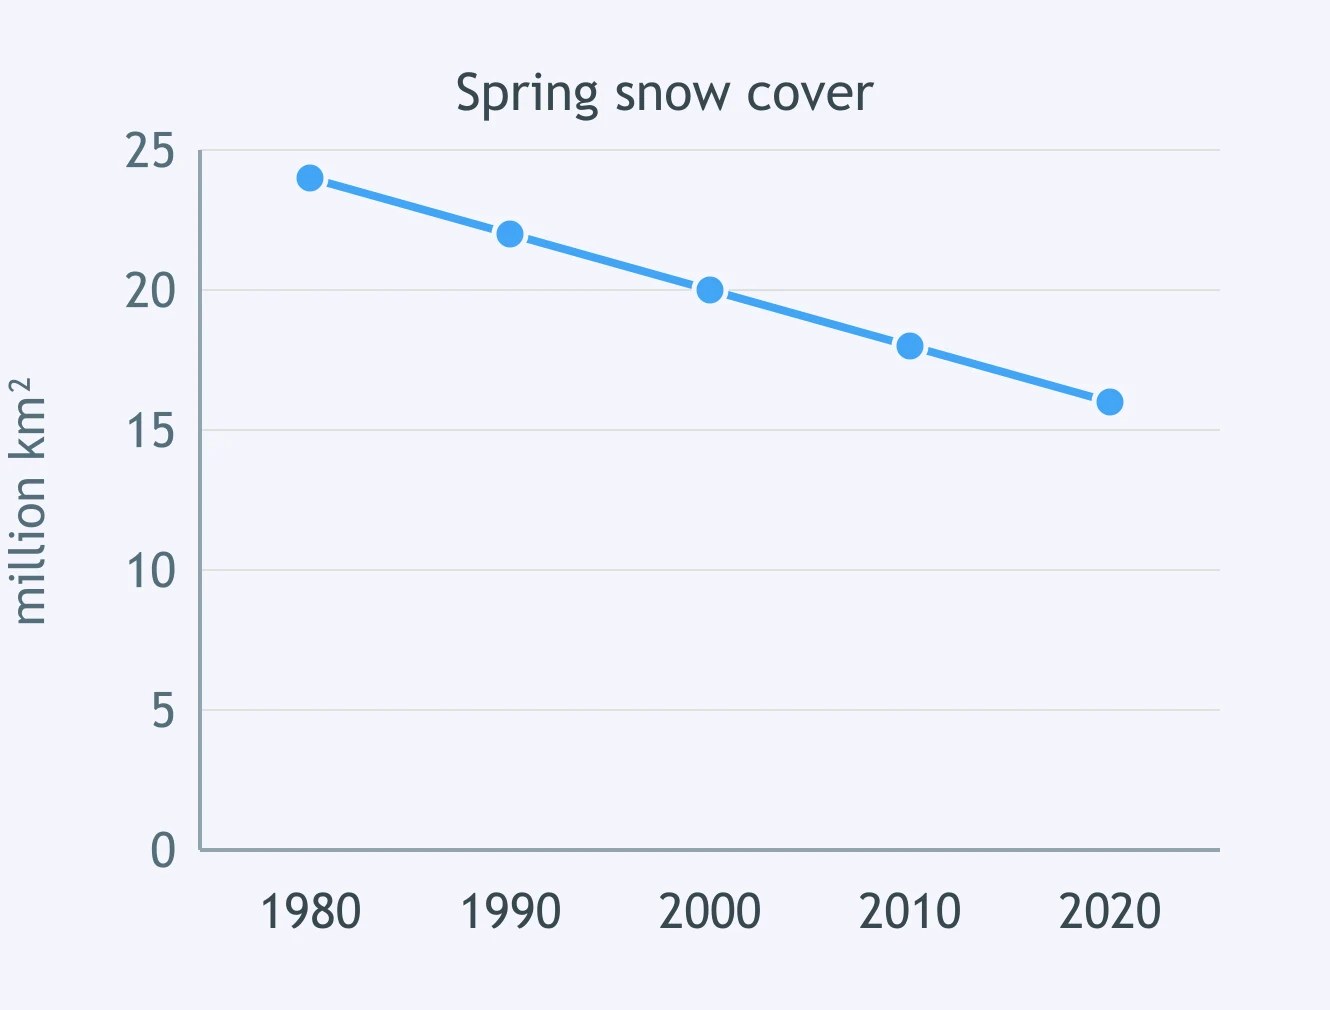
Use the snow-cover graph. If spring snow cover keeps declining, what happens to surface albedo over the exposed land?
Sulfate aerosols can reflect sunlight and brighten clouds. If sulfate aerosols decrease while greenhouse gases stay high, what short-term effect is expected?
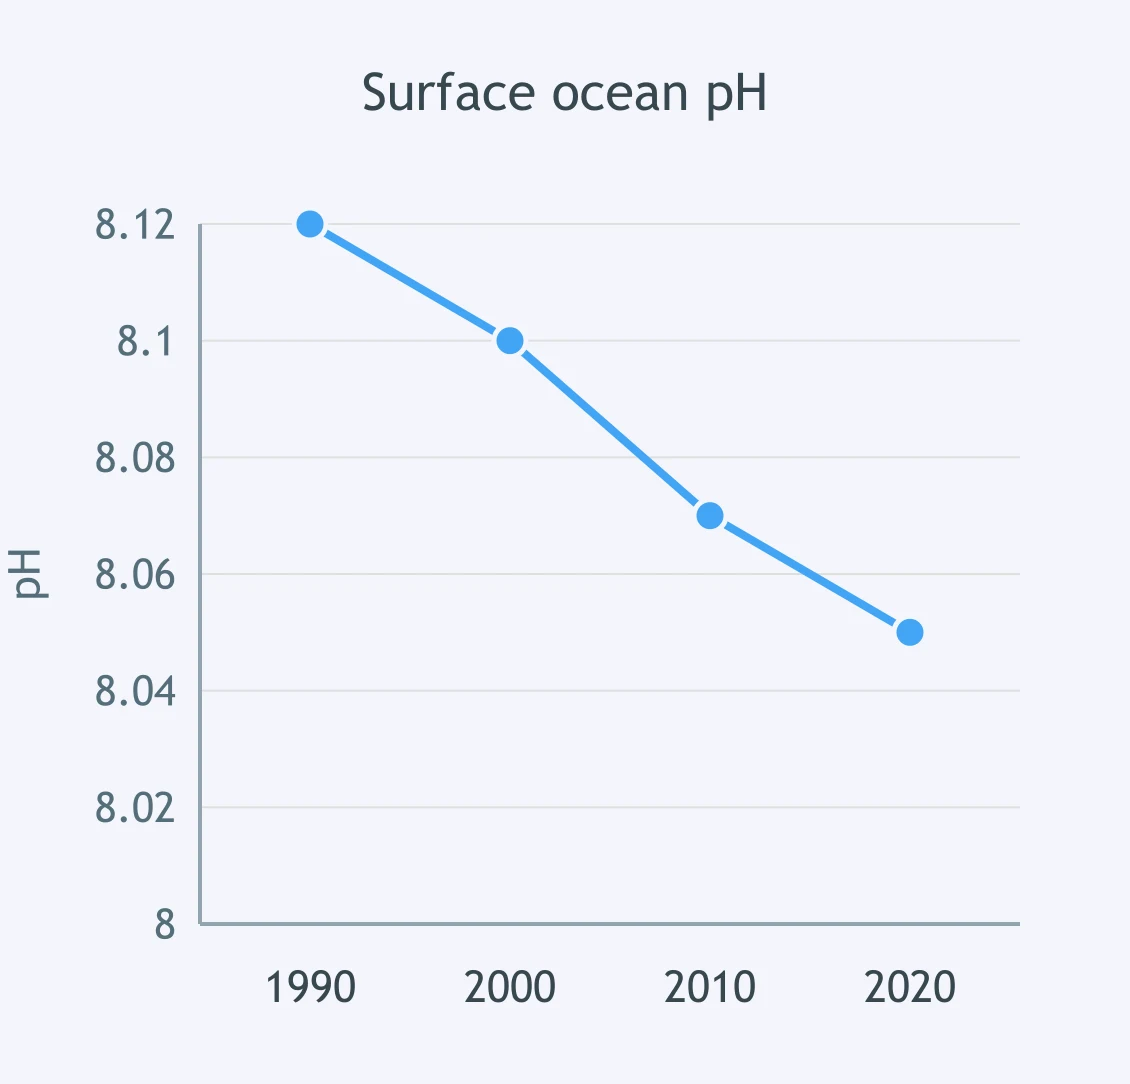
Use the surface-ocean pH graph. What consequence for shell-building organisms follows from the pH trend it shows?
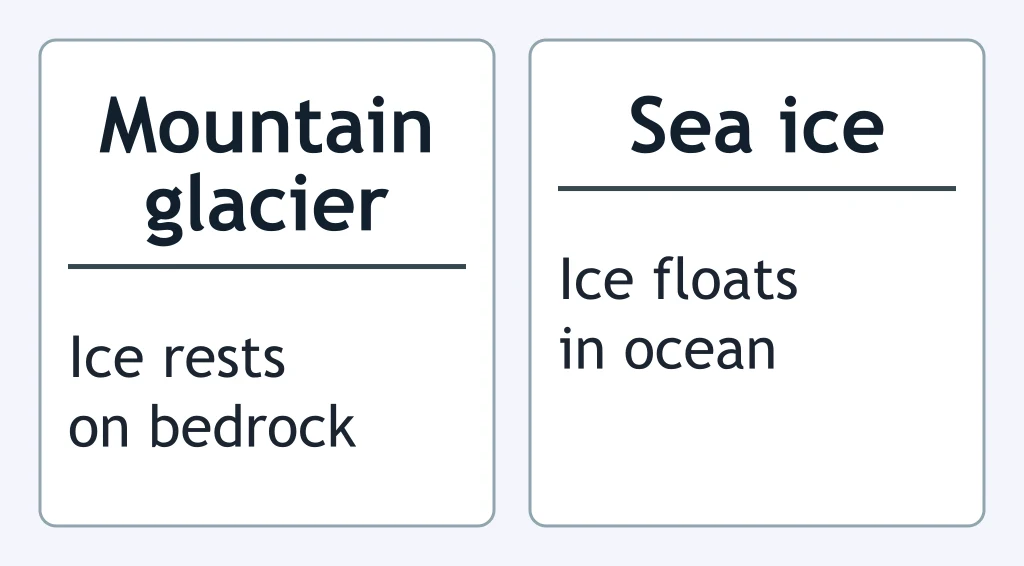
The comparison figure shows a glacier resting on bedrock and sea ice floating in ocean water. Which melting adds new water to the ocean?
A direct Mauna Loa CO₂ record rises from the late 1950s to today. What fact does that measured record establish?
A global temperature anomaly record from land stations, ships, and buoys rises over many decades. What does that measured record establish?
A satellite altimeter record shows global mean sea level rising since 1993. What does that measured record establish?
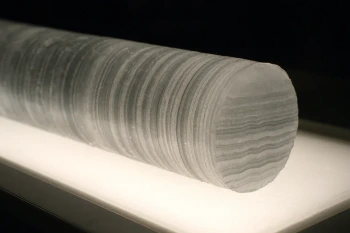
The CO₂ record joins ice-core values with modern air measurements and rises from preindustrial values to recent values above 420 ppm. What does it establish?
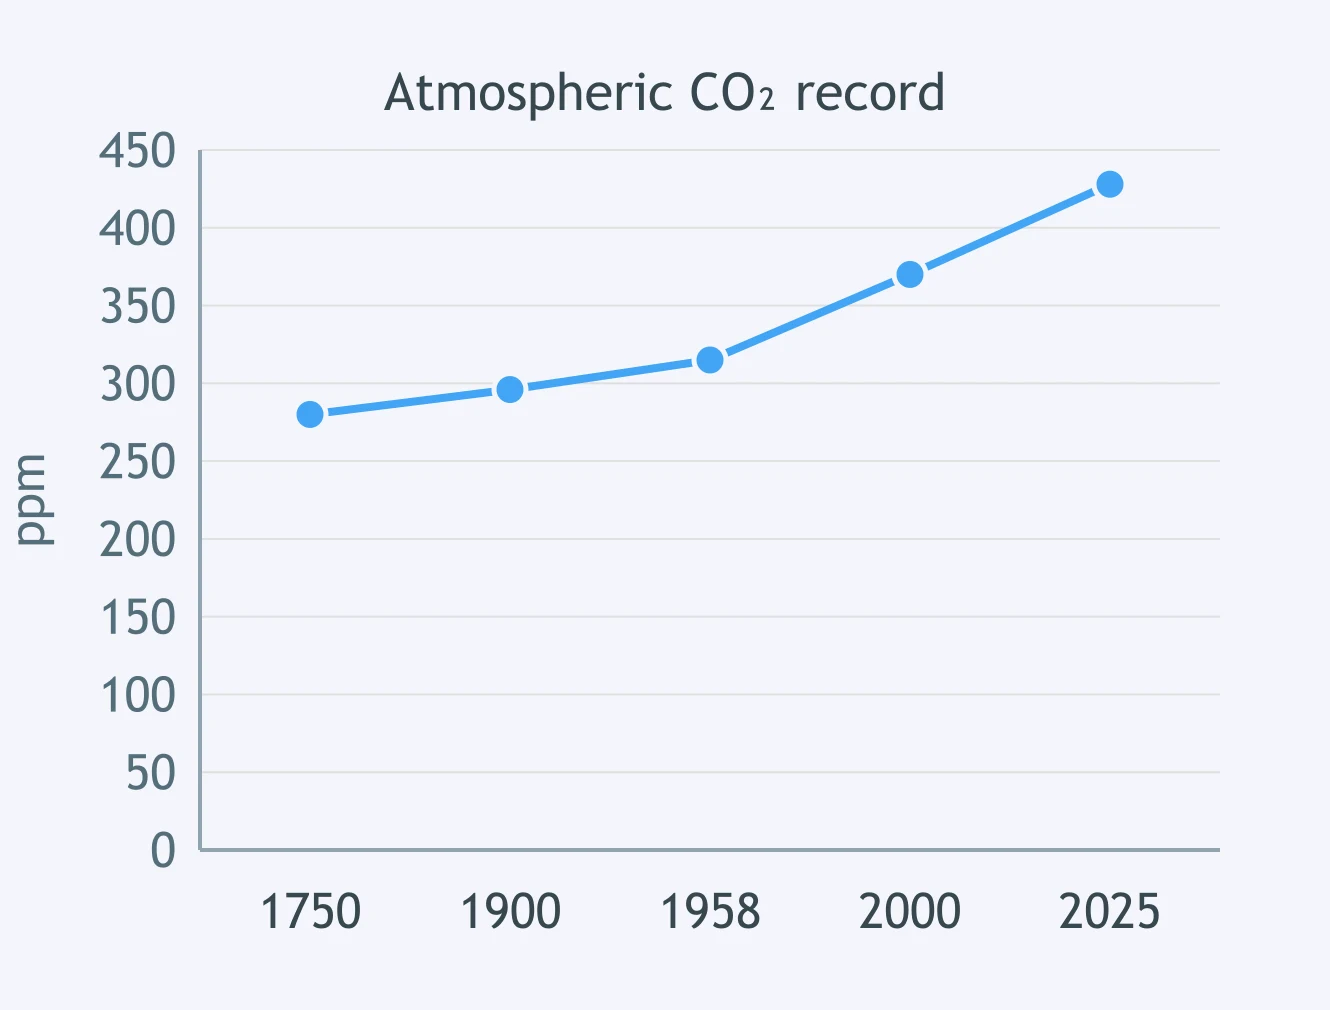
Use the sea-level graph. From 1993 to 2023, what is the average rate of rise?
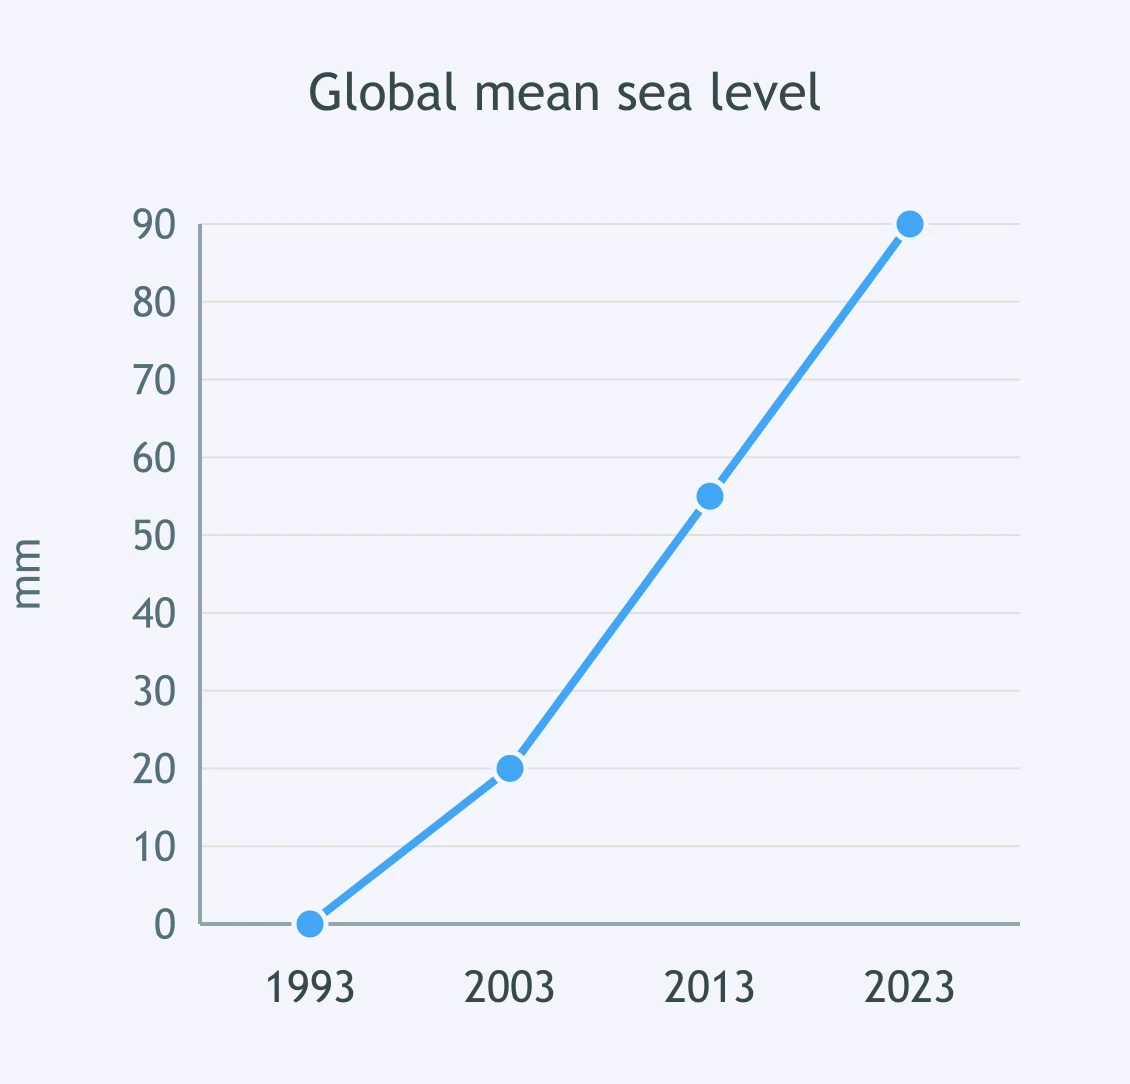
Use the CO₂ graph. From 1960 to 2020, what is the average rate of increase?
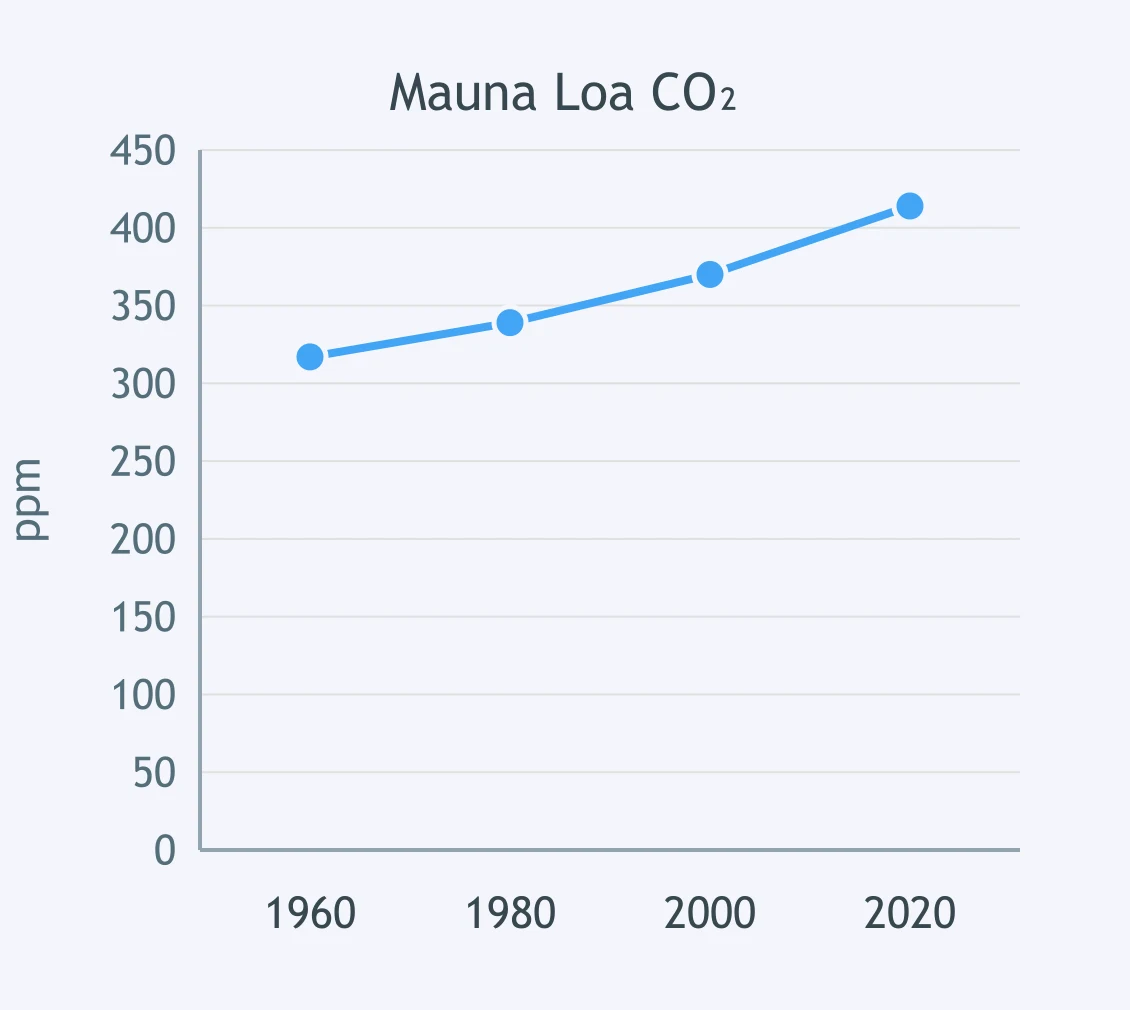
Use the temperature-anomaly graph. From 1970 to 2020, what is the average rate of warming per decade?
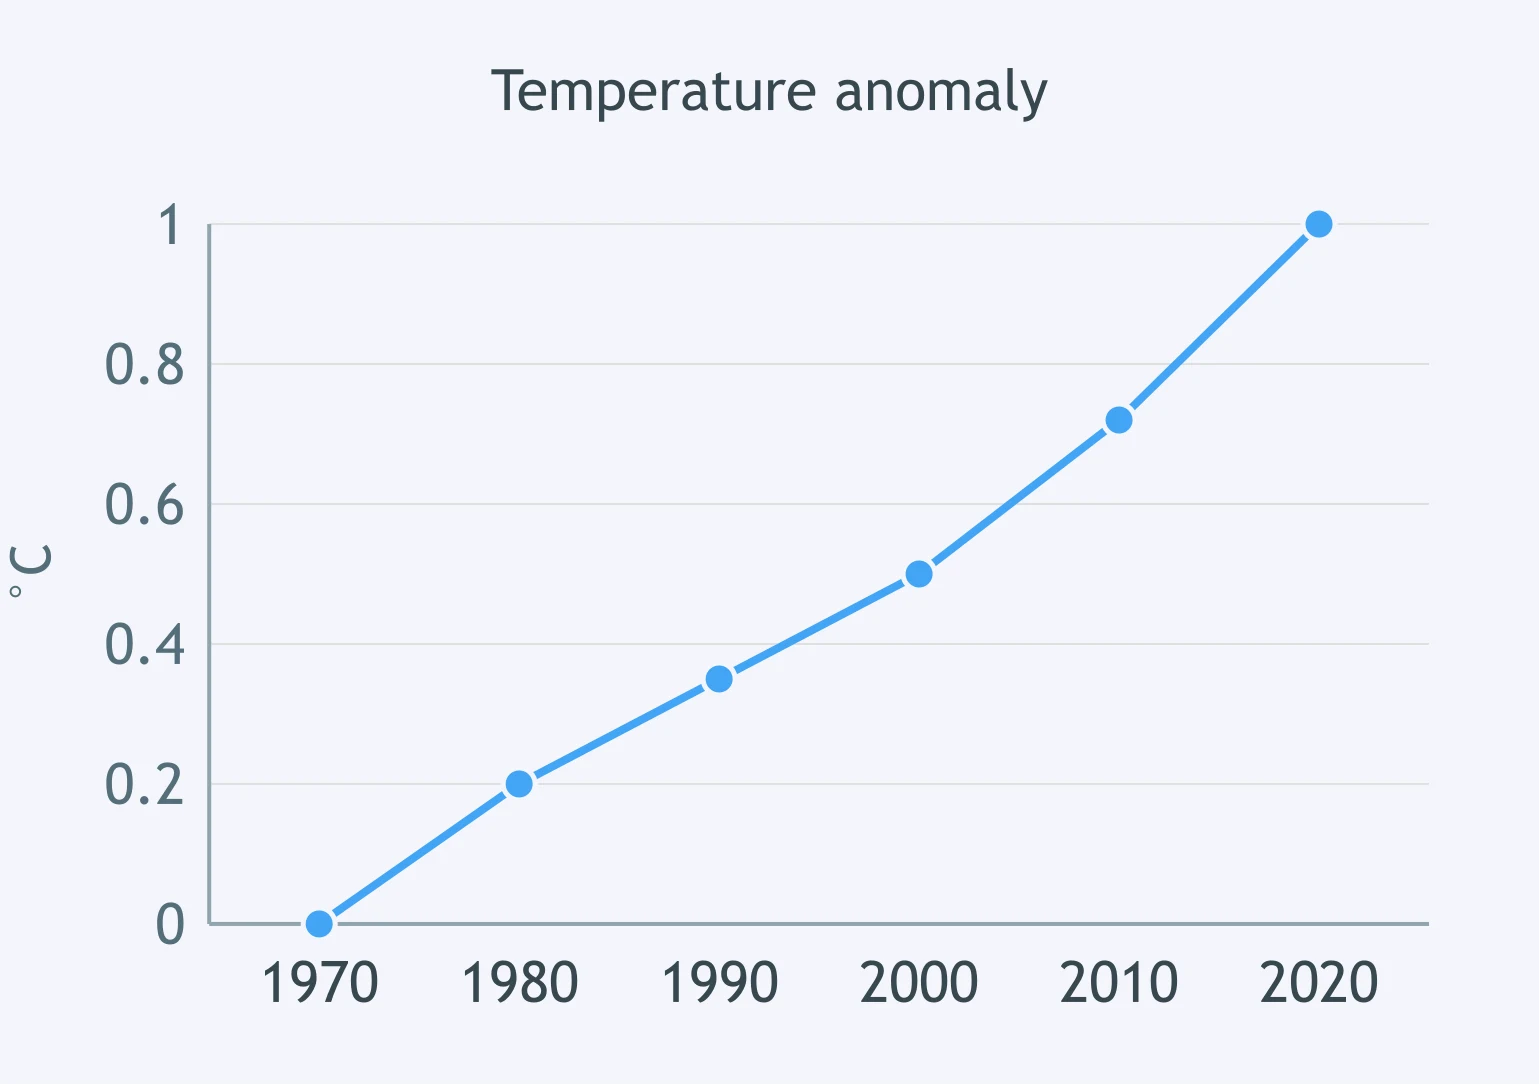
Use the CO₂ graph. From 2000 to 2025, what is the average rate of increase?
Crack the passcode before the zombies get in.
Answer, then swat bugs for bonus points.
Race through questions at your own speed.
Same question on every screen. Fastest wins.

Pick a tile, answer, hit bonuses and steals.
Renewable and Nonrenewable Energy
40 questions