Loading
by BlastRoom
Review of climate controls, climate zones, paleoclimate evidence, and present climate change.
#earth_space_science
40 questions
One question set, multiple game modes. Tap any game to see it in action. Not sure which to pick?
Answer to place stones and capture territory.
Outrun the snow together.
Earn blasts, then hunt the other team.
Answer to earn energy, then climb.

The class blasts through walls together.
Bid on mystery lots. Most money wins.
Sell tours. Nice, standard, or a total scam.

Answer, restock, and serve the rush.
More correct answers pulls the rope your way.
Answer, then shoot down the alien wave.
Answer, then tap to leap the frozen ridge.
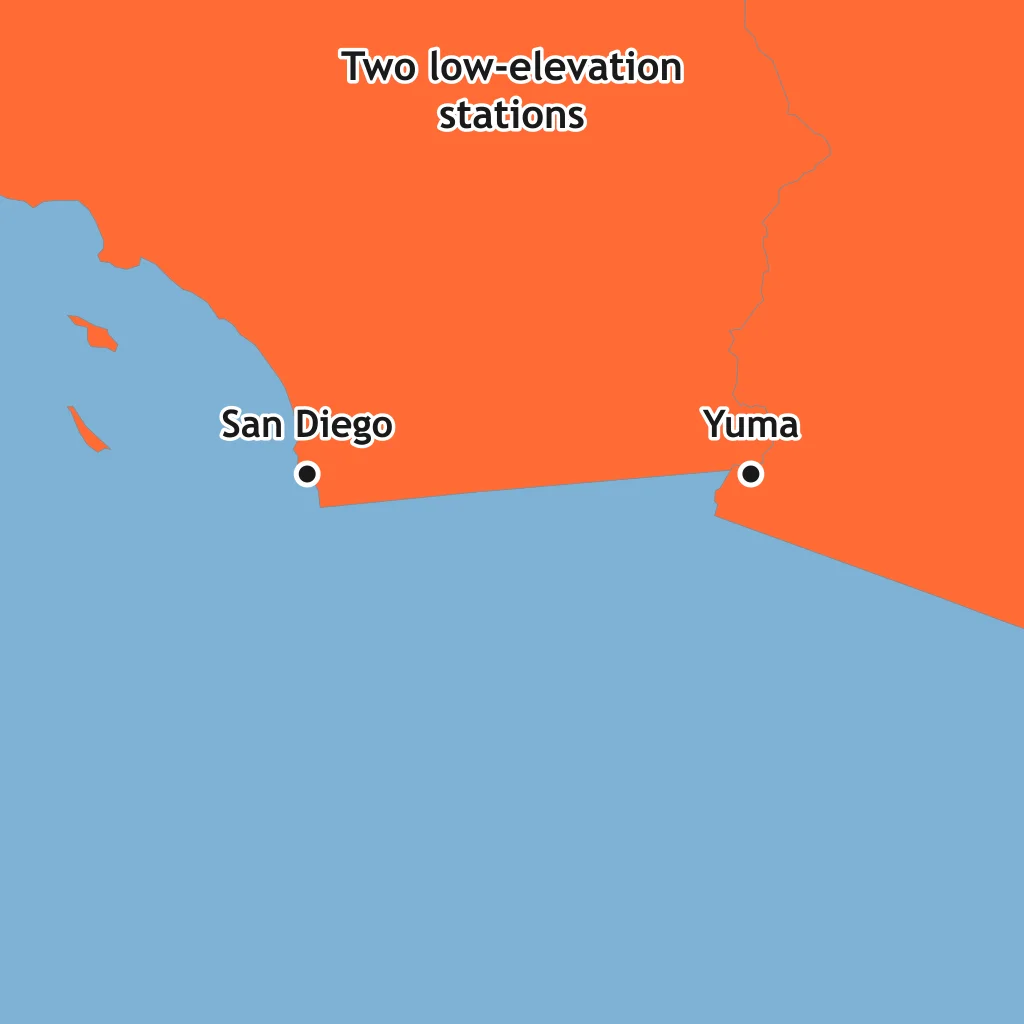
San Diego and Yuma are near the same latitude, but Yuma is much hotter in summer. What climate control best explains the difference?
Denver is far higher above sea level than New Orleans and has cooler average temperatures. What climate control is most responsible?
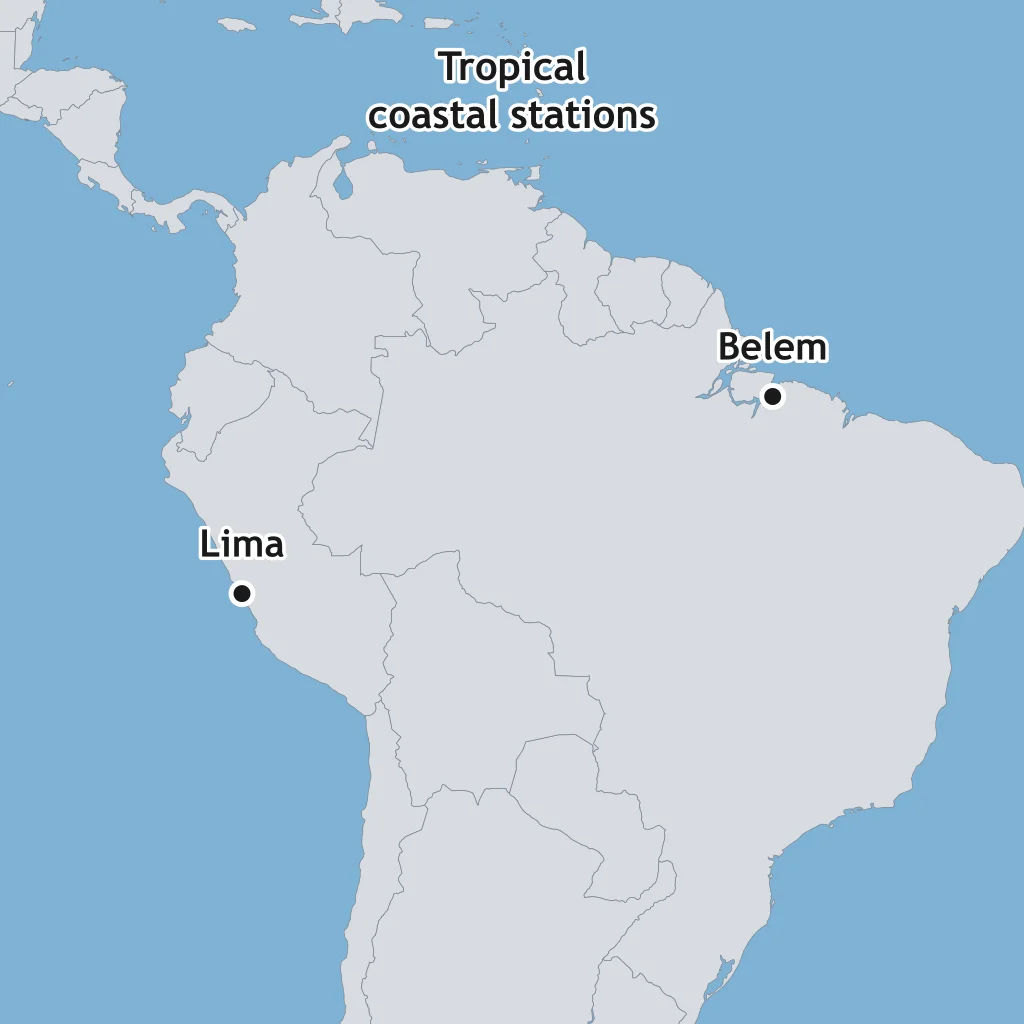
Lima, Peru, is a dry coastal city, while Belém, Brazil, is a humid tropical coastal city. What control helps keep Lima so dry?
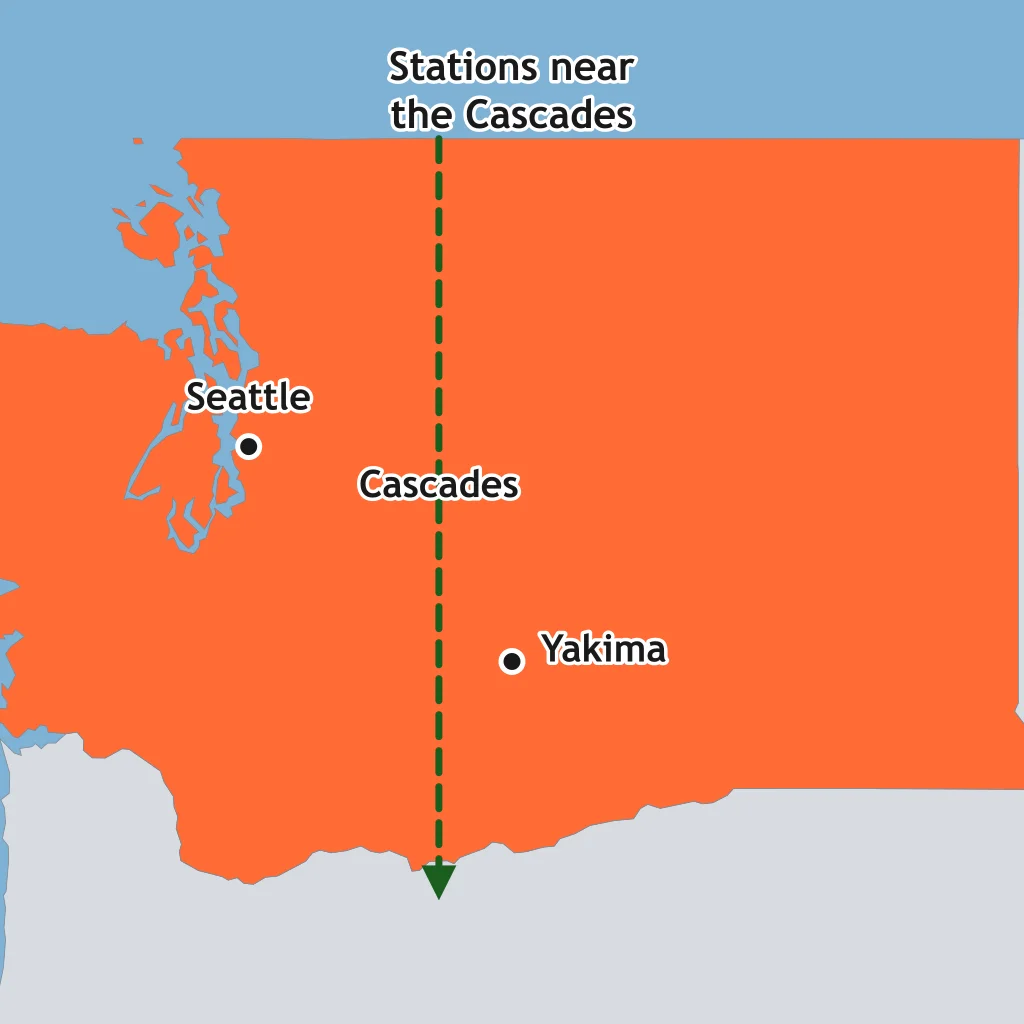
Seattle is west of the Cascade Range, while Yakima is east of it and much drier. What control explains Yakima's lower precipitation?
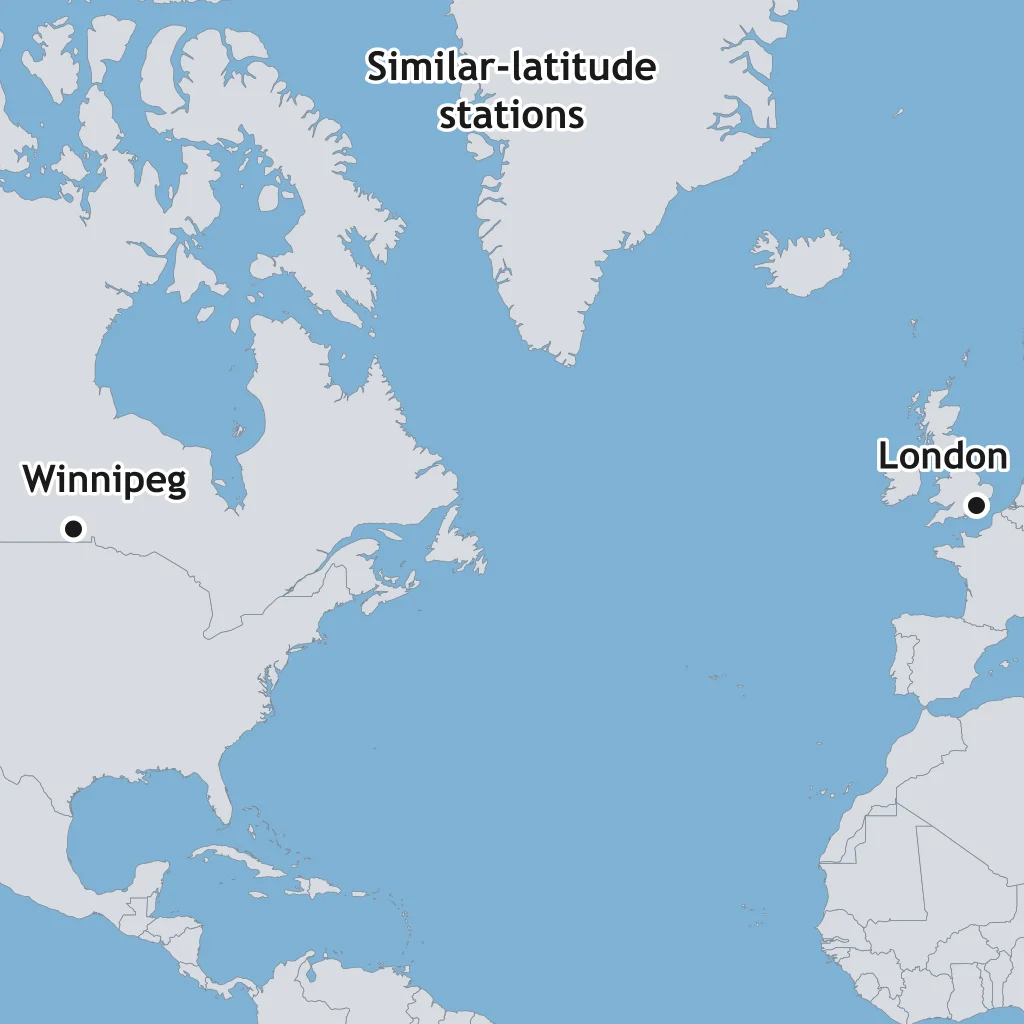
London and Winnipeg are at similar latitudes, but London has milder winters. What control most helps London stay warmer?
Quito, Ecuador, lies near the equator at about 2,850 m elevation. If air cools about 6.5 °C per 1,000 m of rise, about how much cooler should Quito be than a sea-level city at the same latitude?
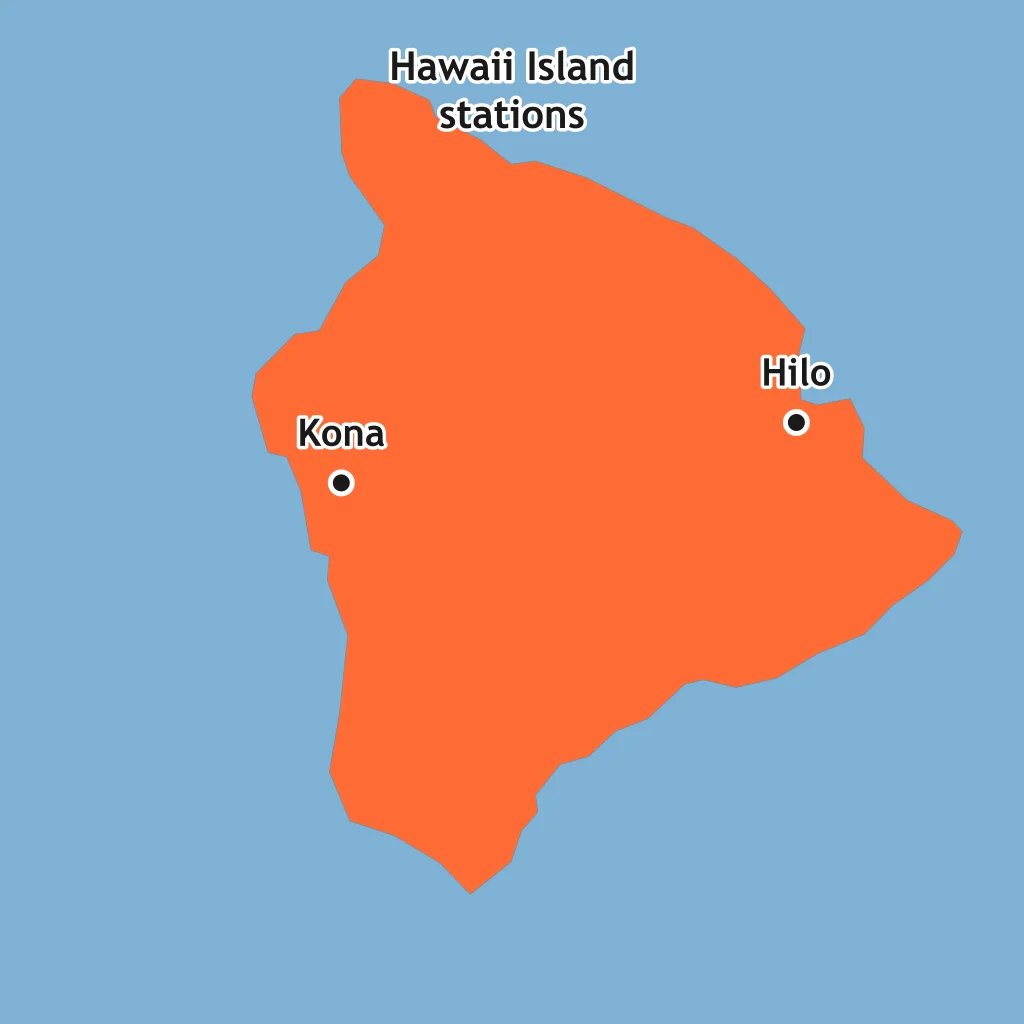
Hilo is on Hawaii Island's windward side, while Kona is leeward and drier. What control causes the contrast?
Mumbai is coastal, while Nagpur is inland at a similar latitude in India. What control gives Mumbai a smaller annual temperature range?
Use Station A's climatograph. What climate zone fits Station A?
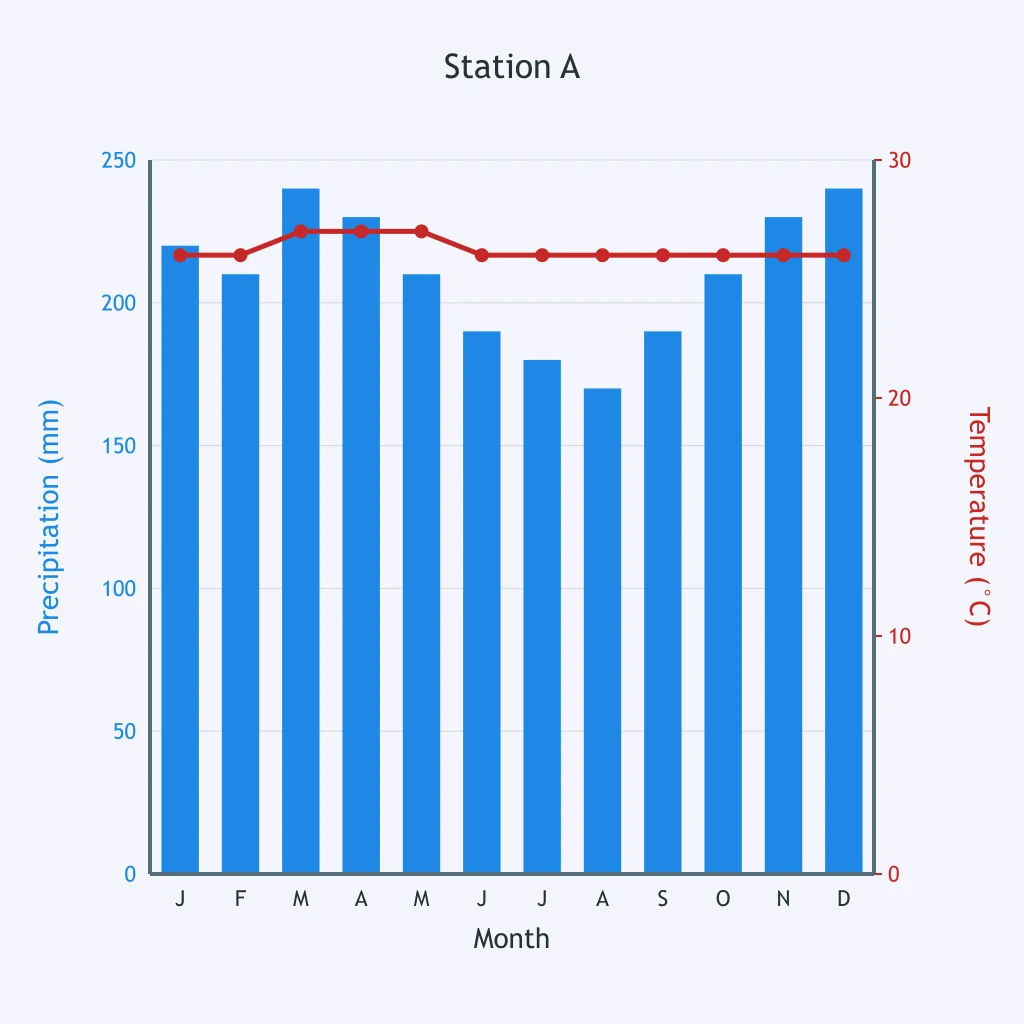
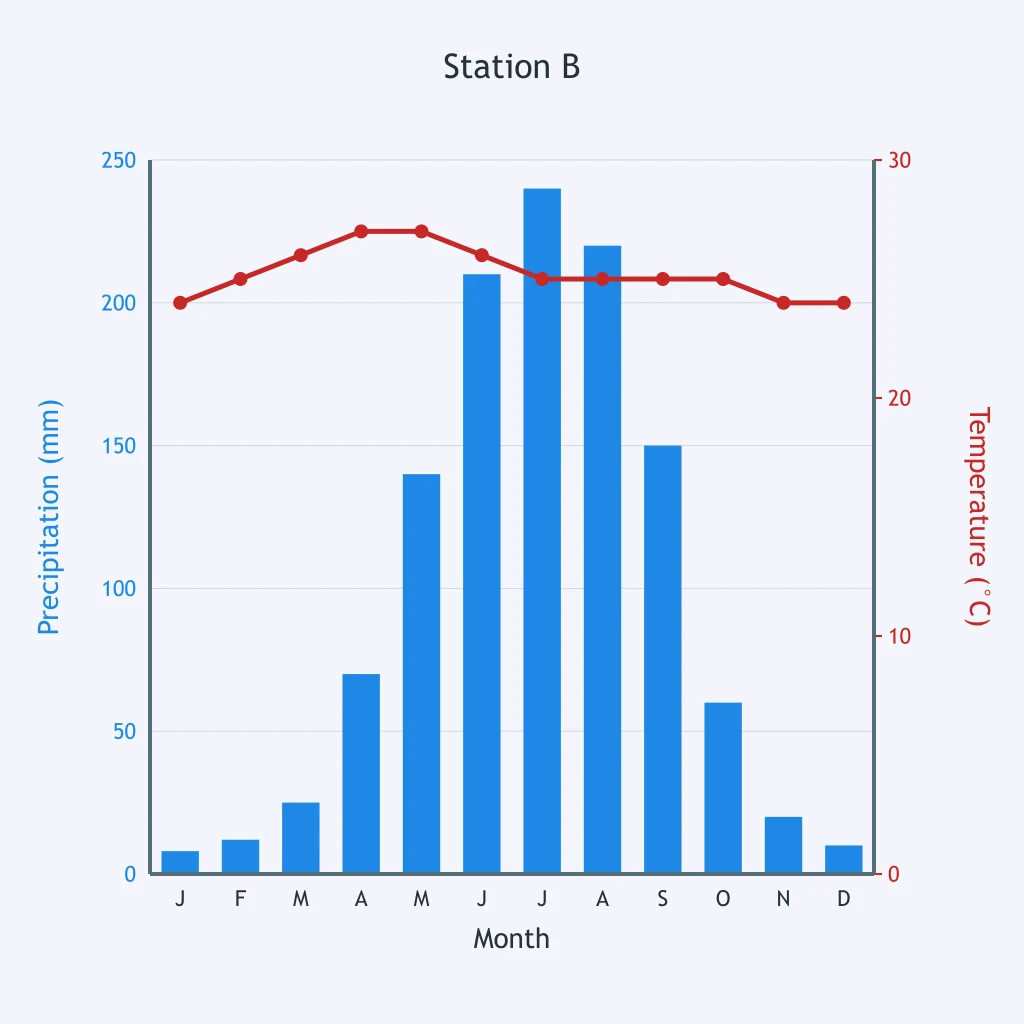
Read Station B's climatograph. What climate zone is shown?
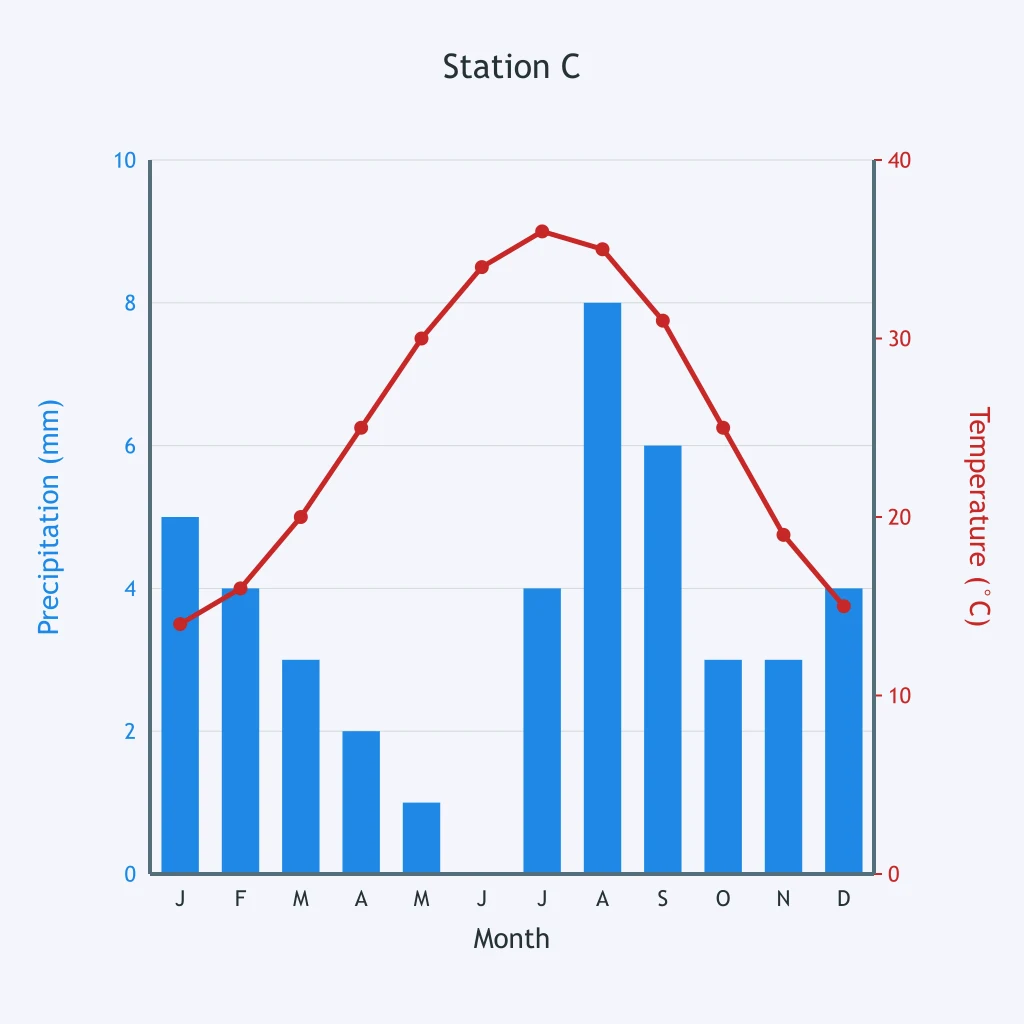
Use Station C's climatograph. What climate zone best matches the data?
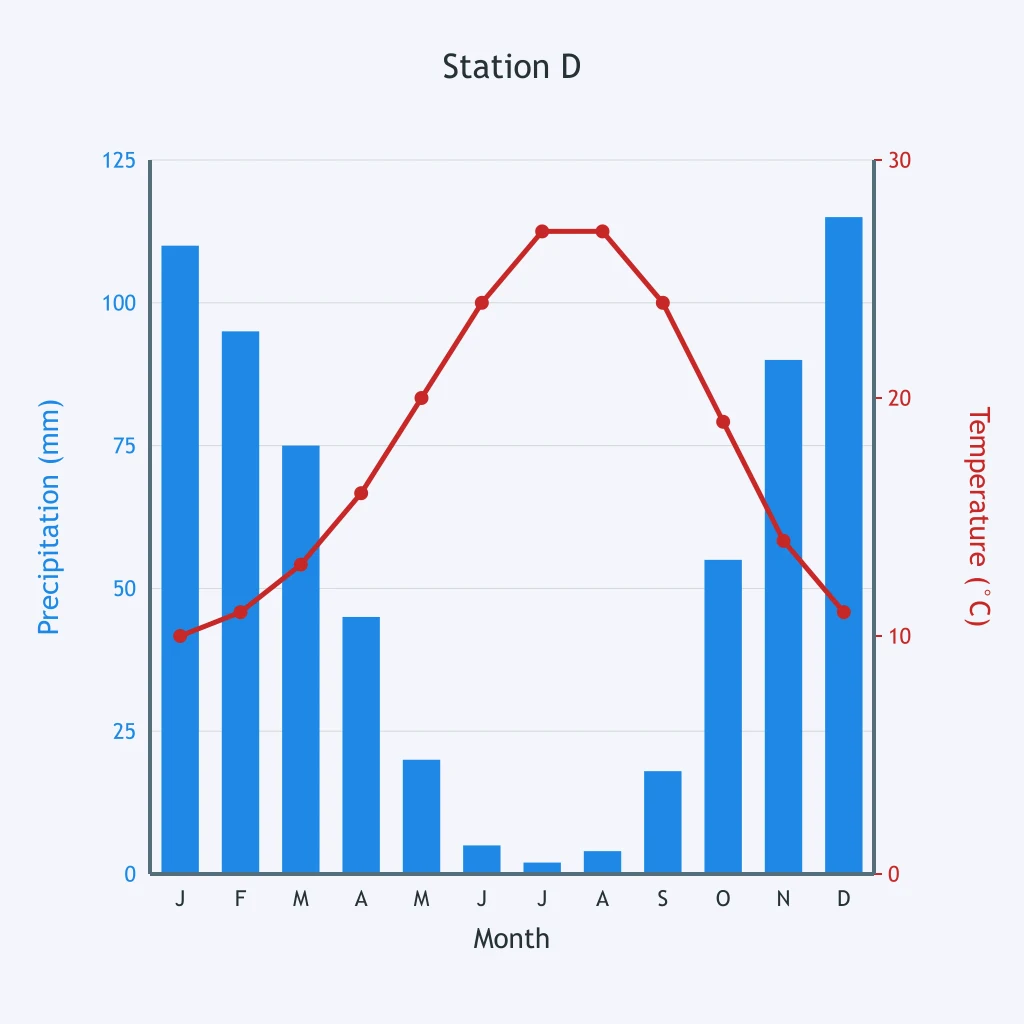
Use Station D's climatograph. What climate zone is shown?
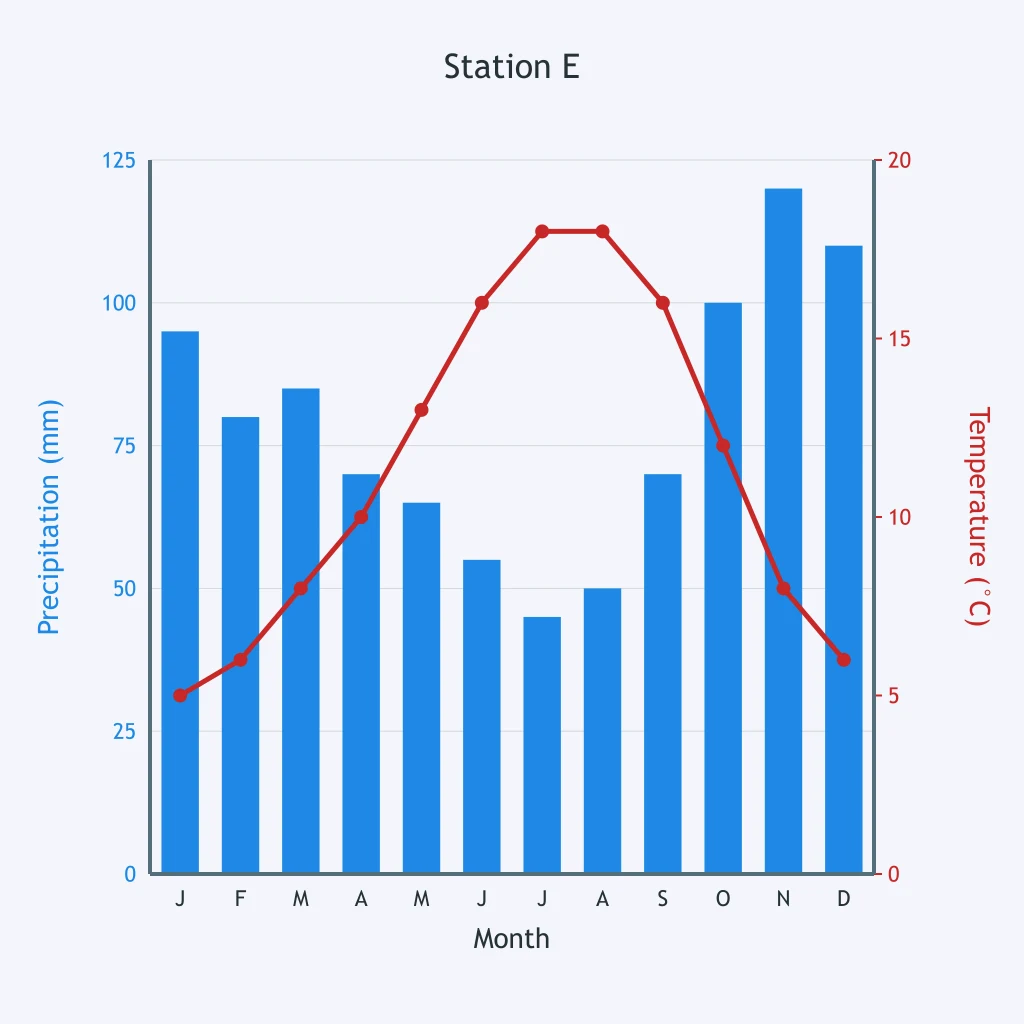
Use Station E's climatograph. What climate zone fits this station?
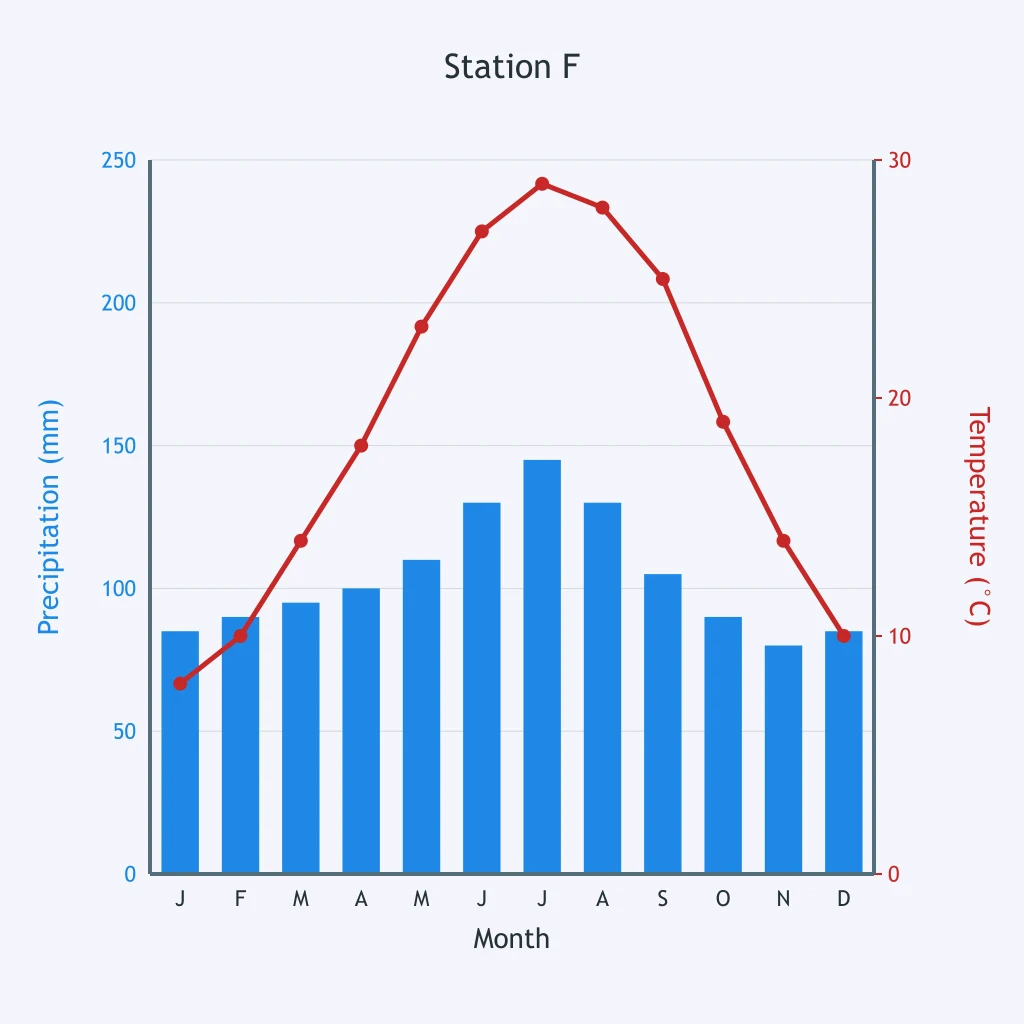
Use Station F's climatograph. What climate zone is most likely?
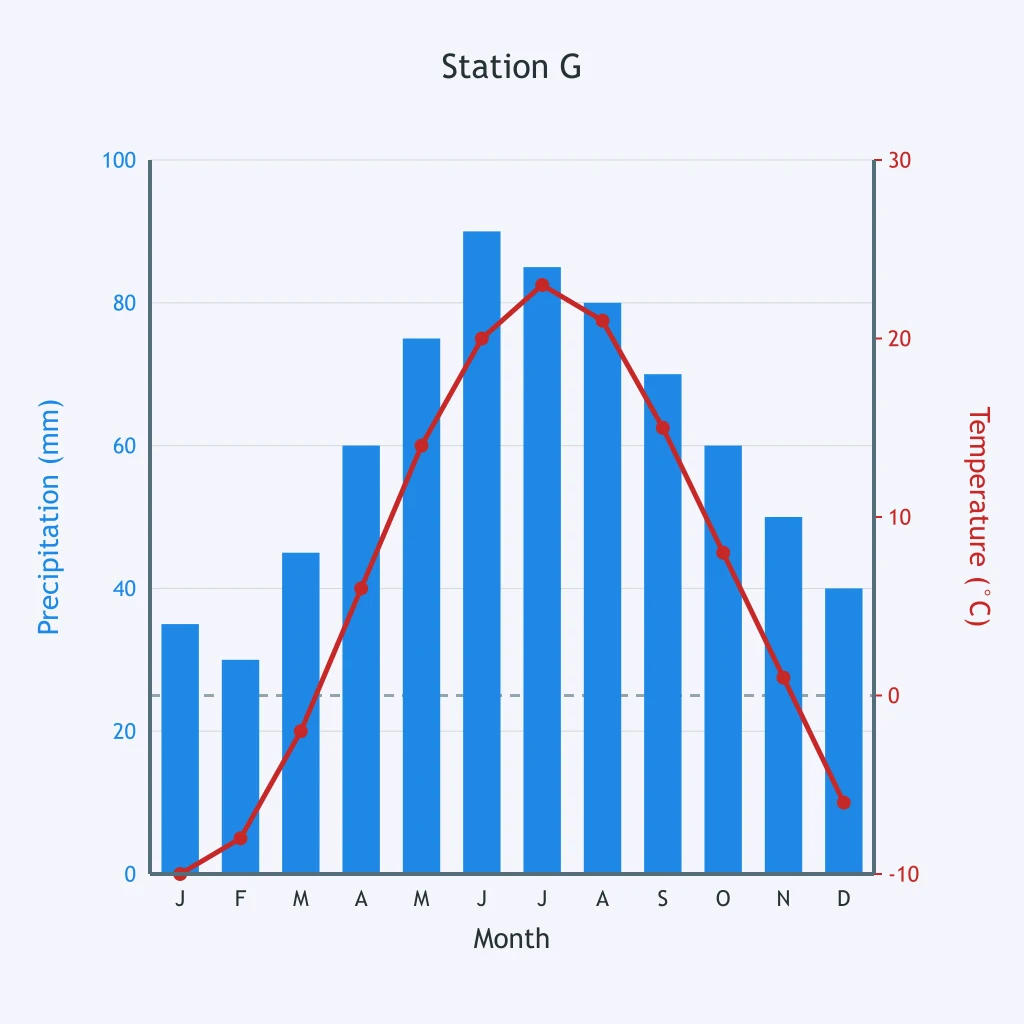
Use Station G's climatograph. What climate zone fits?
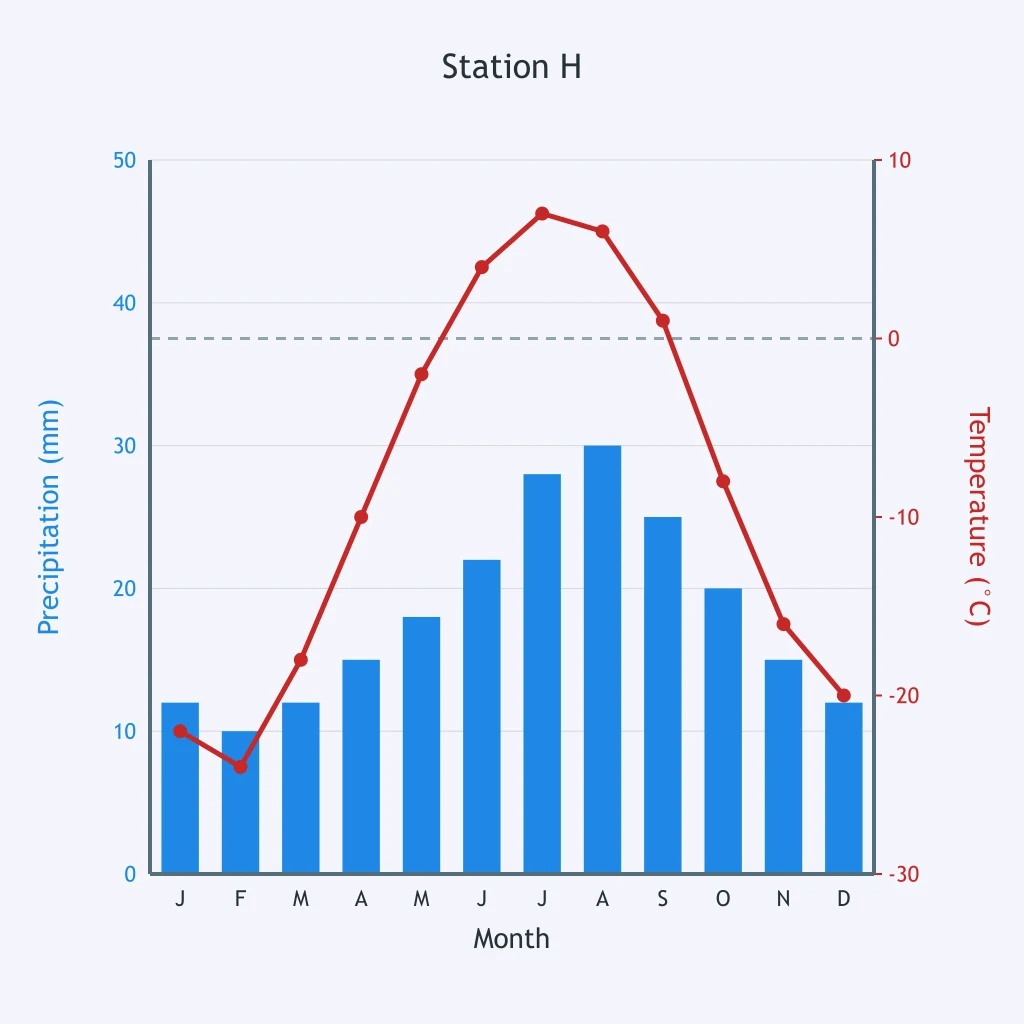
Use Station H's climatograph. What climate zone is shown?
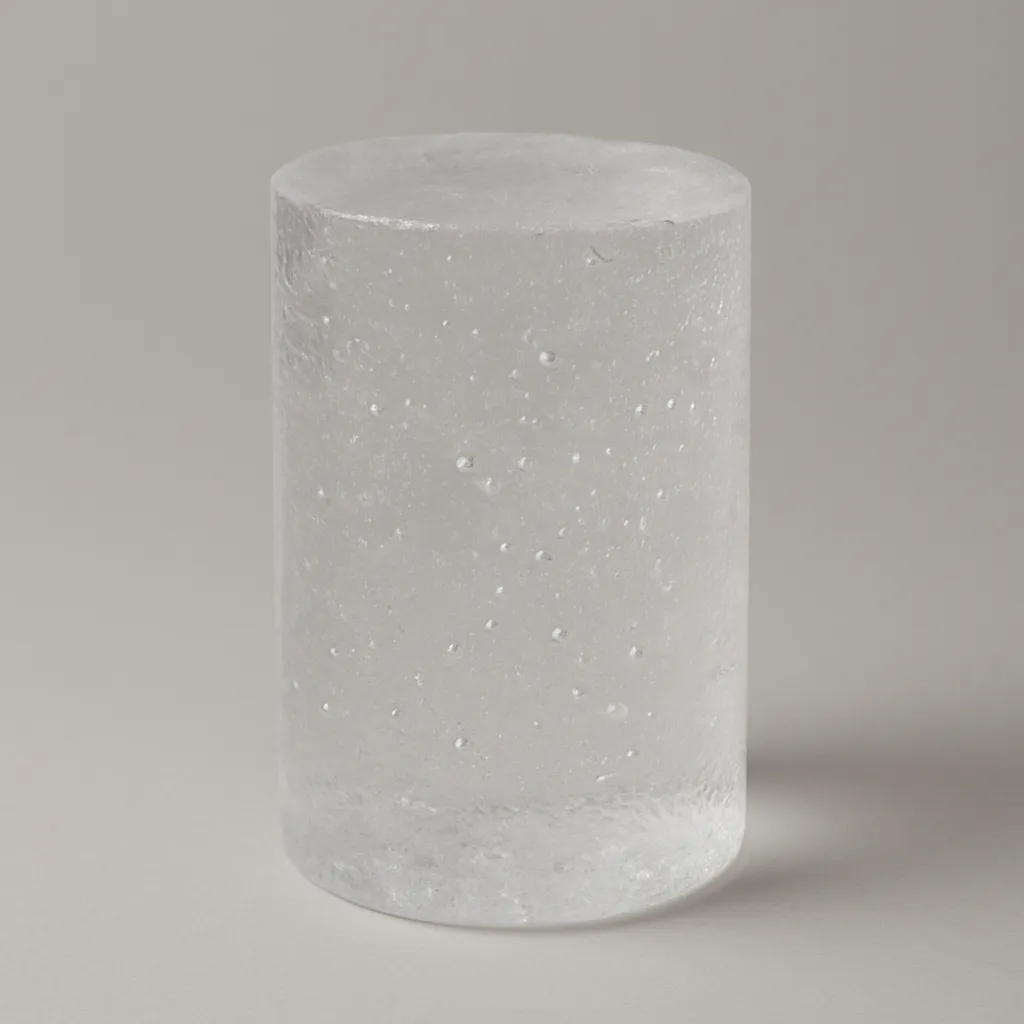
An ice core contains trapped air bubbles in each dated layer. What past condition can scientists reconstruct from those bubbles?
A drought-sensitive pine has narrow rings during dry years and wide rings during wet years. What does a long ring-width record reconstruct?

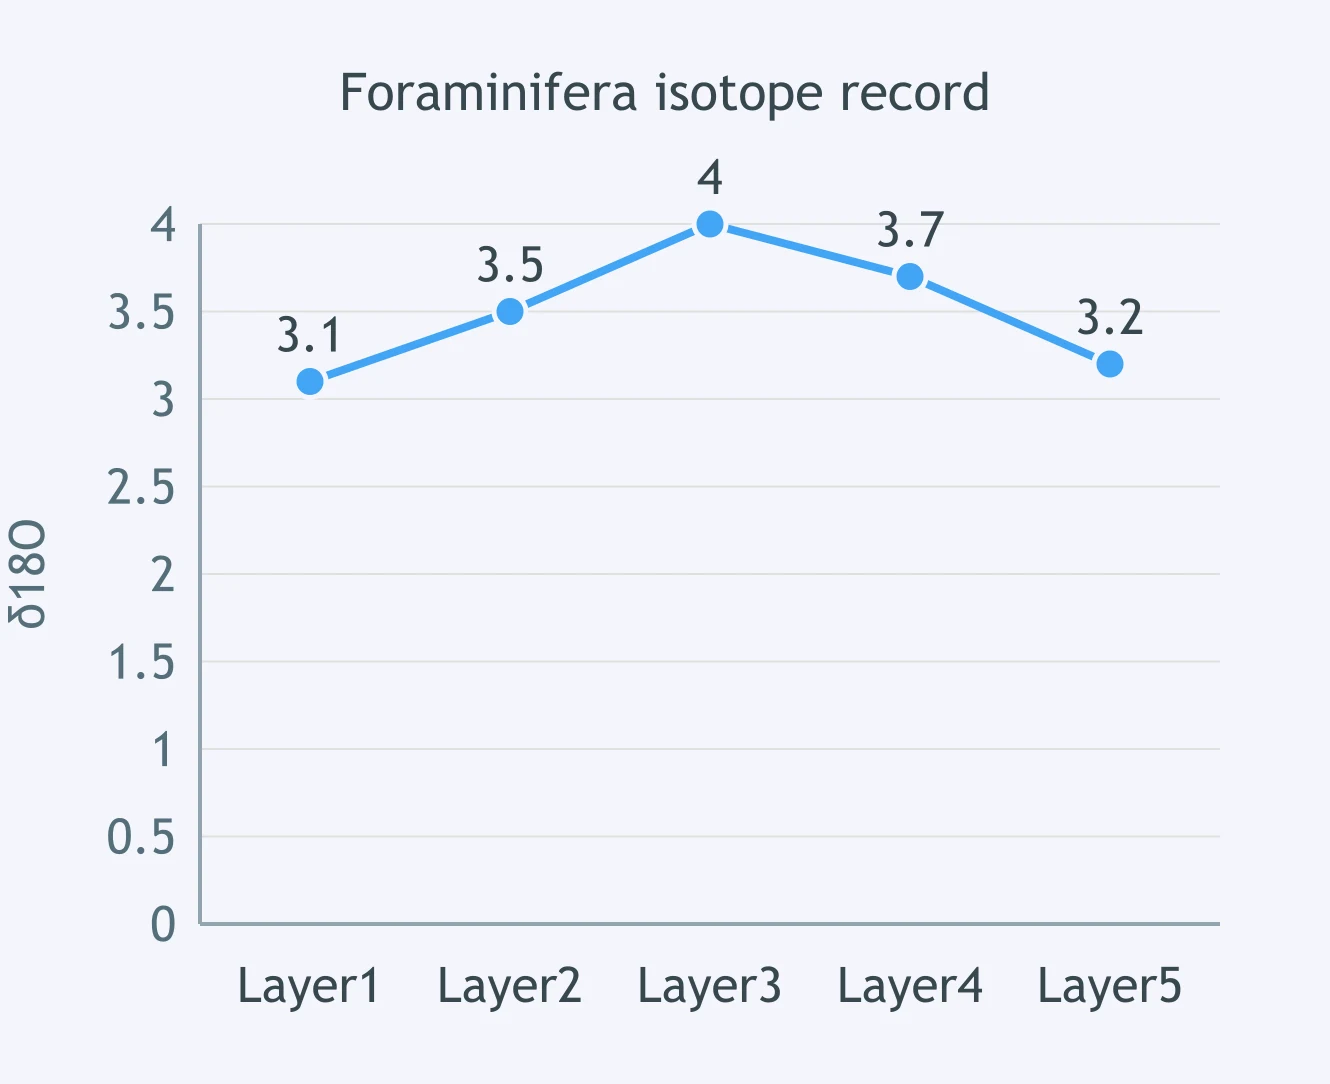
The plotted δ¹⁸O values come from fossil foraminifera shells in ocean mud. What does this proxy record help reconstruct?
A lake core changes upward from spruce pollen to oak and hickory pollen. What climate change does that pollen sequence support?
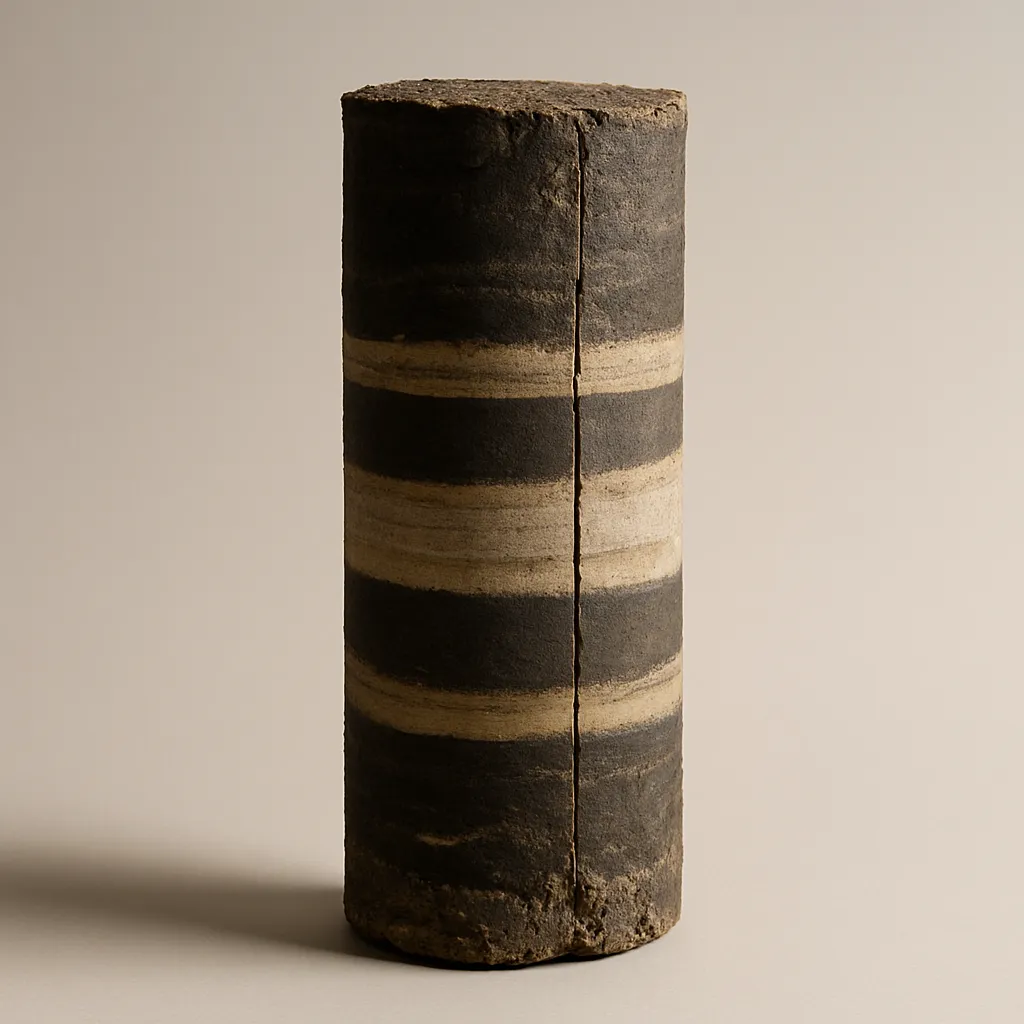
A coral core has annual bands with changing density and oxygen-isotope values. What climate information can scientists reconstruct?
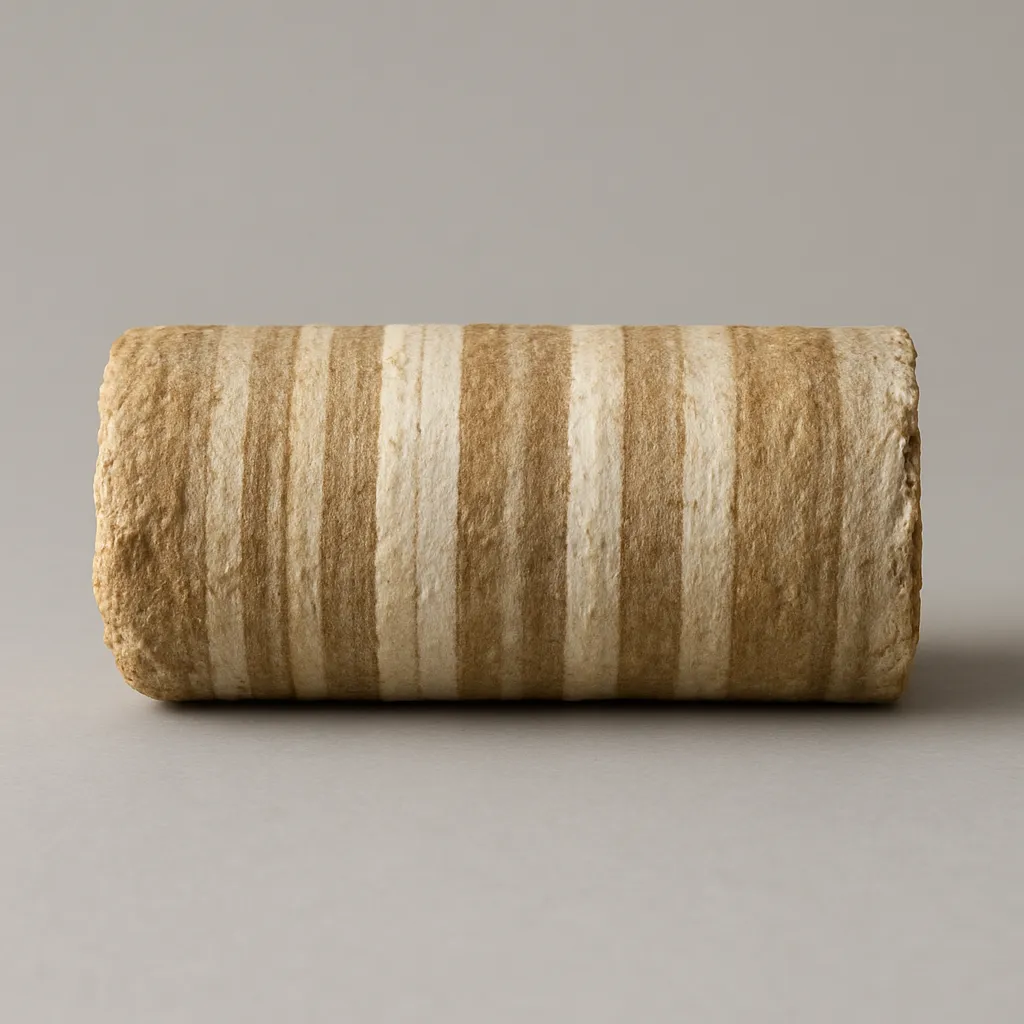
A stalagmite grew thicker layers during intervals when more drip water entered a cave. What does that speleothem record reconstruct?
A valley has moraines far beyond today's glacier edge and bedrock striations pointing down-valley. What past climate condition do they support?
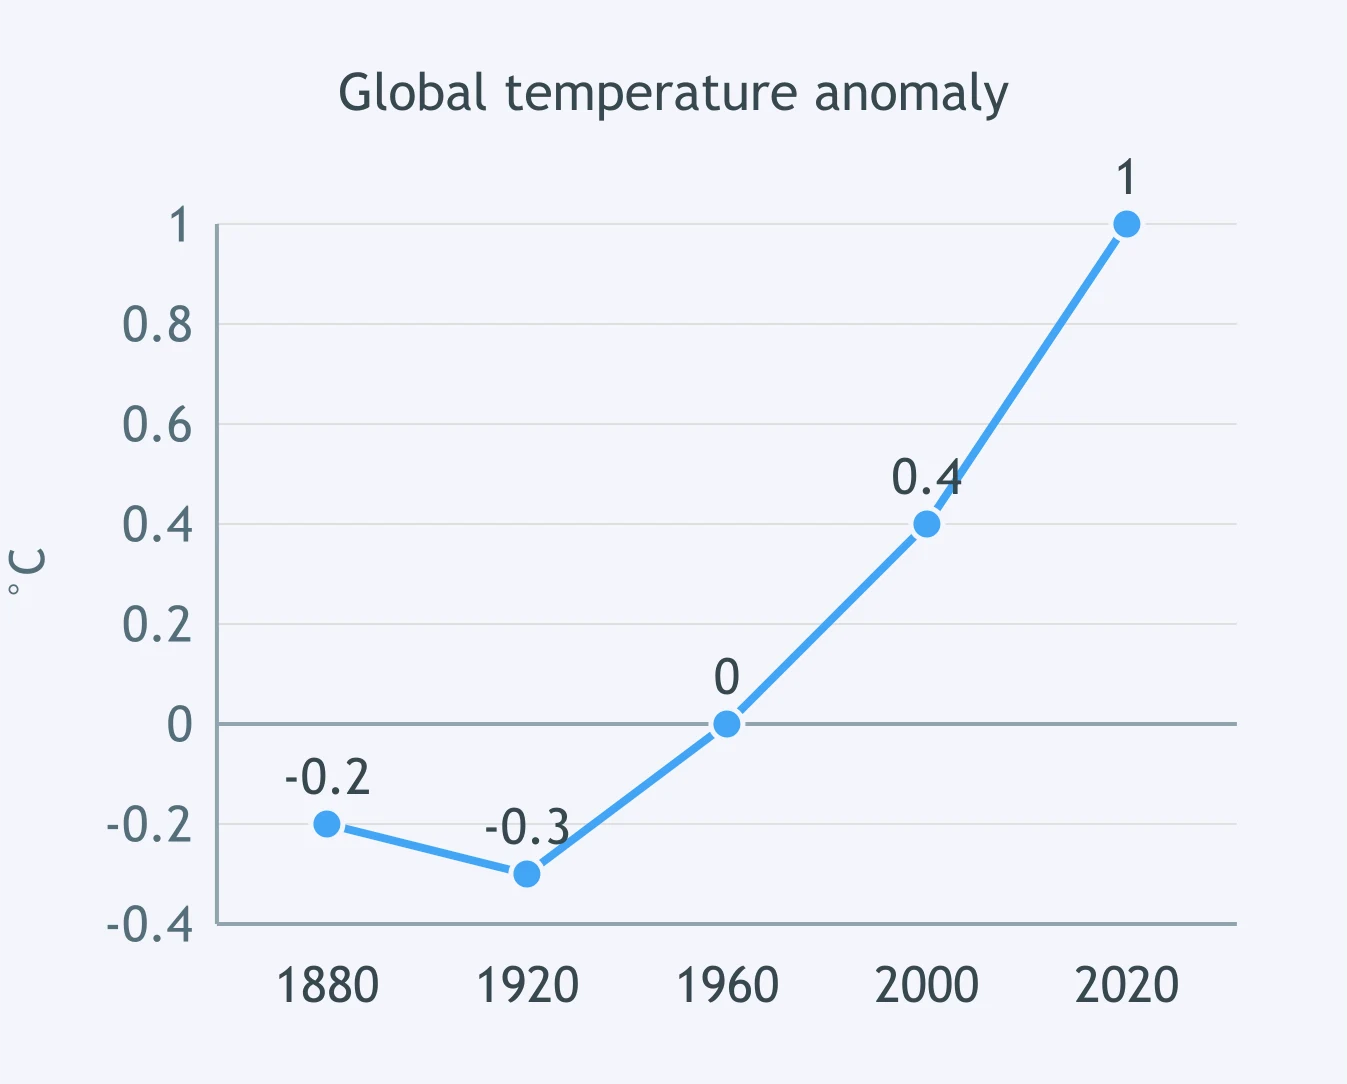
Use the global temperature anomaly graph. What conclusion is supported by the long-term pattern?
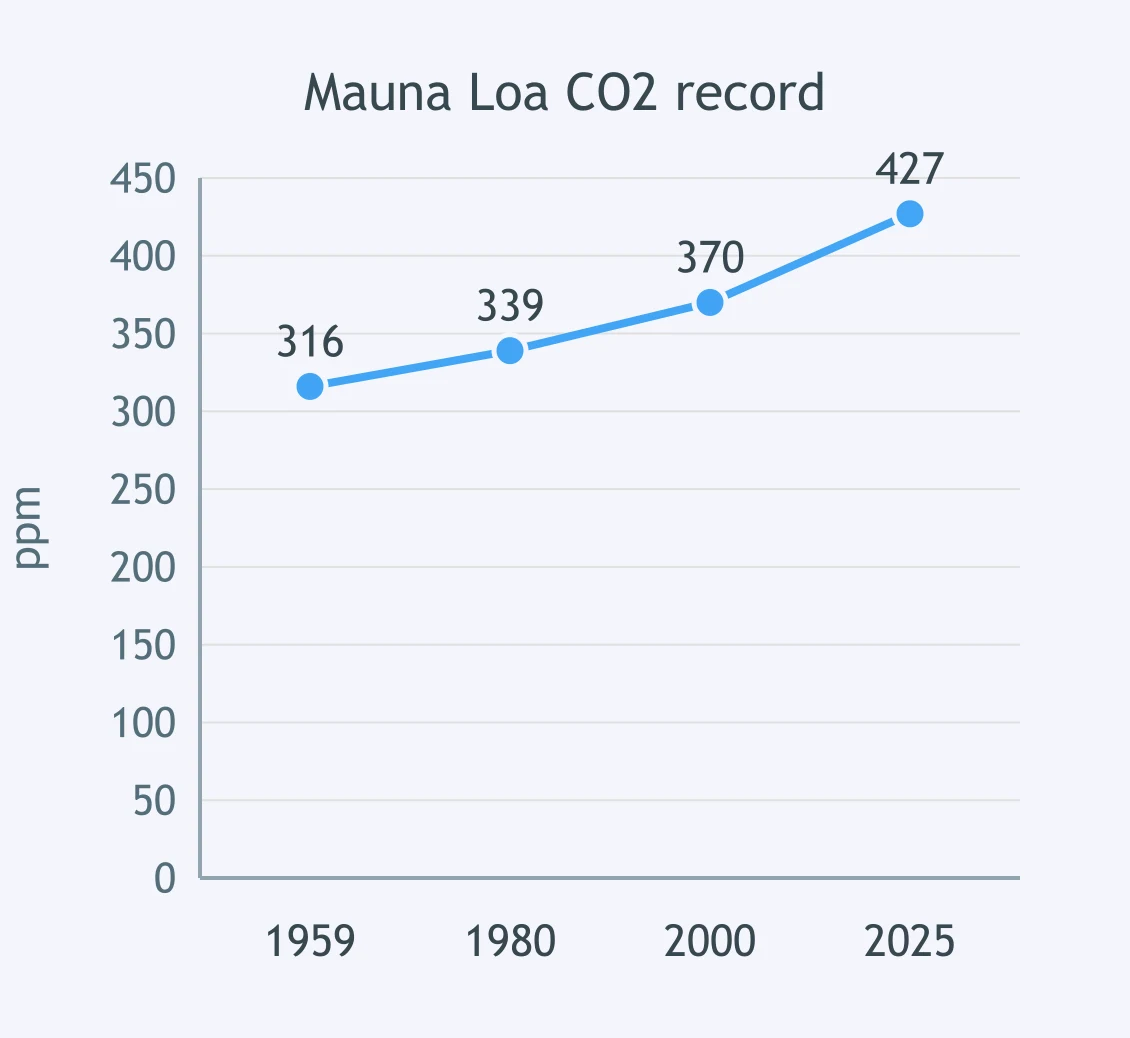
Use the Mauna Loa CO₂ graph. What does this record establish?
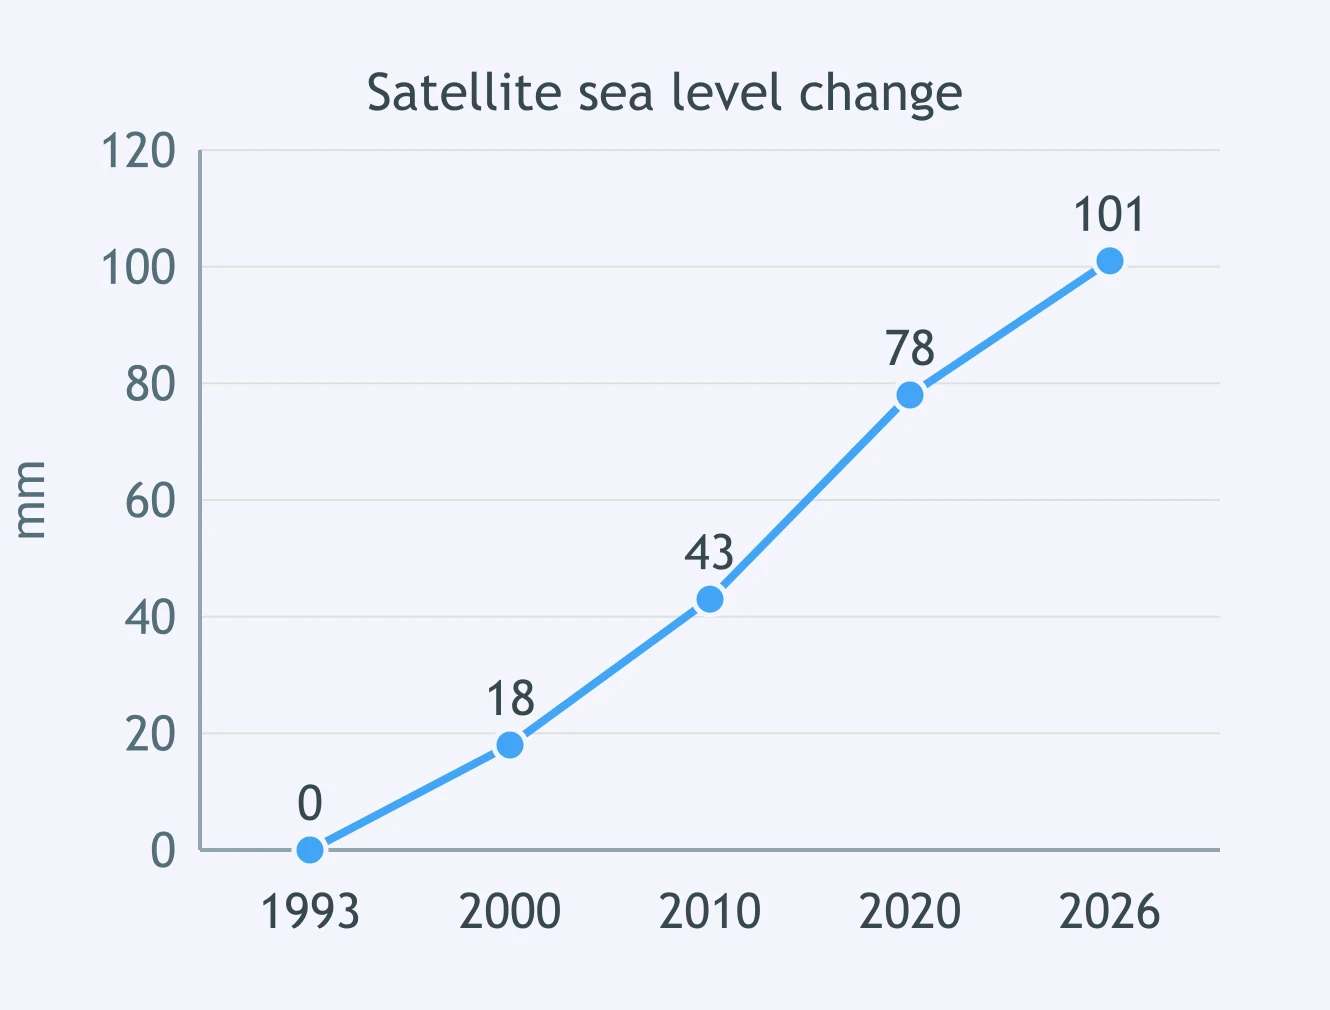
Use the satellite sea-level graph. What change is shown from 1993 to 2026?
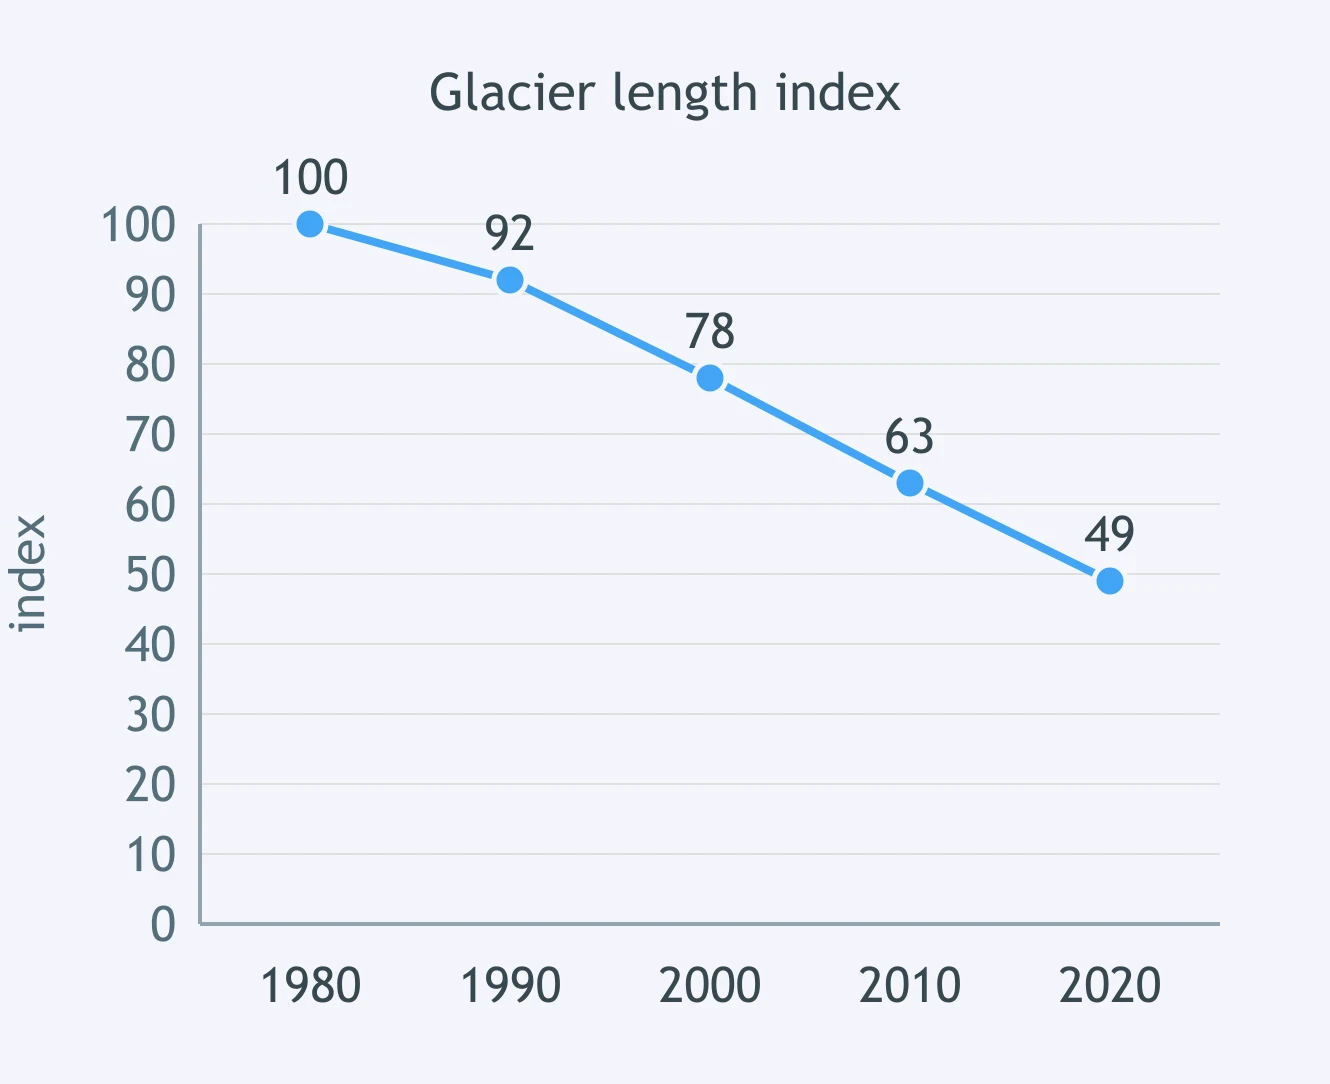
Use the glacier-length index graph. What present climate-change evidence does this record show?
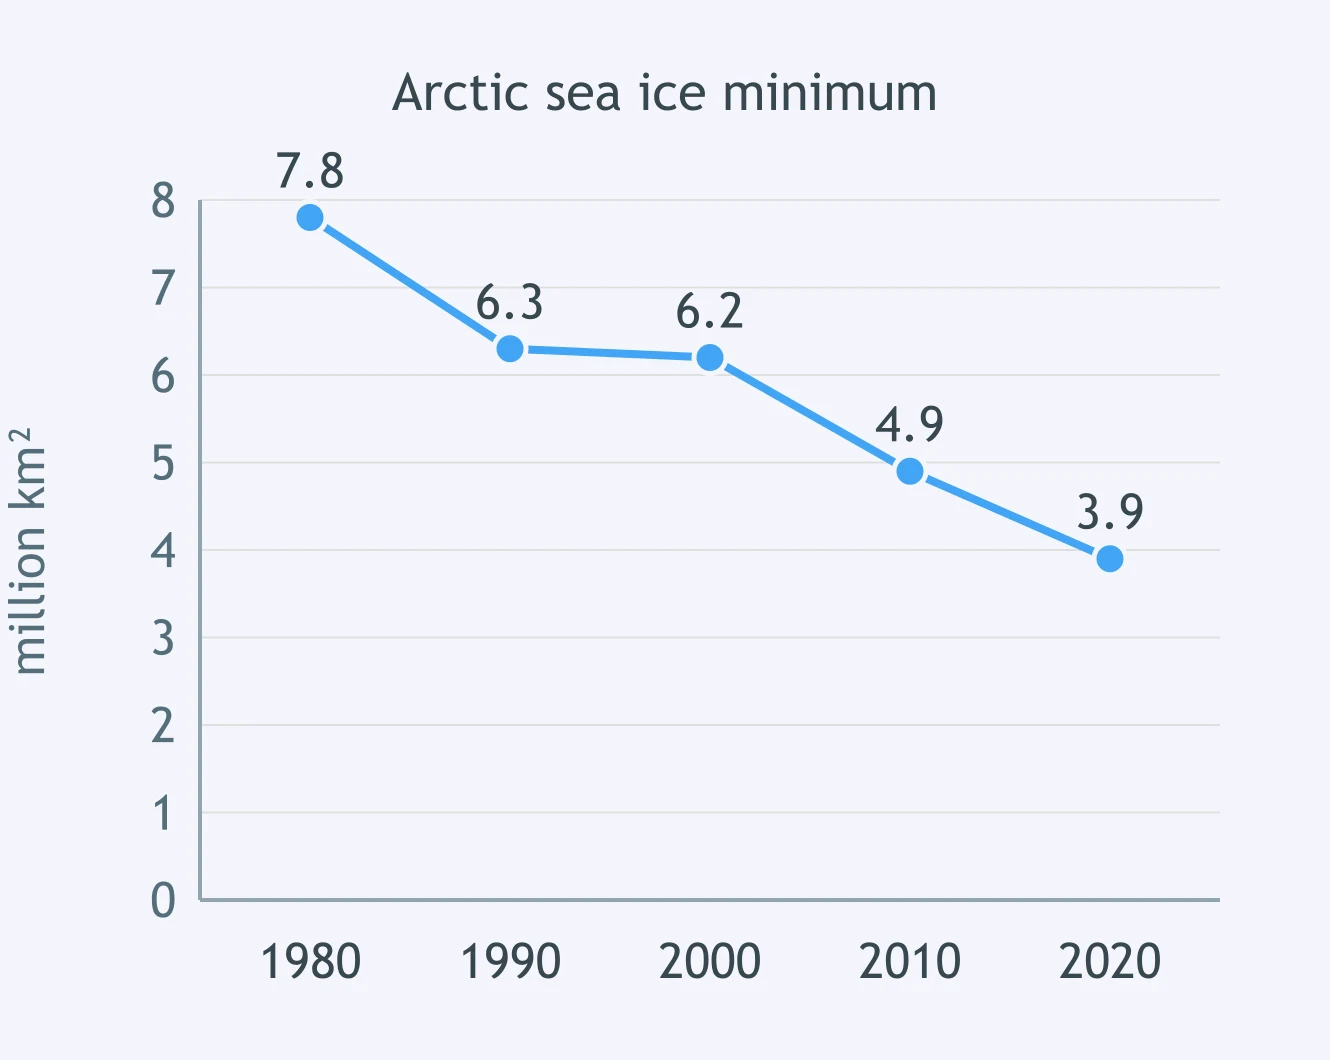
Use the Arctic sea-ice minimum graph. What does the long-term trend establish?
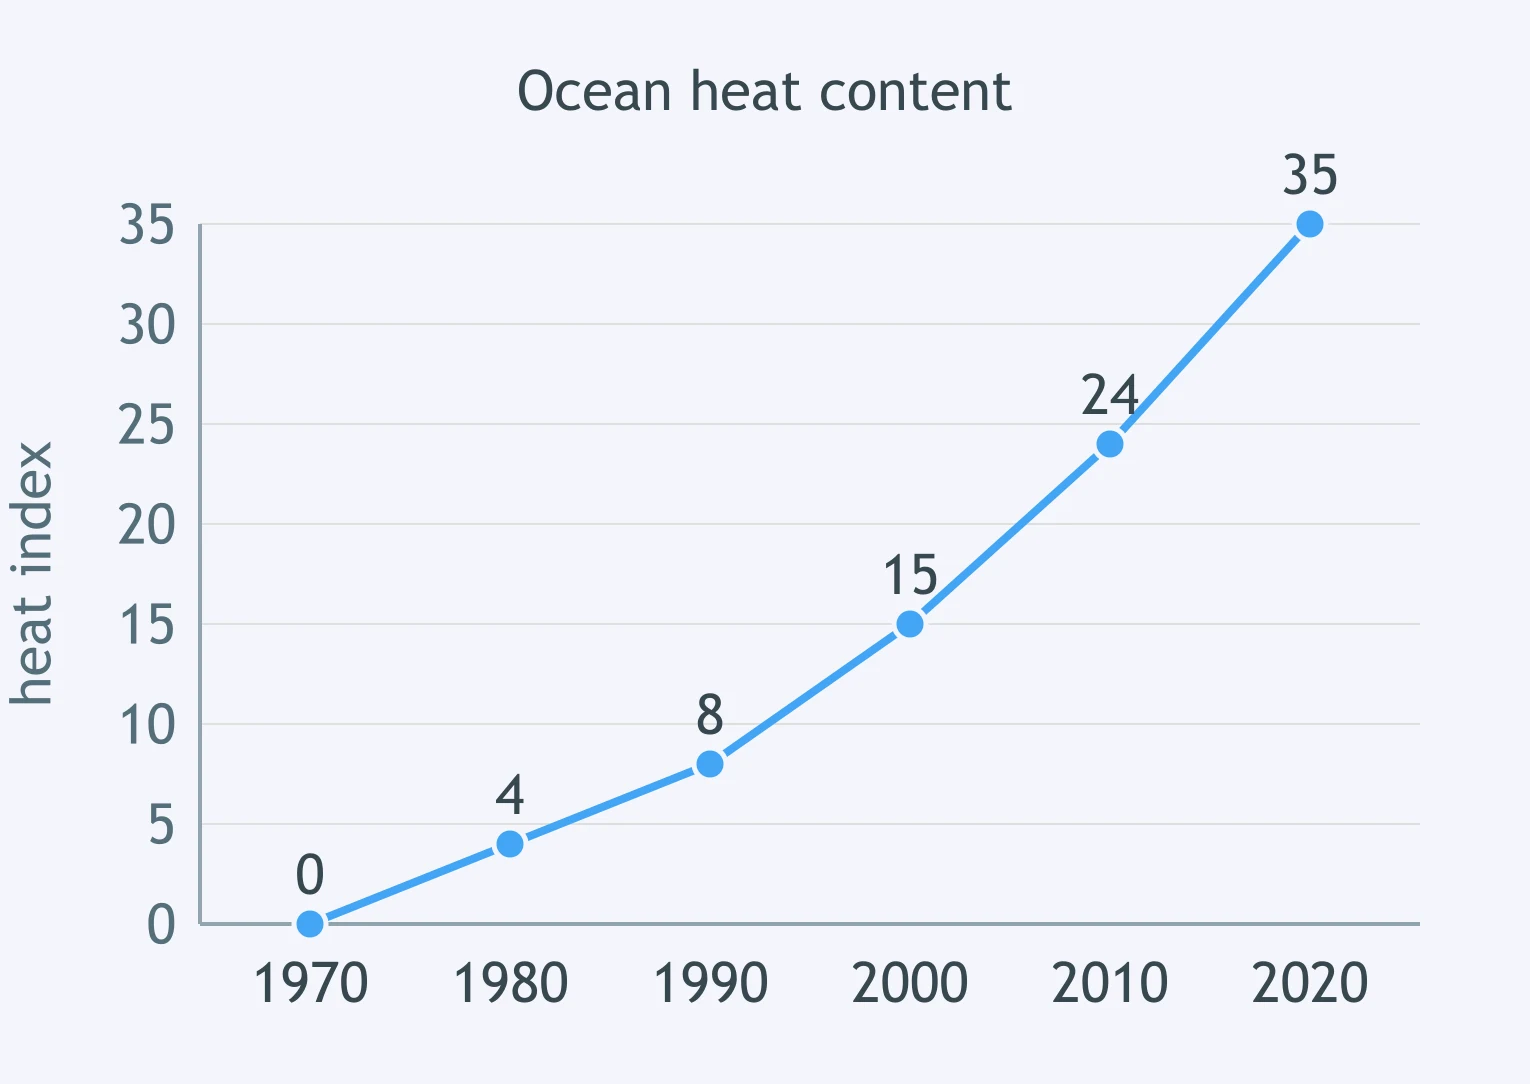
Use the ocean heat-content graph. What does that record establish about present climate change?
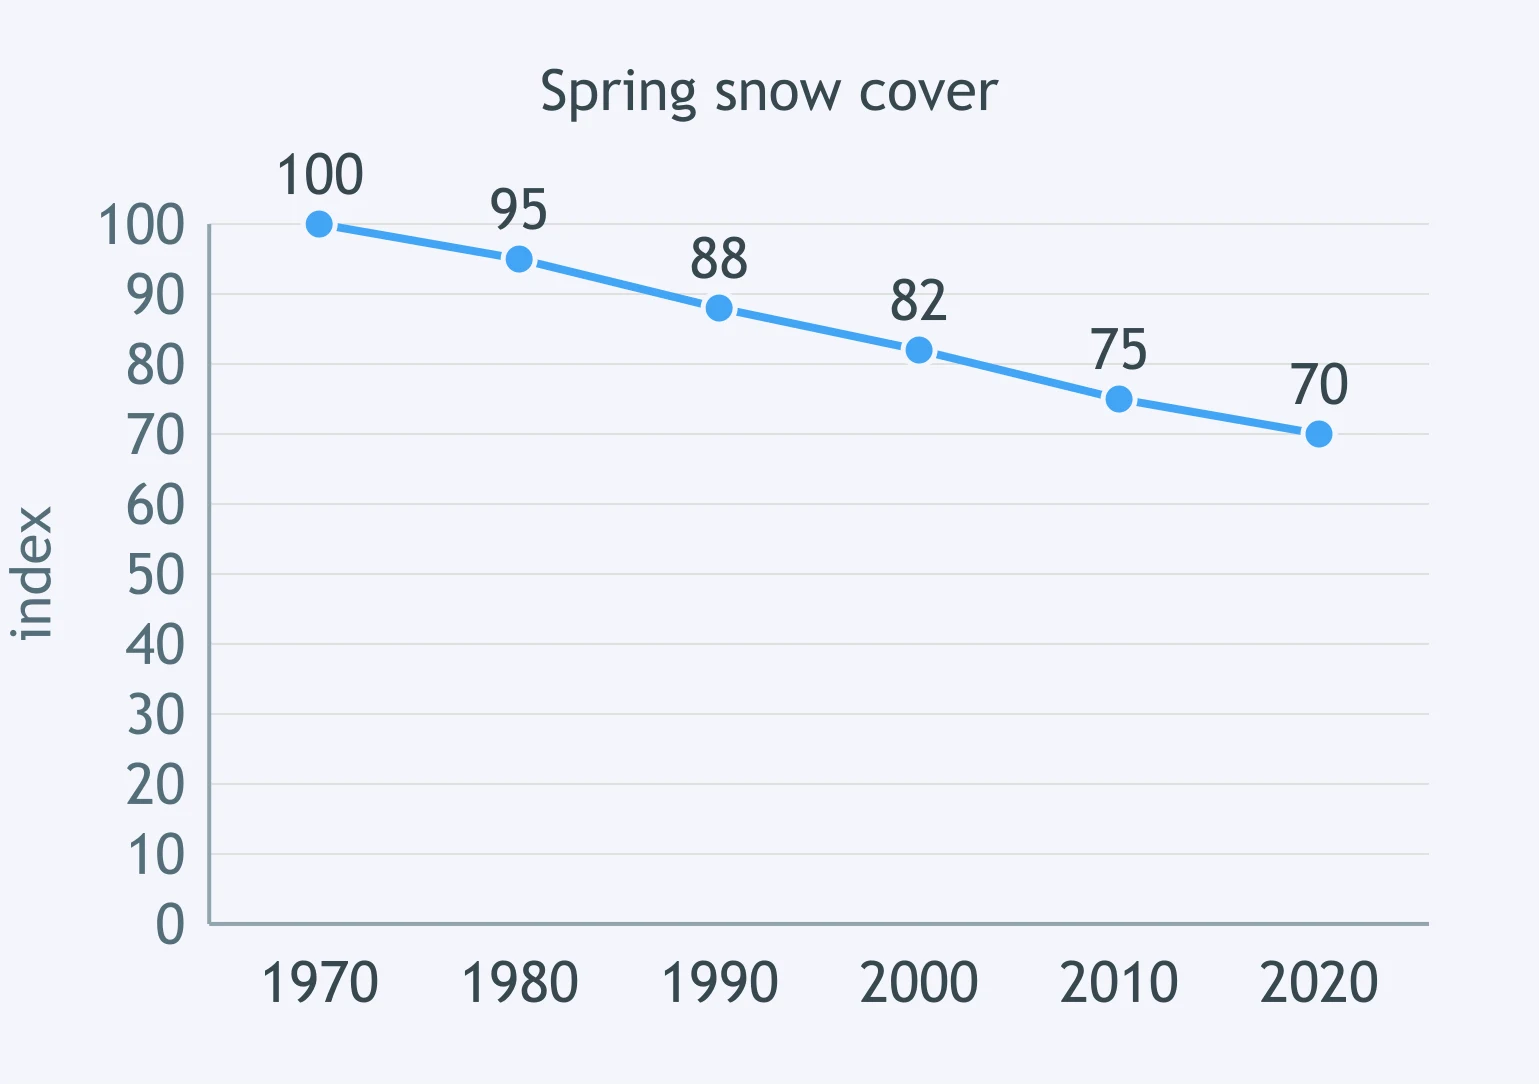
Use the Northern Hemisphere spring snow-cover graph. What does the record support?
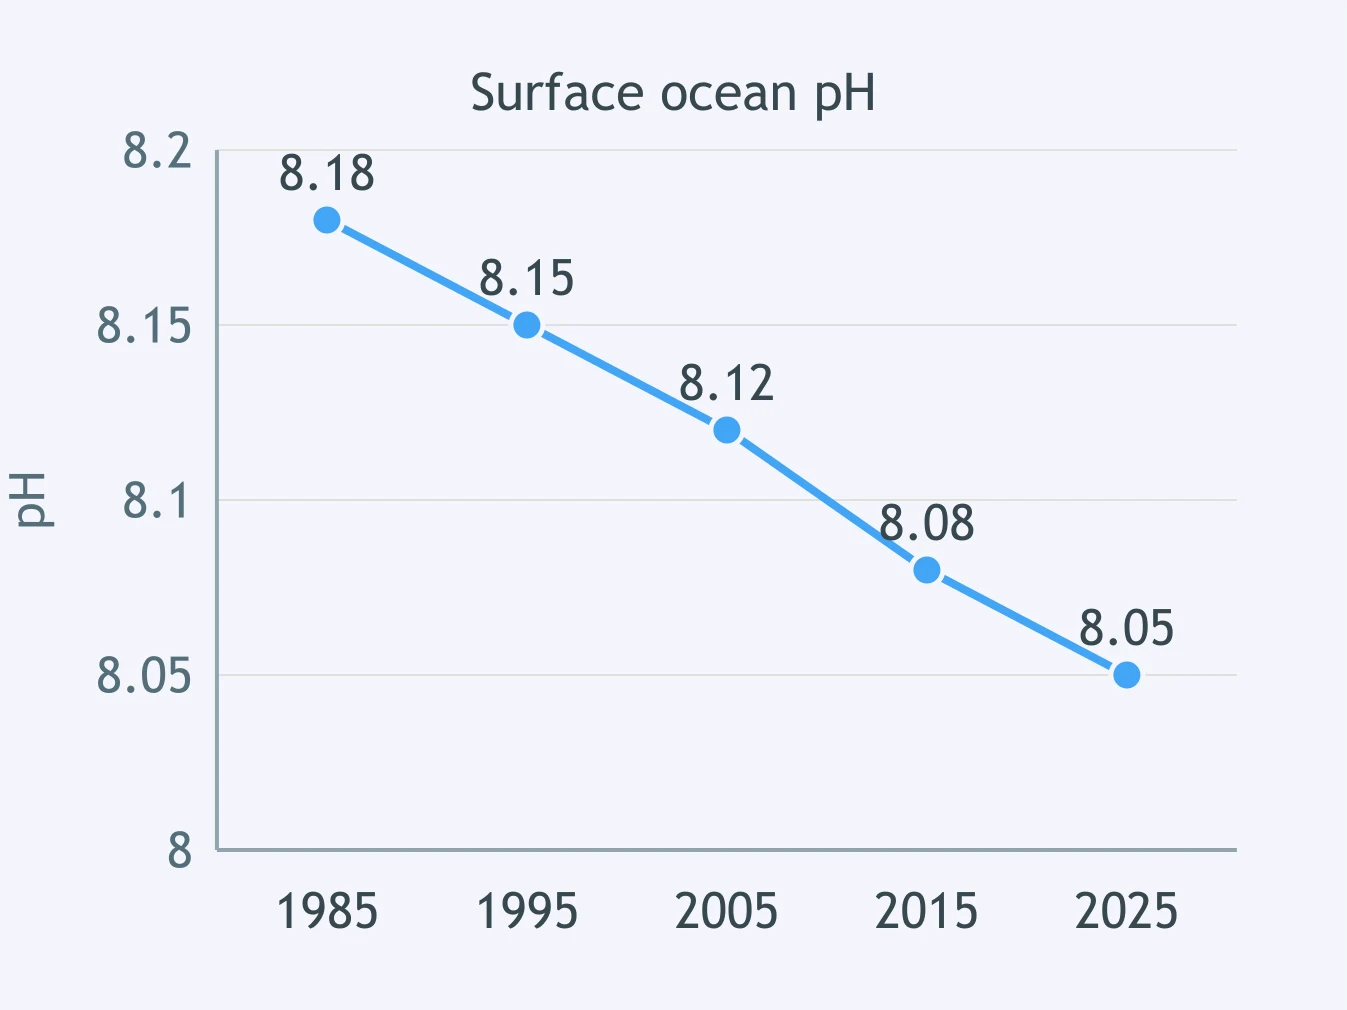
Use the surface-ocean pH graph. What present change does this record establish?
Satellite records show the troposphere warming while the lower stratosphere cools. What does that vertical pattern most strongly support?
Use Station I's climatograph. What is the annual temperature range?
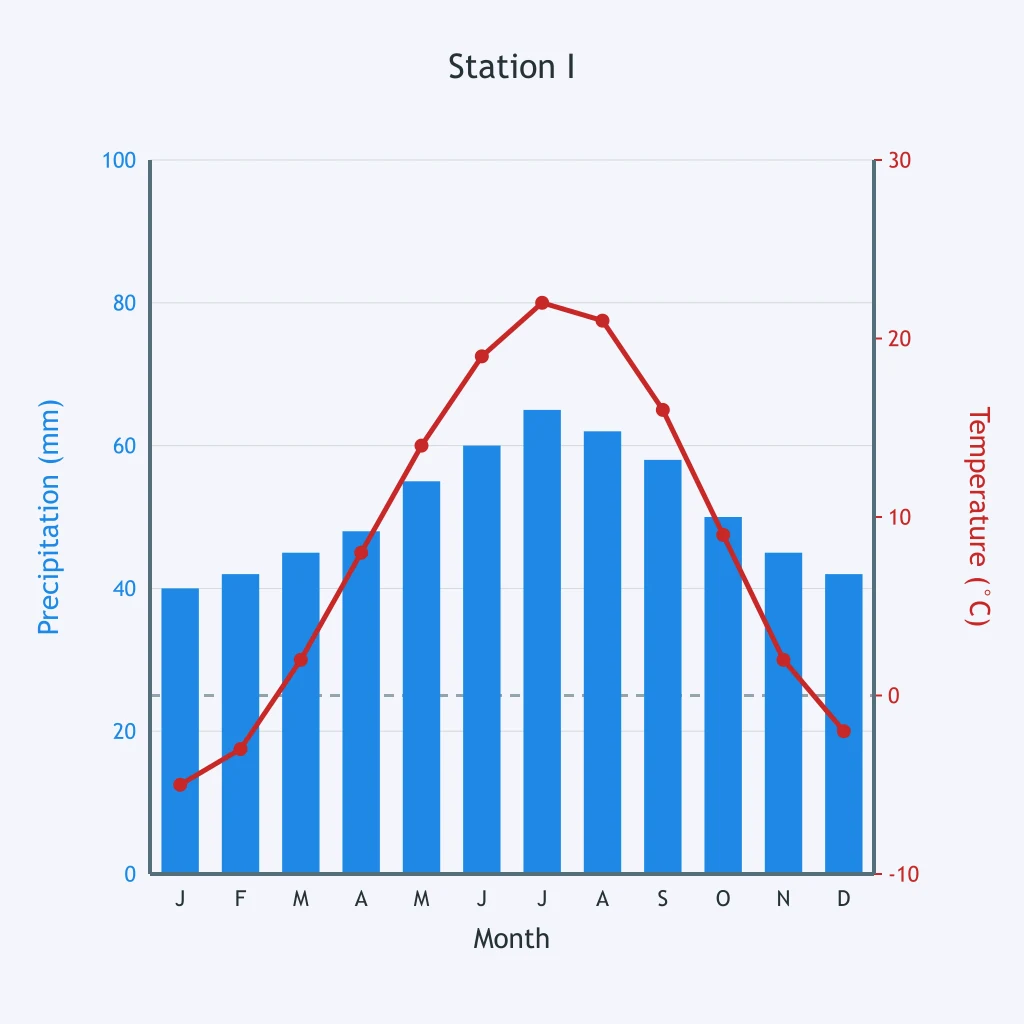
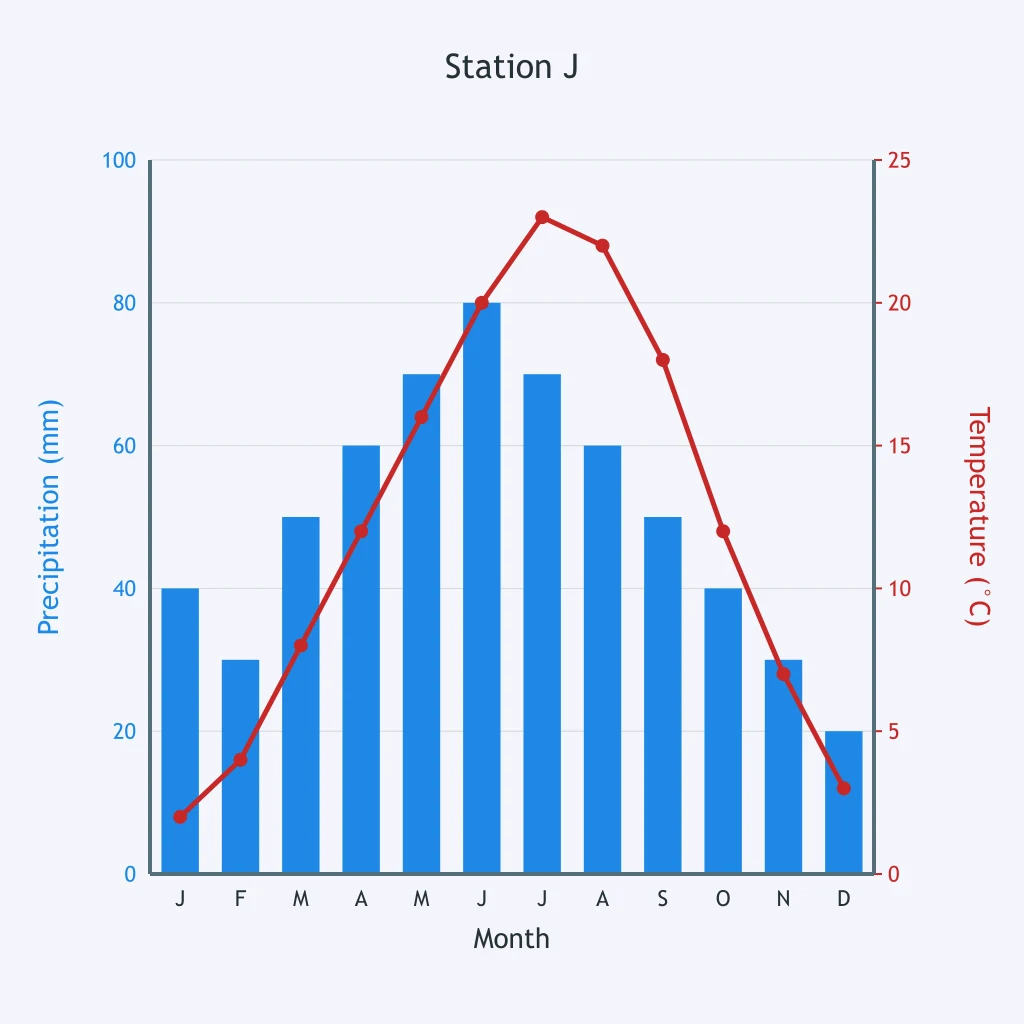
Use Station J's climatograph and add the monthly precipitation bars. What is the annual precipitation total?
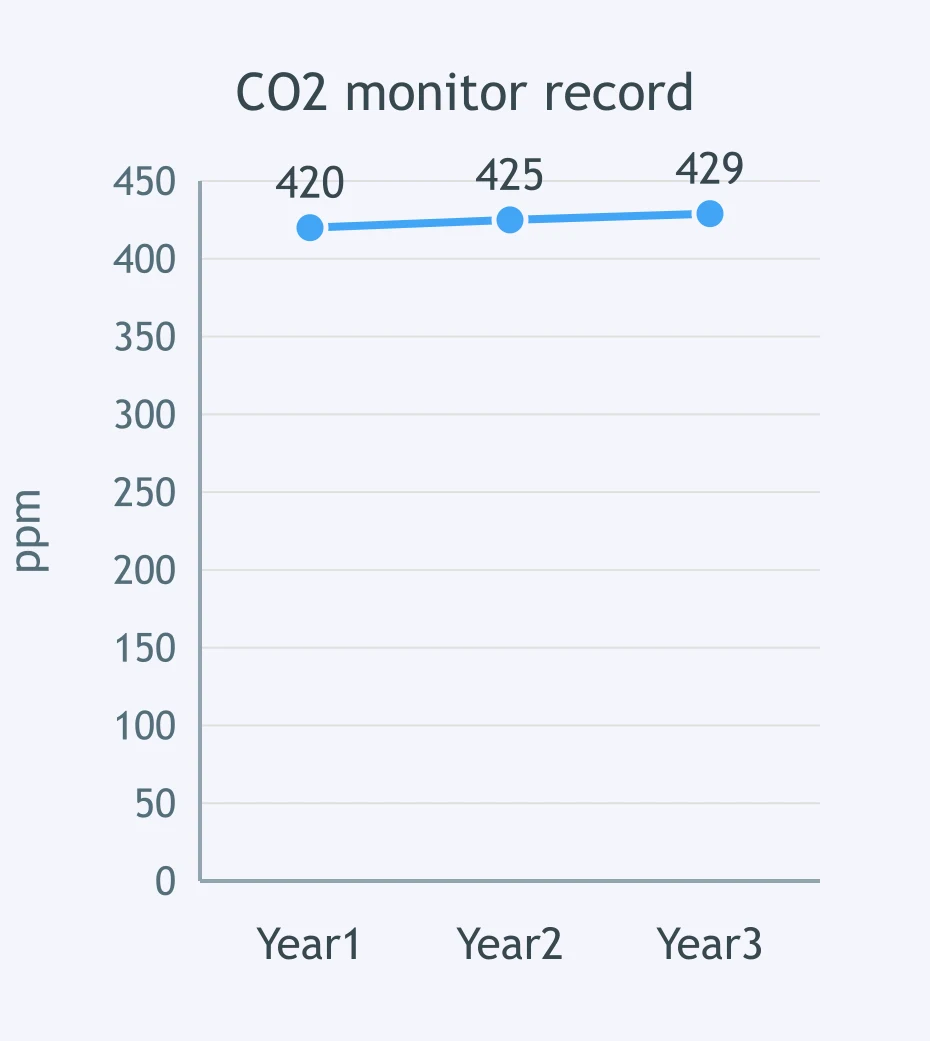
A CO₂ monitor graph is shown with values labeled in ppm. What is the change from Year 1 to Year 3?
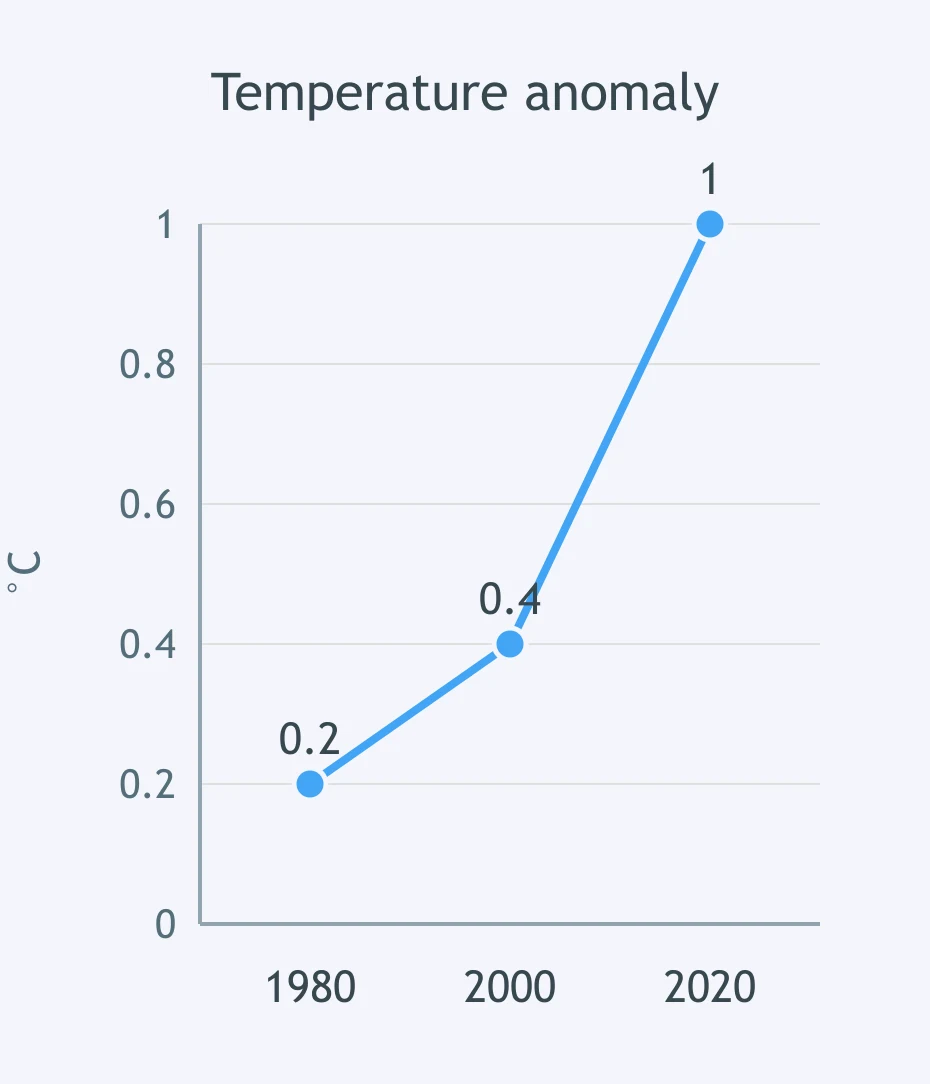
A temperature-anomaly graph is shown with values labeled in °C. What average rate of change does it show from the first year to the last year?
Averaged over a whole year, which latitude belt receives the greatest insolation per square meter?
Why do polar belts receive less annual insolation per square meter than the tropics?
At about 30° N and 30° S, descending air in subtropical highs helps form many deserts. What happens to air as it sinks?
Earth's climate belts shift north and south during the year mainly because of what pattern?
Crack the passcode before the zombies get in.
Answer, then swat bugs for bonus points.
Race through questions at your own speed.
Same question on every screen. Fastest wins.

Pick a tile, answer, hit bonuses and steals.
Fossil Fuels
20 questions