Loading
by BlastRoom
Practice reading Earth Science graphs and tables; sources used: https://climatekids.nasa.gov/graphs/ and https://www.usgs.gov/tools/usgs-data-grapher.
#earth_space_science

30 questions
One question set, multiple game modes. Tap any game to see it in action. Not sure which to pick?
Answer to place stones and capture territory.
Outrun the snow together.
Earn blasts, then hunt the other team.
Answer to earn energy, then climb.

The class blasts through walls together.
Bid on mystery lots. Most money wins.
Sell tours. Nice, standard, or a total scam.

Answer, restock, and serve the rush.
More correct answers pulls the rope your way.
Answer, then shoot down the alien wave.
Answer, then tap to leap the frozen ridge.
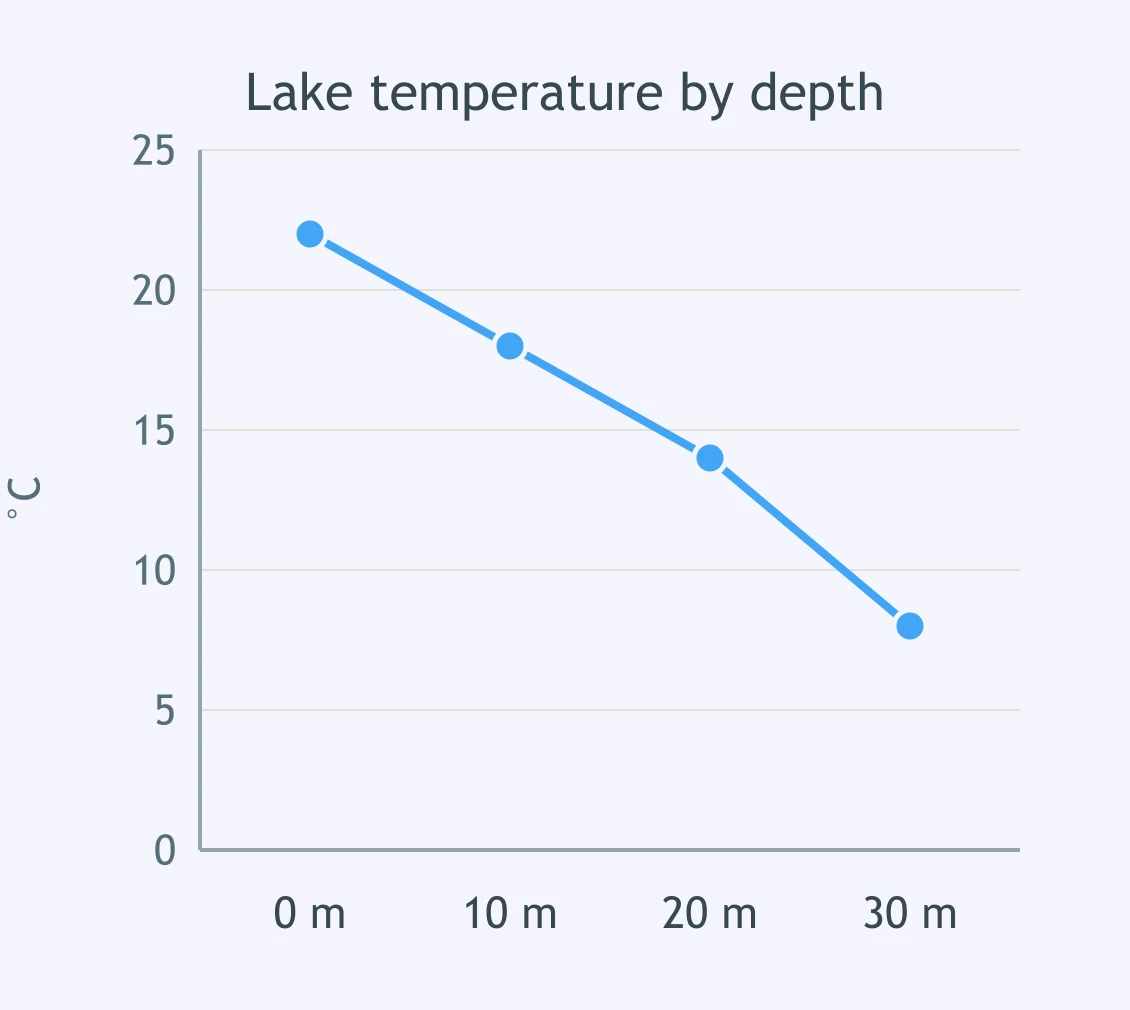
Use the line graph of lake temperature by depth. What is the water temperature at 20 m depth?
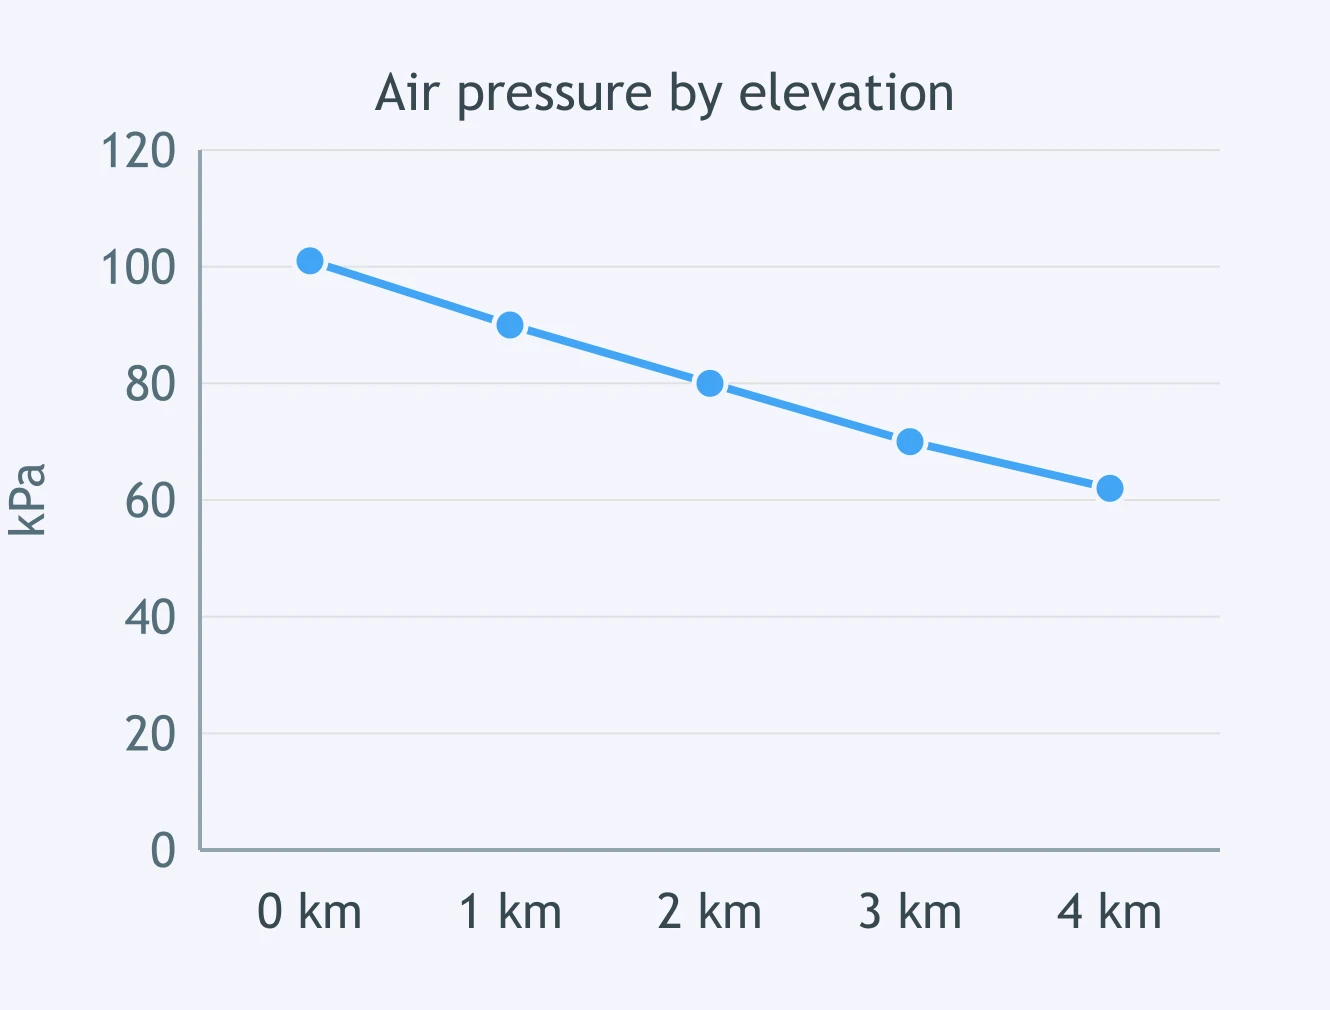
The line graph shows air pressure at different elevations. What pressure is plotted at 3 km?
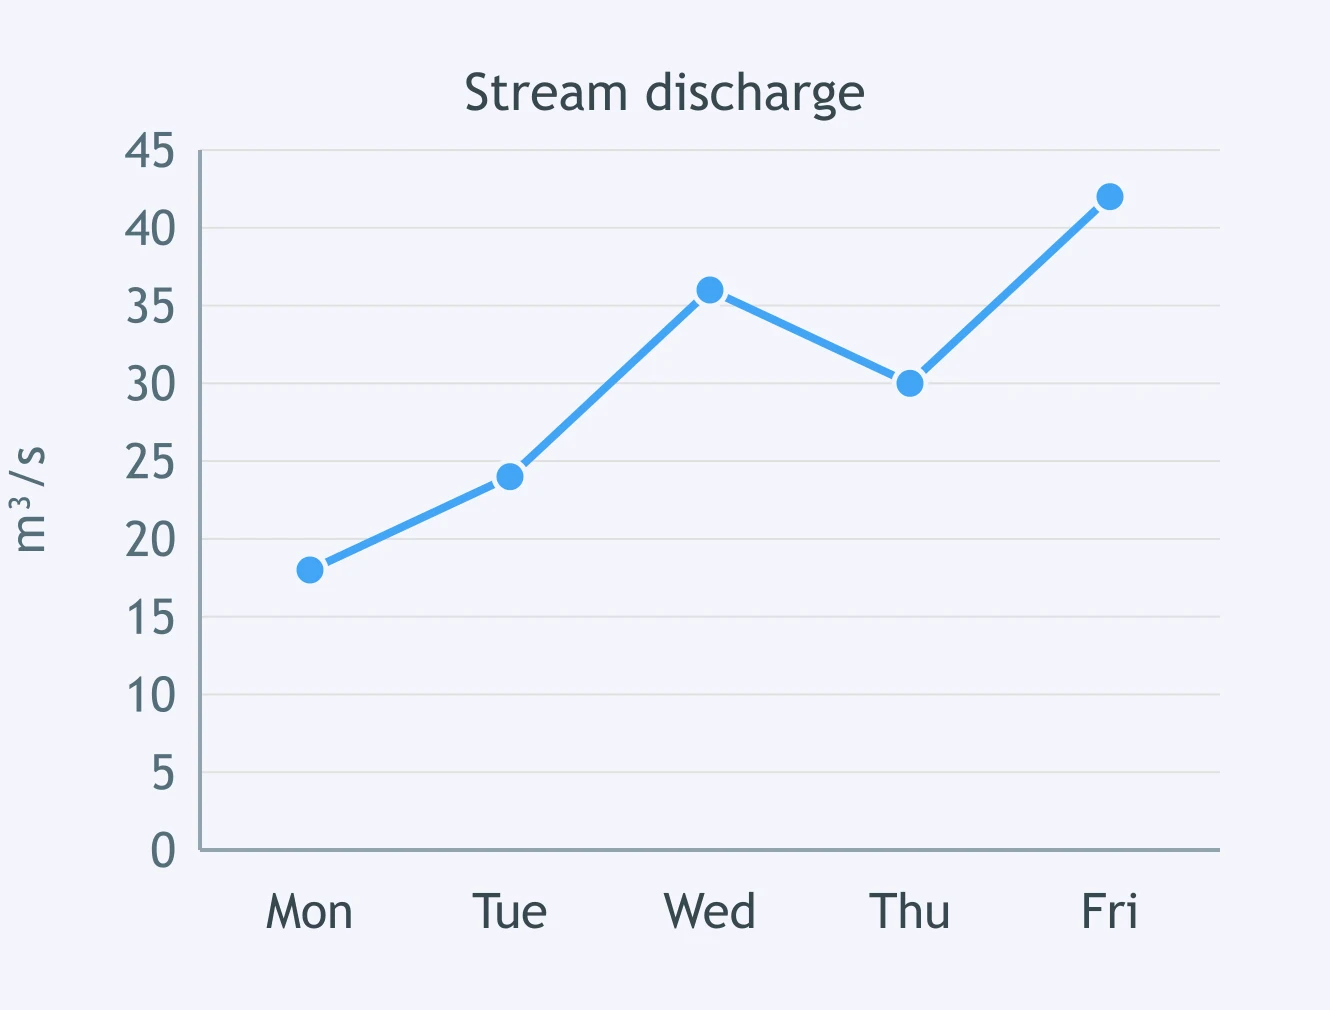
On the stream discharge line graph, what discharge is plotted for Wednesday?
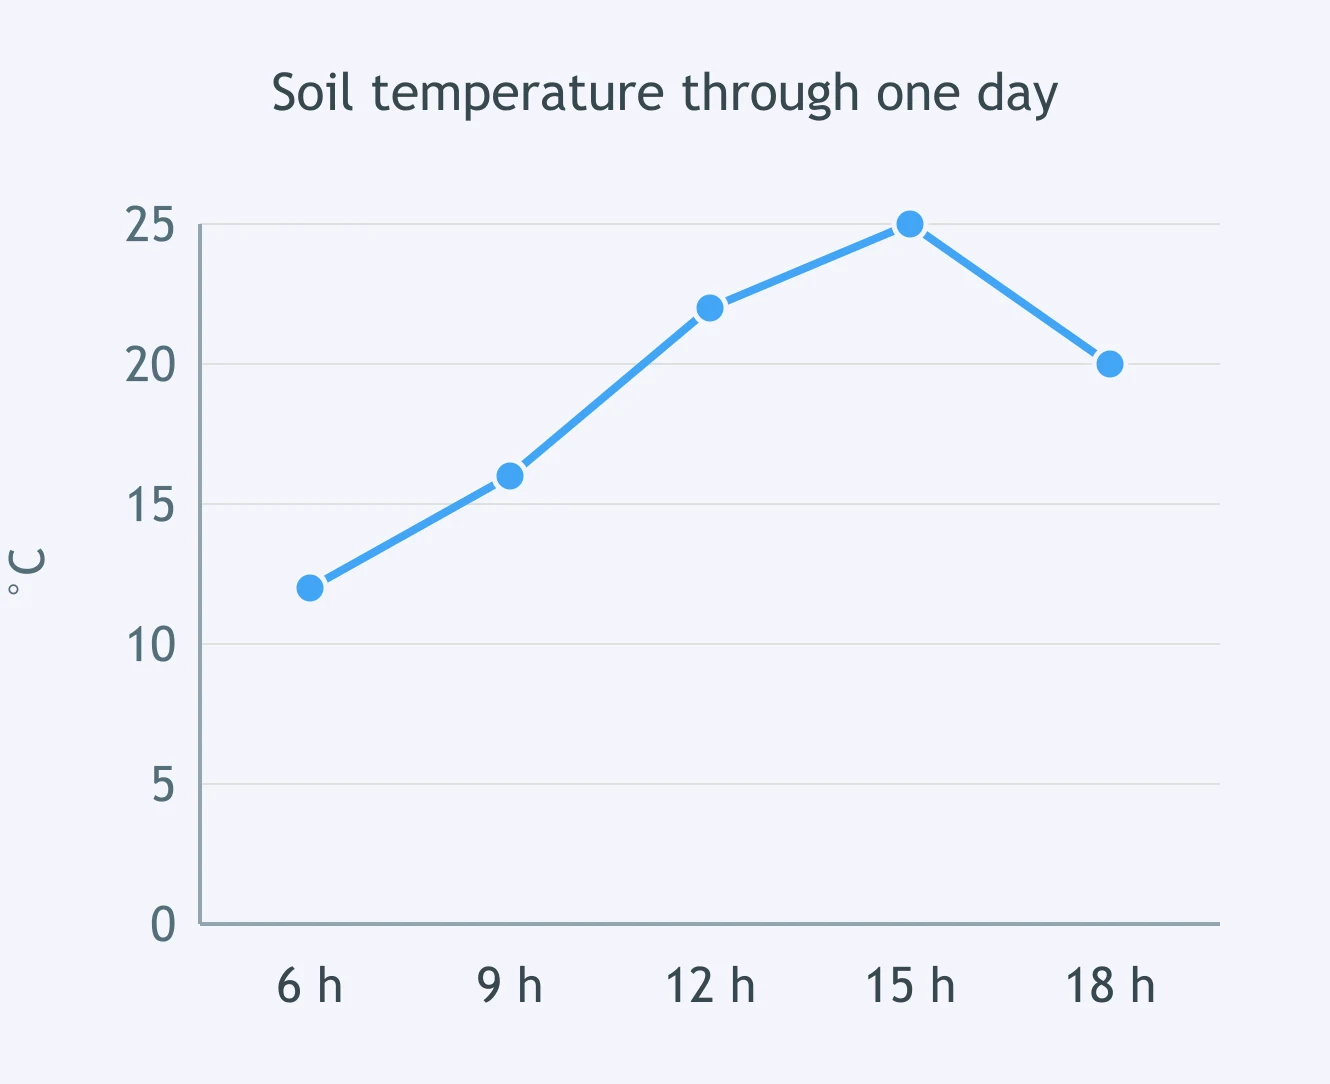
Read the soil temperature line graph. What temperature is plotted at 15 h?
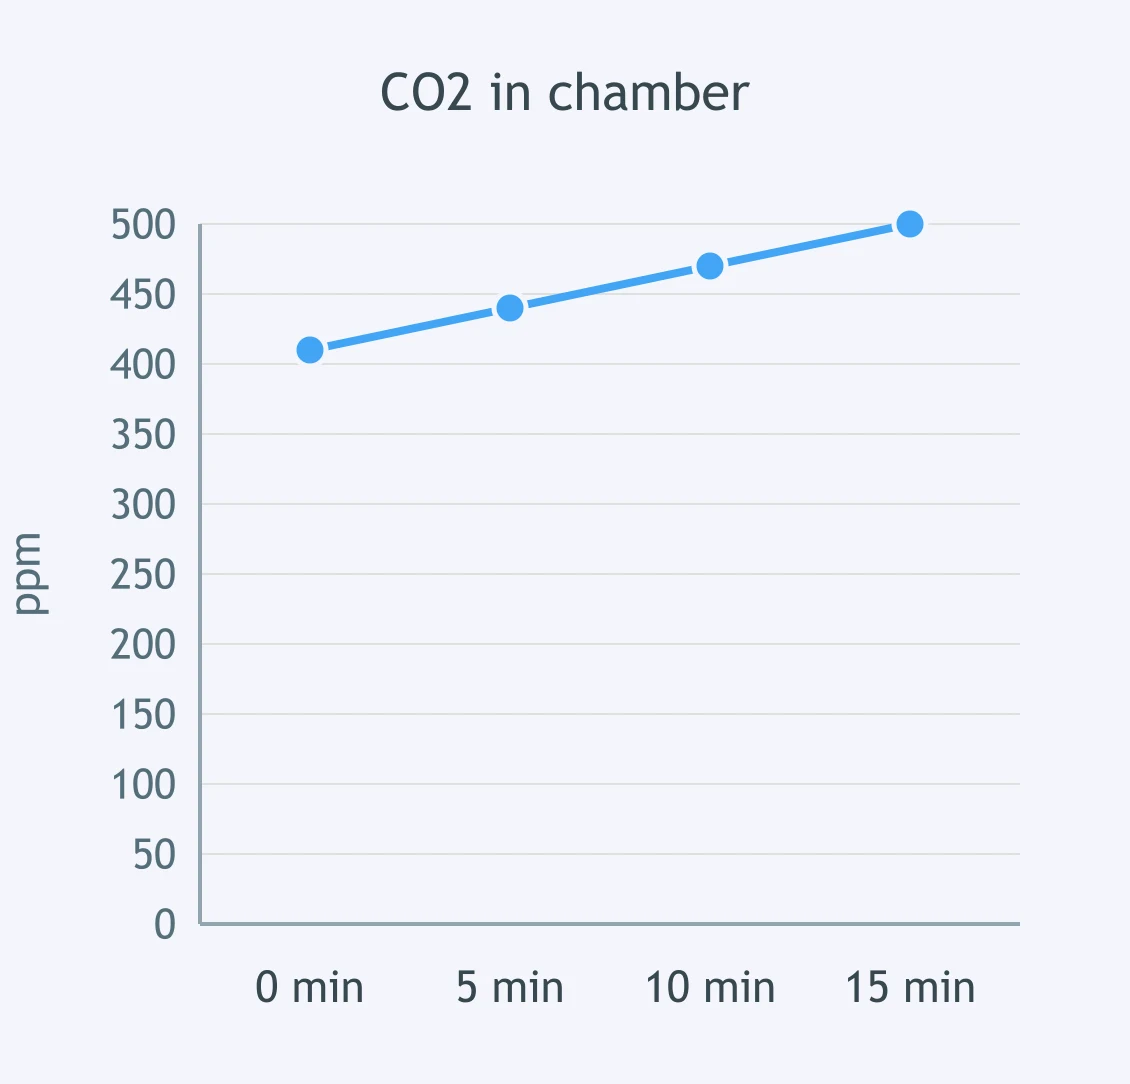
Use the line graph for CO₂ in a sealed soil-respiration chamber. What concentration is plotted at 10 min?
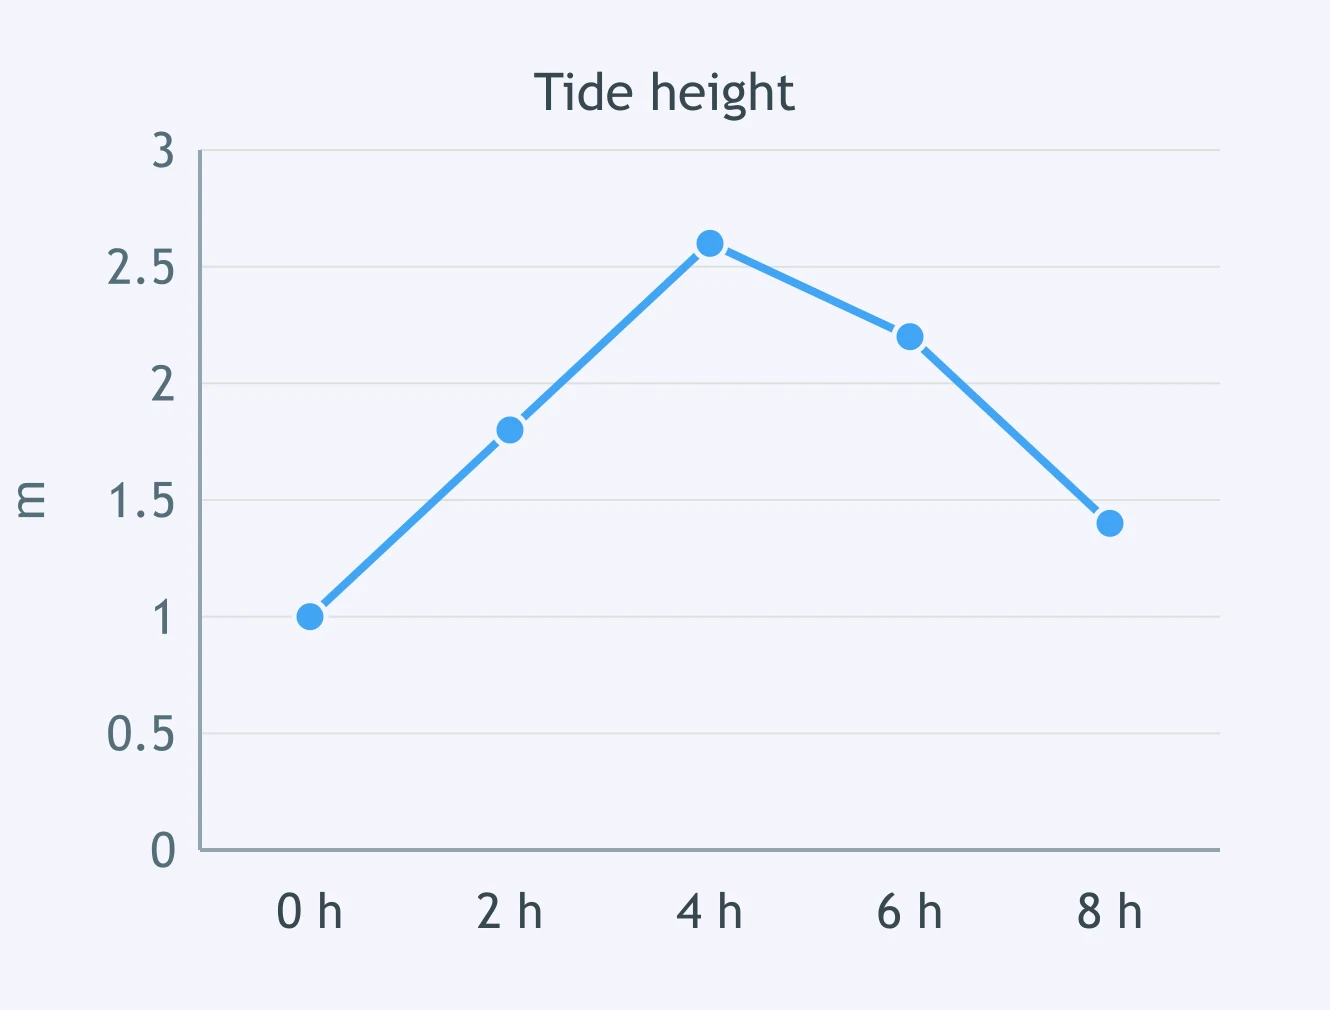
The tide-height line graph shows water level through the morning. What tide height is plotted at hour 4?
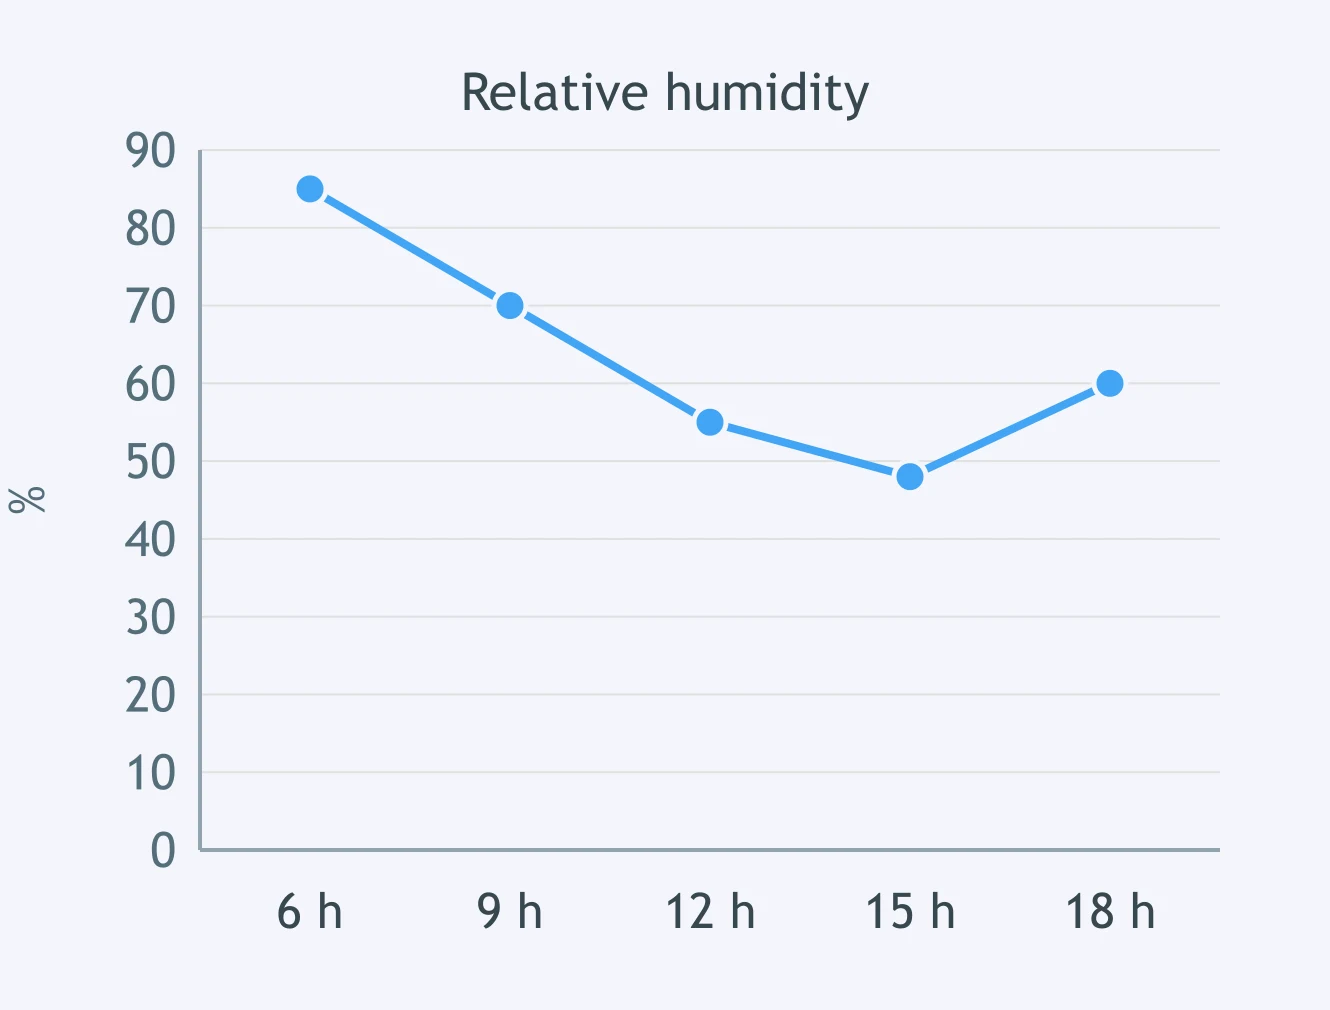
Use the relative humidity line graph. What humidity is plotted at 15 h?
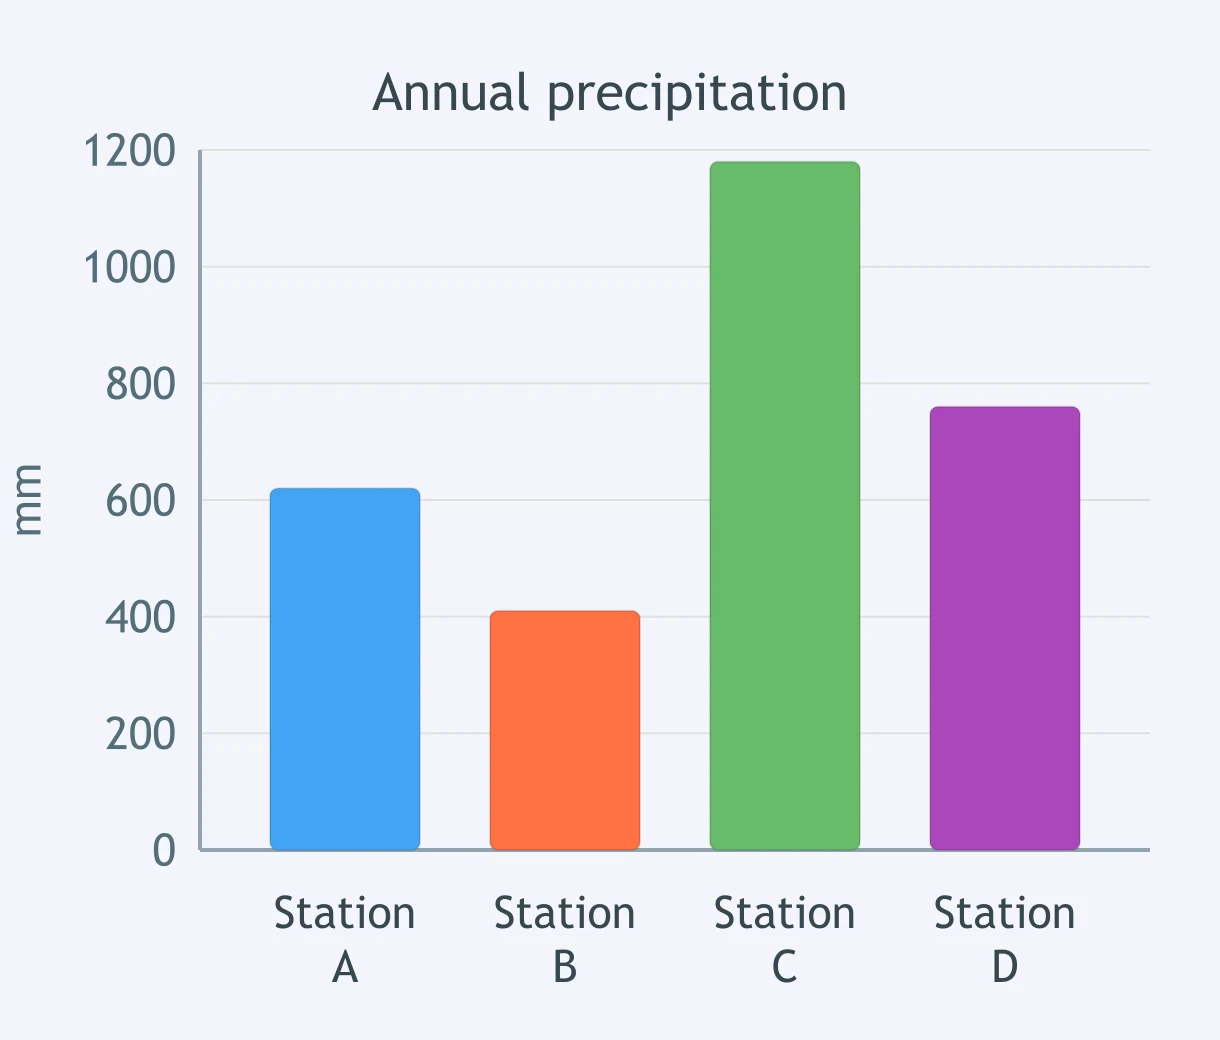
Use the precipitation bar graph. Which comparison between stations is supported by the bars?
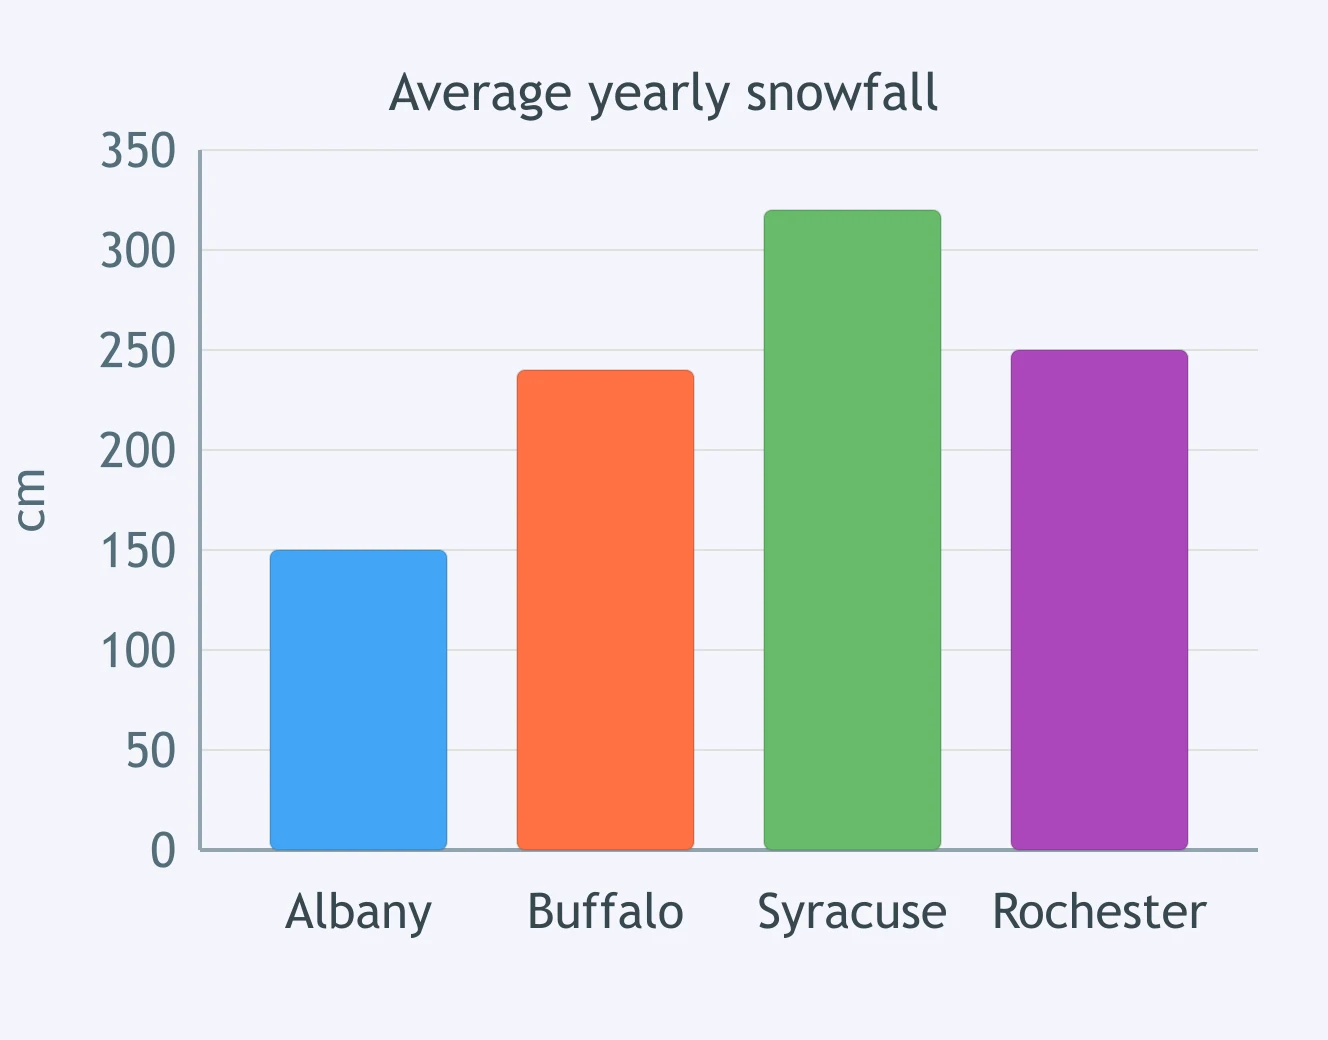
The snowfall bar graph compares four cities. Which statement is supported by the bars?
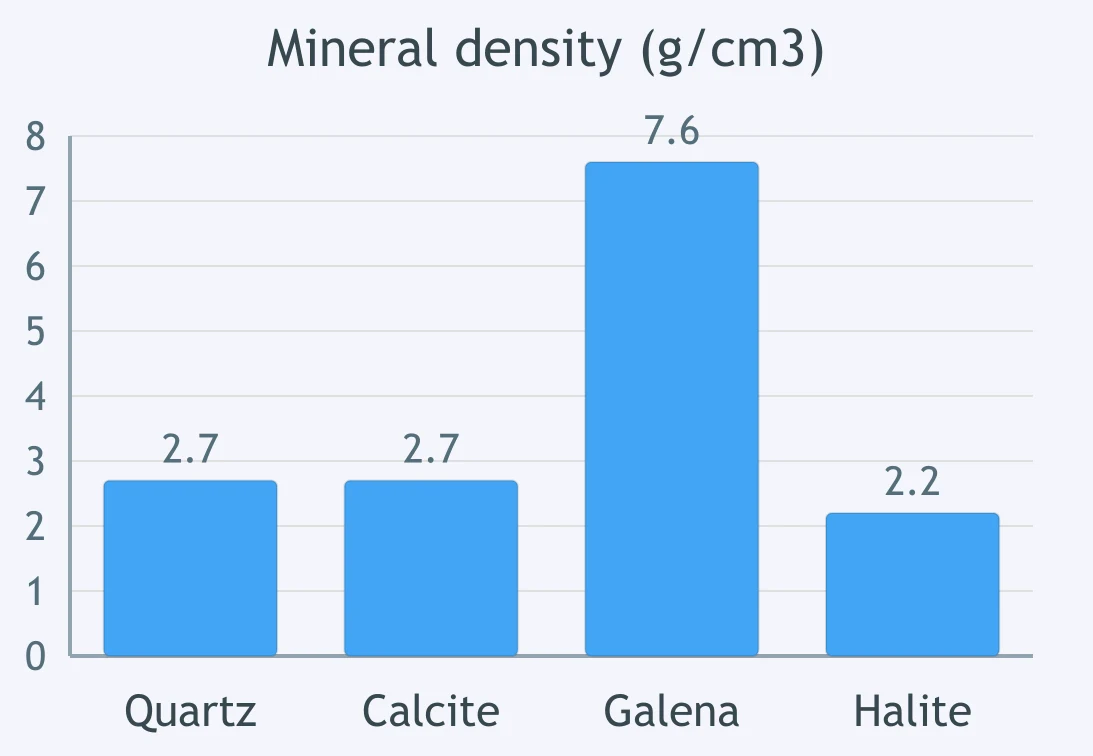
The mineral-density bar graph compares four samples. Which comparison is accurate?
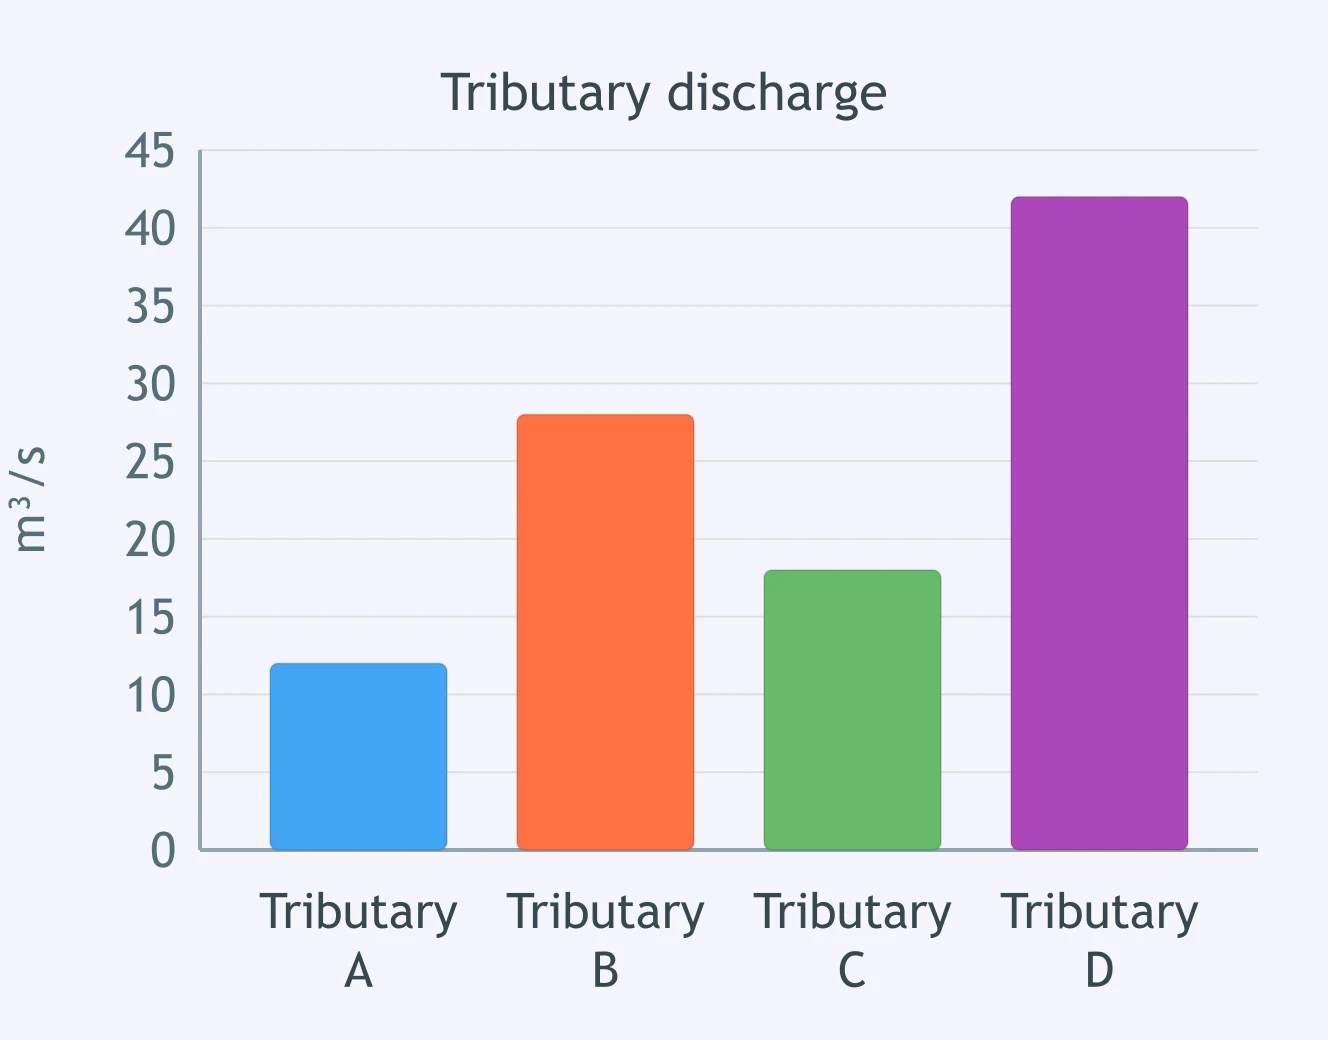
Use the tributary discharge bar graph. Which comparison is supported by the data?
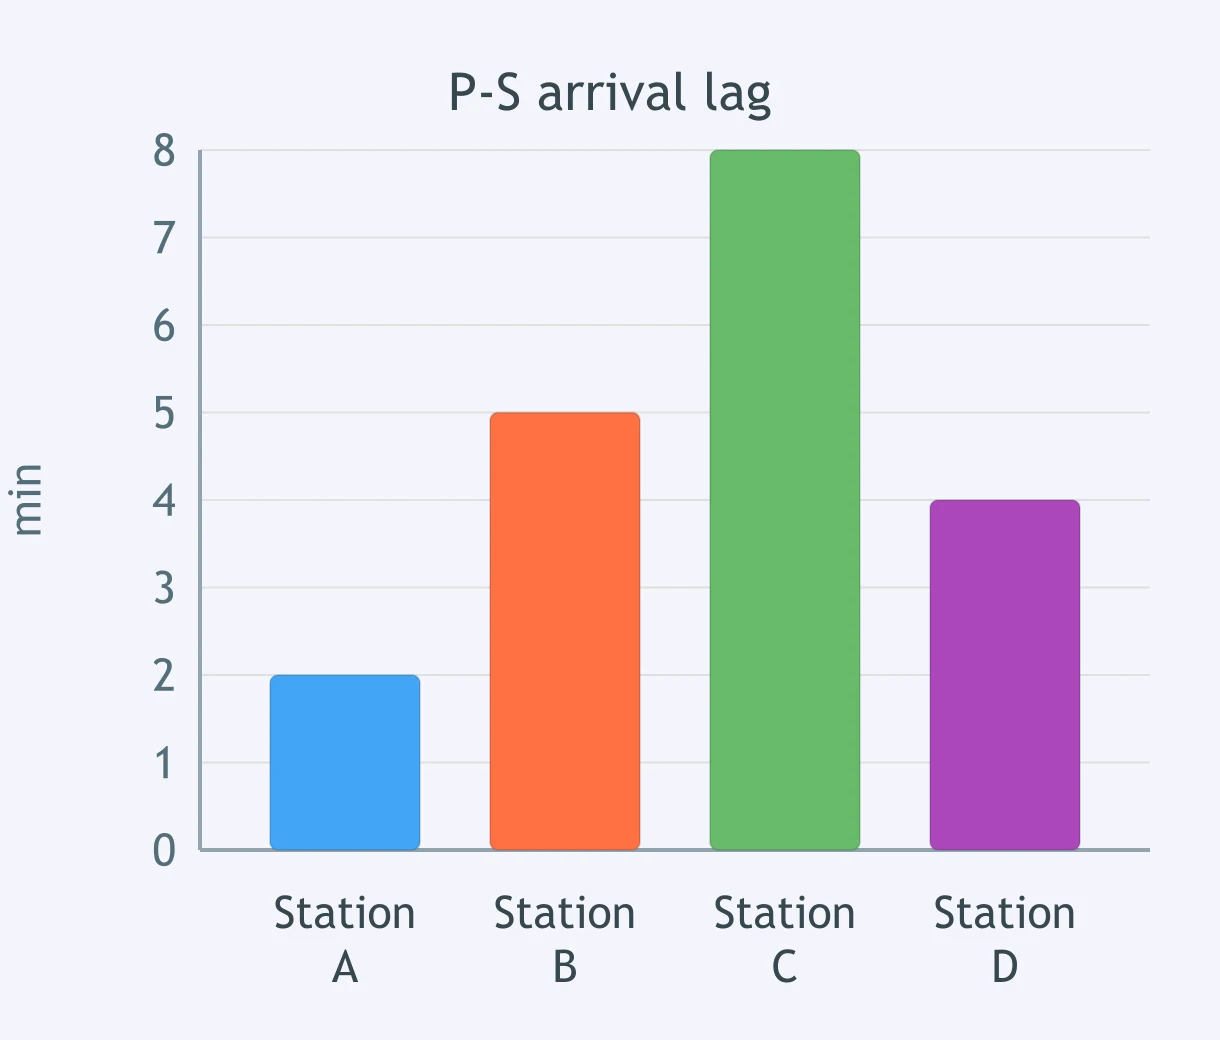
The P-S arrival lag bar graph compares four seismograph stations. Which station is farthest from the epicenter?
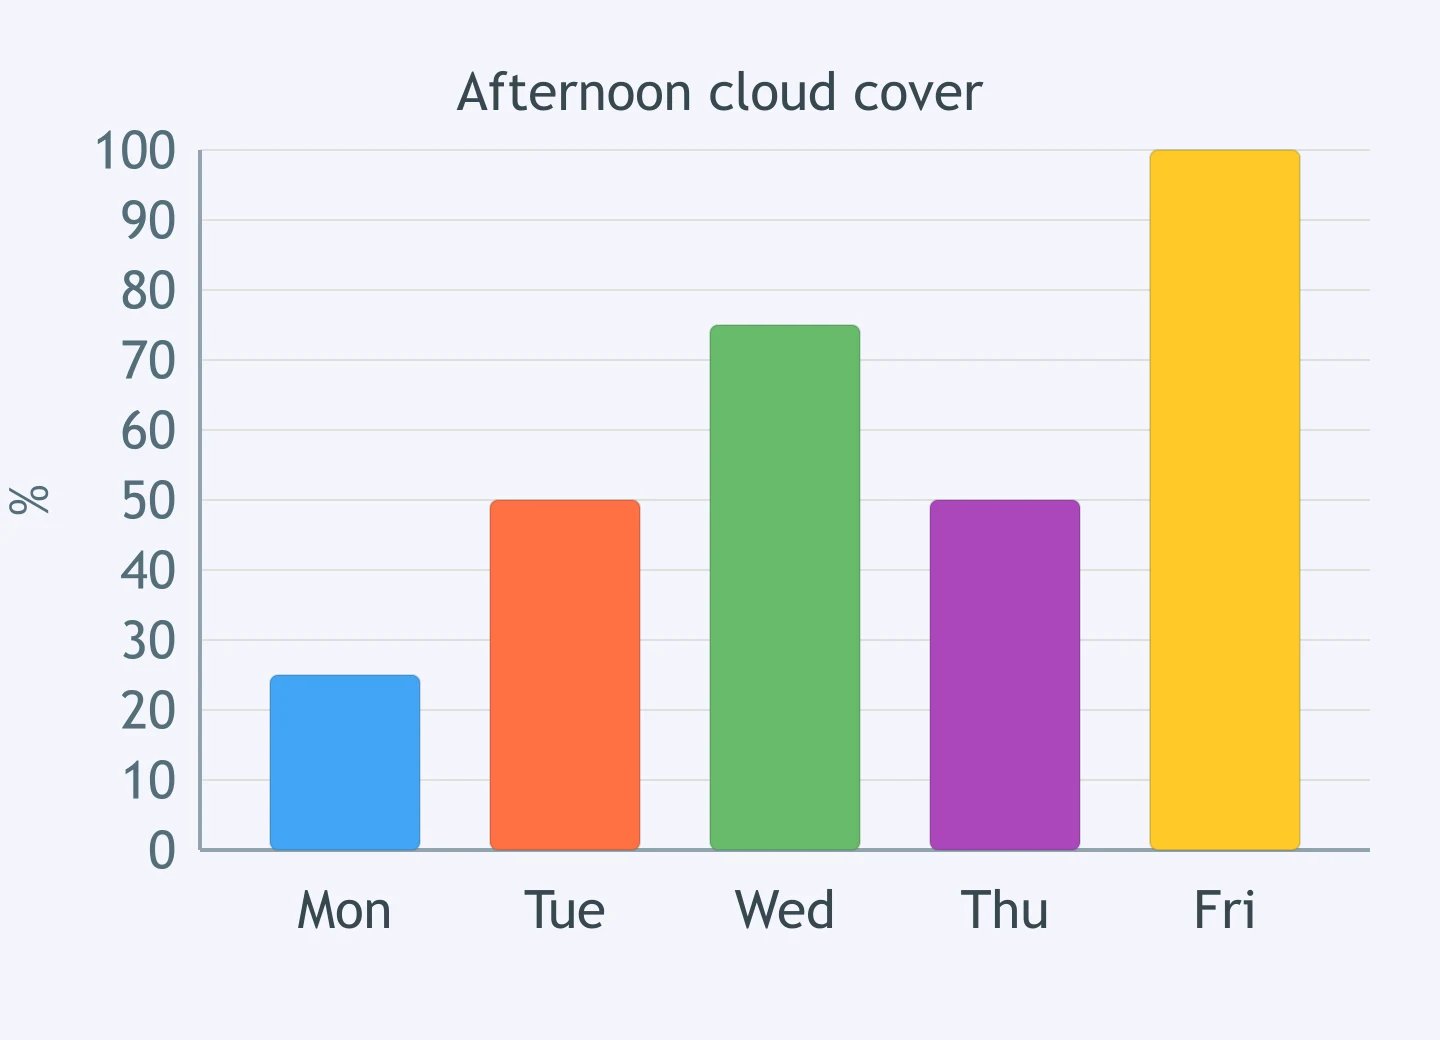
Use the cloud-cover bar graph. Which comparison is supported by the bars?
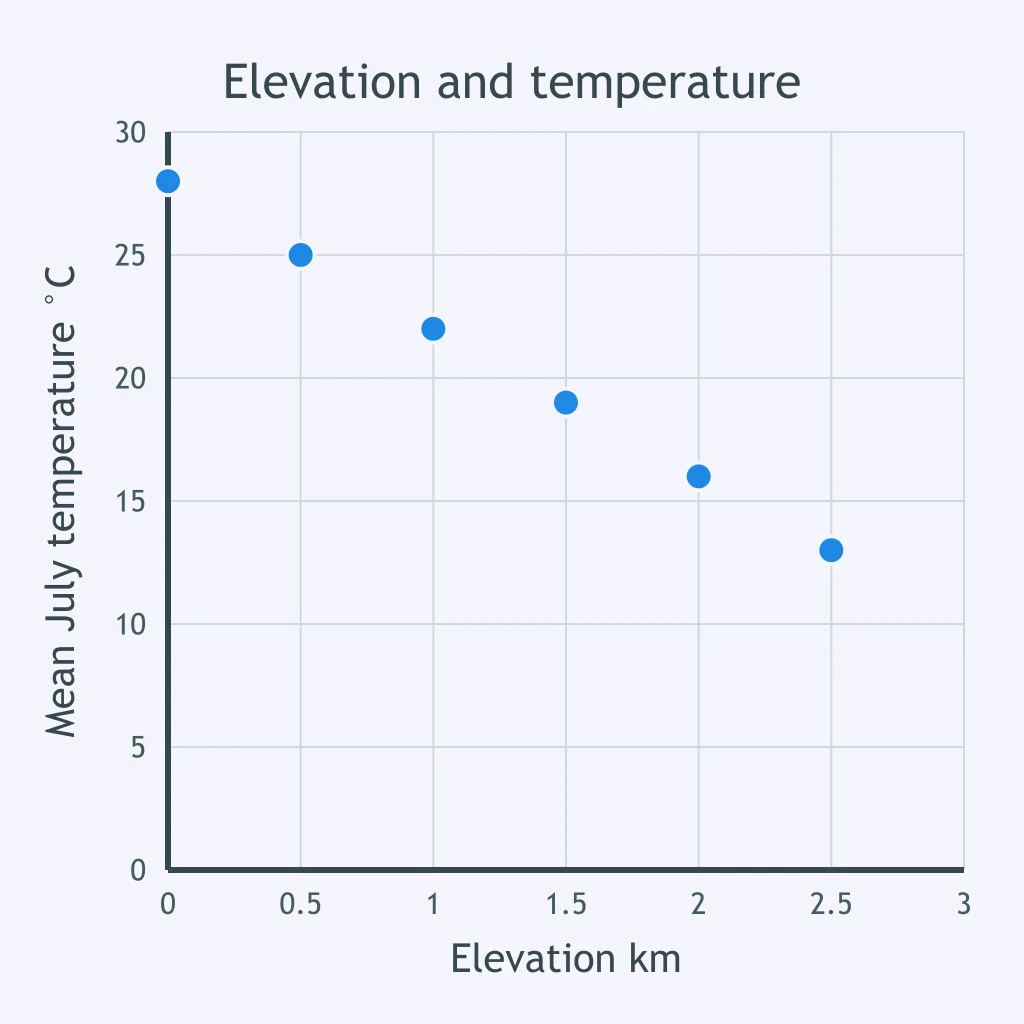
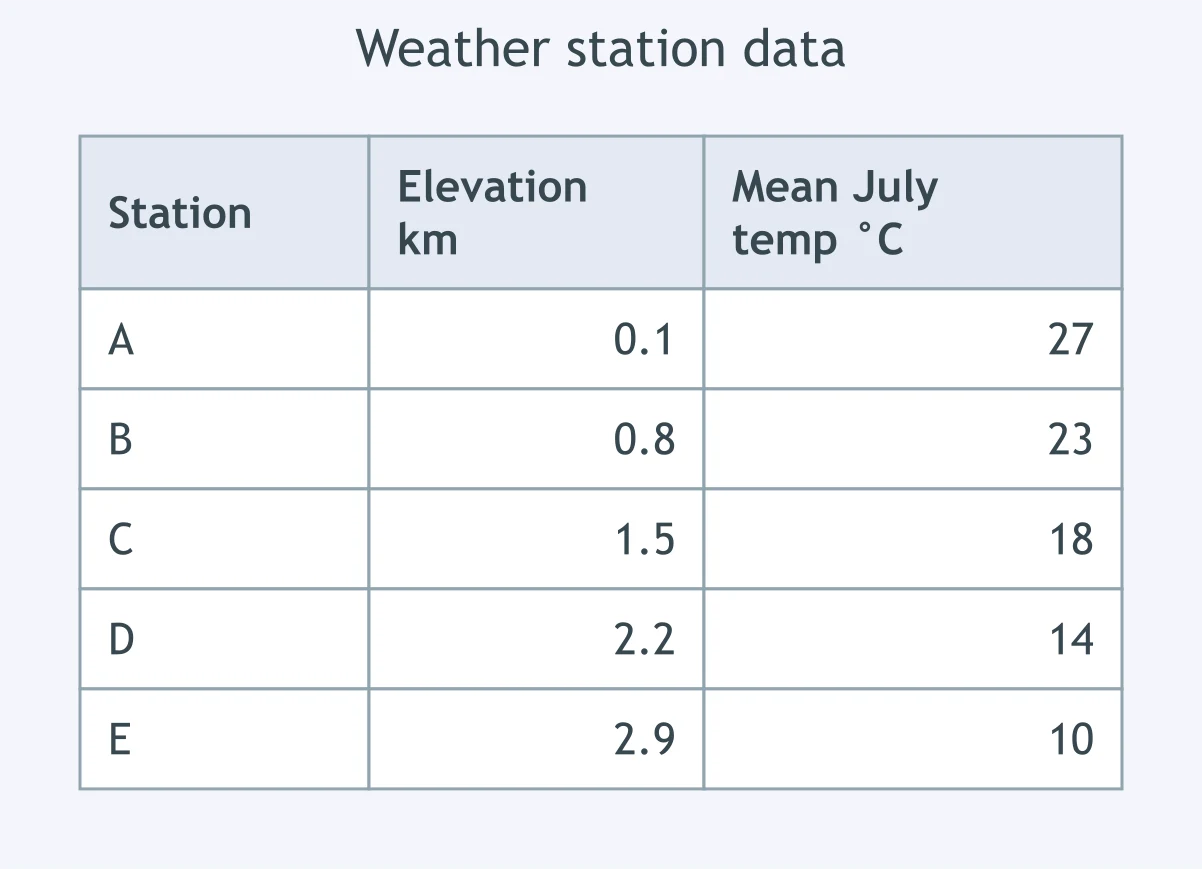
The scatter plot compares elevation and mean July temperature. What relationship does the plot show?
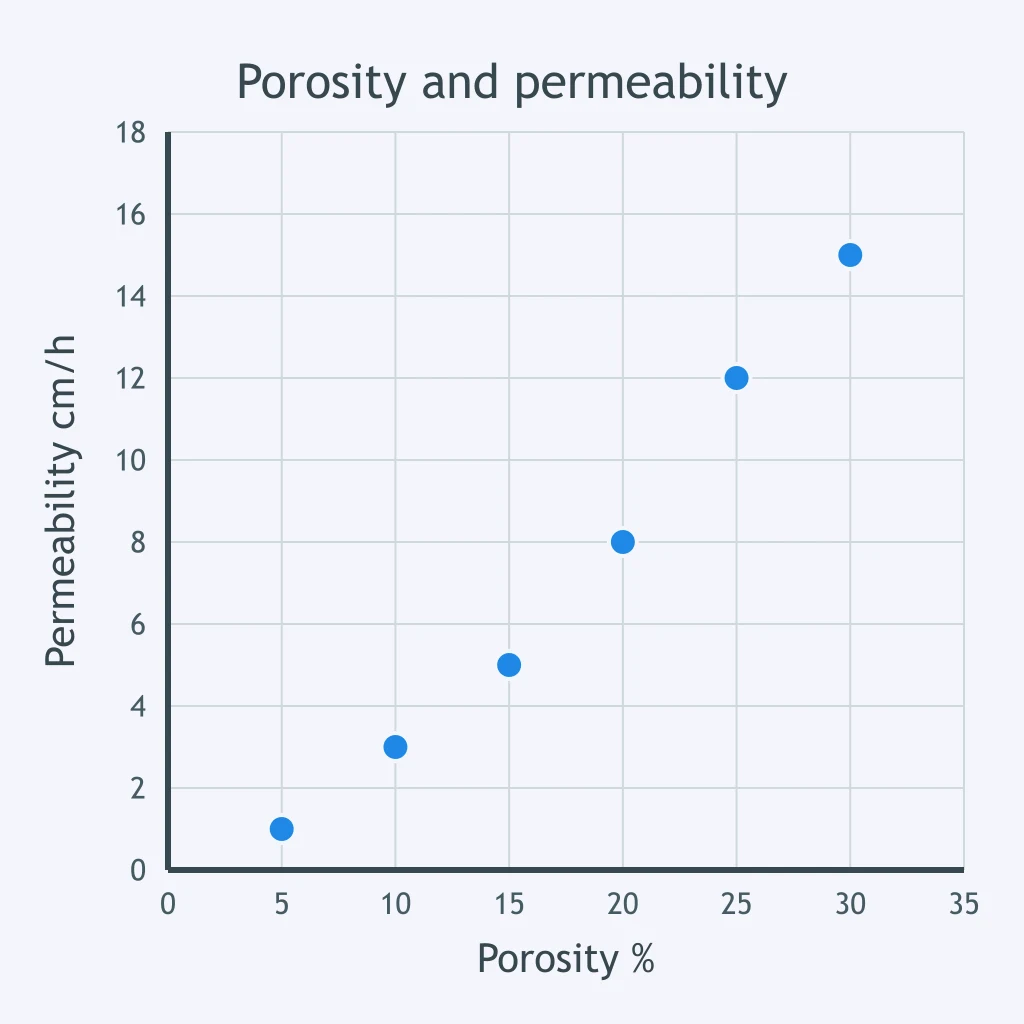
The scatter plot compares rock porosity and permeability. What relationship is shown?
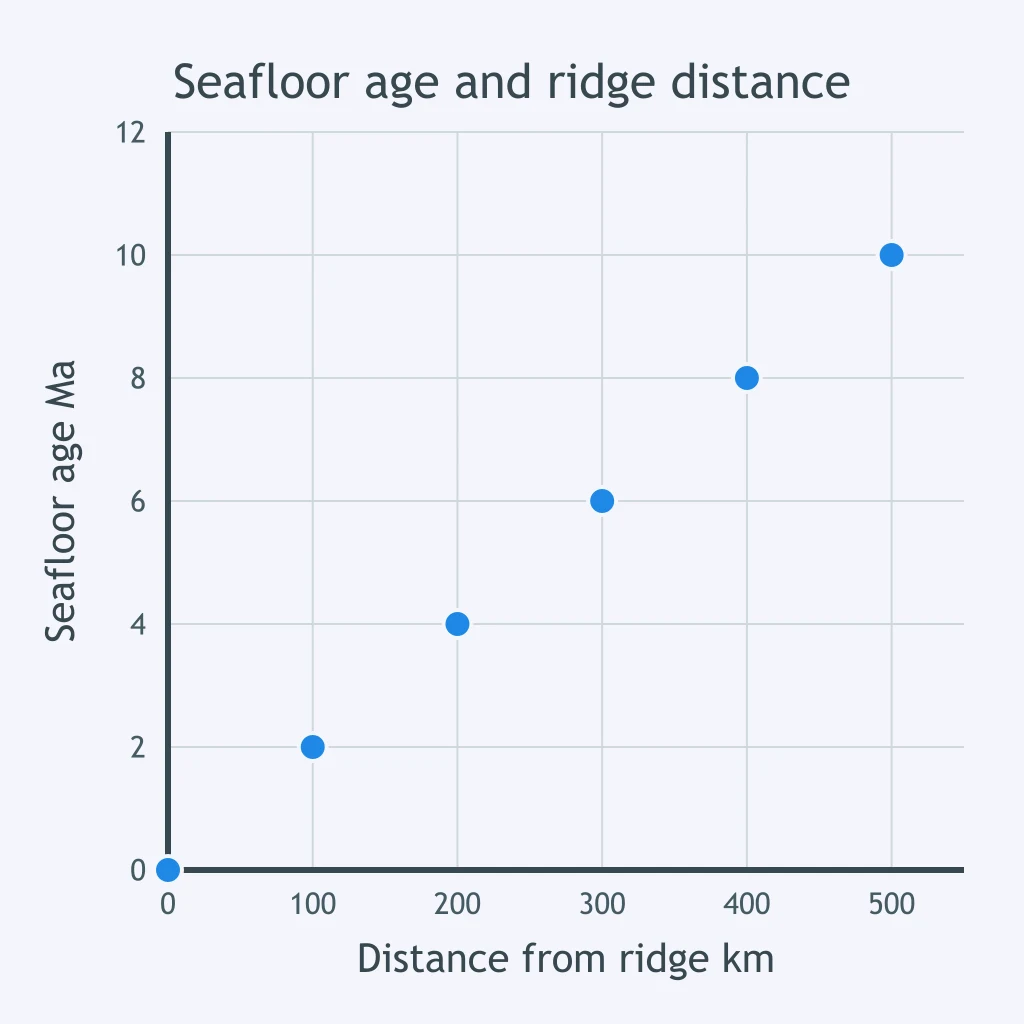
The scatter plot compares distance from a mid-ocean ridge and seafloor age. What relationship does it show?
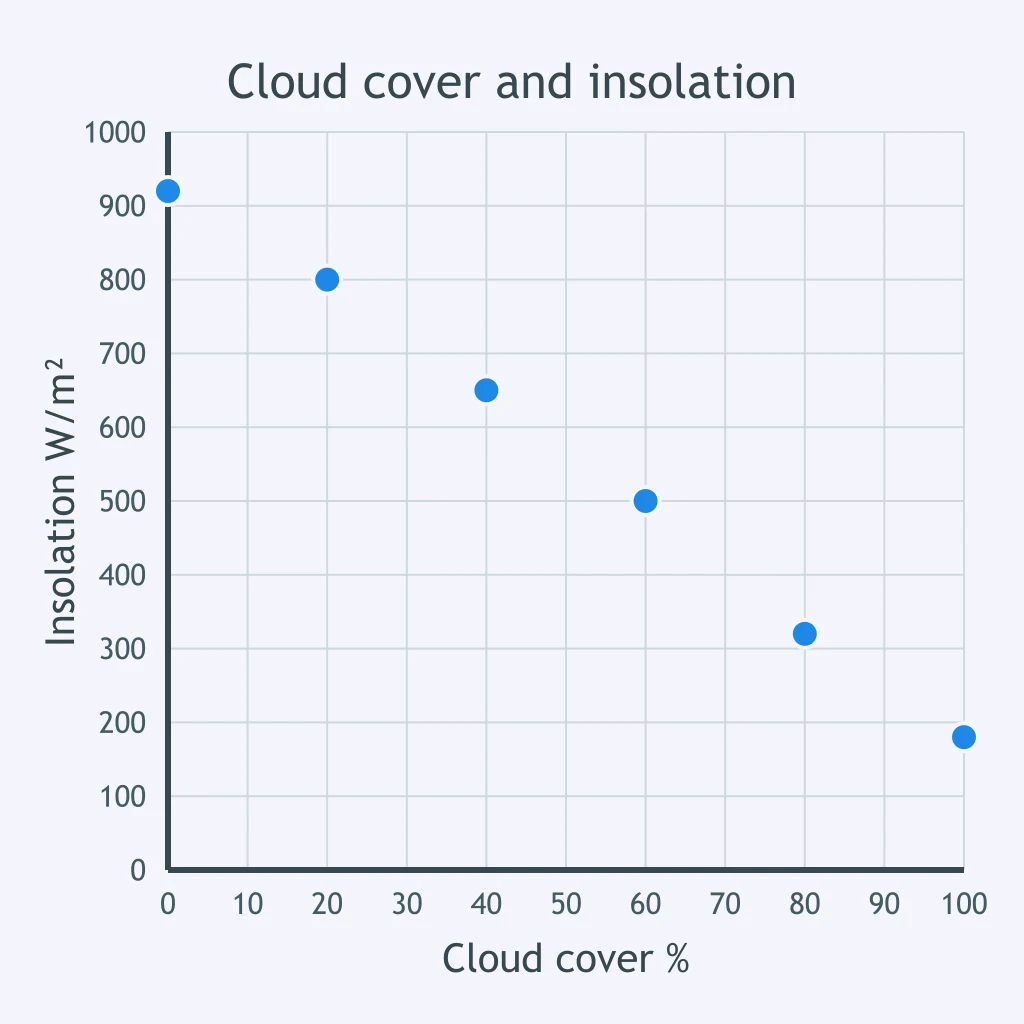
The scatter plot compares cloud cover and insolation at six stations. What relationship is shown?
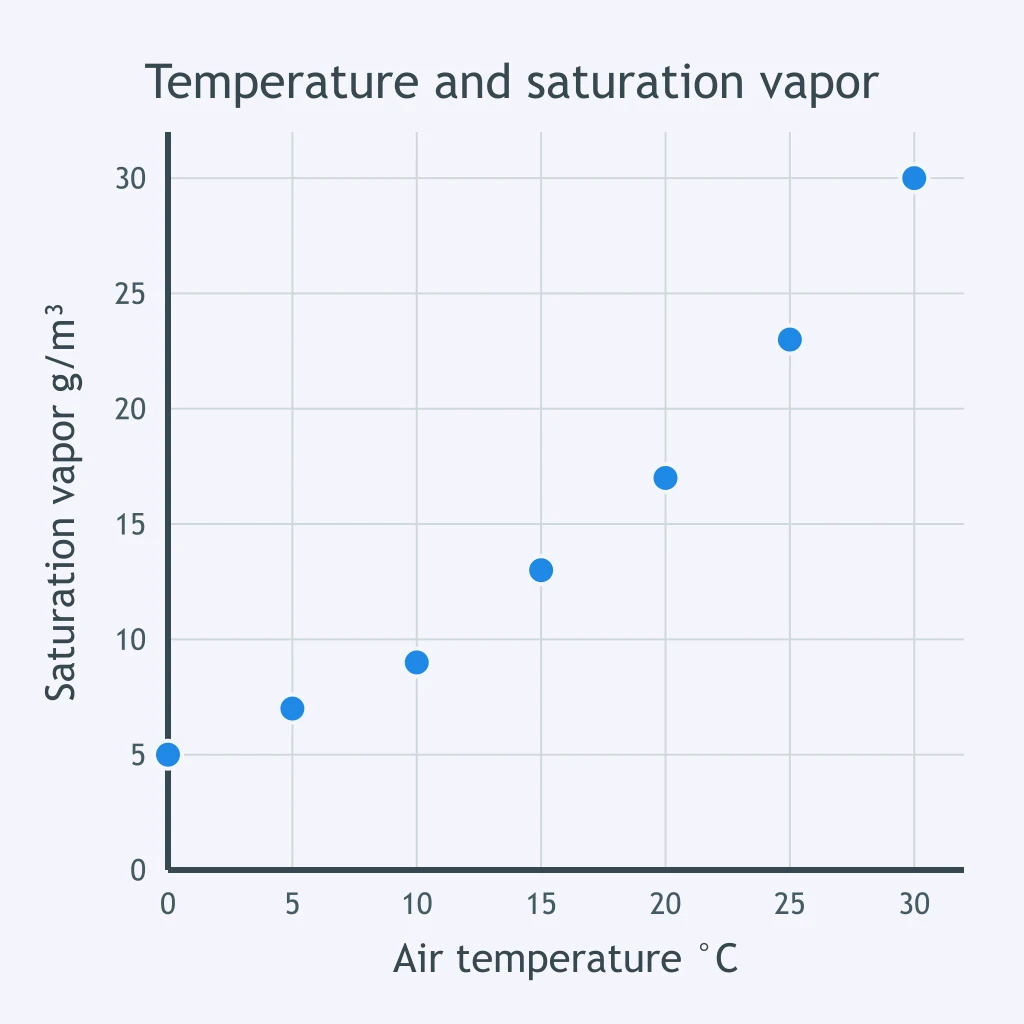
The scatter plot compares air temperature and saturation vapor amount. What pattern does it show?
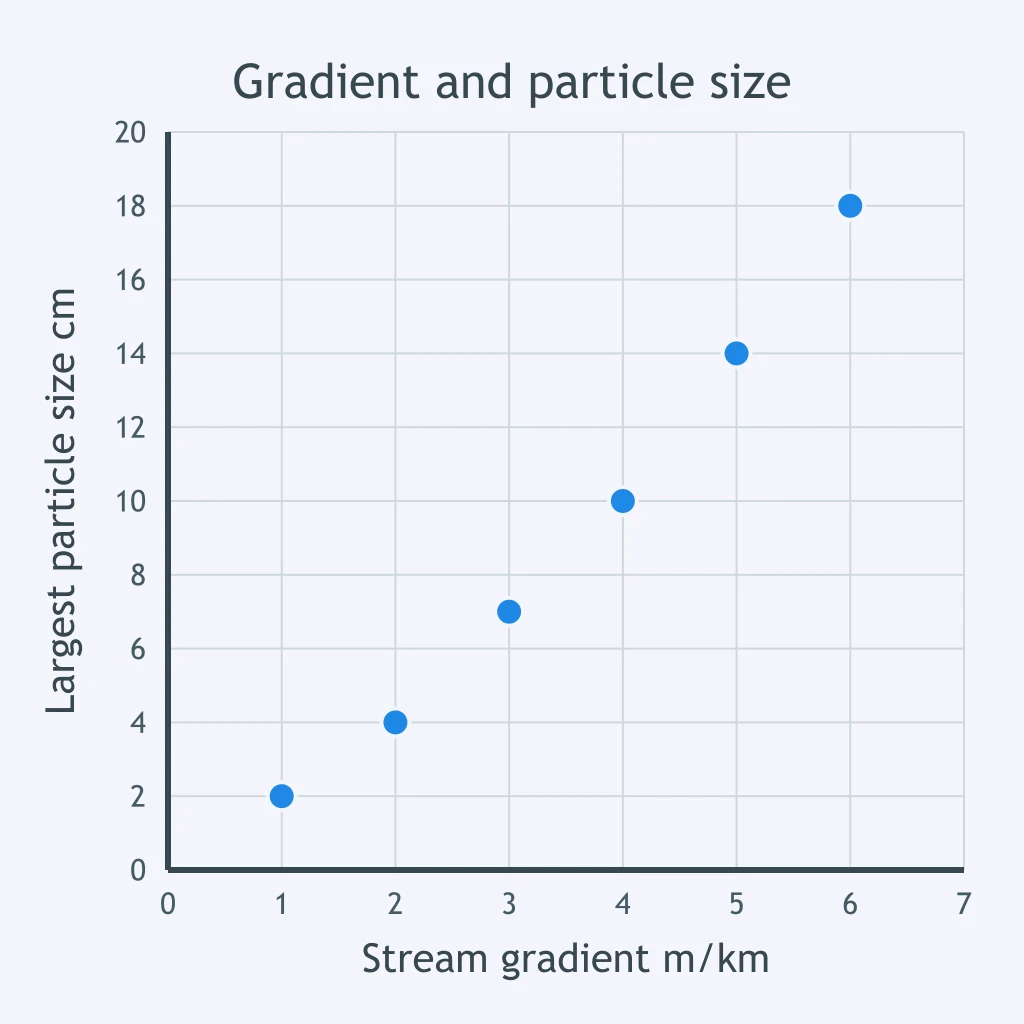
The scatter plot compares stream gradient and largest particle carried. What relationship does it show?
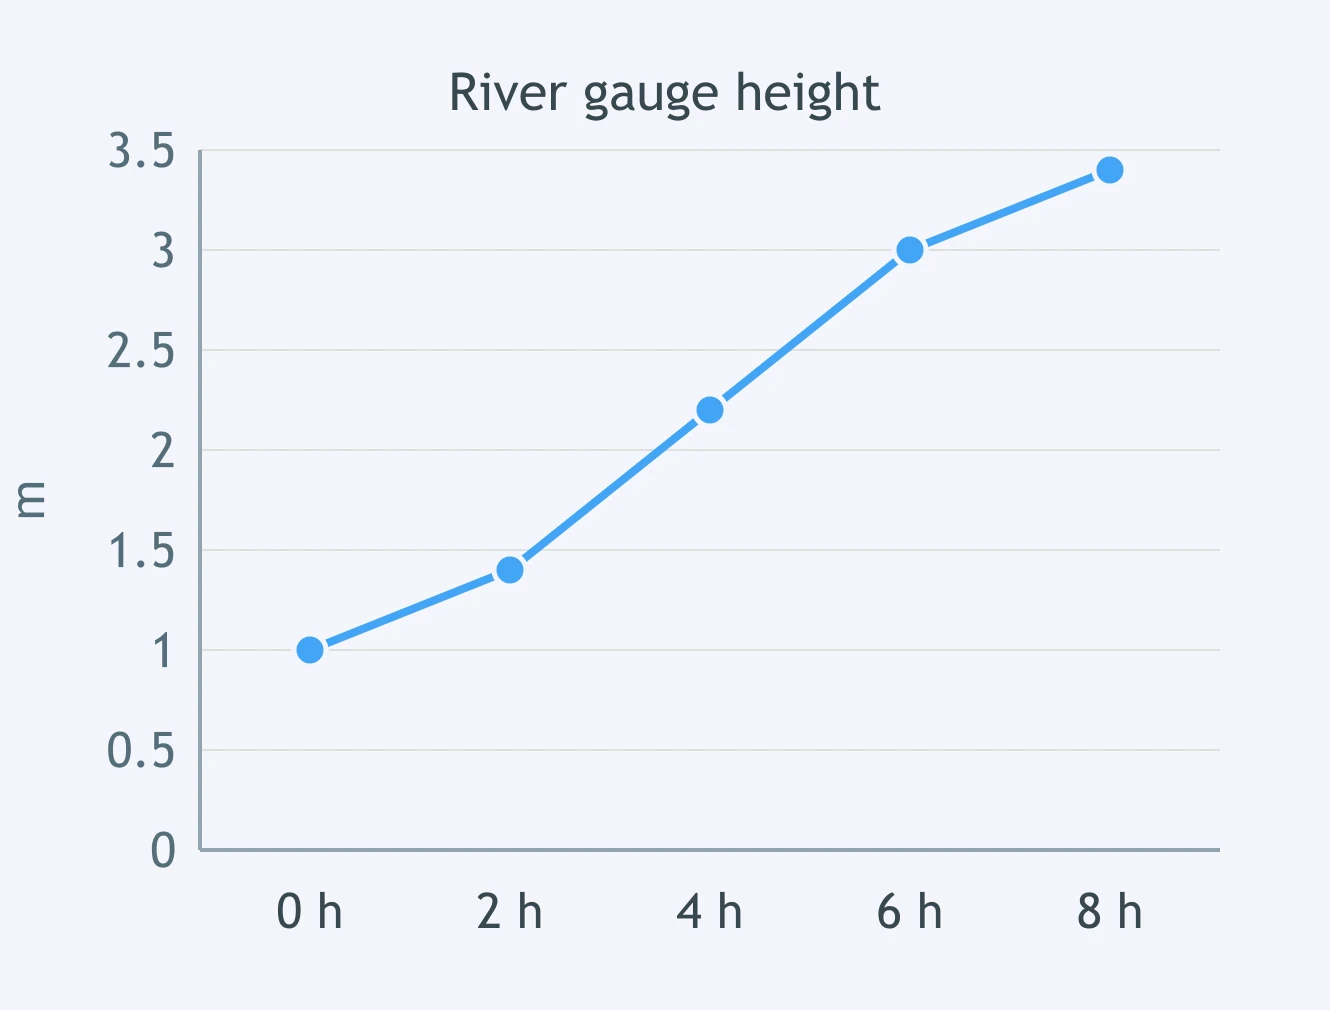
Read the river-gauge graph at hour 2 and hour 6. What is the average rate of rise between those times?
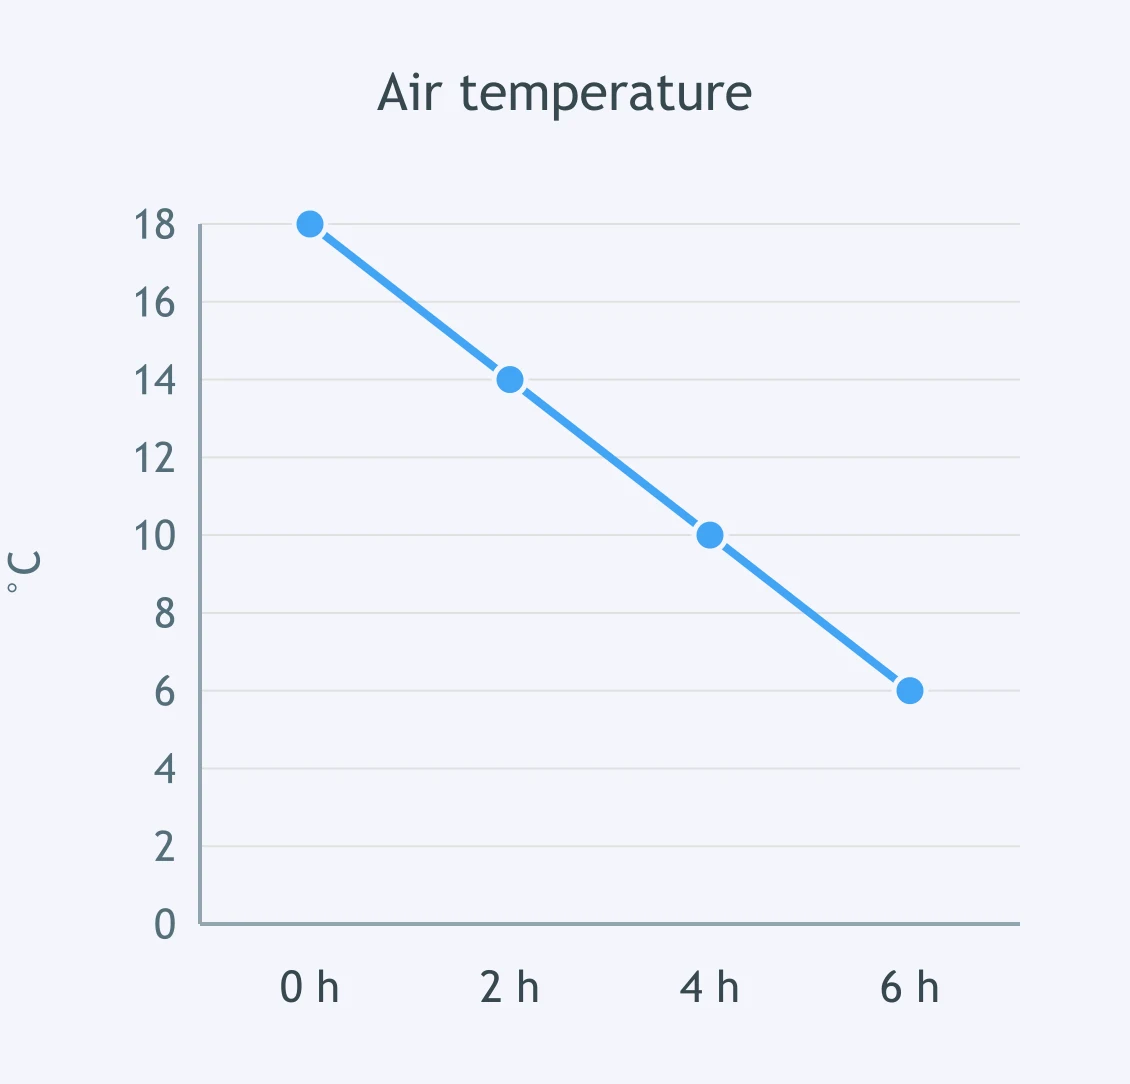
The air-temperature graph shows a cold front passing. Read hour 0 and hour 6. What is the rate of temperature change?
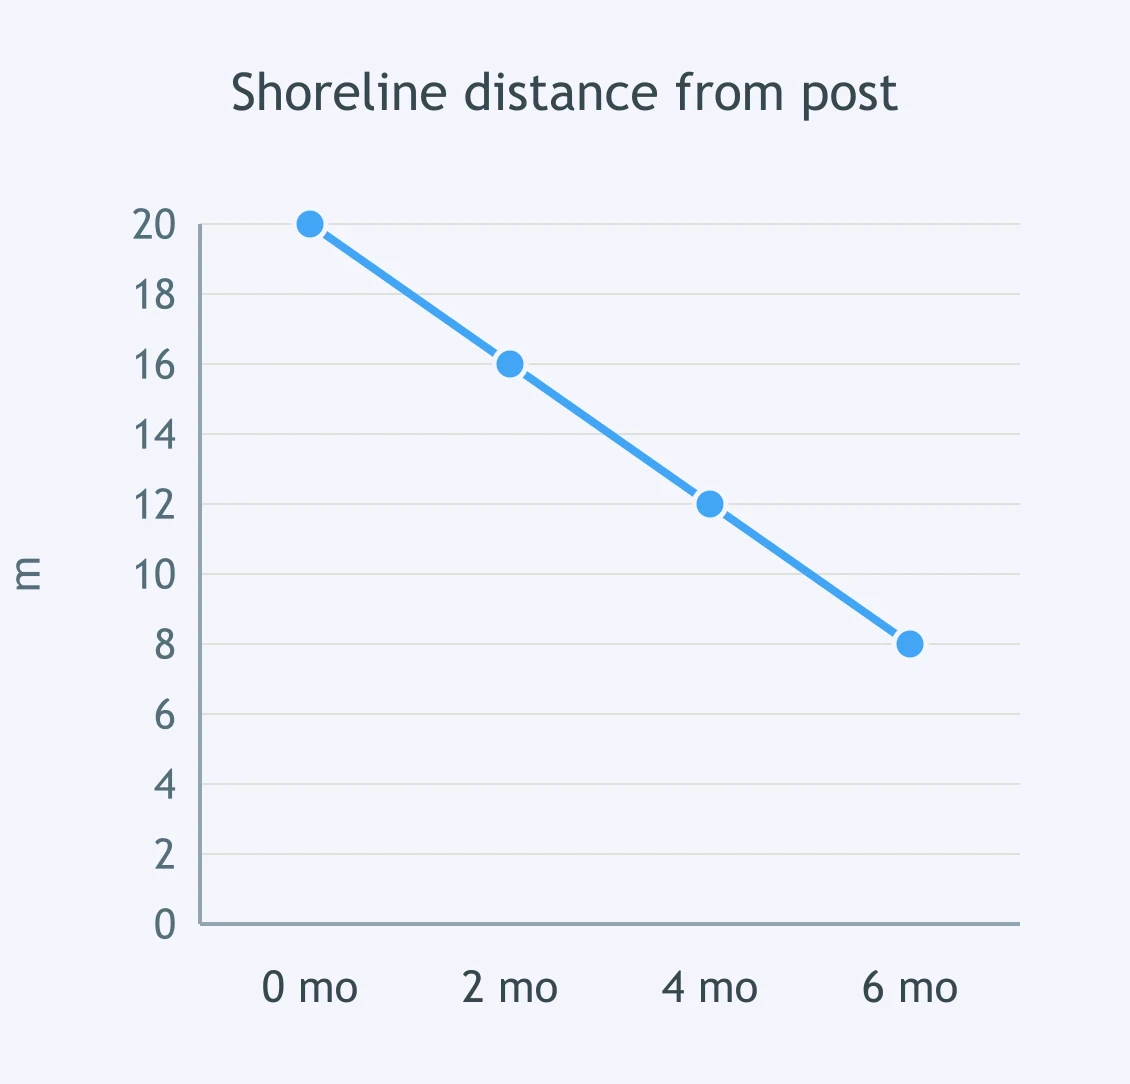
A beach profile graph shows shoreline distance from a fixed post. Using month 0 and month 6, what is the average rate of change?
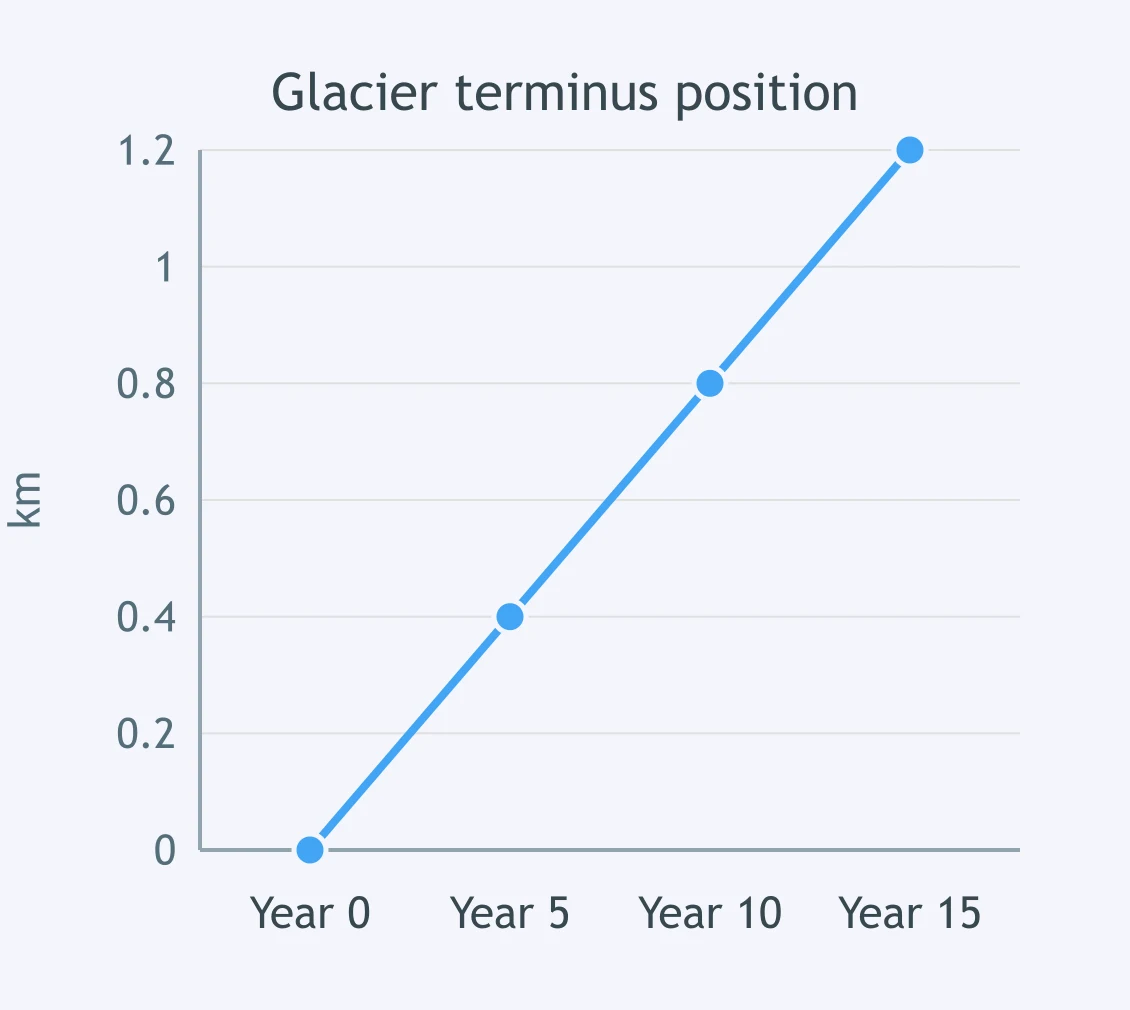
The glacier-position graph plots terminus distance down-valley. Using year 5 and year 15, what is the average rate of motion?
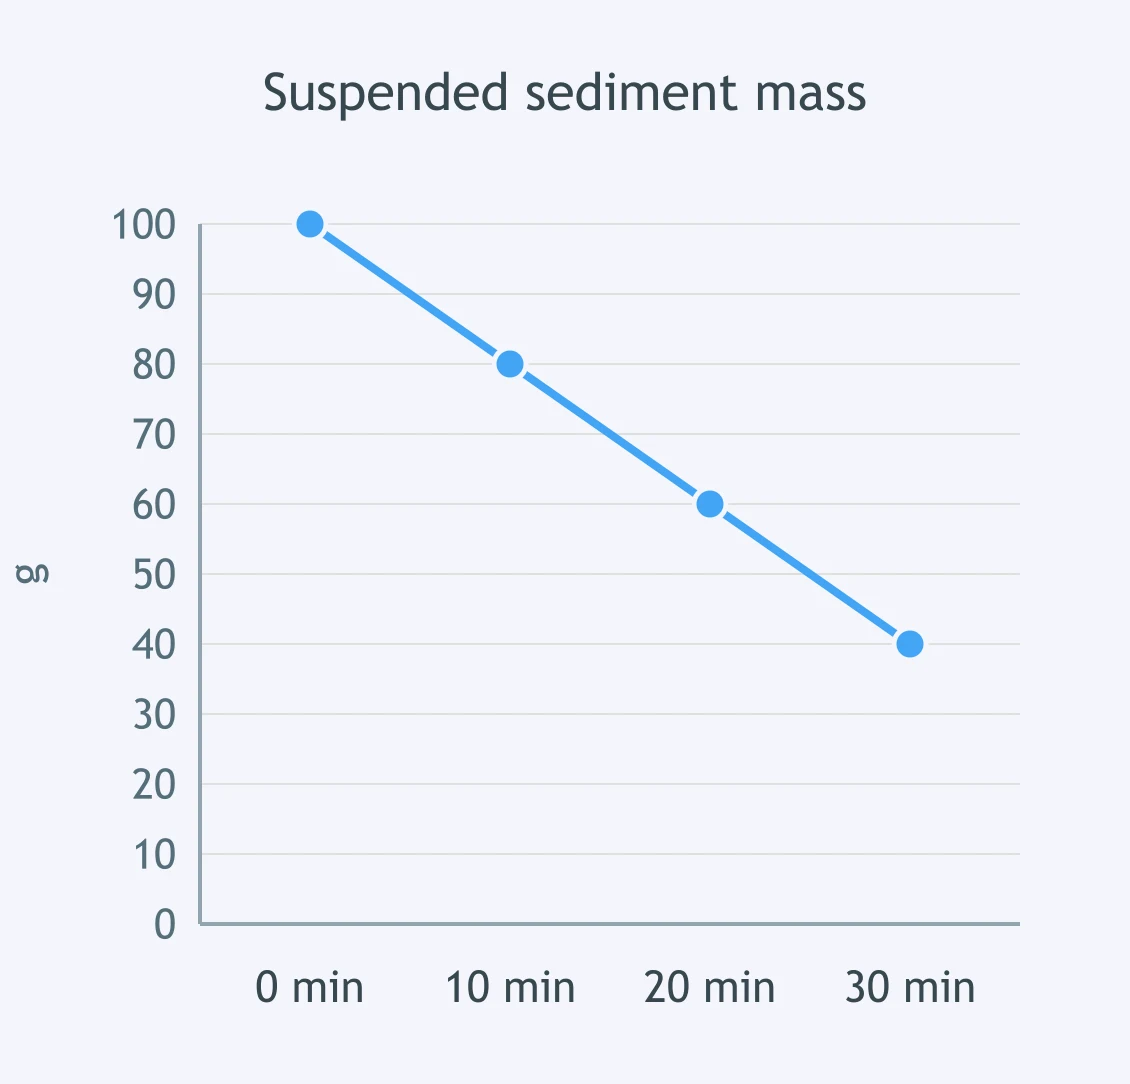
The suspended-sediment graph shows mass remaining in a settling column. Using 10 min and 30 min, what is the average rate of change?
A class has monthly rainfall totals for one station and wants to compare the totals by month. Which display fits best?
A class measured elevation and air pressure at 20 sites and wants to test whether the two variables are related. Which display best fits that job?
A lab group counted how many specimens in a collection were igneous, sedimentary, metamorphic, or unknown. Which display best compares the counts?
A weather station recorded air temperature every hour for 24 hours. Which display best shows how temperature changed through the day?
A lab table has each mineral sample's volume and mass. To graph how mass changes with volume, what should go on the x-axis?
Use the table of station data. Which graph would best test the relationship between elevation and mean July temperature?
Crack the passcode before the zombies get in.
Answer, then swat bugs for bonus points.
Race through questions at your own speed.
Same question on every screen. Fastest wins.

Pick a tile, answer, hit bonuses and steals.
Earth's Shape and Spheres
30 questions