Loading
by BlastRoom
Exponential and Logistic Growth for high school Environmental Science, on-level and AP. Covers AP Environmental Science Unit 3: Populations.
#environmental_science

25 questions
One question set, multiple game modes. Tap any game to see it in action. Not sure which to pick?
Answer to place stones and capture territory.
Outrun the snow together.
Earn blasts, then hunt the other team.
Answer to earn energy, then climb.

The class blasts through walls together.
Bid on mystery lots. Most money wins.
Sell tours. Nice, standard, or a total scam.

Answer, restock, and serve the rush.
More correct answers pulls the rope your way.
Answer, then shoot down the alien wave.
Answer, then tap to leap the frozen ridge.
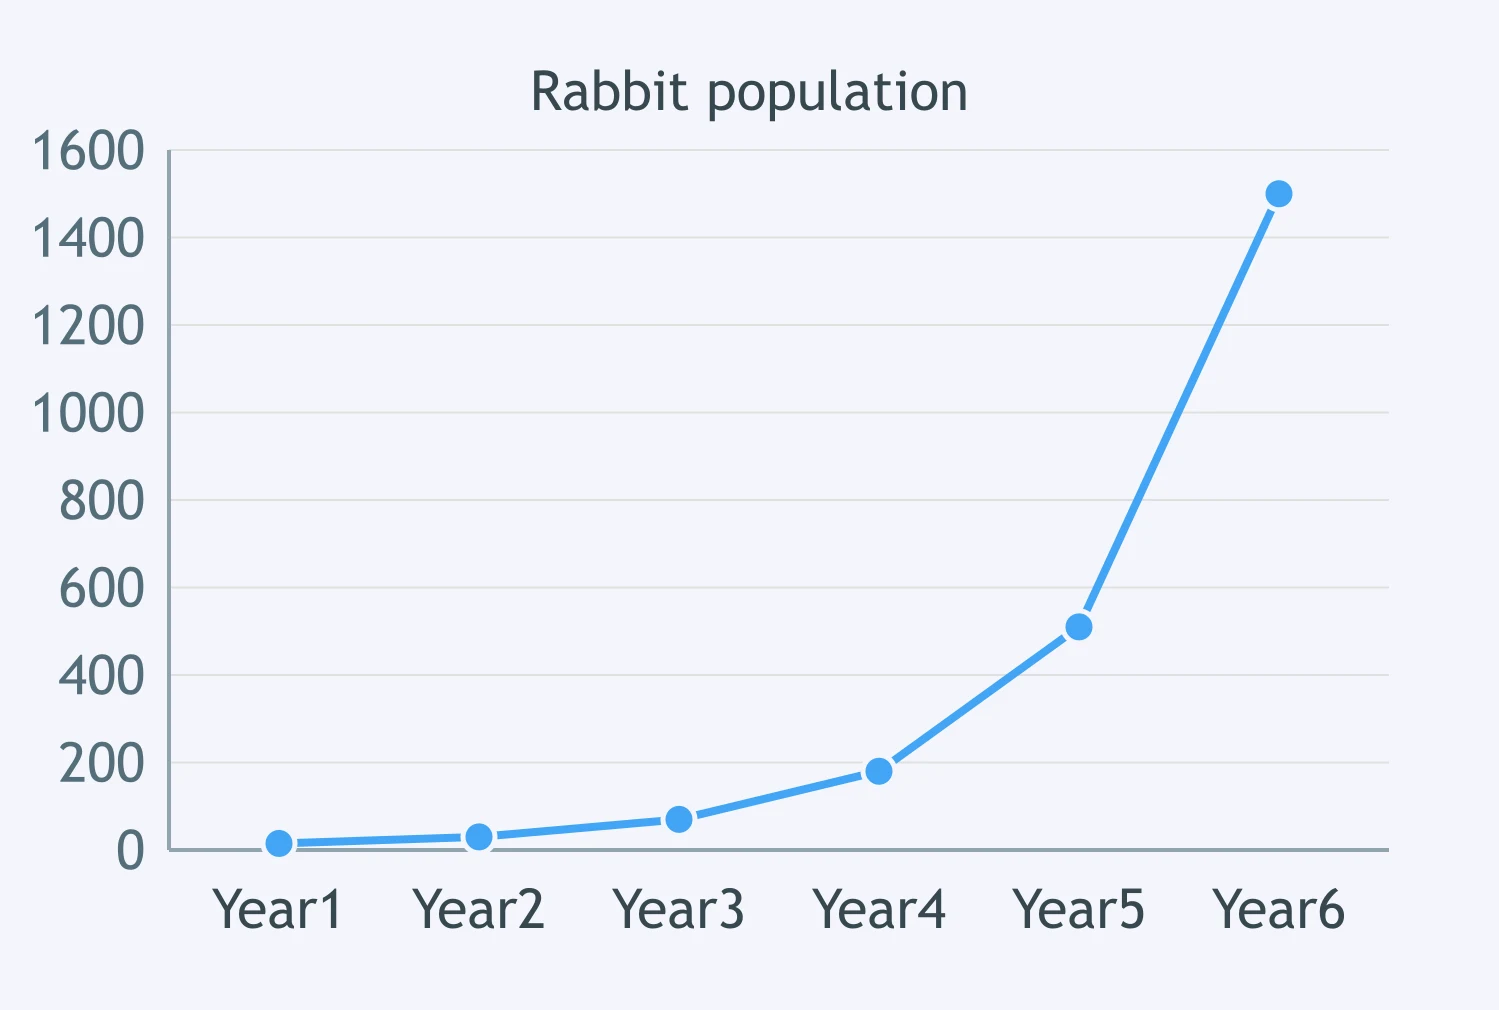
The graph shows rabbits colonizing an abandoned field near a new housing development. Which growth model is represented?
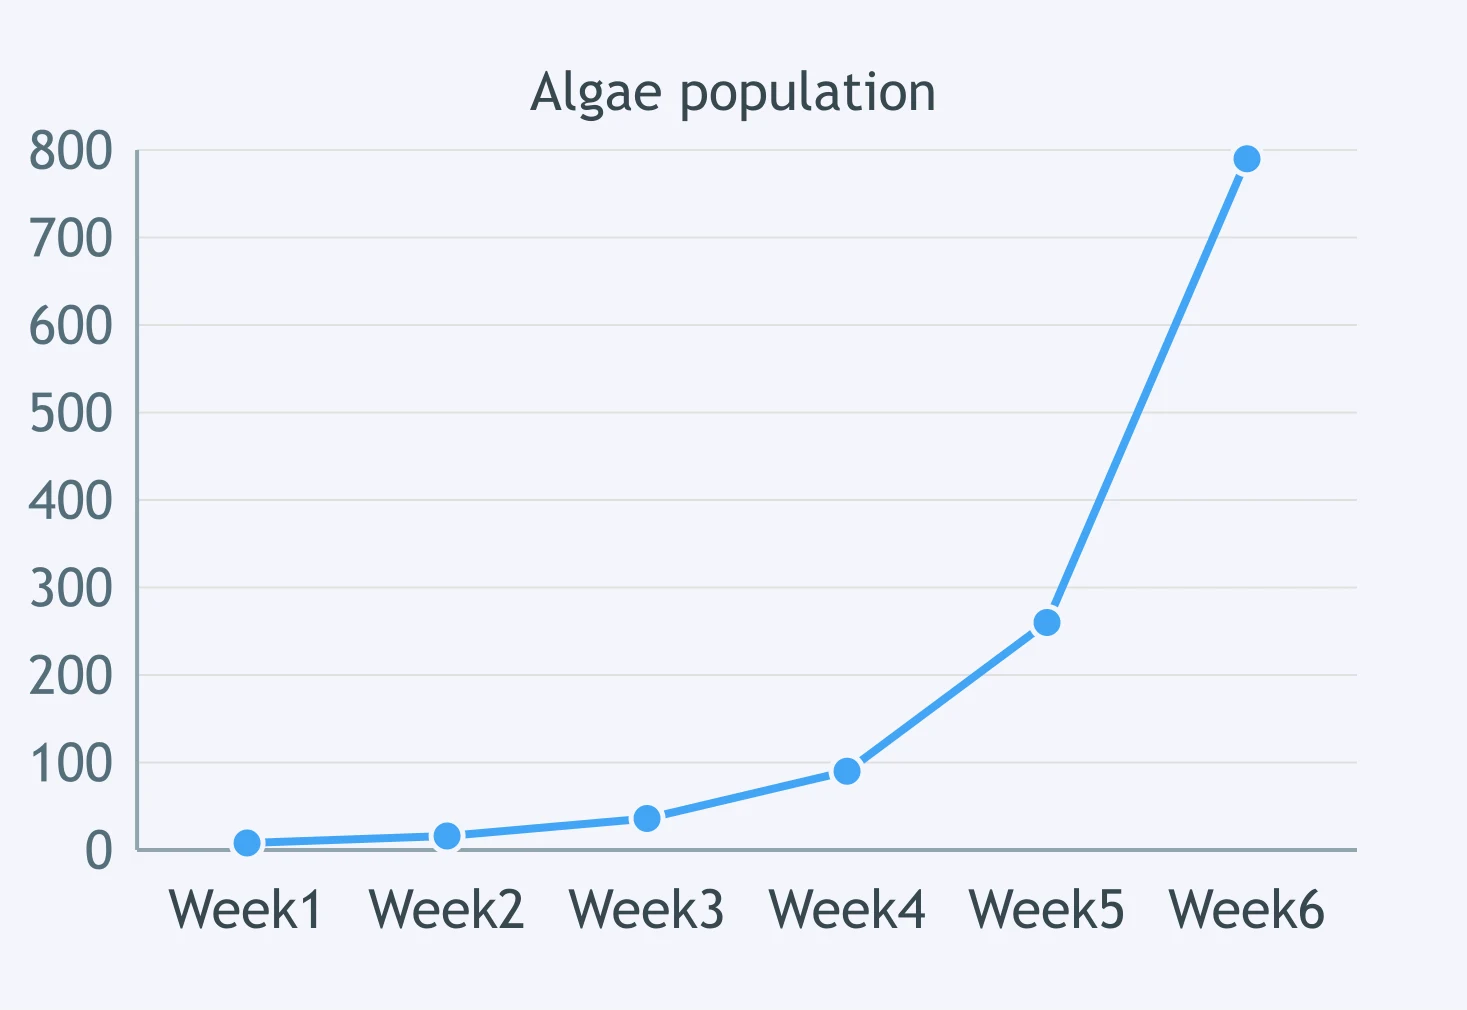
A lake receives nutrient-rich runoff, and an algae population follows the curve shown. What growth model does the curve represent?
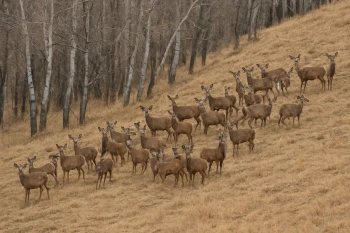
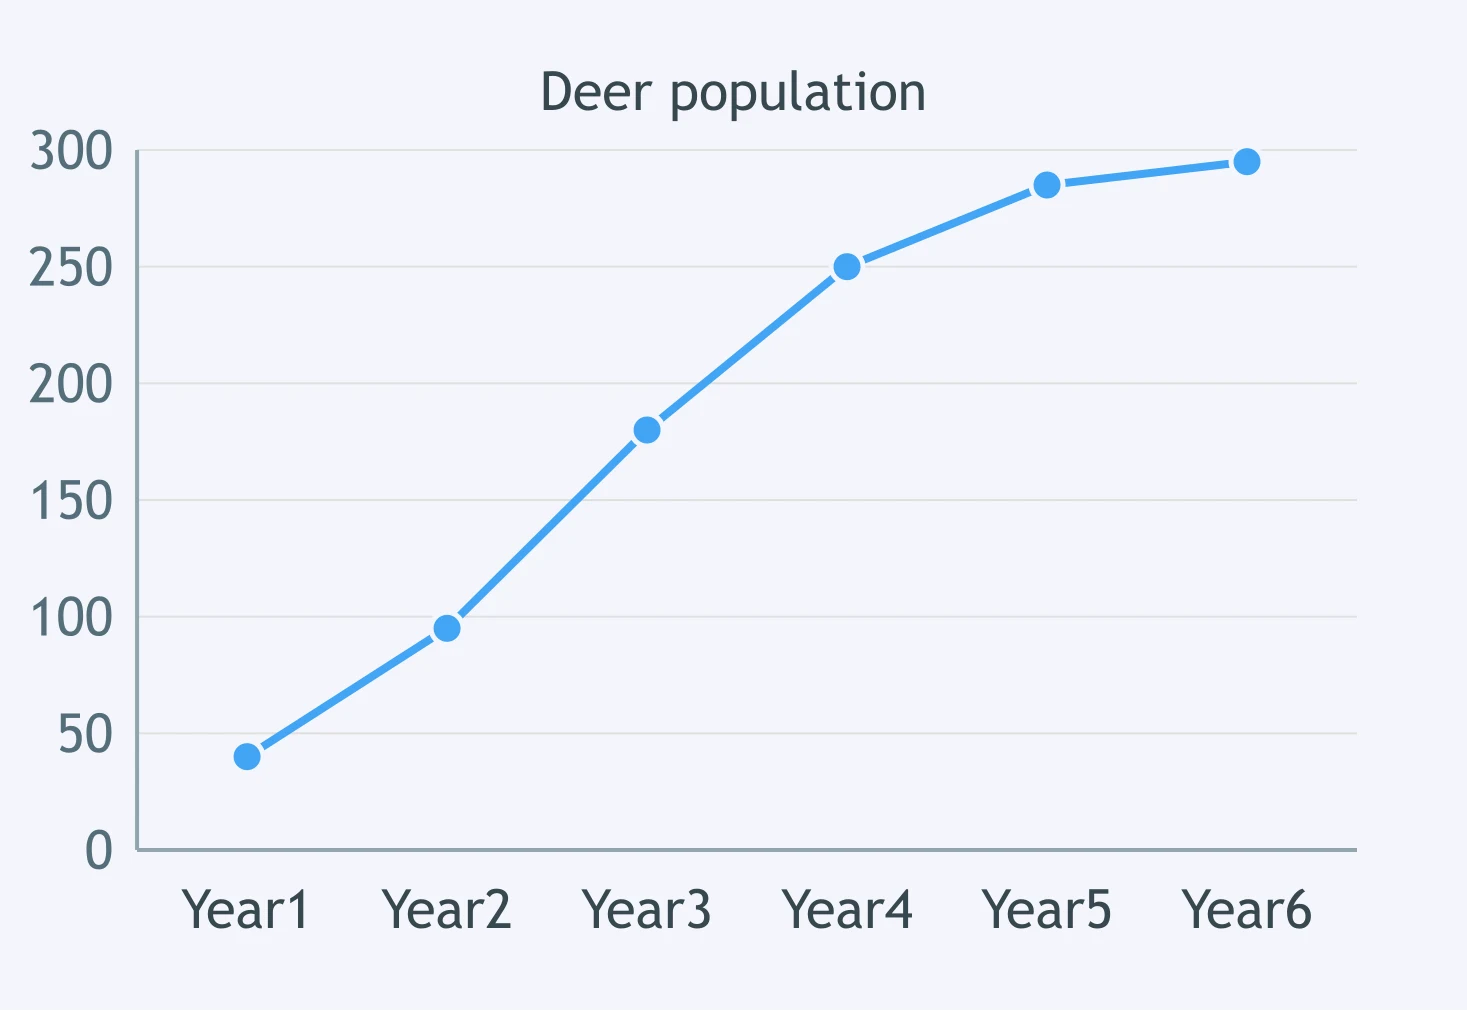
The graph tracks deer in a managed forest preserve. Which population-growth model is shown?
A wastewater-treatment pond is monitored after bacteria are introduced. What model is represented by the curve?
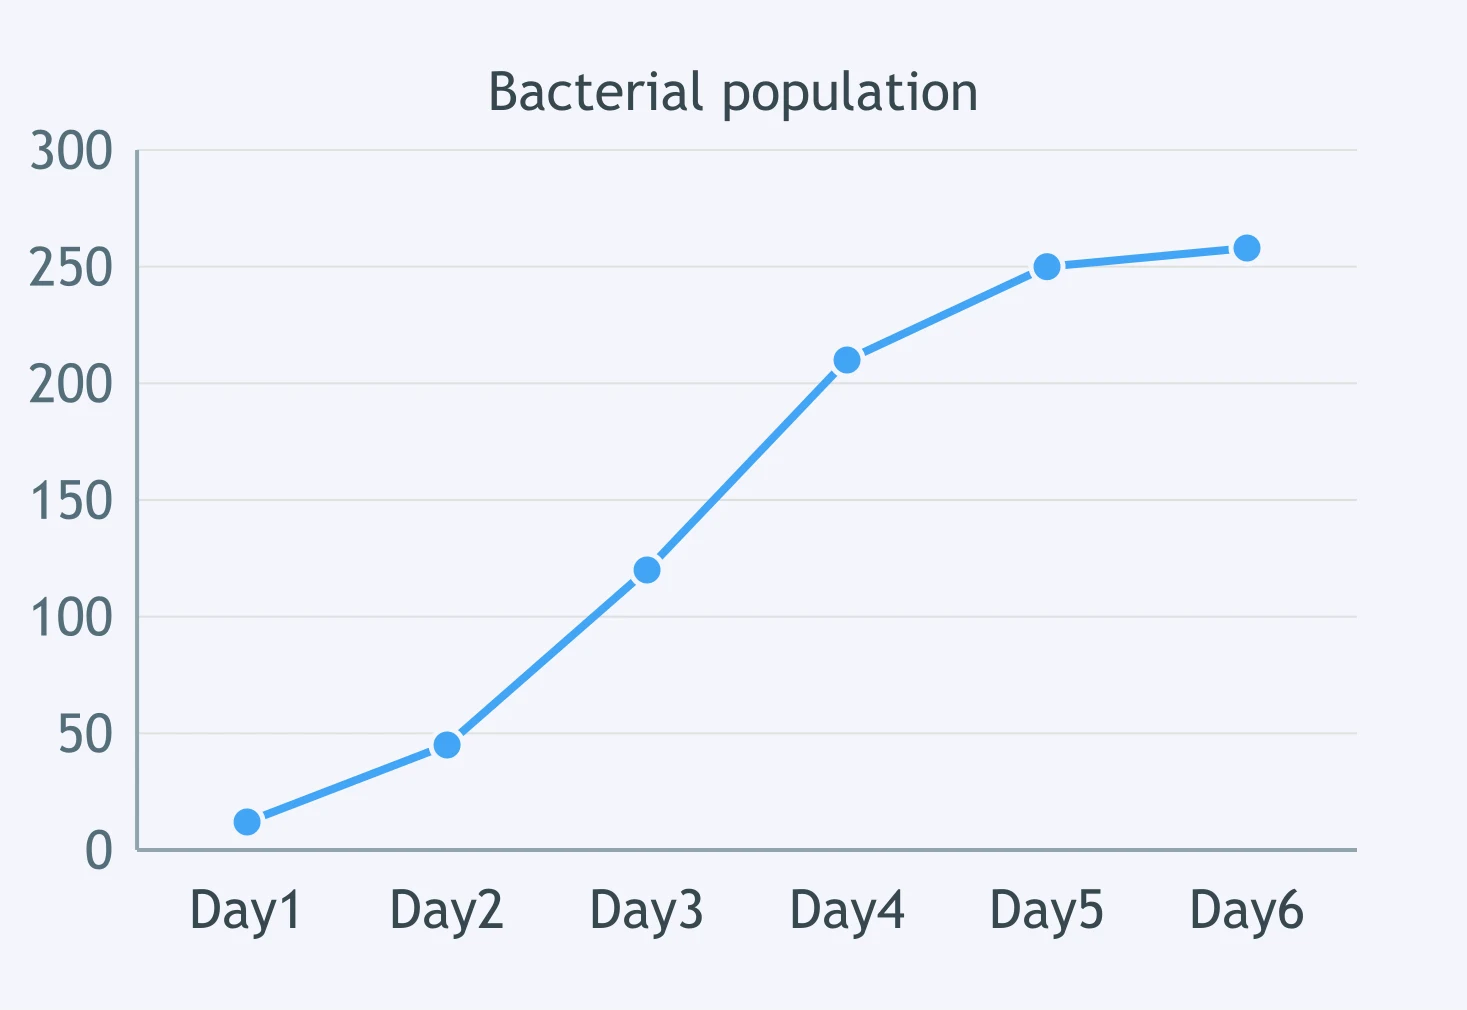
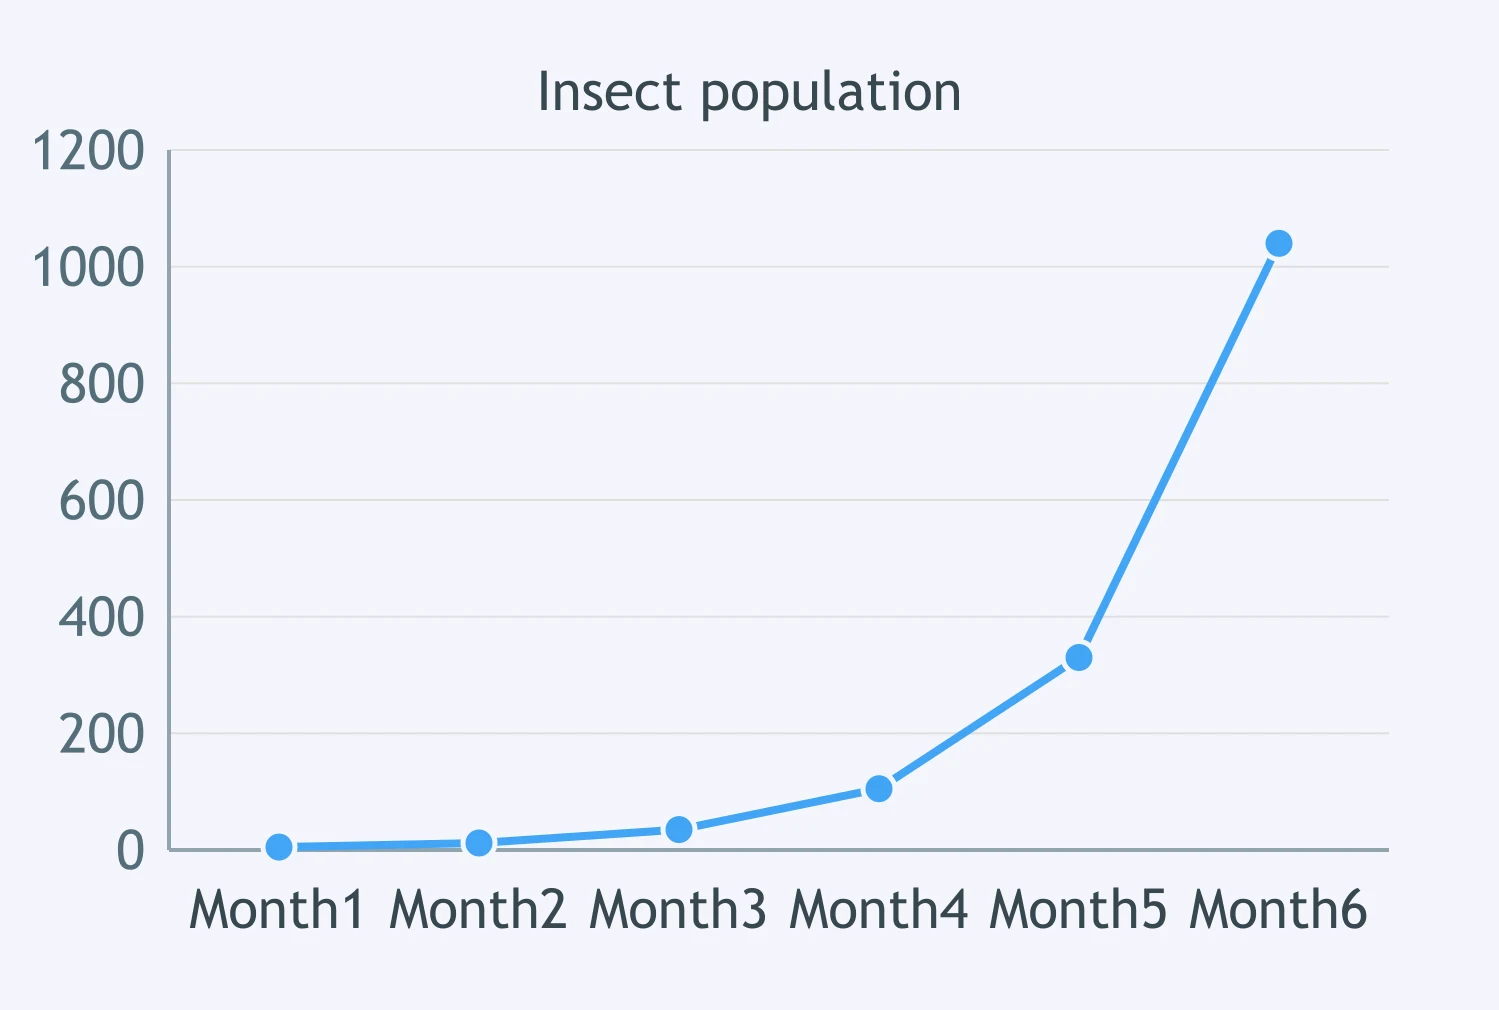
The graph shows an invasive insect population in a city park shortly after arrival. Which model best fits the displayed pattern?
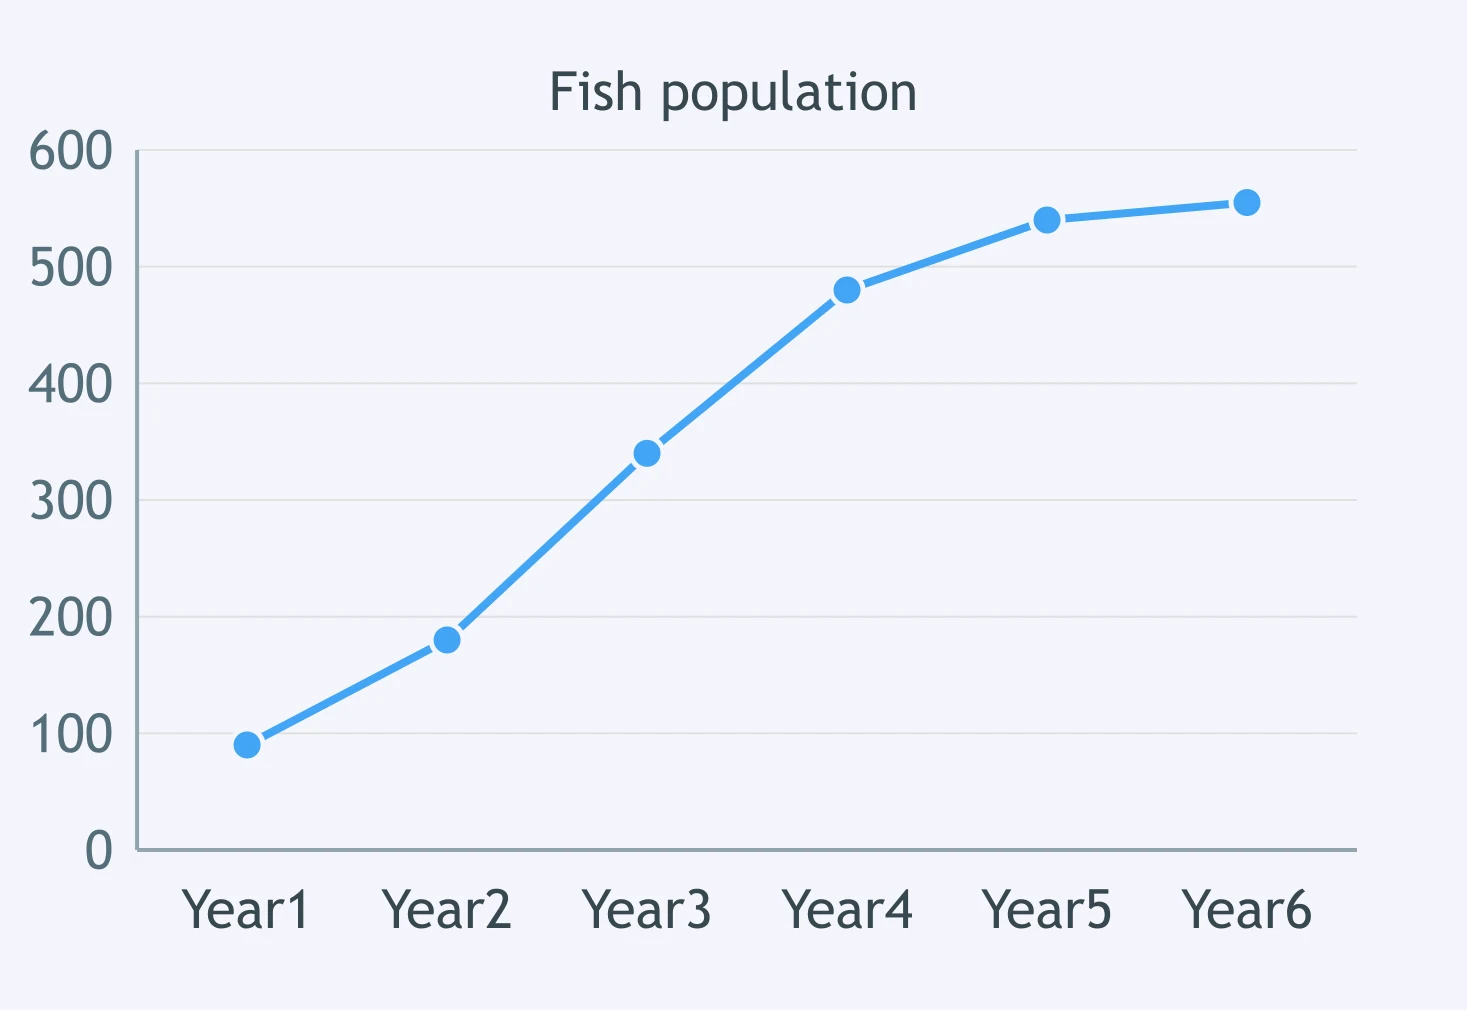
A reservoir is stocked with fish, and the graph tracks the fish population for six years. Which curve type is shown?
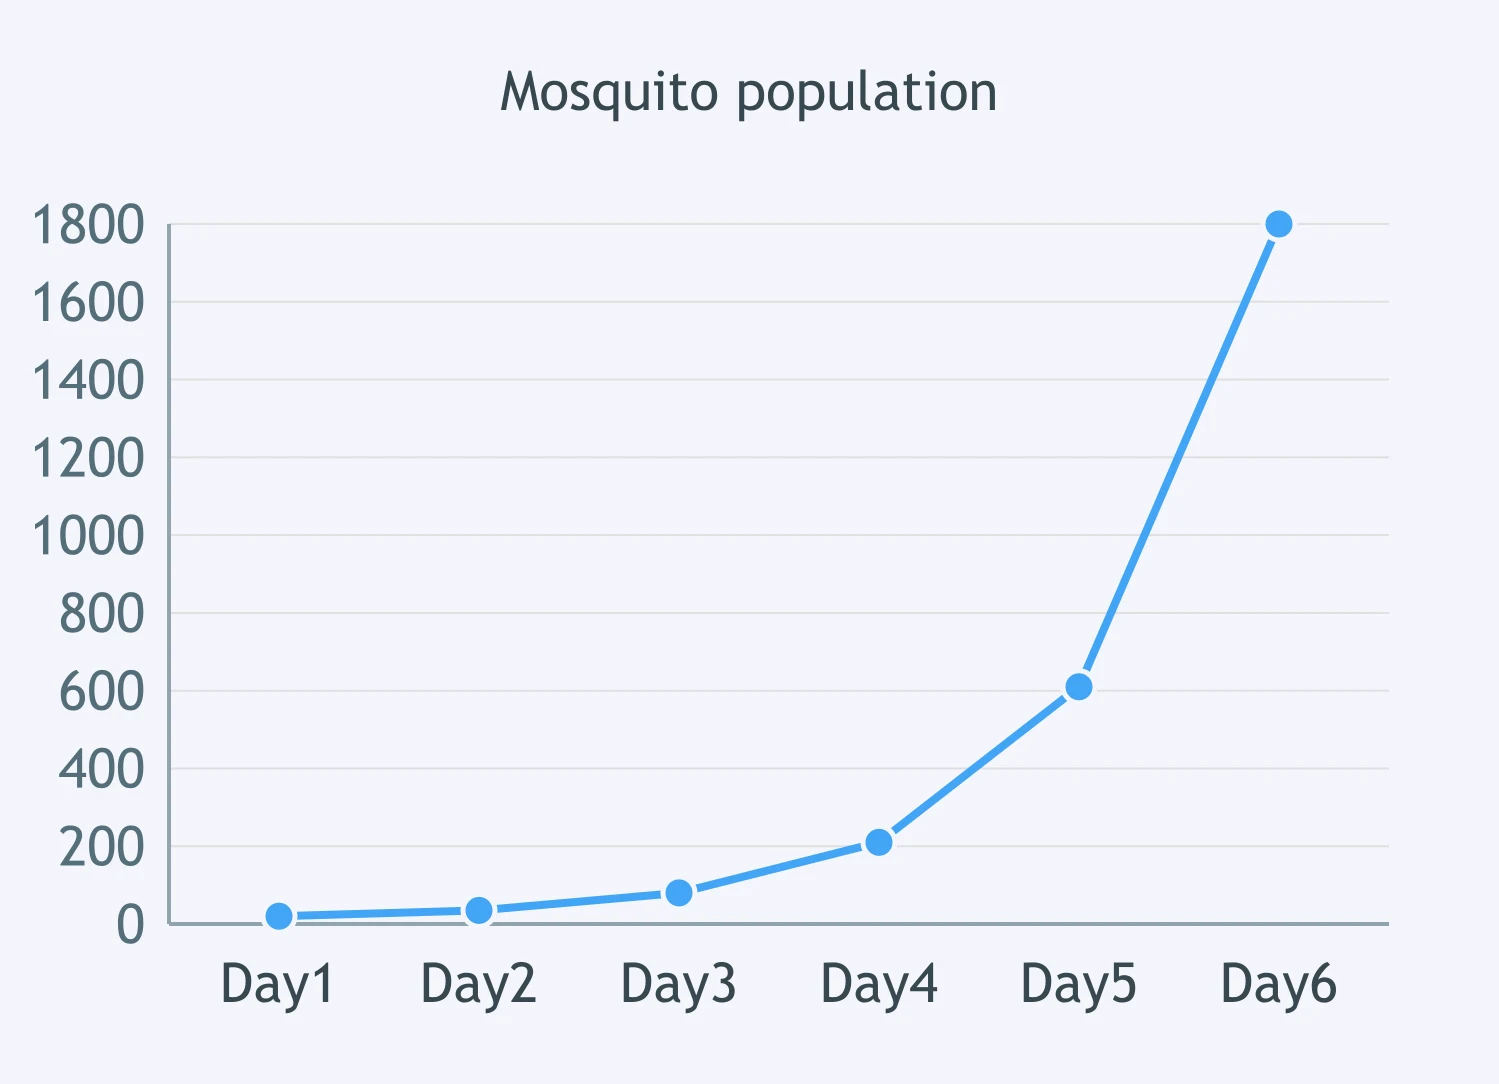
The curve shows mosquitoes breeding in standing water after a construction site floods. What growth model does it display?
The graph tracks pigeons using food waste around a transit station. Which model is represented?
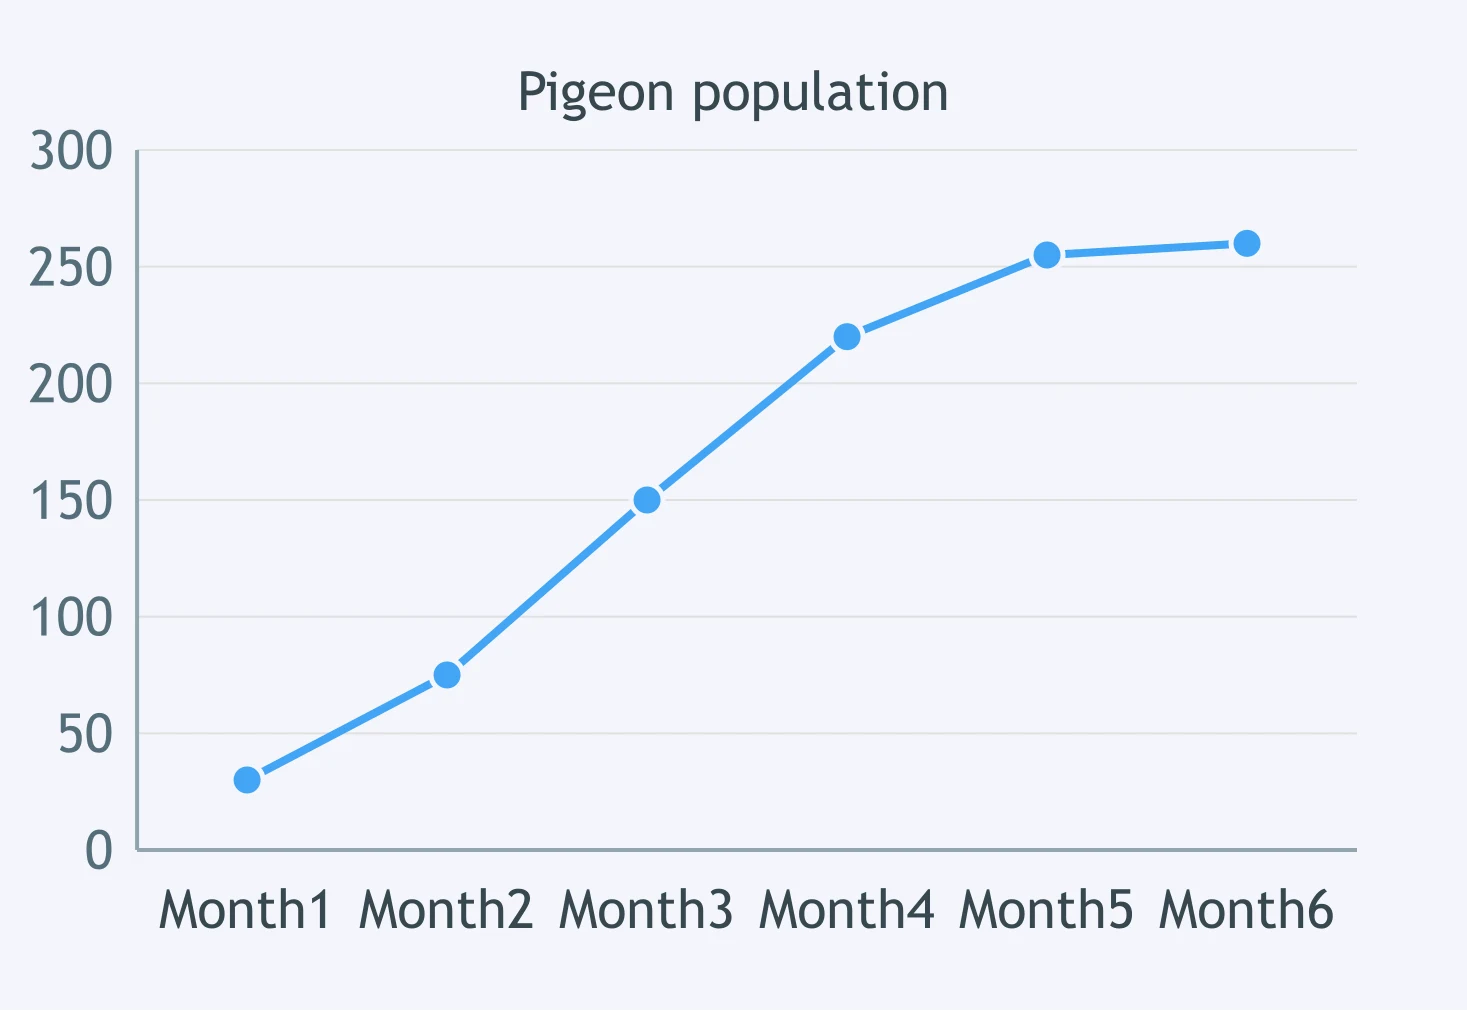
In the displayed curve, the population becomes nearly horizontal near the end. What does this plateau represent?
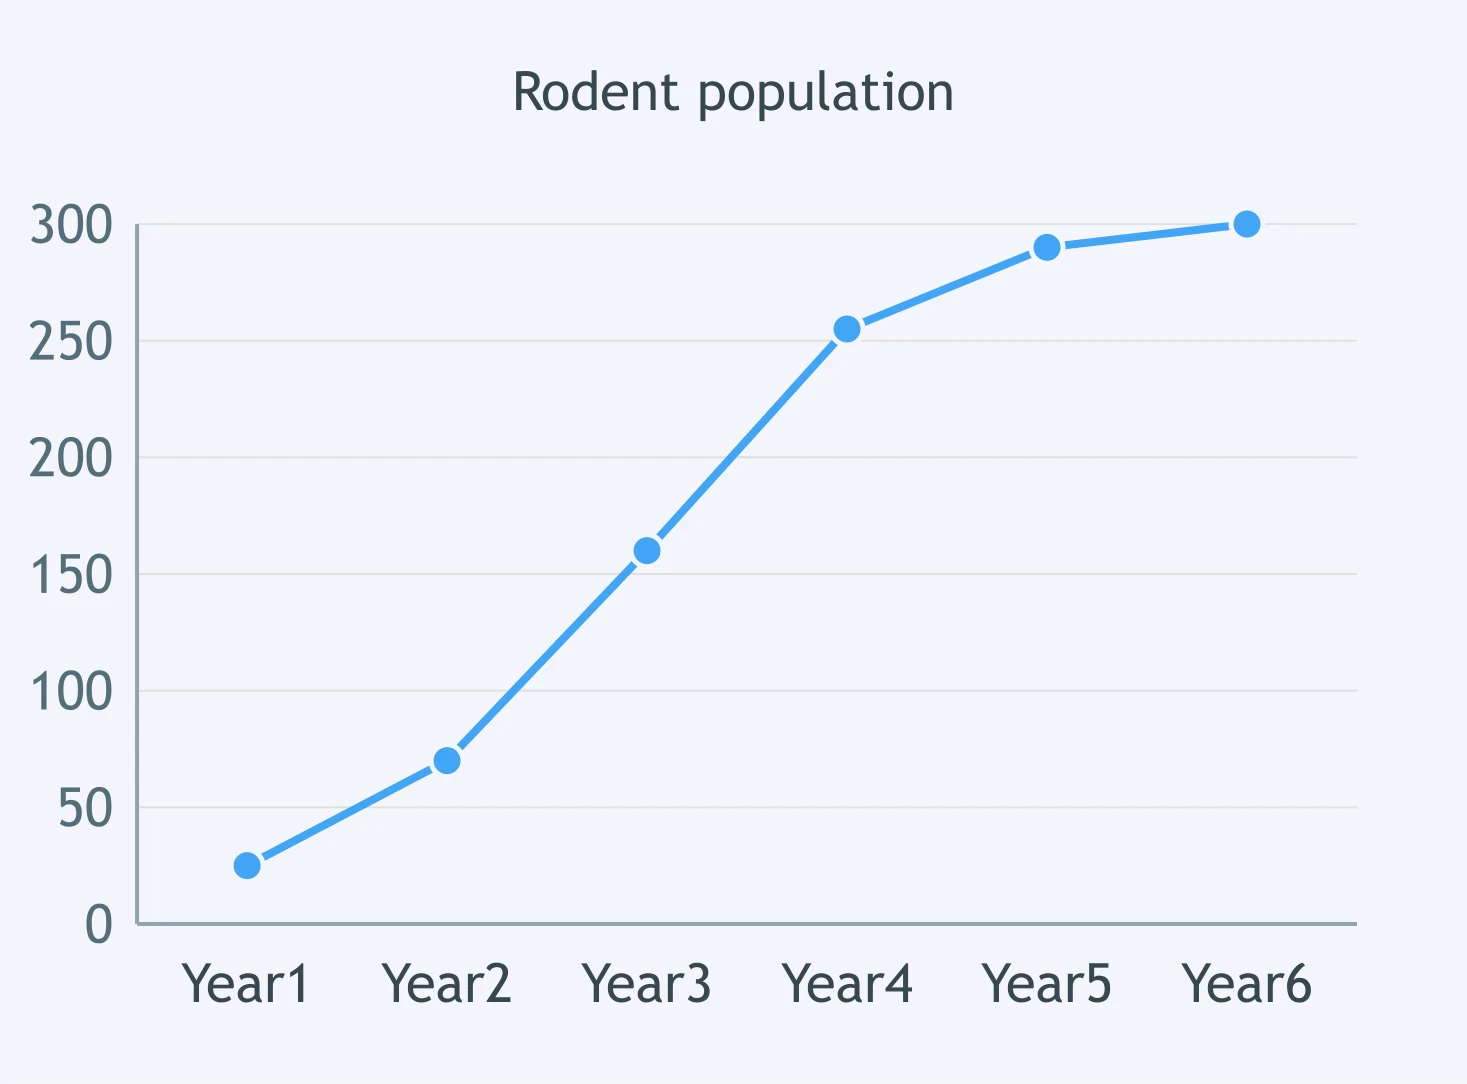
Use the graph. During which interval does the population add the most individuals?
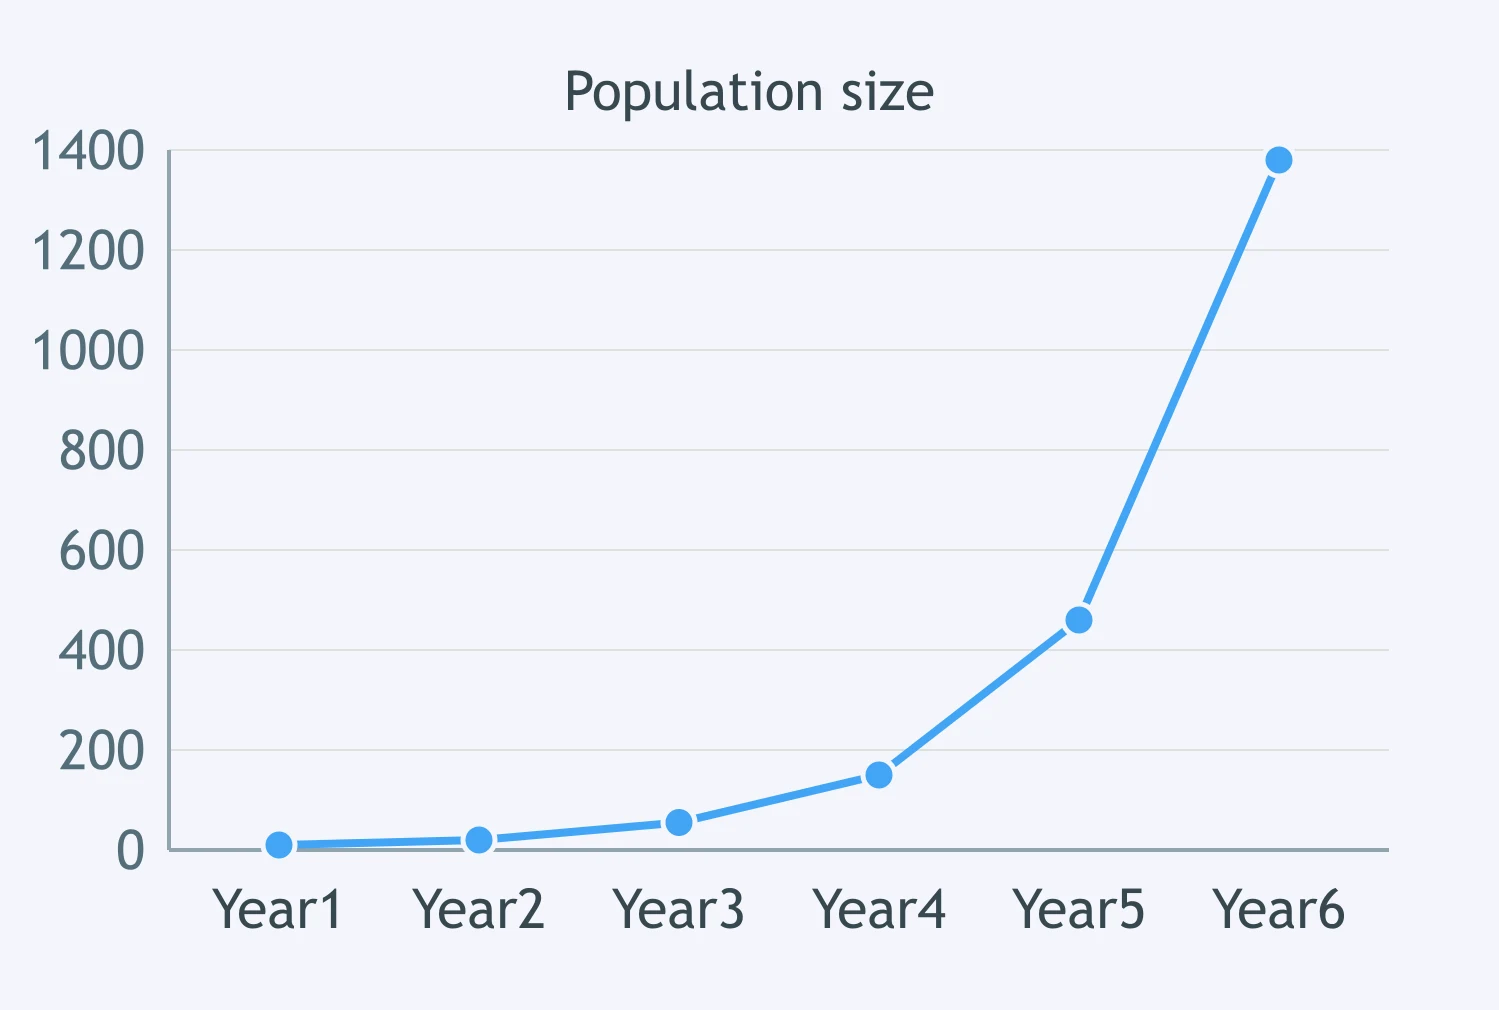
The curve rises quickly at first, then its slope decreases. Which condition most directly explains the slowing growth?
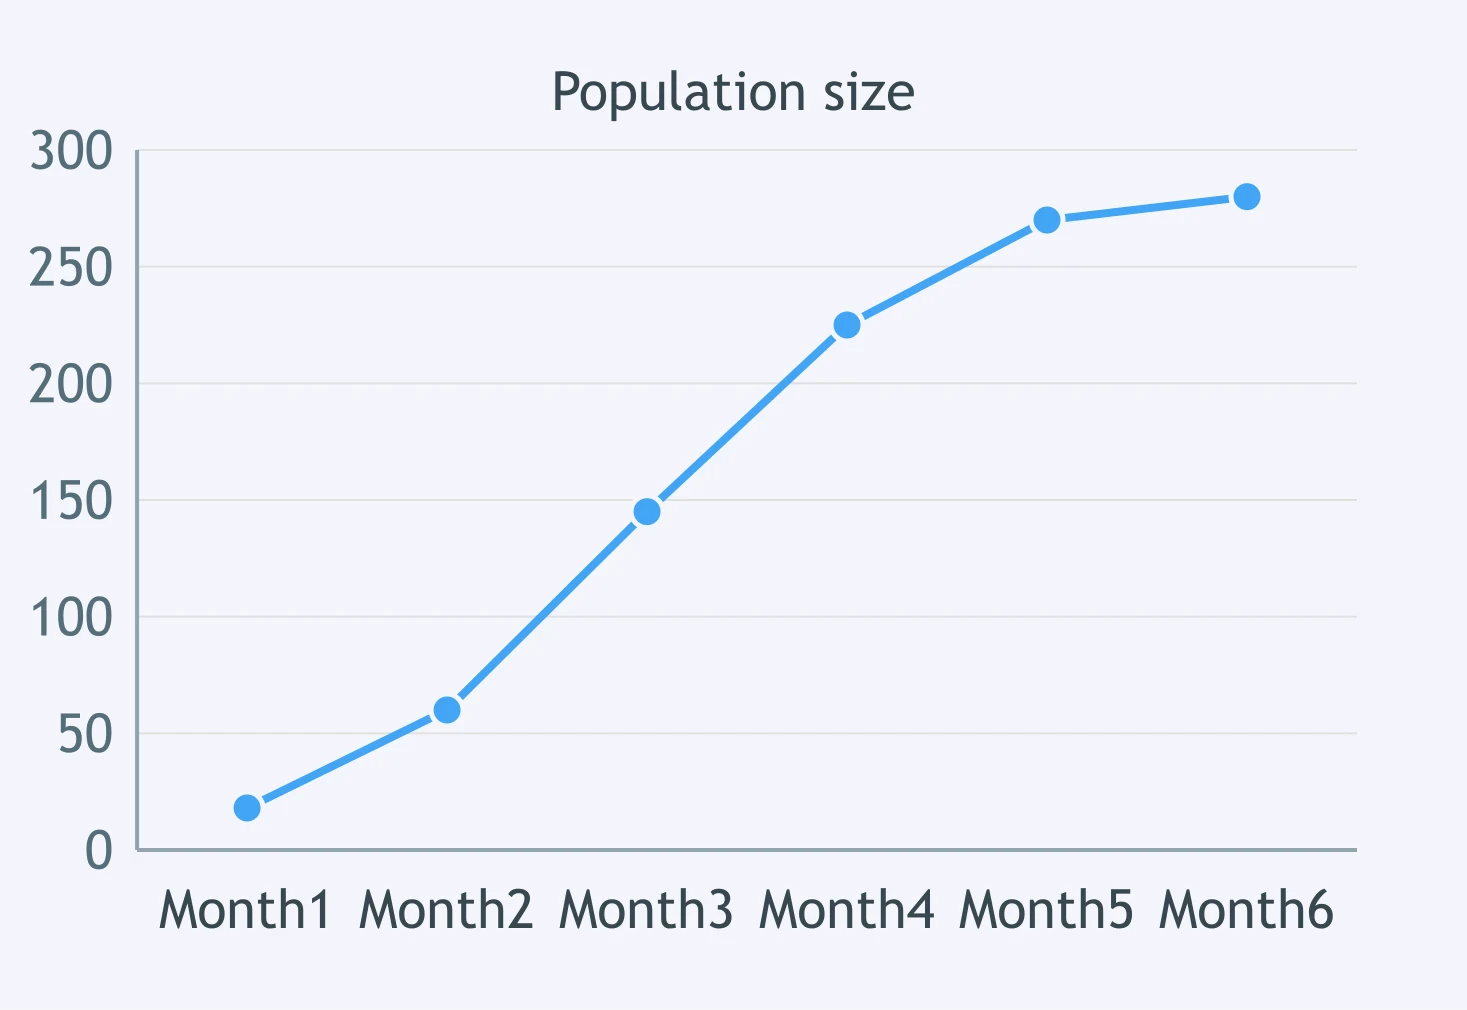
On the graph, the population drops sharply after reaching its highest point. What event does that drop show?
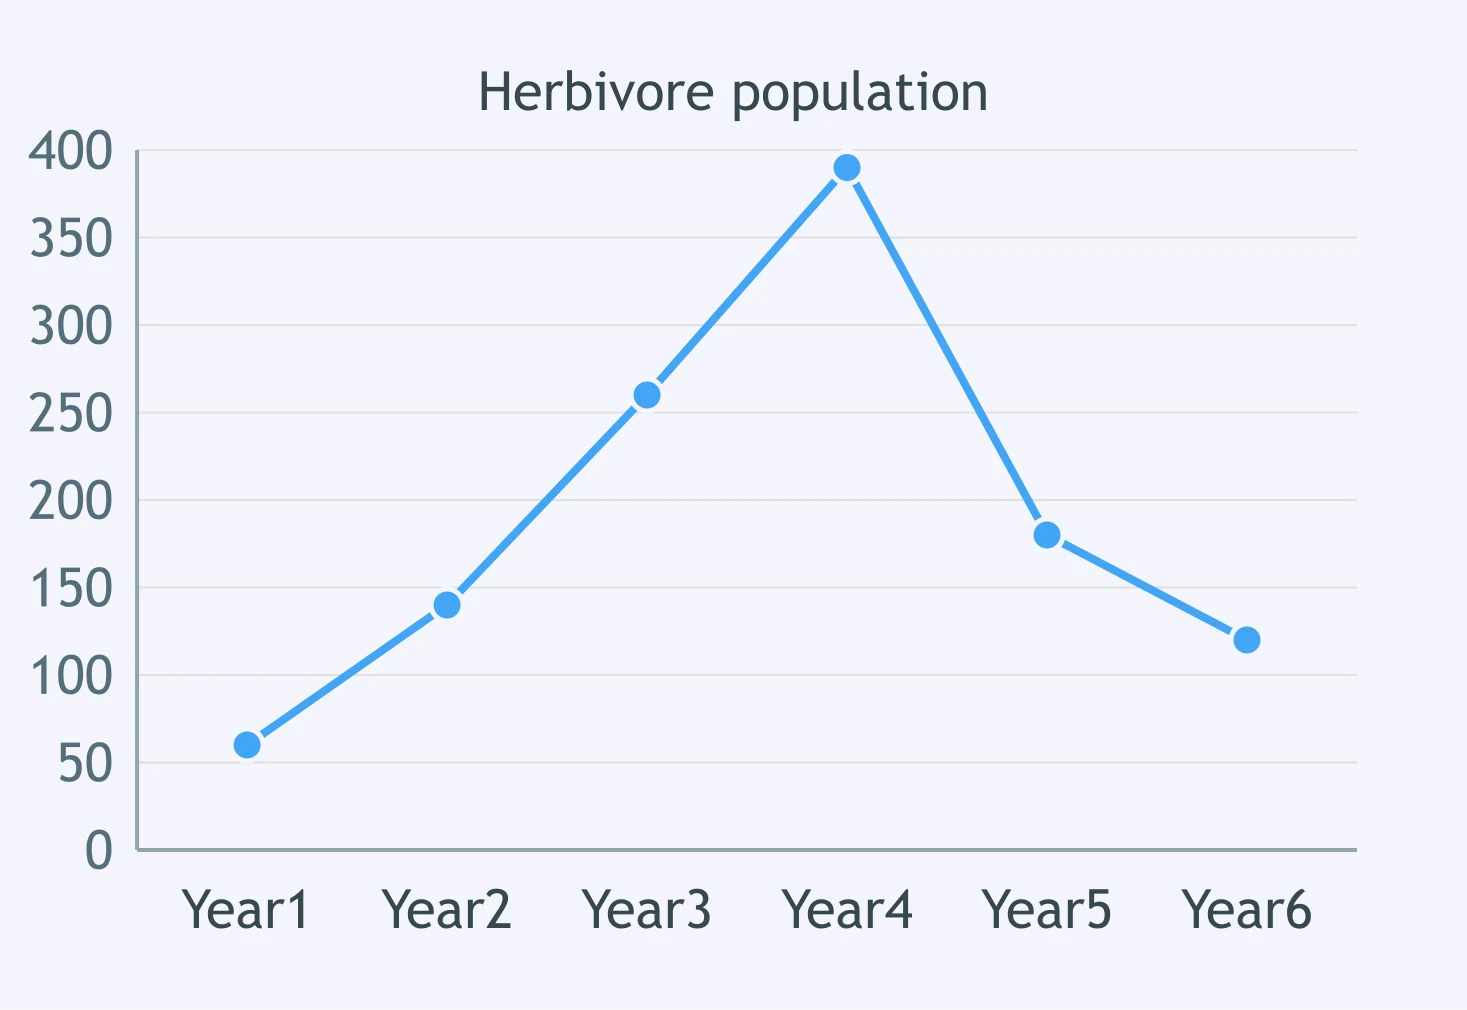
The population fluctuates within a narrow range late in the graph. What does that pattern indicate?
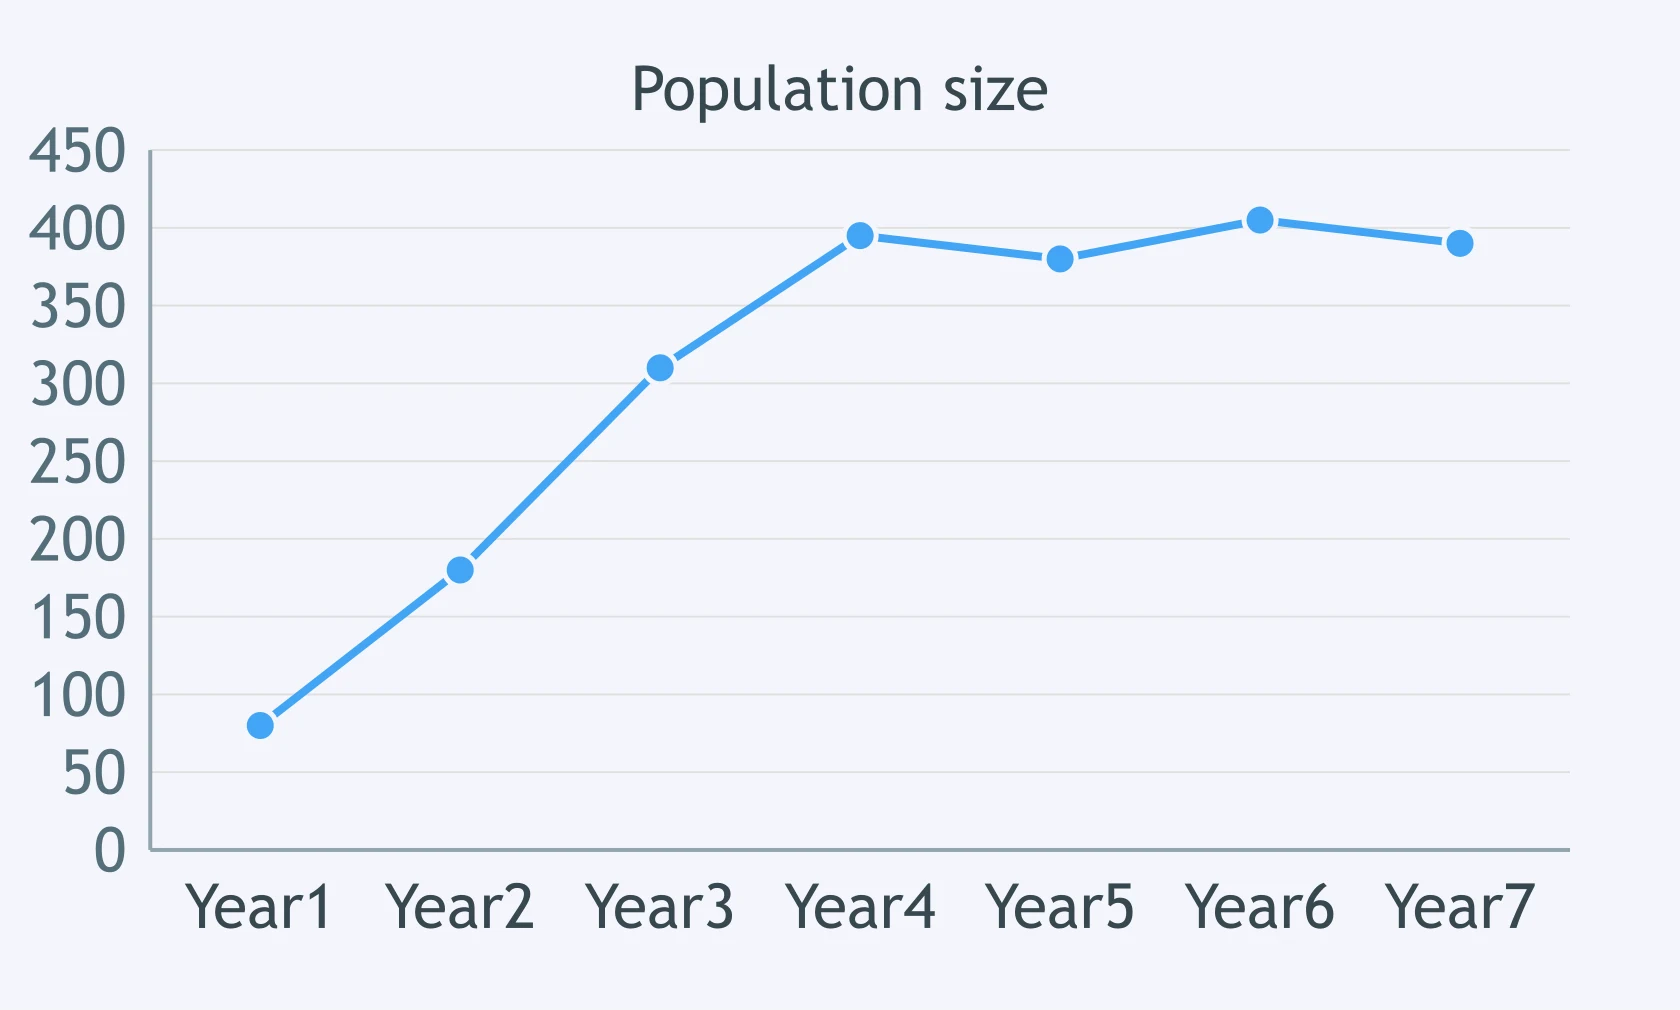
Use the curve. At which time is the population increasing most slowly after its initial rise?
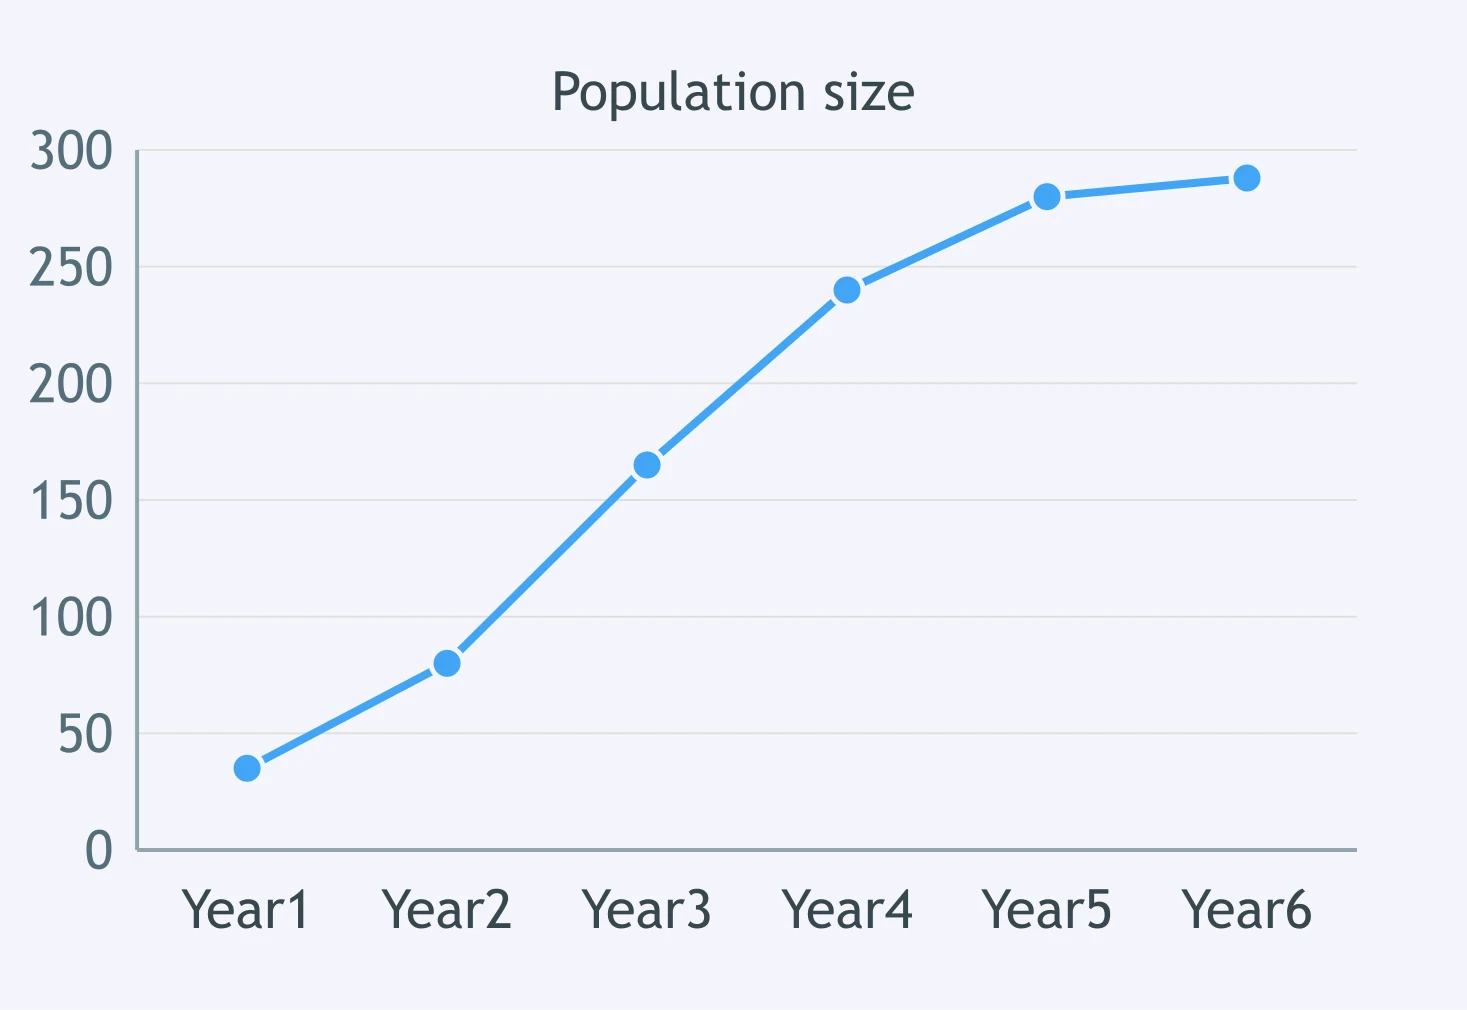
Bacteria enter fresh nutrient broth with abundant food and little waste buildup. Which pattern will they follow at first?
A fenced urban nature preserve has limited nesting sites and food for its songbirds. Over many generations, which pattern is most likely?
Water hyacinth enters a nutrient-enriched pond with no herbivores yet present. What pattern is most likely during the first weeks?
After wolves are reintroduced to a region, territory and prey availability limit their numbers. Which model best predicts their long-term population?
After a hurricane leaves many temporary pools near a neighborhood, mosquito numbers rise while water and breeding space are abundant. What pattern occurs first?
A city pigeon population is limited by a fixed amount of discarded food and nesting space. Which of these limiting factors is density-dependent?
A deer herd grows beyond the amount of winter browse the preserve can support, then crashes. What did the crash follow?
A reindeer population exceeds the lichen available on an island, and starvation increases the next winter. Which limiting factor most directly drives the dieback?
Following several wet years, a grazing area's sheep population rises above what the vegetation can sustain. What is the likely consequence after forage is depleted?
A drought reduces the water and vegetation available in a wildlife refuge while its elk herd remains large. Why might a dieback occur?
A fishery removes many predators, so a small fish population grows past what its food supply can support and then crashes. Which sequence describes this pattern?
Crack the passcode before the zombies get in.
Answer, then swat bugs for bonus points.
Race through questions at your own speed.
Same question on every screen. Fastest wins.

Pick a tile, answer, hit bonuses and steals.
Survivorship Curves and r/K Strategists
25 questions