Loading
by BlastRoom
Take careful measurements, read tables and graphs for patterns, and judge whether a test is fair.
#science_practices#us_grade_5_science
20 questions
One question set, multiple game modes. Tap any game to see it in action. Not sure which to pick?
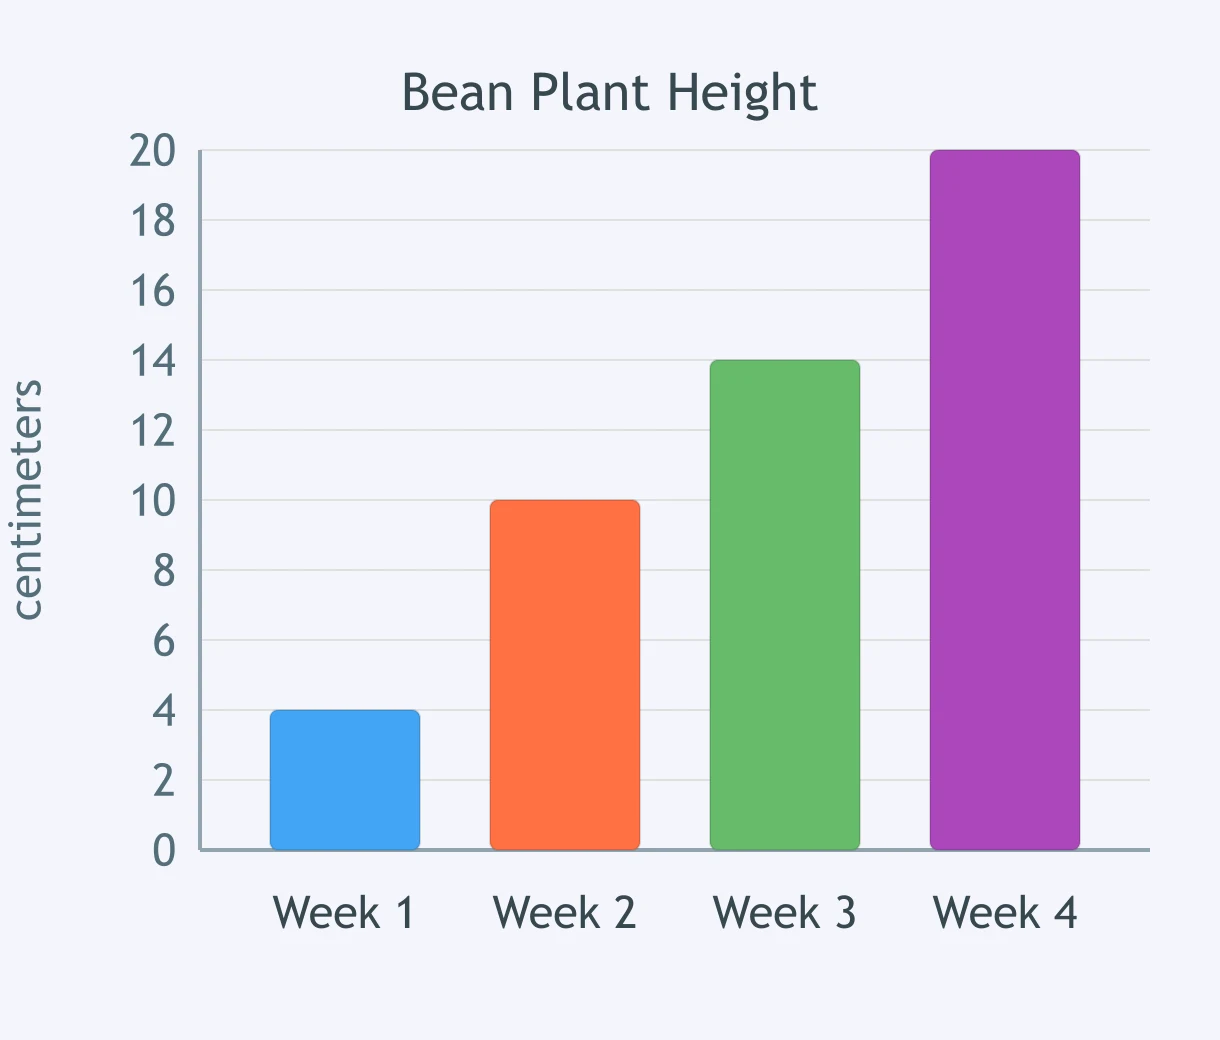
A class measured a bean plant at the end of each week and made this bar graph. How tall was the plant at the end of Week 3?
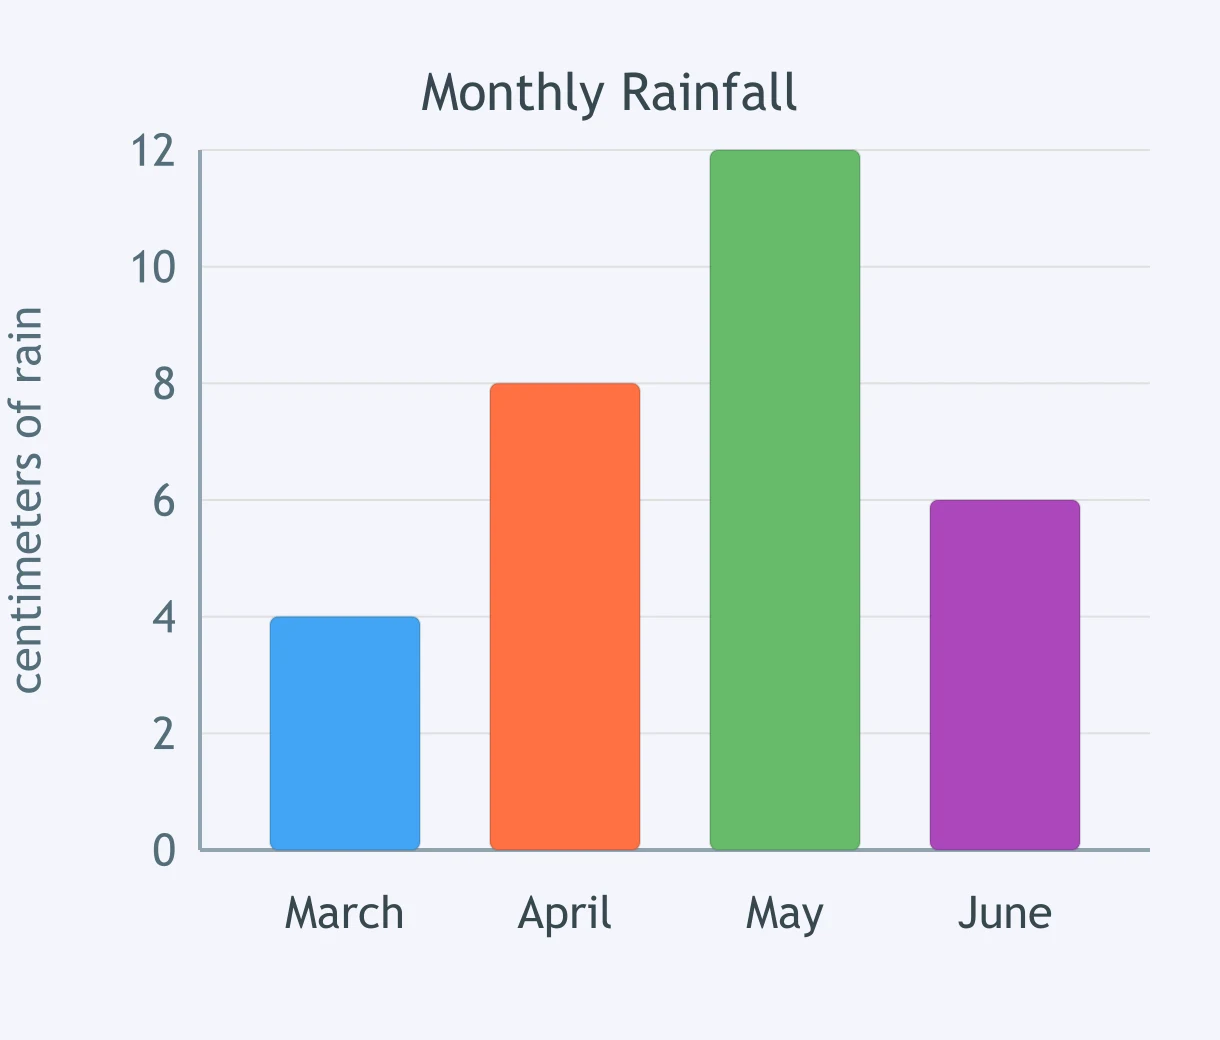
A school measured the rain that fell each month and made this bar graph. How many more centimeters of rain fell in May than in March?
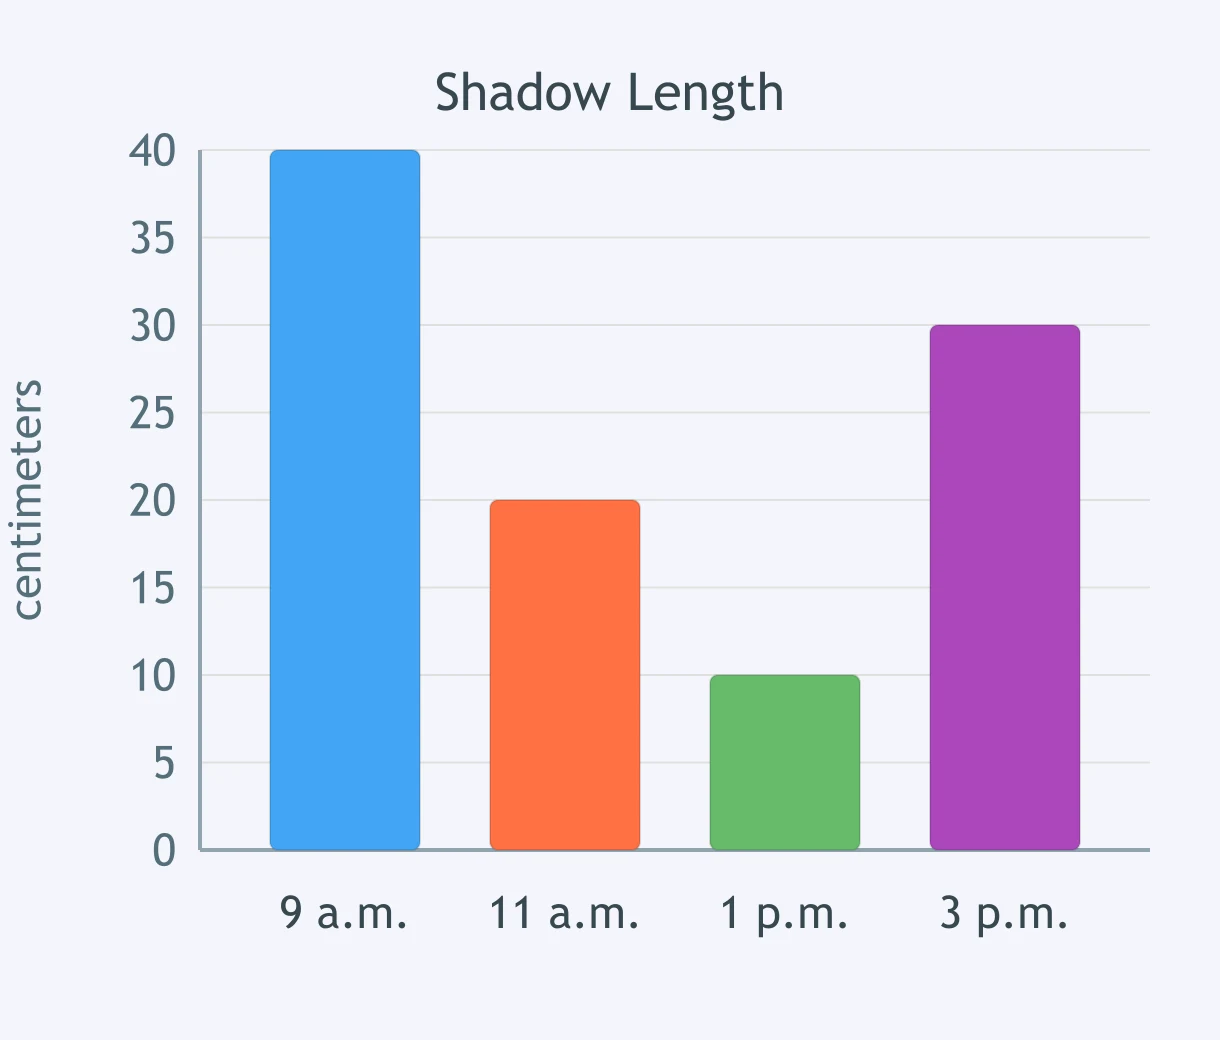
A class measured the shadow of the same stick four times on one sunny day and graphed the results. What pattern do the measurements show?
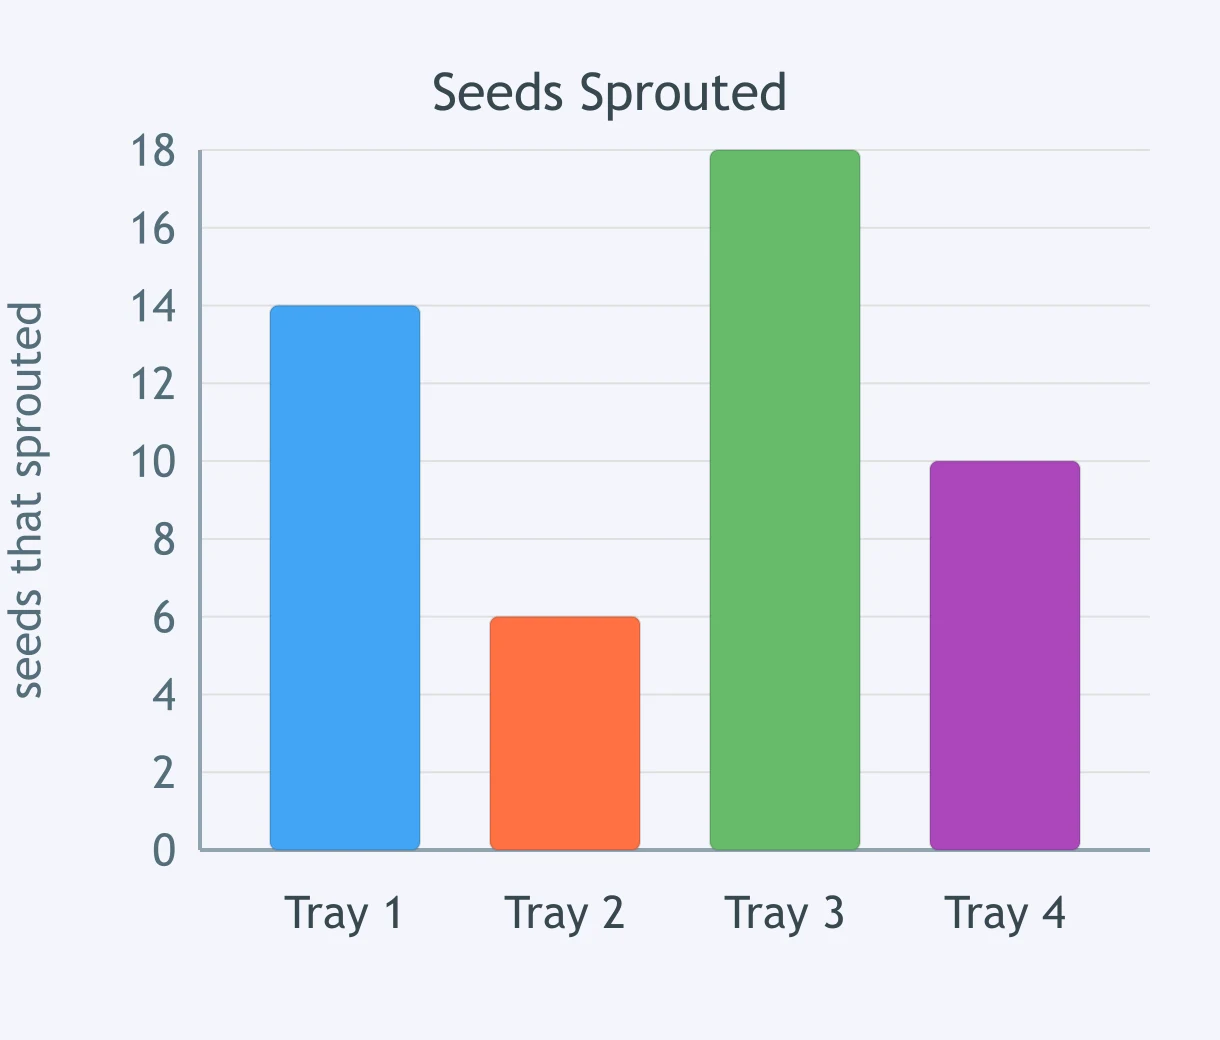
Four trays of seeds were planted on the same day and watered the same way. The graph shows how many seeds sprouted in each tray. Which tray had the fewest sprouts?
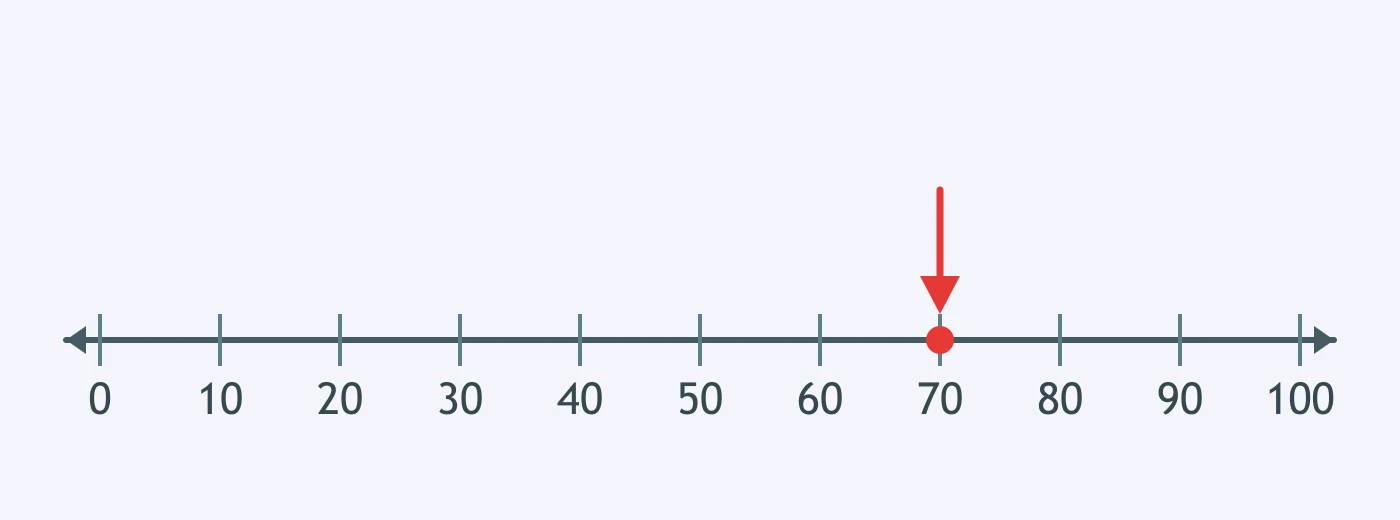
A student weighed a rock on a balance scale and marked the reading on this number line. What is the mass of the rock?
A student measured a leaf and marked its length on this number line. Each small tick stands for one centimeter. How long is the leaf?
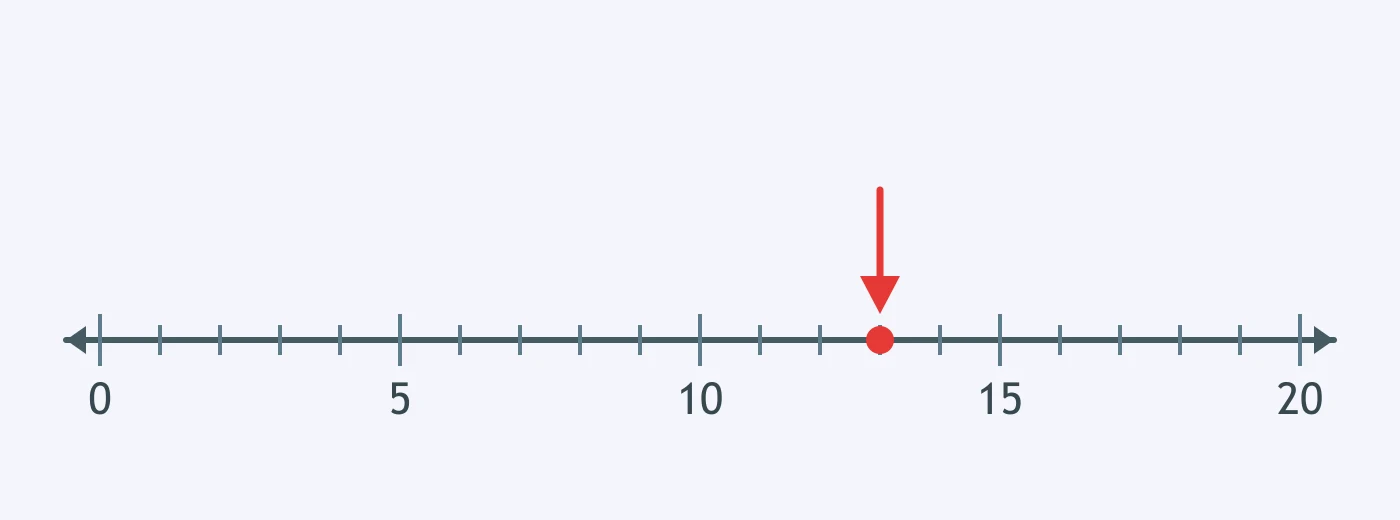
A team heated water and recorded its temperature every 5 minutes: 20 degrees, 24 degrees, 28 degrees, then 32 degrees Celsius. What pattern do their data show?
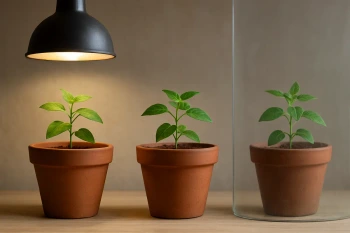
A team wants to find out whether the kind of soil changes how fast water drains through it. They fill three cups with three different soils. Each cup is the same size and holds the same amount of soil. What else must they keep the same in every cup?
A student tested whether a steeper ramp makes a toy car roll farther. She raised the ramp higher and also swapped in a heavier car. Why can she not trust her result?
A class asks, "Which flower in the garden is the prettiest?" Why is this question not a testable science question?
A team needs to find out how much matter is in a small rock before and after they soak it in water. Which tool gives them the measurement they need?
A student writes only the number 9 in the data table for the length of a leaf. Why can other scientists not use this measurement?
A team timed how long the same size ice cube took to melt in three places. In the shade it took 30 minutes, in a warm room 20 minutes, and in a sunny window 12 minutes. What do these data show?
Scientists usually put their measurements into a table or a graph instead of leaving them written in sentences. What is the main reason for doing this?
A student claims that raising one end of a ramp higher makes a toy car roll a greater distance. Which measurements would best support that claim?
A team pours water over sand in a tray to build a model of how a river changes the land. How does this model help them investigate?
Four students each measured the same piece of string. They recorded 24 cm, 25 cm, 24 cm, and 42 cm. What should the group do about the 42 cm reading?
Data means the measurements and observations a scientist collects during an investigation.
A scientist should record only the measurements that match what she expected to happen.
Measuring the same thing several times and comparing the results helps show whether a measurement can be trusted.
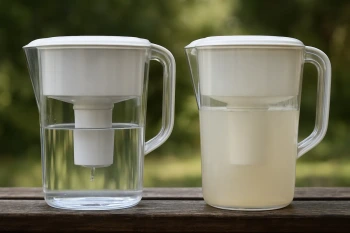
Engineering Design: Comparing Solutions
20 questions
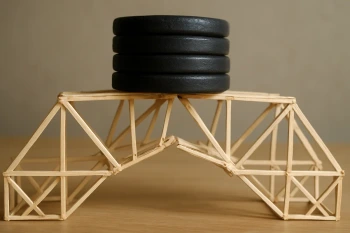
Engineering Design: Fair Tests and Failure Points
20 questions
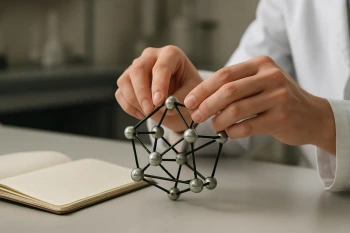
Science Practices: Models and Evidence-Based Arguments
20 questions
Science Practices: Fair Tests and Controlling Variables
20 questions
Science Practices: Evaluating Competing Claims
20 questions
Crack the passcode before the zombies get in.

Pick a tile, answer, hit bonuses and steals.