Loading
by BlastRoom
Telling map scale from scale of analysis, and choosing the right scale for a question.
#us_hs_human_geography
30 questions
One question set, multiple game modes. Tap any game to see it in action. Not sure which to pick?
Answer to place stones and capture territory.
Outrun the snow together.
Earn blasts, then hunt the other team.
Answer to earn energy, then climb.

The class blasts through walls together.
Bid on mystery lots. Most money wins.
Sell tours. Nice, standard, or a total scam.

Answer, restock, and serve the rush.
More correct answers pulls the rope your way.
Answer, then shoot down the alien wave.
Answer, then tap to leap the frozen ridge.
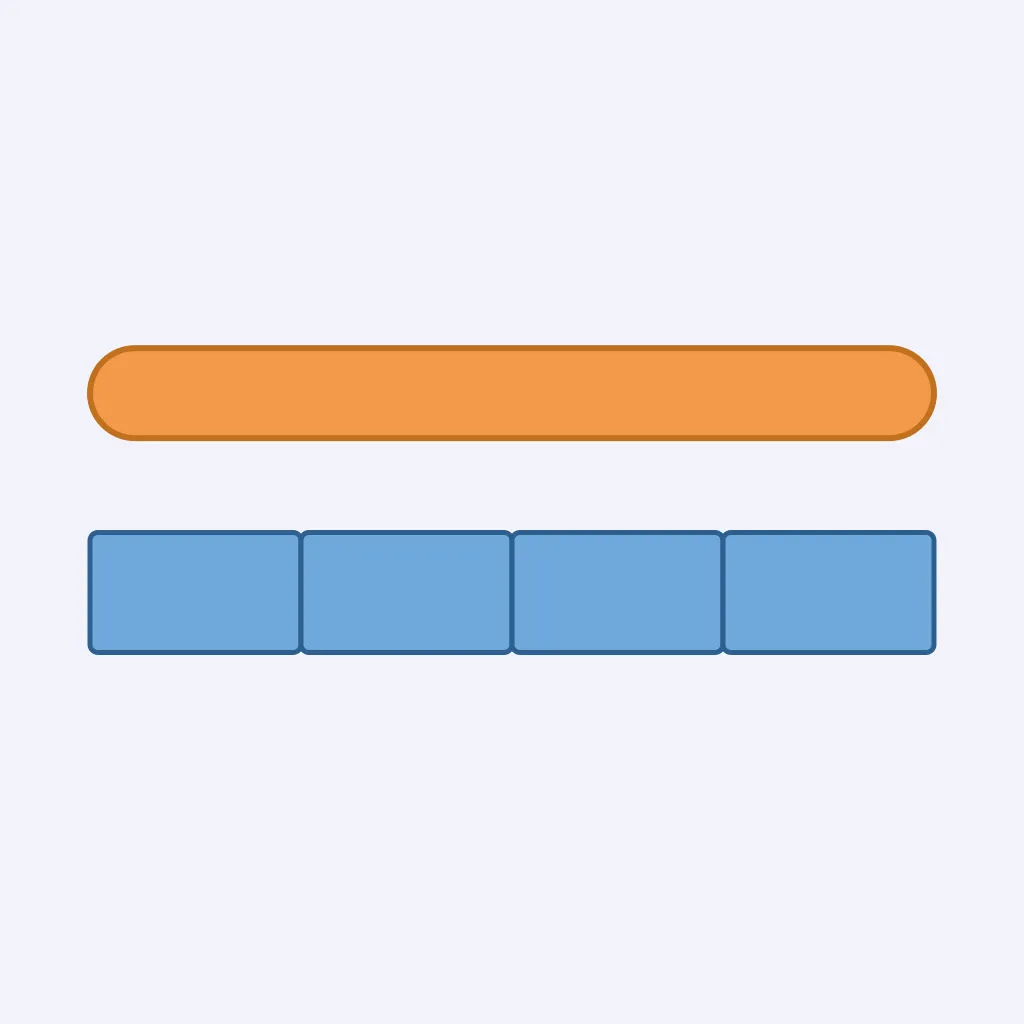
Use the scale figure. Each short segment stands for 0.5 mile on the ground, and a route spans all segments shown. What is the ground distance?
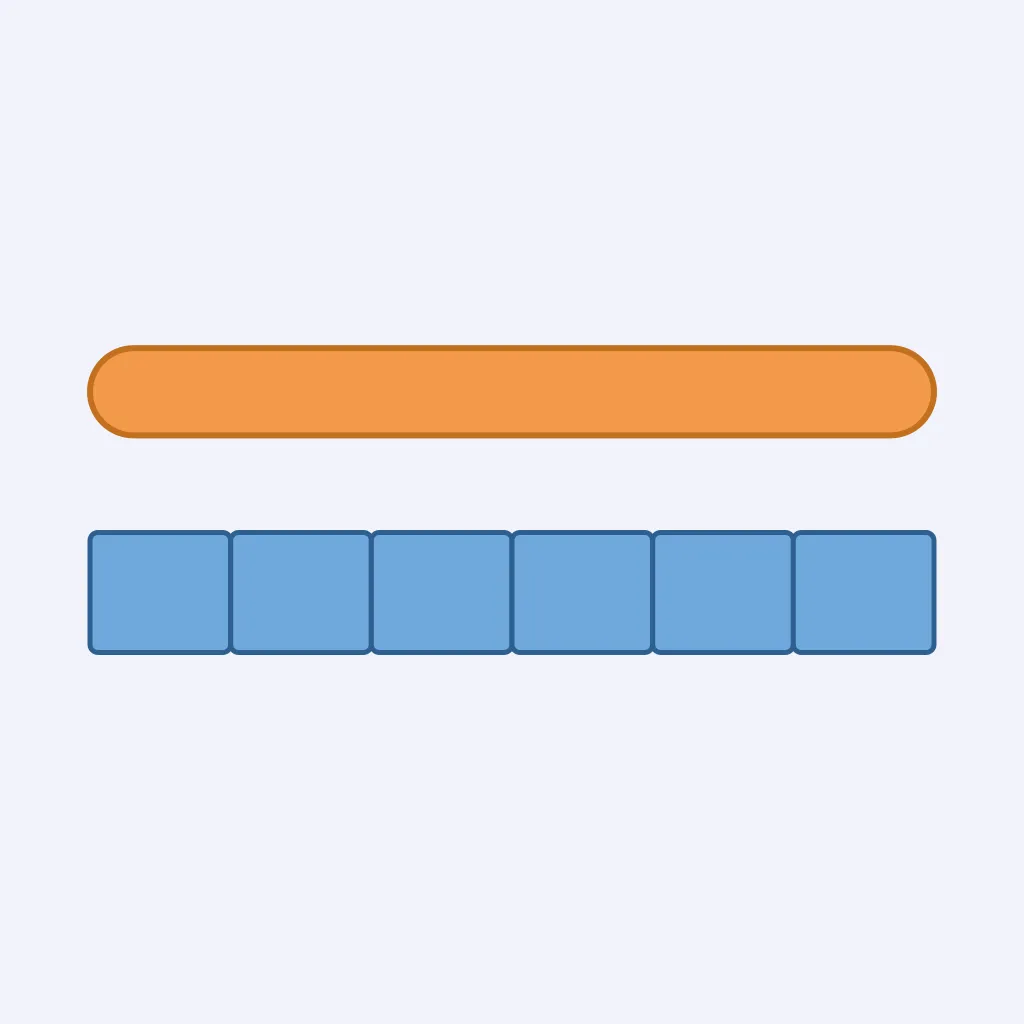
In the scale figure, each equal segment represents 3 miles. A road covers the full length shown. How far is the road on the ground?
A map scale says 1 inch represents 4 miles. Two towns are 2.5 inches apart on the map. How far apart are they on the ground?
On a highway map, 1 inch represents 12 miles. A river crossing is 0.75 inch from a town. What ground distance does that show?
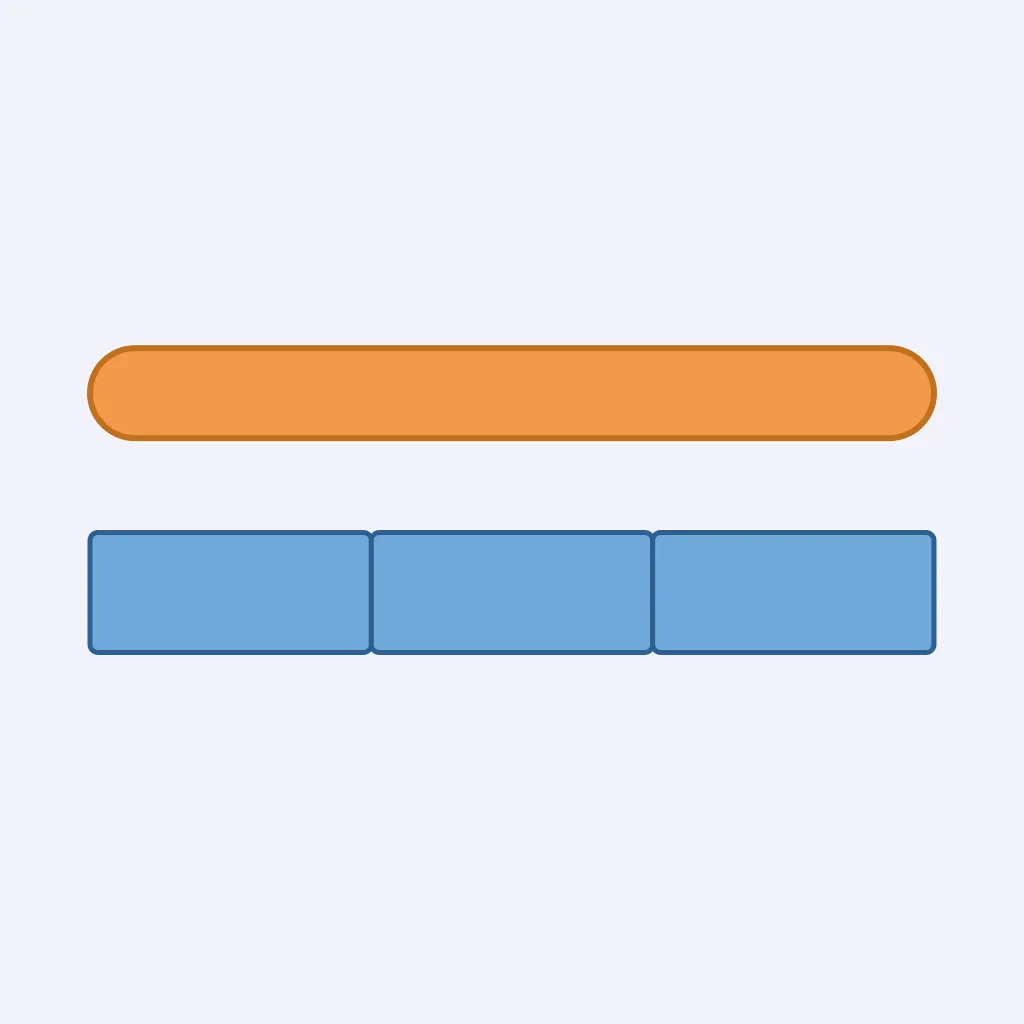
Use the bar scale figure. Each segment equals 5 miles, and a county road runs across all segments shown. What ground distance is represented?
The map says 1 inch on the map represents 1 mile on the ground. A trail is 3 inches long on the map. What is the trail's ground length?
On a parcel map, 1 inch represents 2,000 feet. A property line measures 4 inches on the map. What is the ground length?
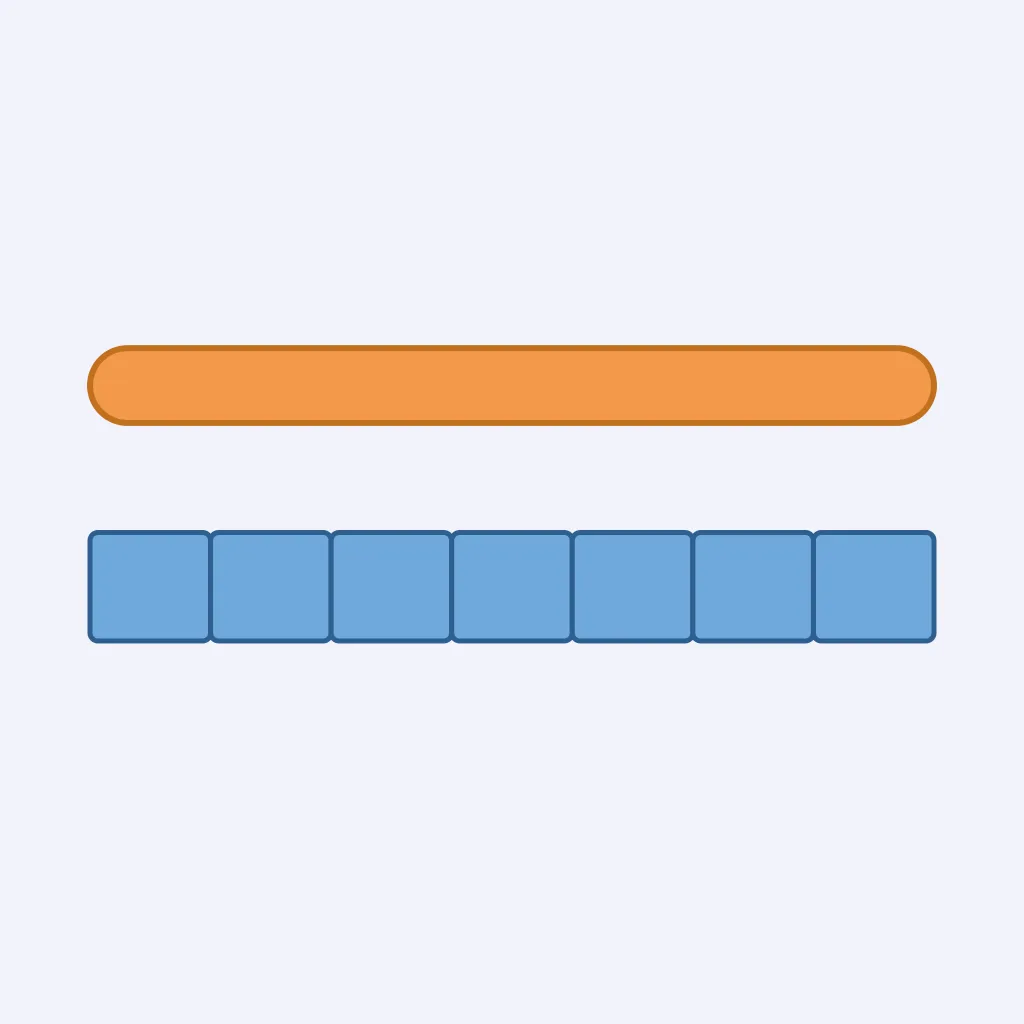
A map's scale figure has equal segments worth 2 miles each. A bike route covers the whole figure. What is the route's ground distance?
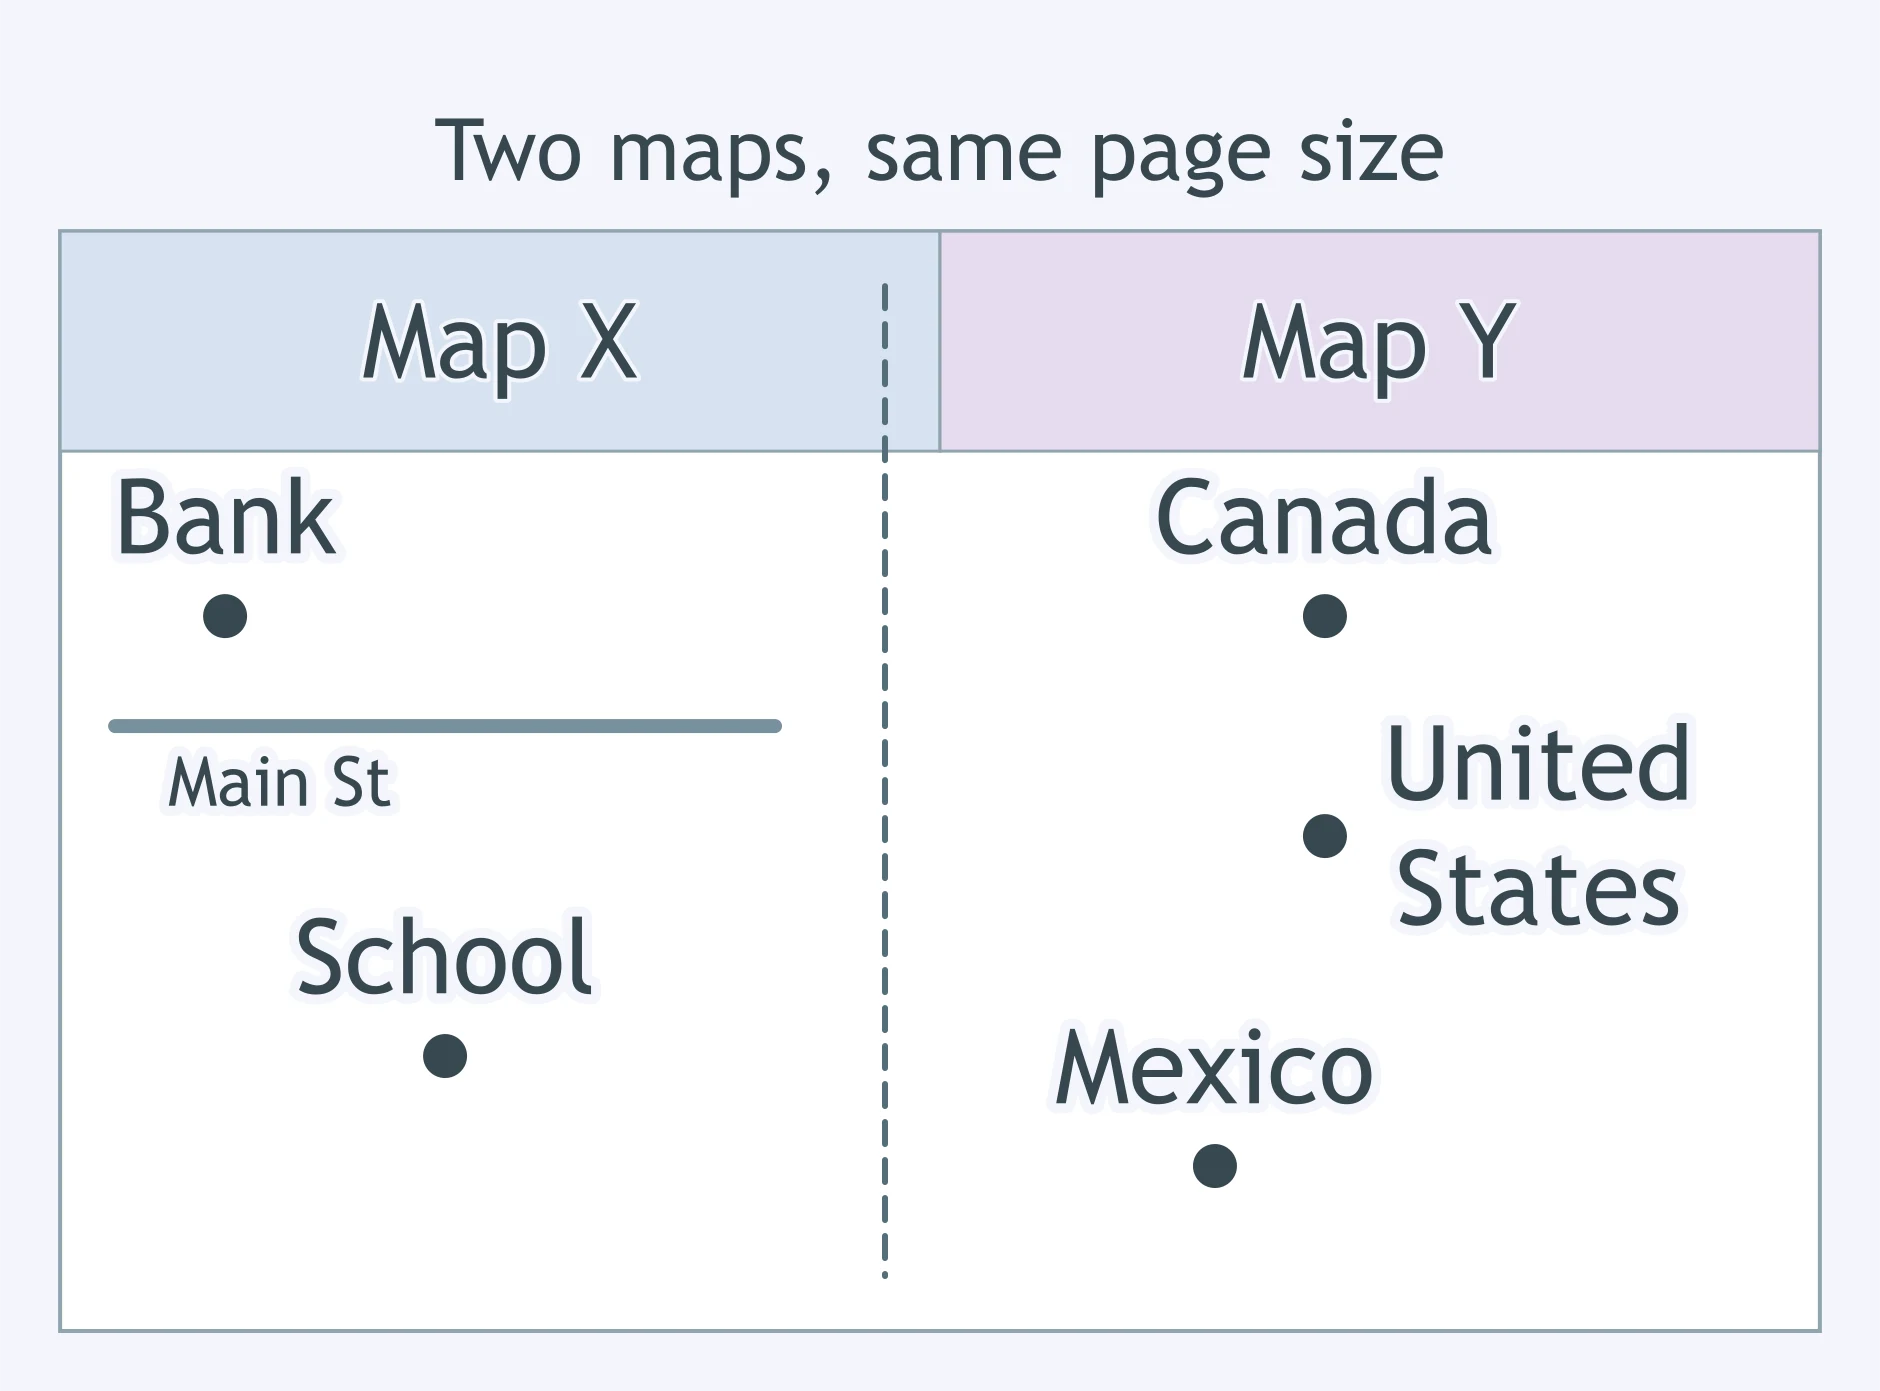
Map X fills a page with one city block and individual buildings. Map Y fills the same page with North America. Which statement is correct?
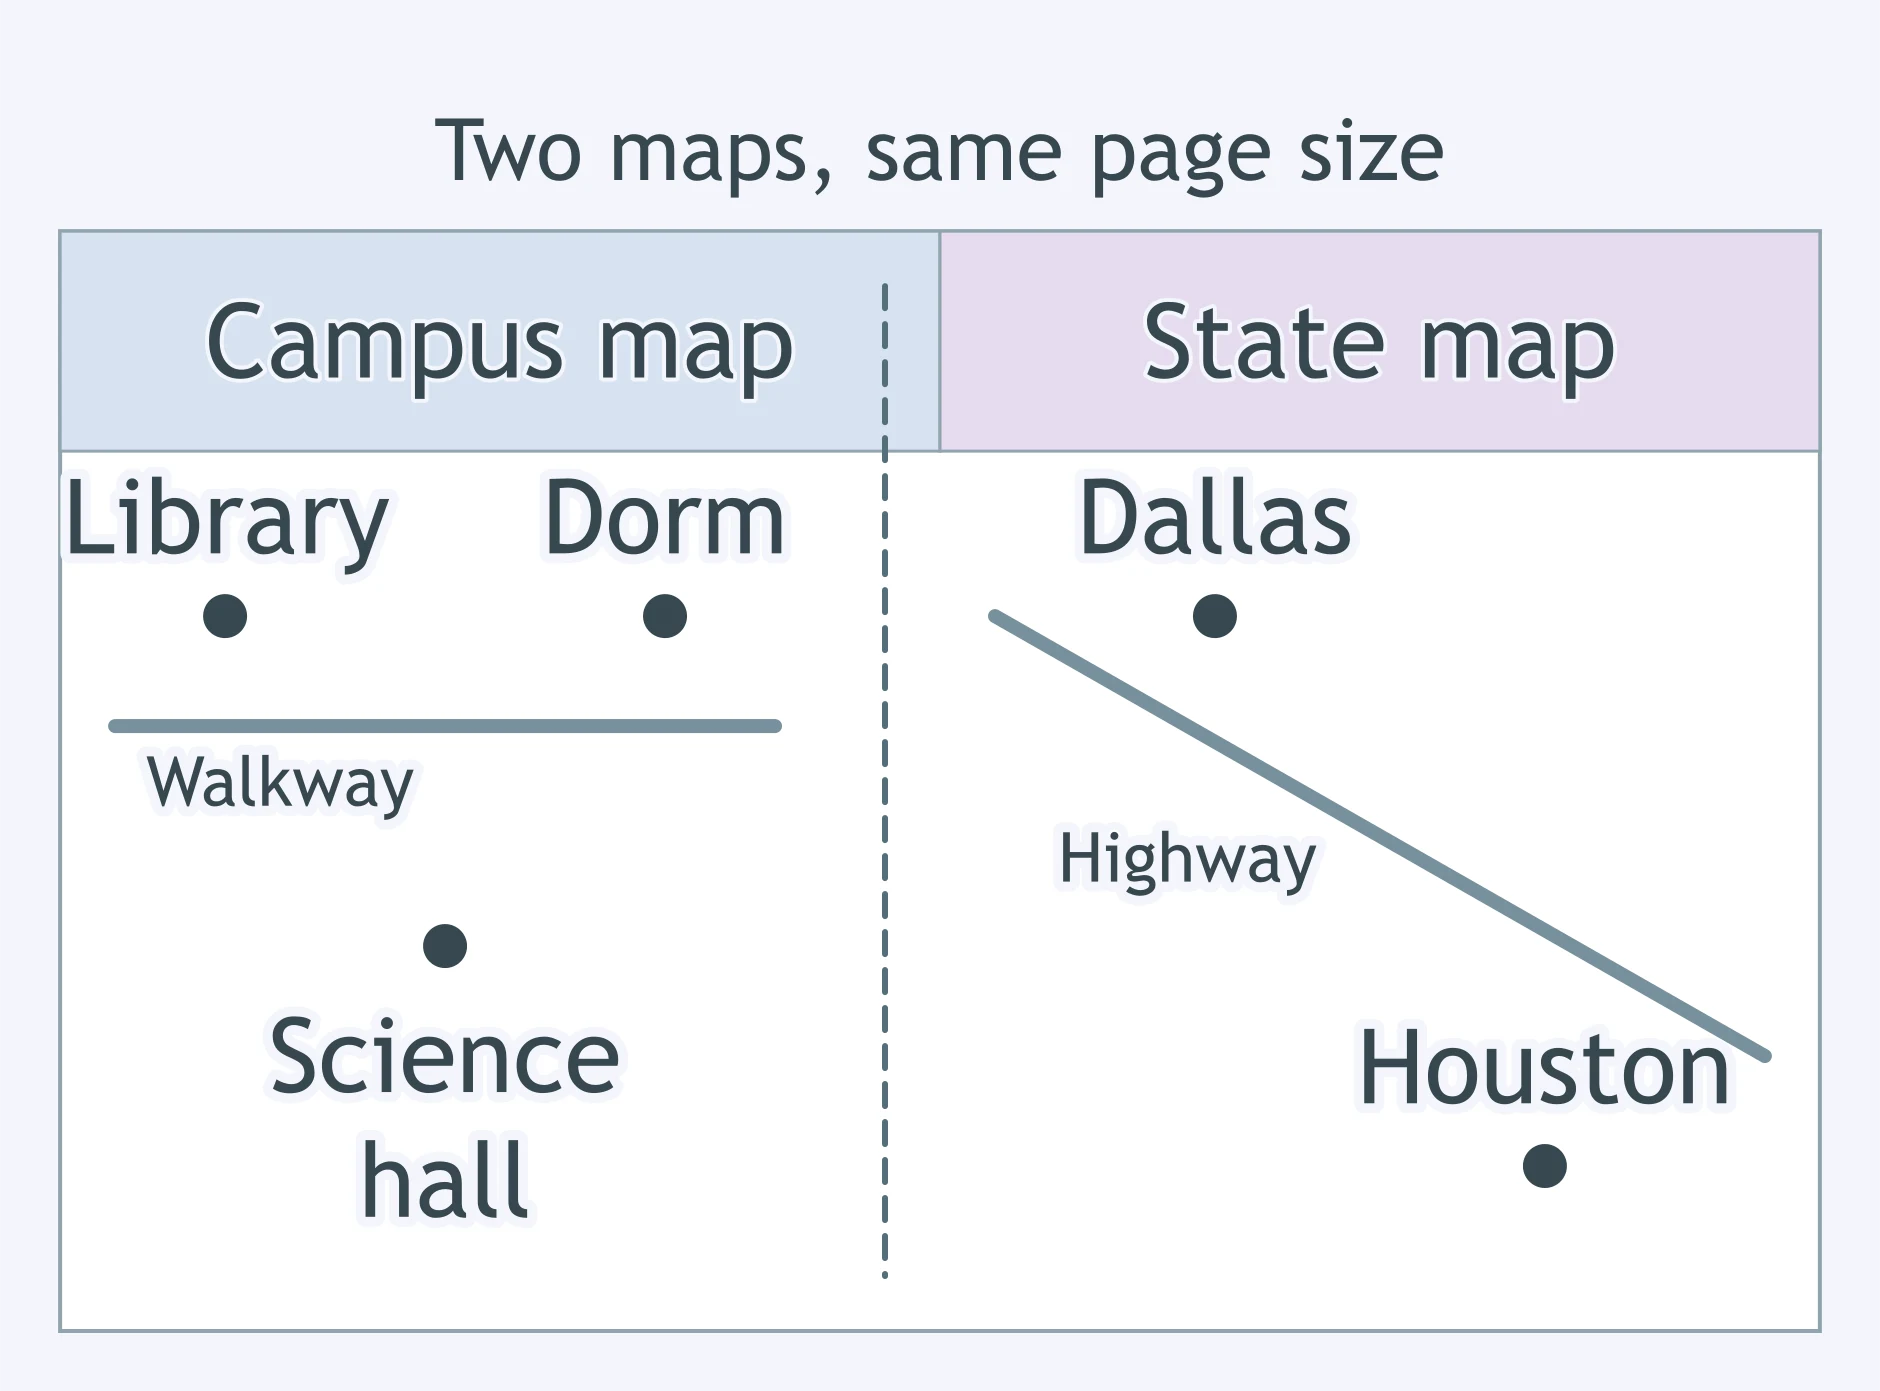
A campus map shows every building entrance. A state map shows major highways across Texas. Which map has the larger scale?
One sheet maps a county's neighborhoods, while another same-size sheet maps the whole world. How should the two be classified?
A map will be enlarged on a copier before it is posted. Which kind of map scale will still be correct after the copy is enlarged?
Map A shows 1 inch as 1 mile. Map B shows 1 inch as 500 miles. Which map is larger scale?
A map's representative fraction is 1:63,360. There are 63,360 inches in a mile. What does 1 inch on the map represent on the ground?
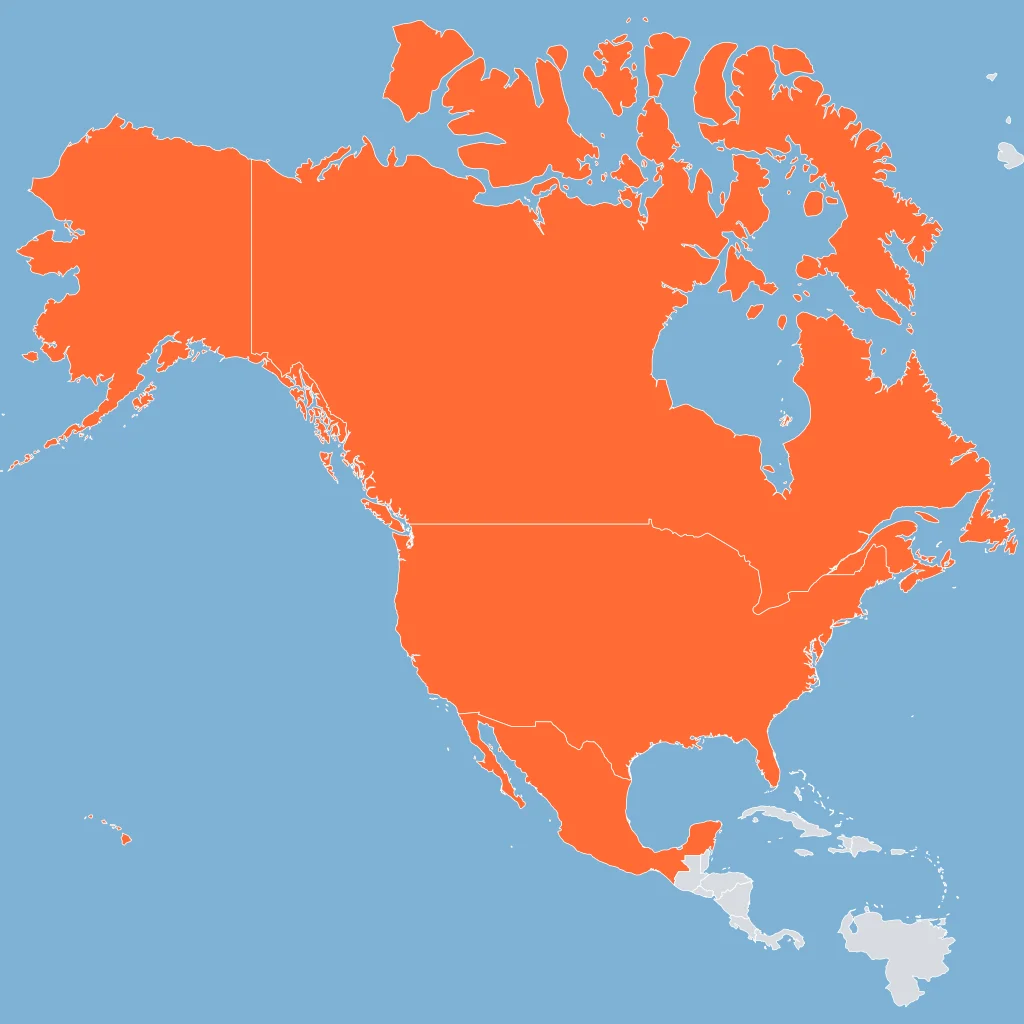
A report compares infant mortality rates for the United States, Canada, and Mexico as whole countries. At what scale of analysis is the report framed?
A geographer studies lunch options within a ten-minute walk of one high school. What scale of analysis fits that claim?
Researchers compare migration flows among Europe, South Asia, and Latin America. At what scale is the comparison framed?
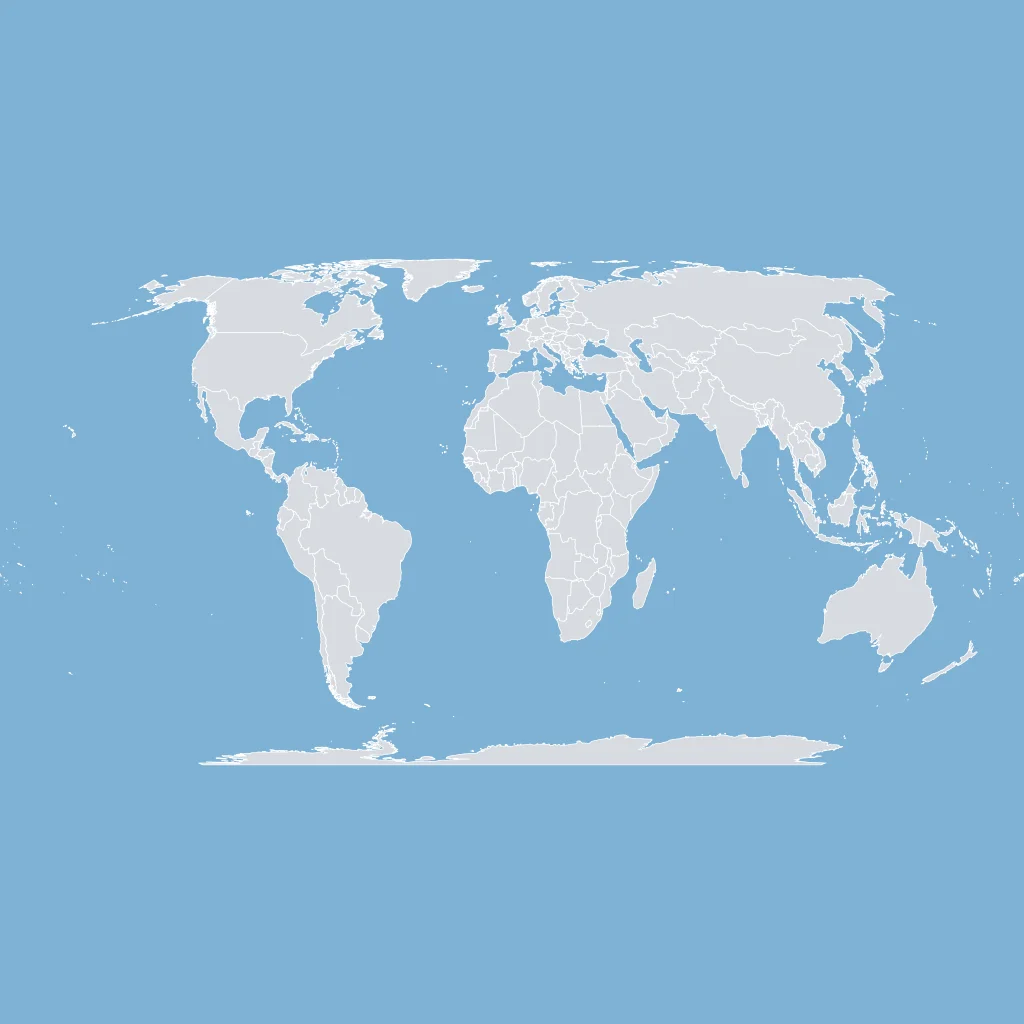
A study estimates carbon emissions from countries around the world to describe a worldwide pattern. What scale of analysis is being used?
A Georgia map shades median income by county and compares counties within the state. What scale of analysis is the claim using?
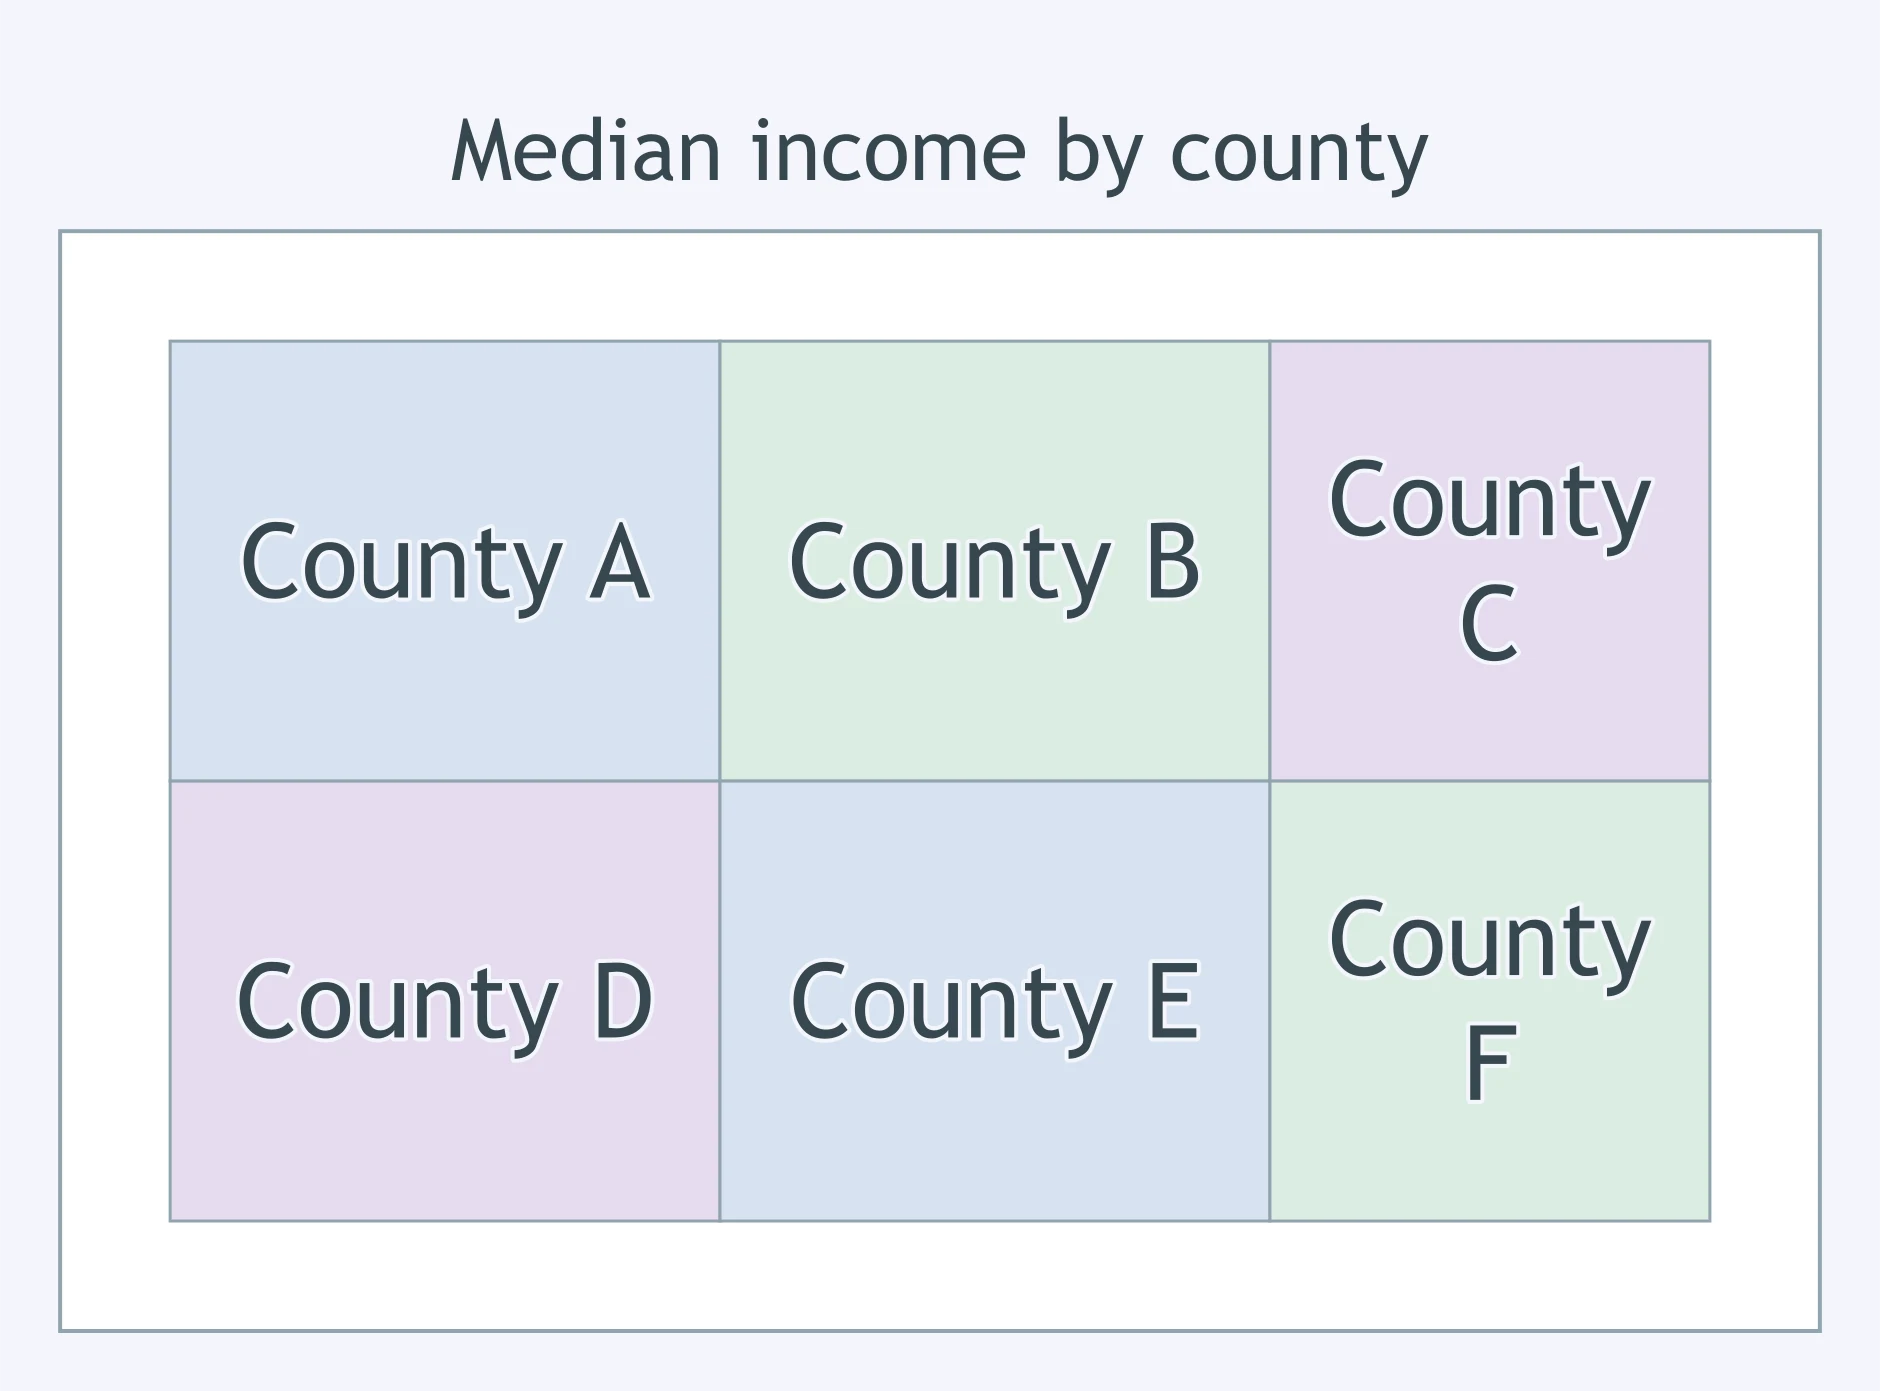
A report groups food insecurity rates by continent. Which scale of analysis best describes the report?
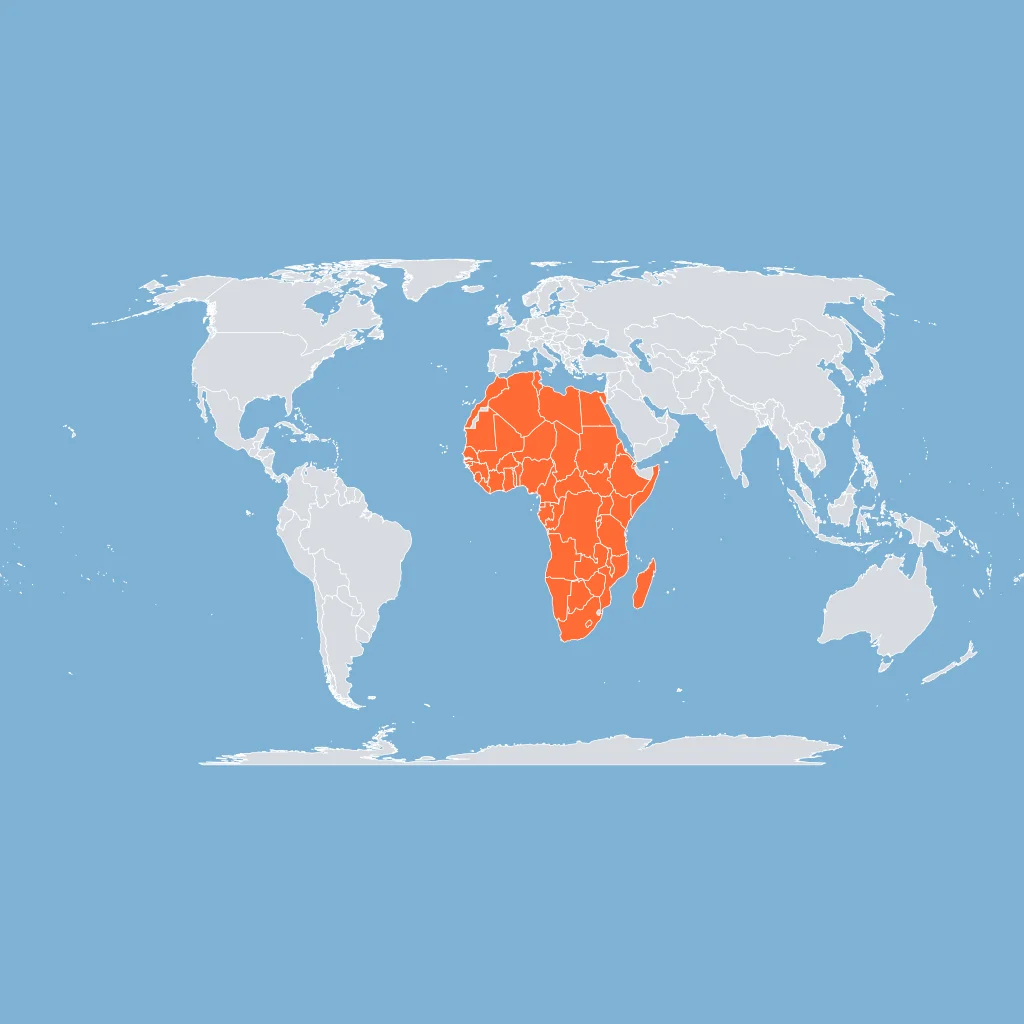
A claim says the share of people living in cities has risen in nearly every world region since 1950. Which scale frames the claim?
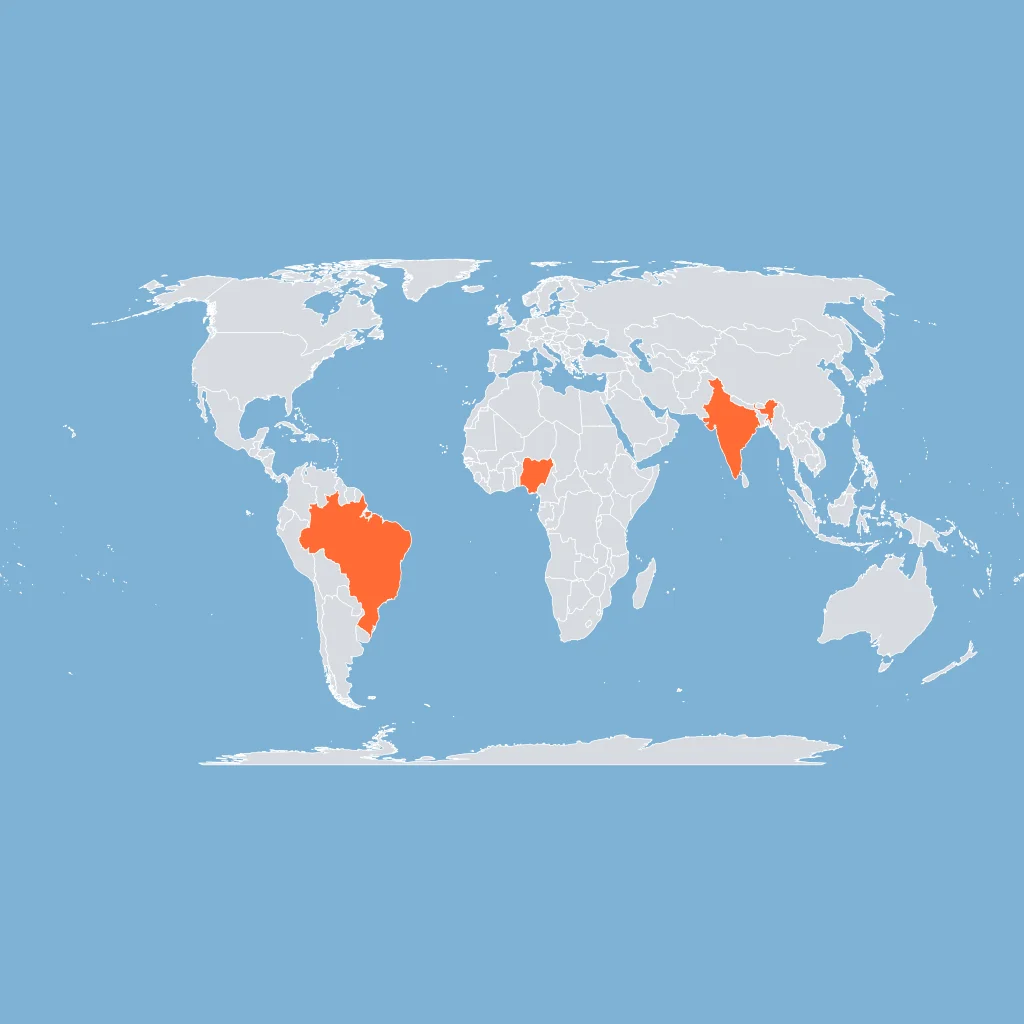
A study ranks Brazil, India, and Nigeria by urban primacy, treating each country as one unit. What scale of analysis is used?
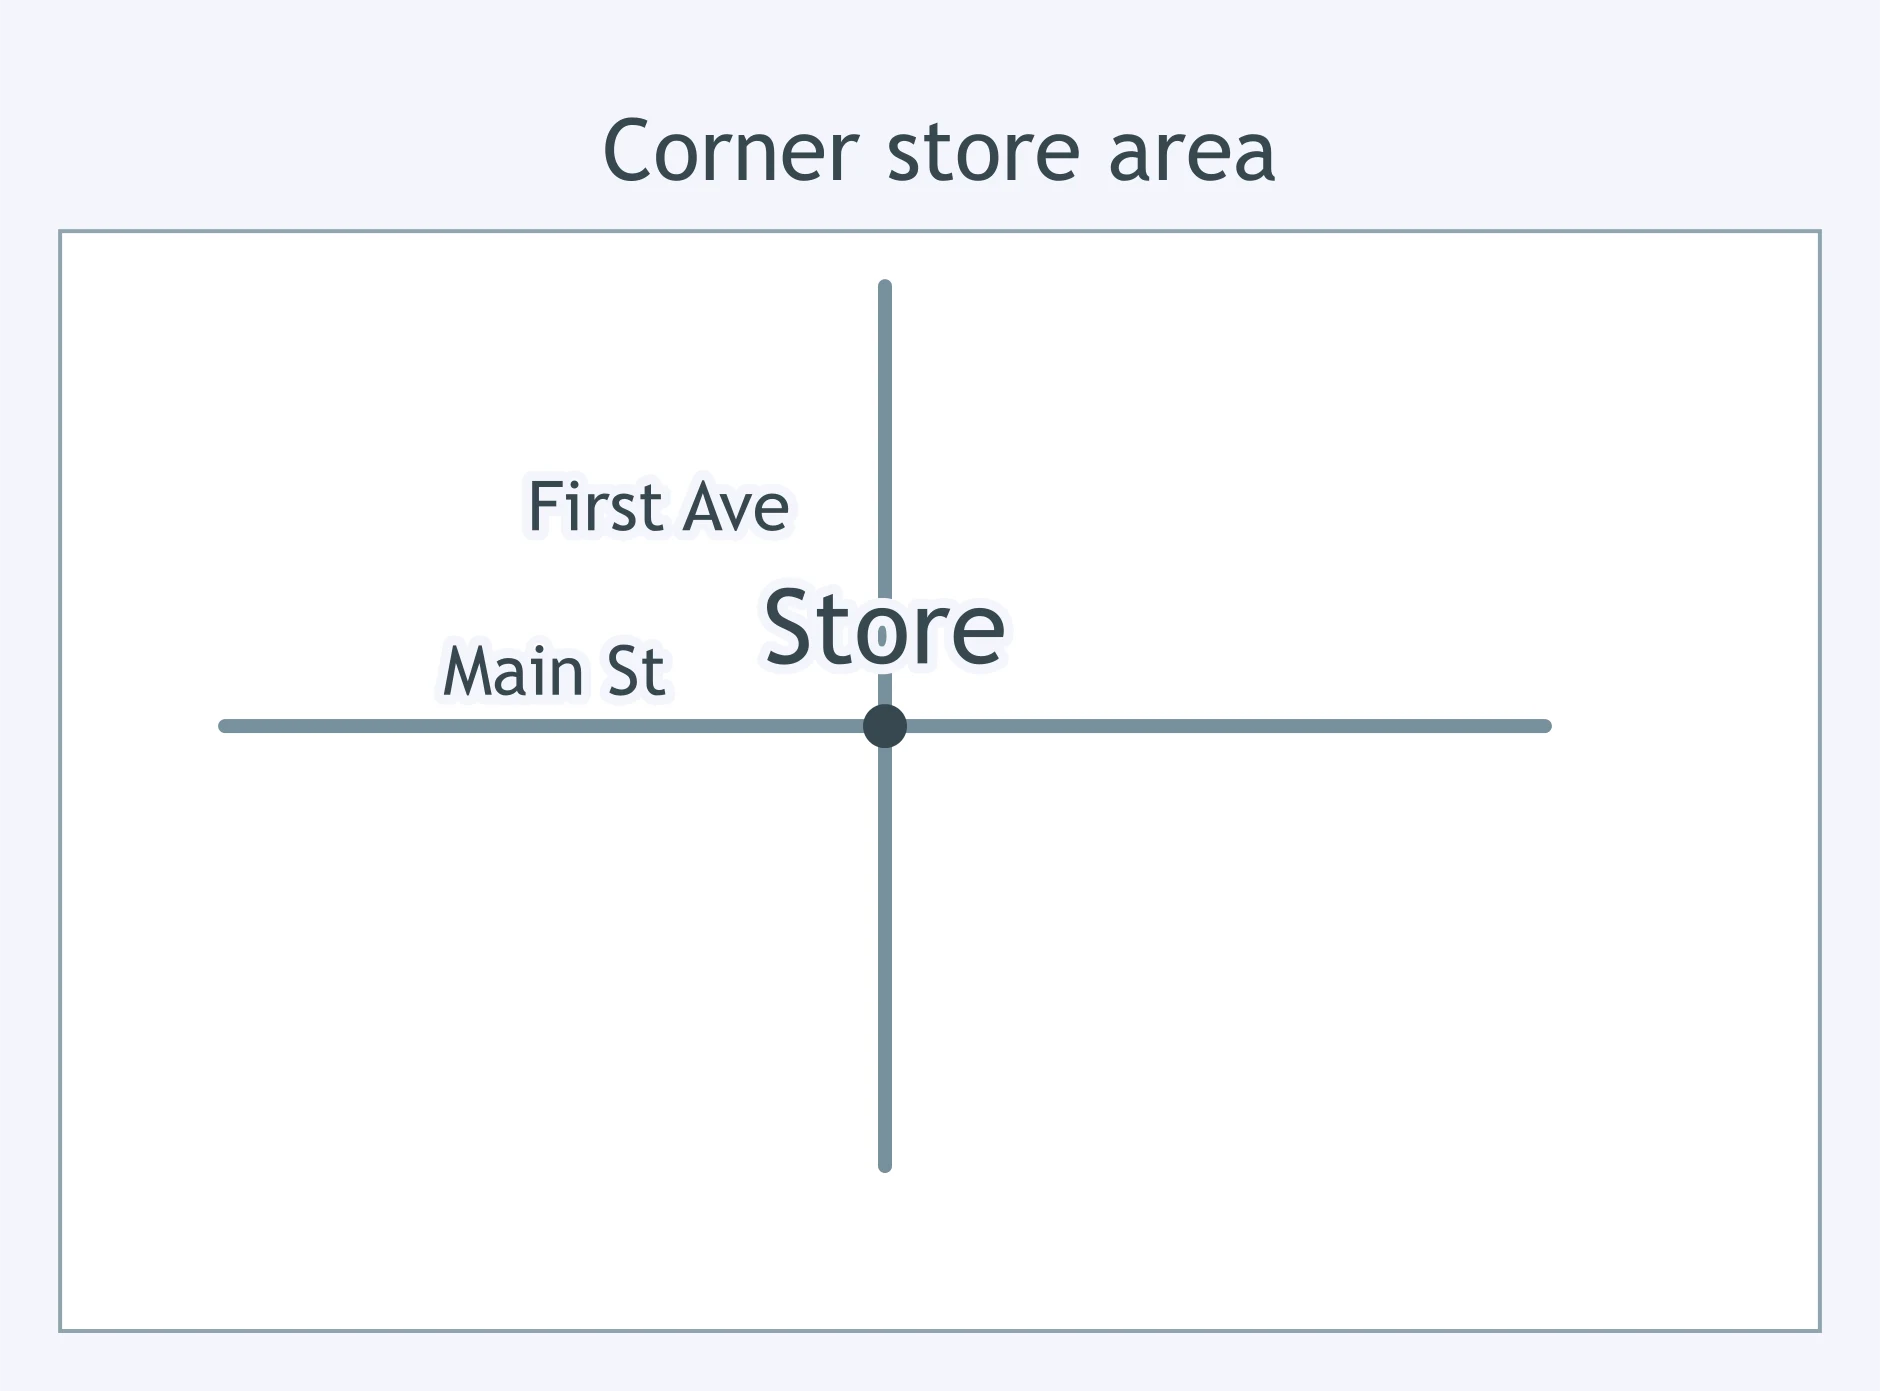
A planner asks whether enough customers pass one corner store at lunch to keep it open. At which scale should the data be gathered?
A federal agency asks whether rural internet access differs among states. What data scale best matches the question?
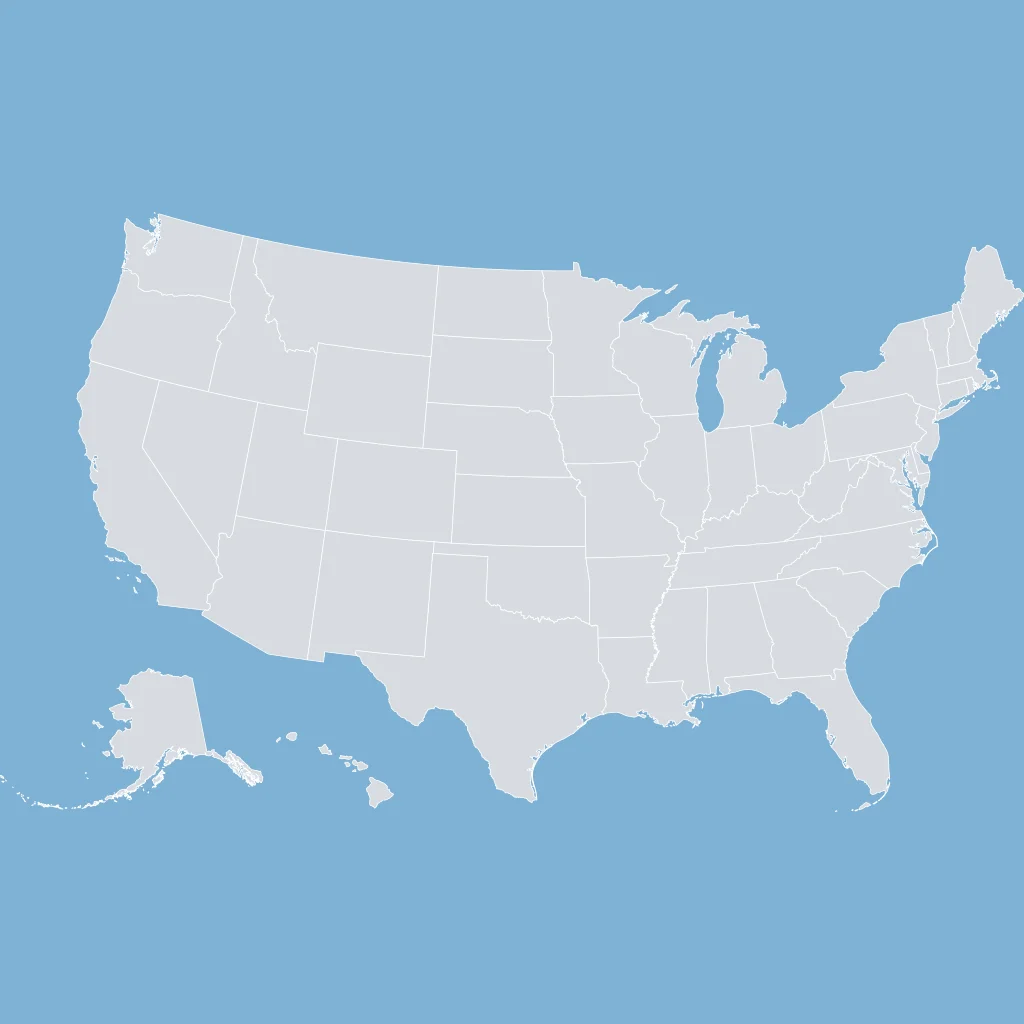
Public health workers ask whether elderly residents in one apartment complex face extra danger during heat waves. What scale should they use?
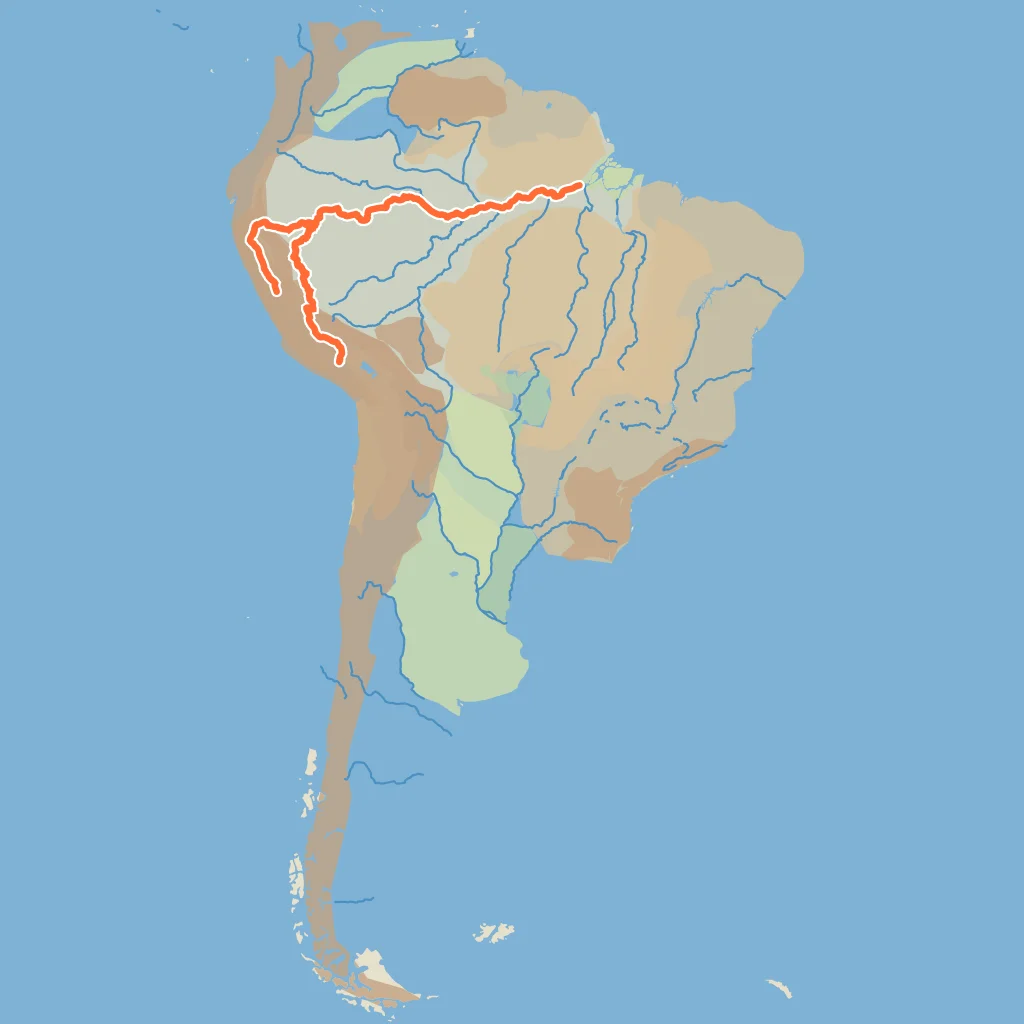
A researcher asks how deforestation in the Amazon Basin affects carbon storage across South America. Which scale best fits the question?
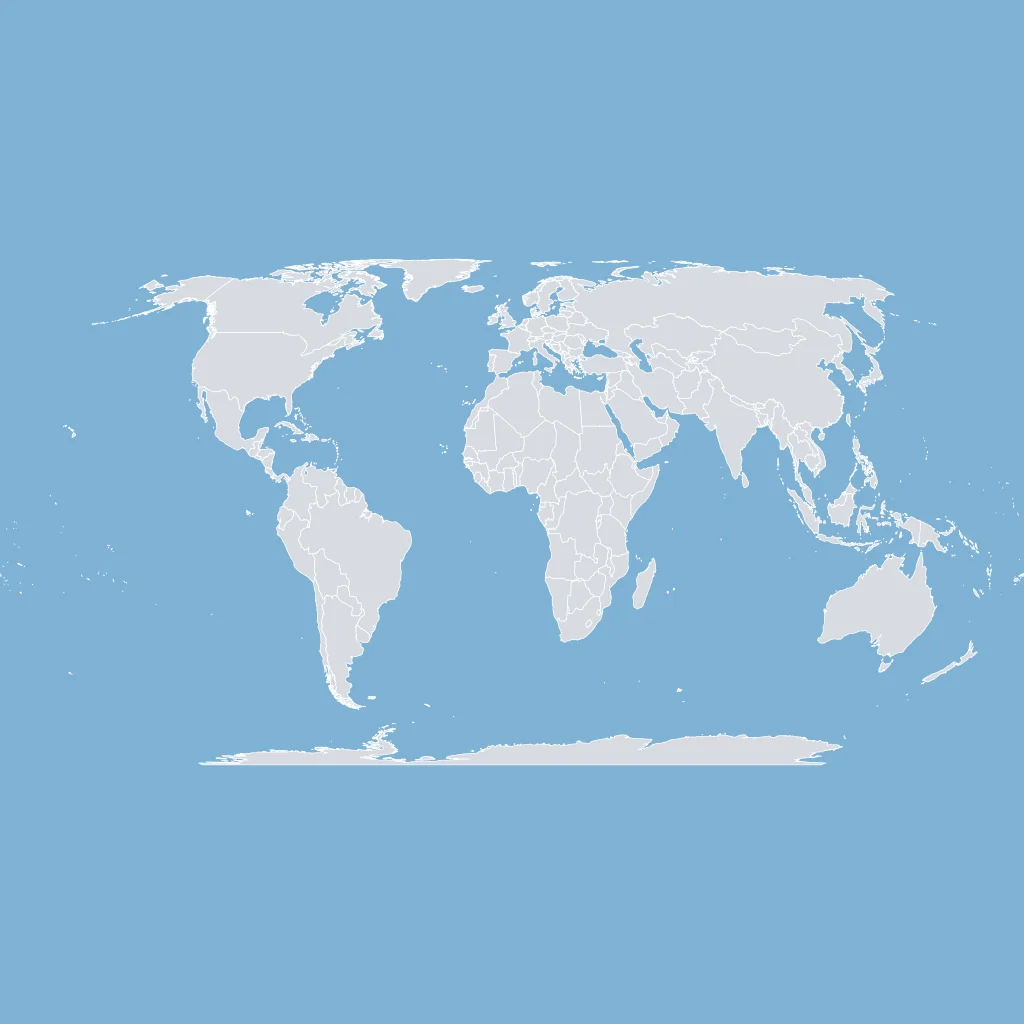
An economist asks whether shipping delays are changing trade between continents. Which scale should the evidence use?
State averages show rents rising slowly, but census-tract data shows sharp increases near two rail stations. What does changing scale reveal?
A world map shows high total emissions for large countries, while city data shows wide differences within those countries. What is the lesson?
A regional map shows rice production concentrated in Southeast Asia, while village surveys show which households lack irrigation. What does the comparison show?
Maps and Map Types: Reference, Thematic, Choropleth, Dot, Cartogram and Flow
35 questions
Map Projections: Mercator, Peters, Robinson and Goode
25 questions
Geographic Data: GIS, GPS, Remote Sensing and the Census
35 questions

Spatial Concepts: Location, Site, Situation, Space and Place
35 questions

Distance Decay, Friction of Distance and Time-Space Compression
Crack the passcode before the zombies get in.
Answer, then swat bugs for bonus points.
Race through questions at your own speed.
Same question on every screen. Fastest wins.

Pick a tile, answer, hit bonuses and steals.
30 questions