Loading
by BlastRoom
How women's education and work change fertility, and what an aging population costs.
#us_hs_human_geography
35 questions
One question set, multiple game modes. Tap any game to see it in action. Not sure which to pick?
Answer to place stones and capture territory.
Outrun the snow together.
Earn blasts, then hunt the other team.
Answer to earn energy, then climb.

The class blasts through walls together.
Bid on mystery lots. Most money wins.
Sell tours. Nice, standard, or a total scam.

Answer, restock, and serve the rush.
More correct answers pulls the rope your way.
Answer, then shoot down the alien wave.
Answer, then tap to leap the frozen ridge.
Use the scatter plot. What relationship between female secondary enrollment and total fertility rate is shown?
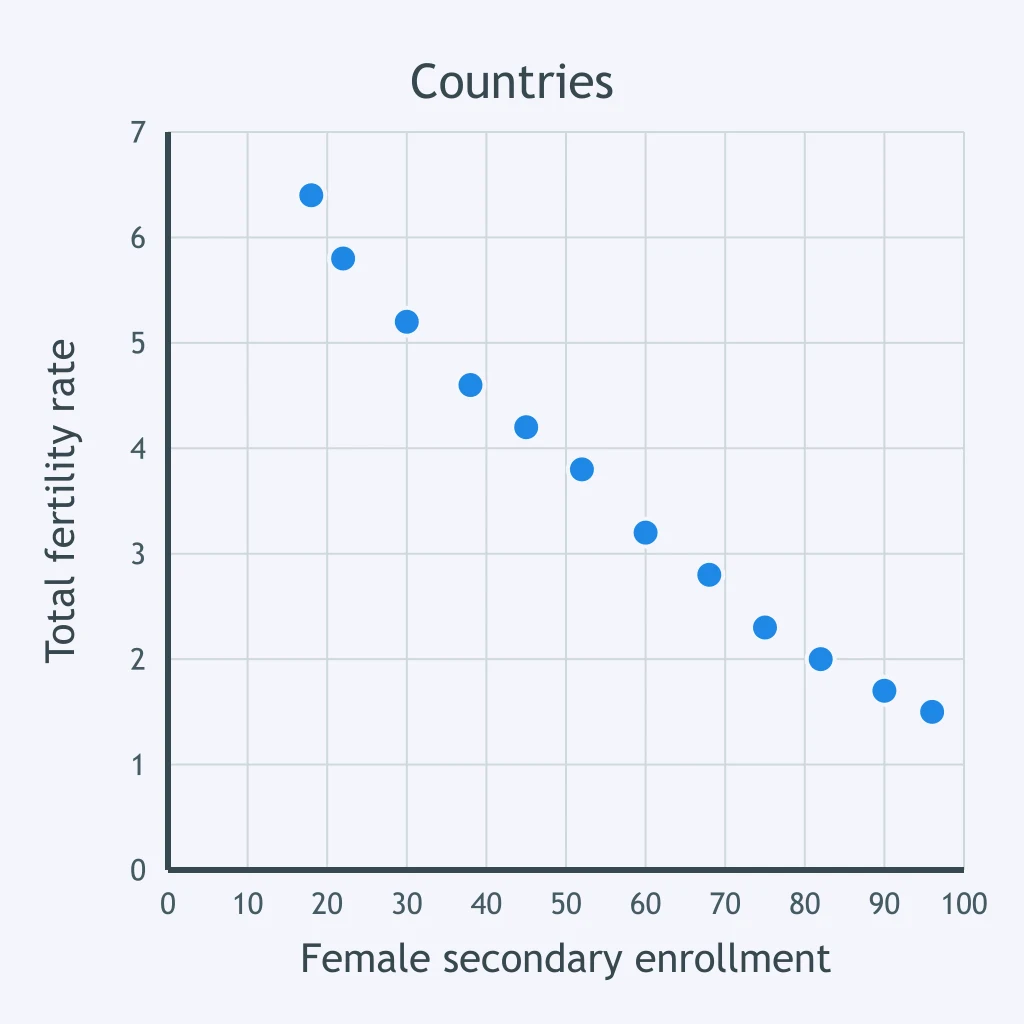
Use the scatter plot. What conclusion does it support?
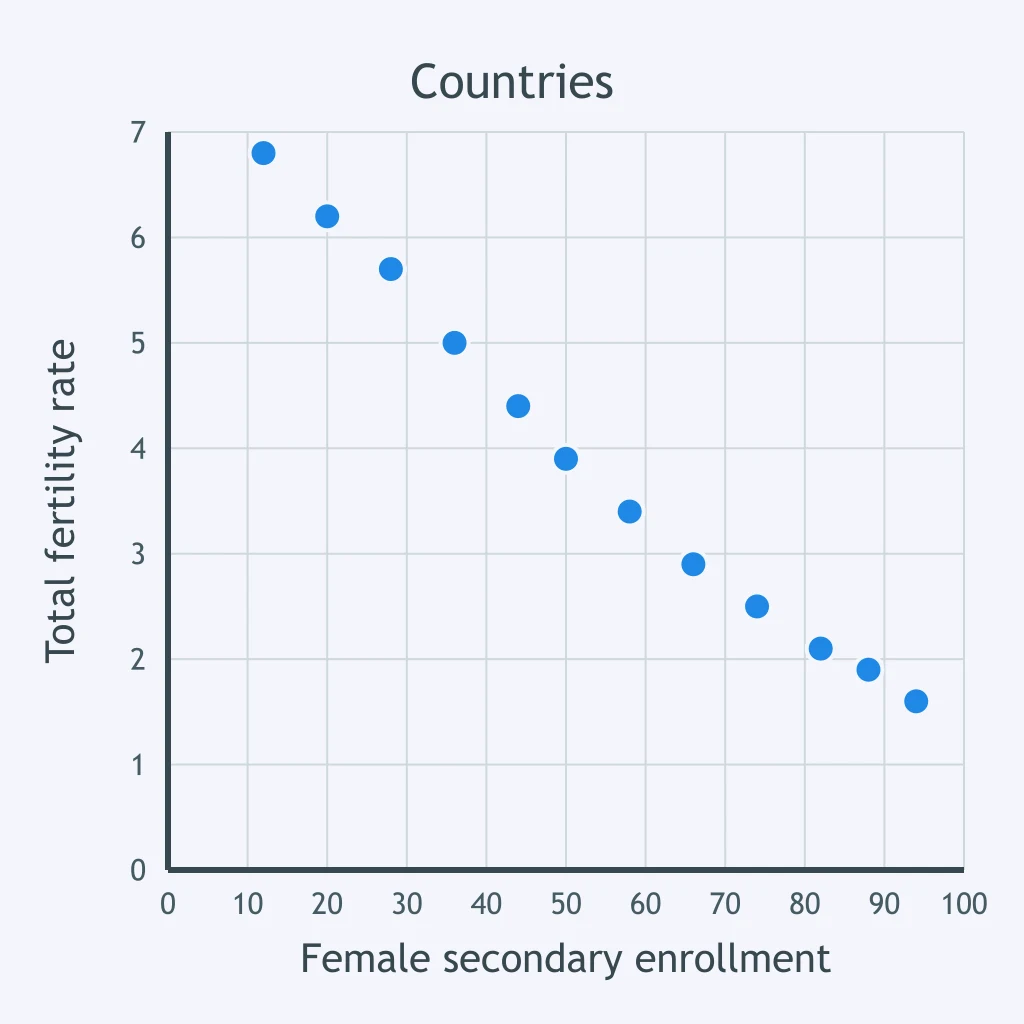
Compare the left and right sides of the scatter plot. What pattern best describes the countries shown?
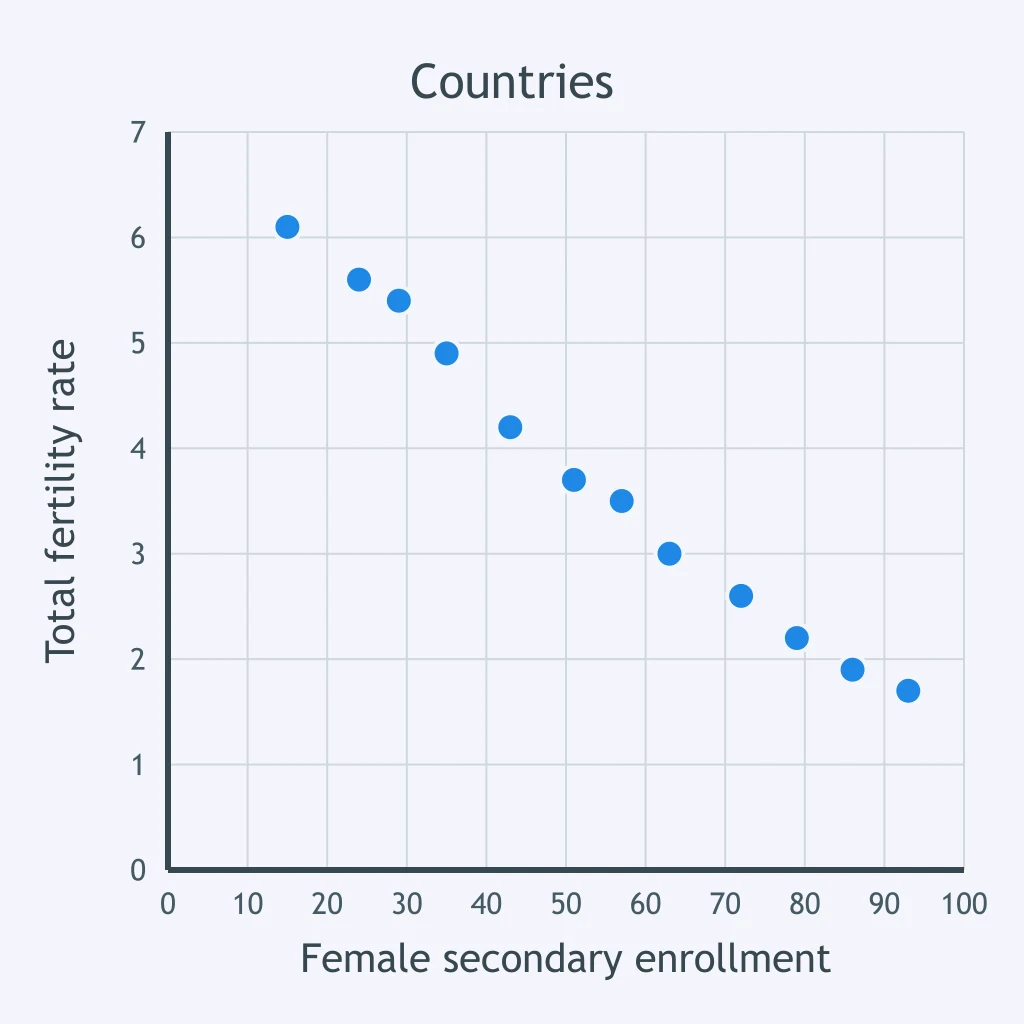
A student summarizes the scatter plot for a class report. What statement best fits the point pattern?
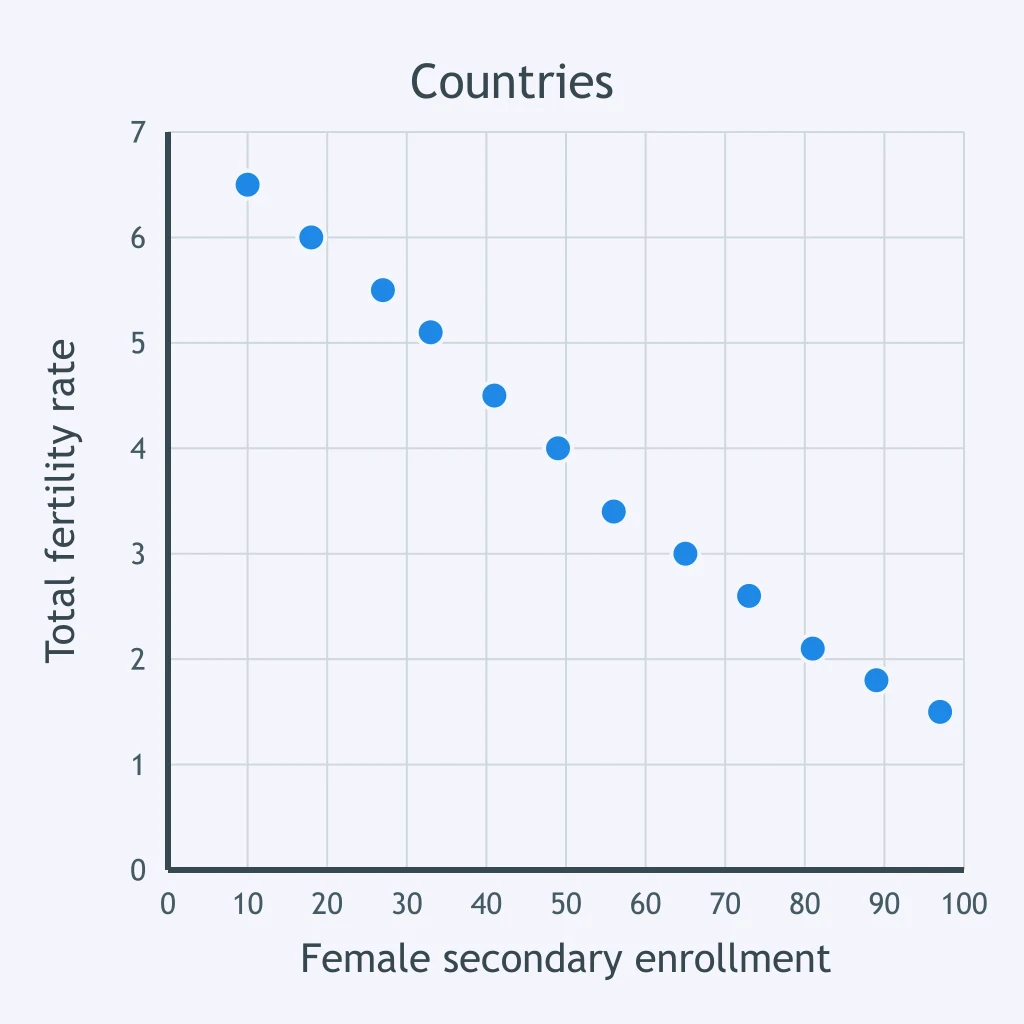
Using the scatter plot, how should a best-fit line generally run?
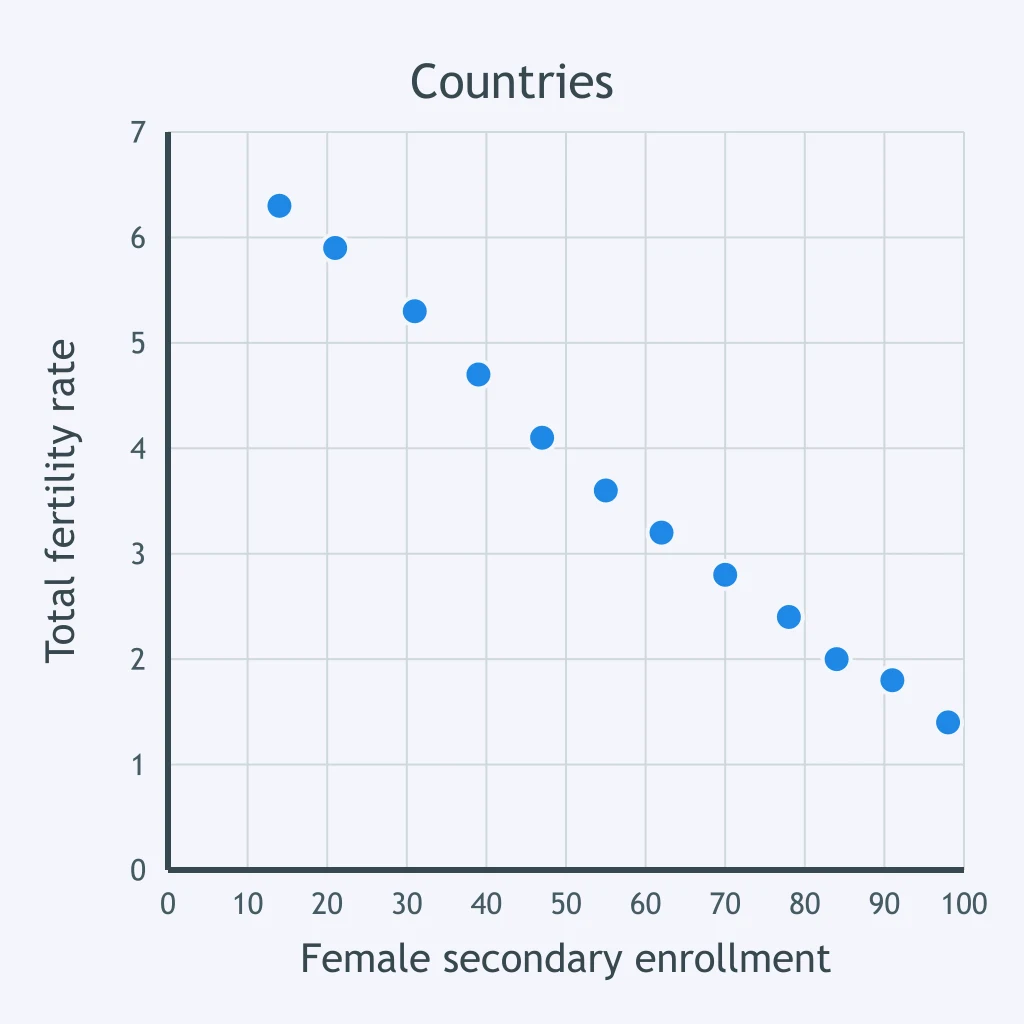
What demographic relationship is best supported by this scatter plot?
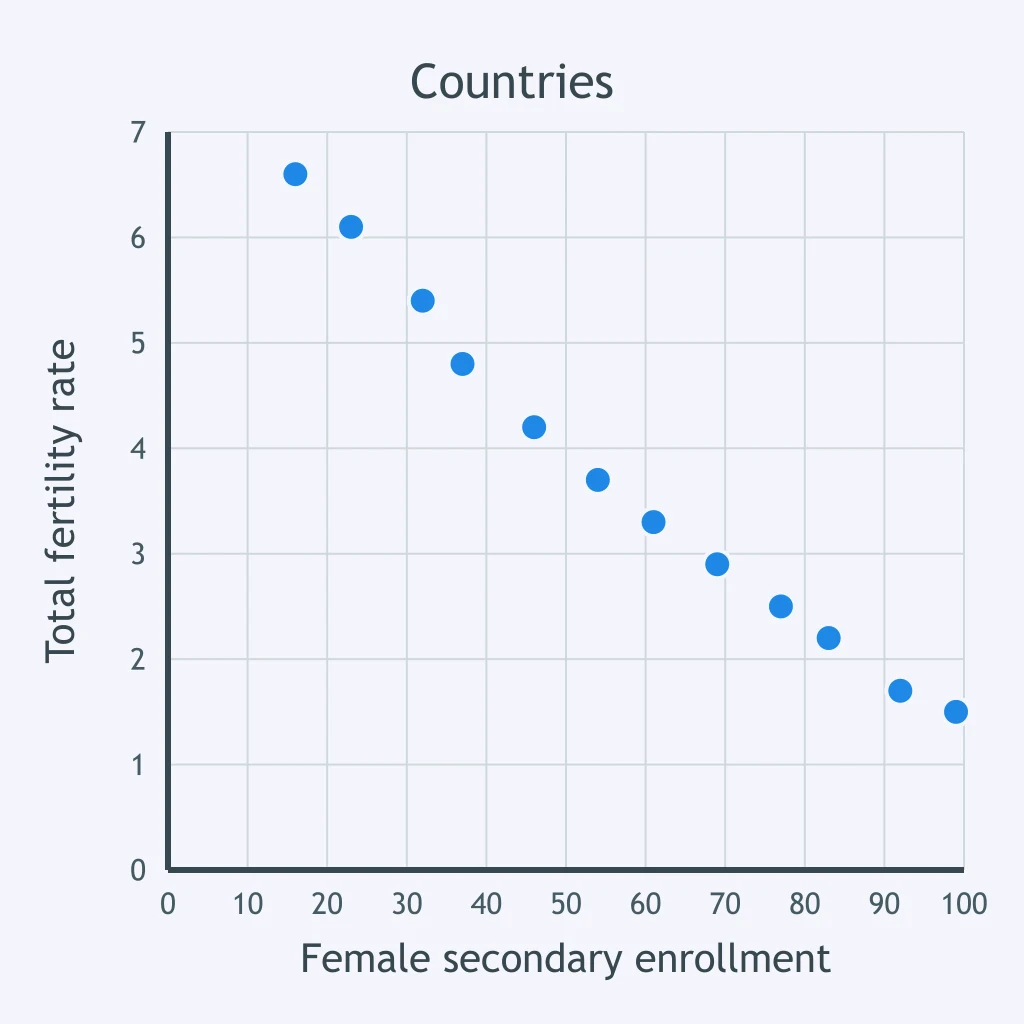
If a new country were plotted near the far right of this scatter, what fertility position would best fit the overall pattern?
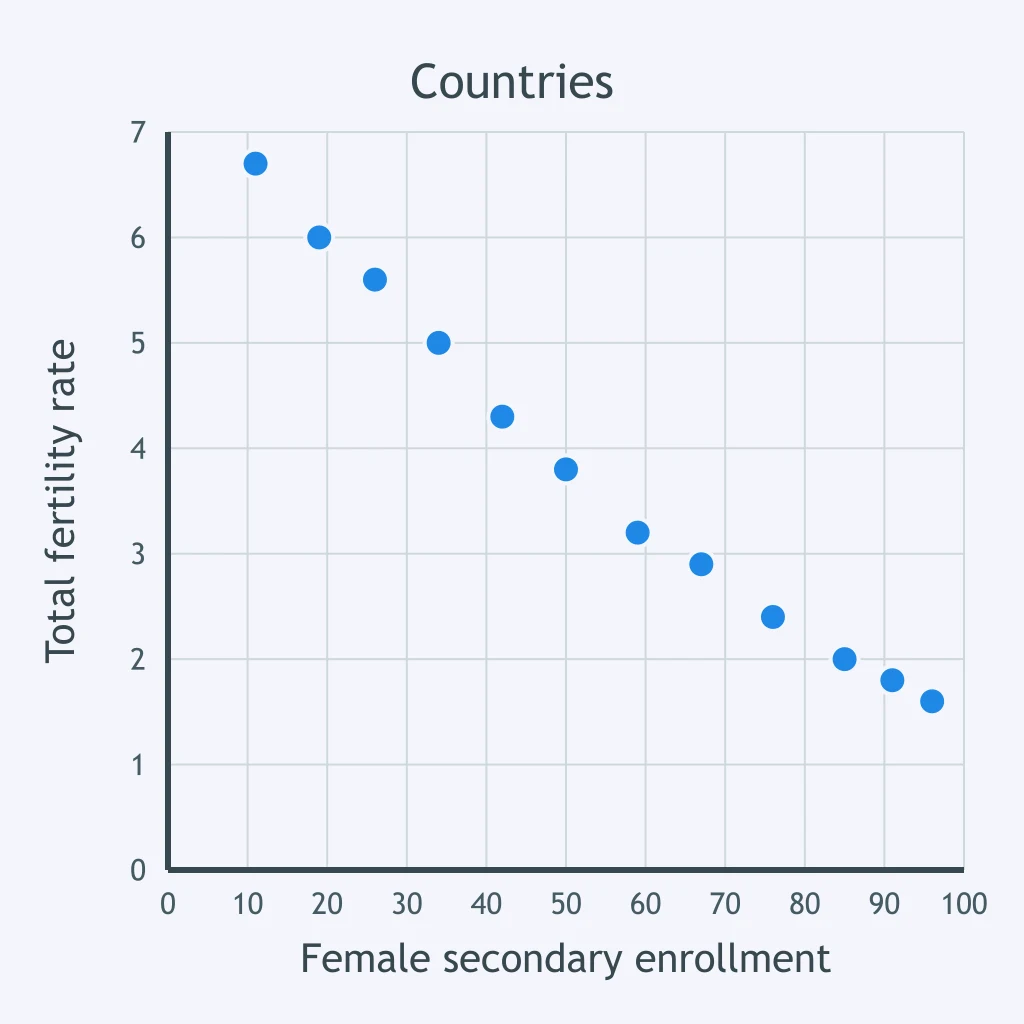
A cautious claim is needed for the scatter plot. What claim matches the evidence without overstating causation?
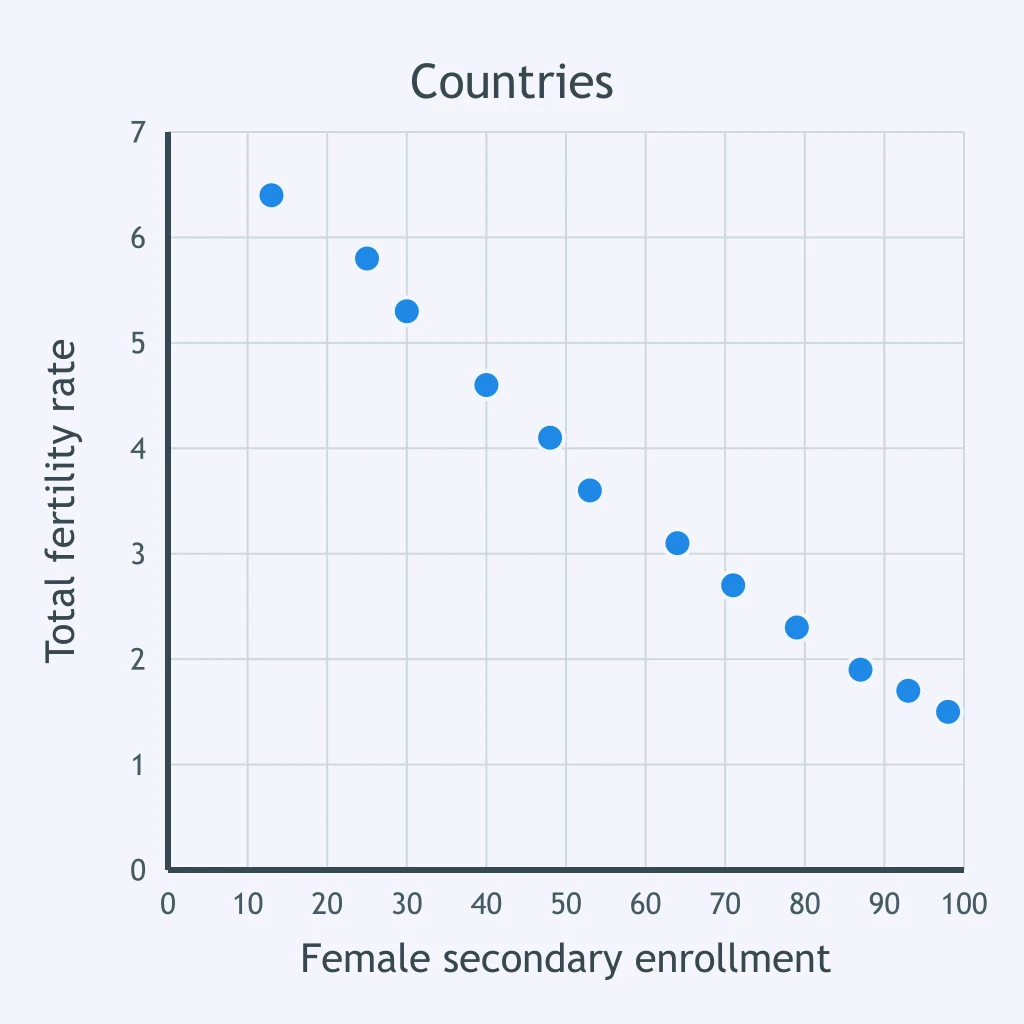
In a country where girls now complete secondary school before marrying, what mechanism most directly lowers fertility?
Women's paid employment expands in urban service jobs. How can that contribute to lower fertility?
Secondary schooling increases literacy and access to health information. What fertility-related effect can follow?
A household gains income from a woman's skilled job. What change can reduce desired family size?
Women spend more years in training before entering professional work. What fertility mechanism does this encourage?
Girls' school completion becomes expected, and fertility falls for a generation. How does the base of the country's population pyramid change?
Women's wages reduce a family's reliance on children for labor and old-age support. How can this affect fertility?
A country has a rising share of people over 65 and a flat working-age share. What fiscal pressure follows?
In a pay-as-you-go pension system, current workers fund current retirees. What happens as the population ages?
Age data show a rapidly growing 80-and-over cohort. Which public budget category is most likely to grow?
Decades of low fertility create small cohorts entering the labor force. Why can this strain public budgets?
A country has 30 people aged 65 and over for every 100 people aged 15 to 64. What is its old-age dependency ratio?
An aging country has fewer births each year and a growing share of retirees. Which public spending area is most likely to see falling demand?
An aging country funds health care mainly through general taxes. What fiscal risk increases?
A government wants current residents to contribute to pensions for more years as life expectancy rises. Which policy fits?
A labor shortage is expected within five years, and new births will not enter the workforce for decades. Which policy addresses the gap fastest?
Fertility is below replacement, and leaders want more future workers by increasing births among residents. Which policy matches that goal?
A pay-as-you-go pension fund faces deficits, but eligibility age will not change. Which response targets pension financing directly?
An aging country lacks enough workers in nursing homes and home care. Which policy addresses that aging problem?
Many healthy older adults want part-time jobs instead of full retirement. Which policy uses that labor supply?
Rural districts have many older residents who cannot easily reach clinics. Which policy response is most direct?
Use the age-sex structure. What does it imply about the elderly support ratio?
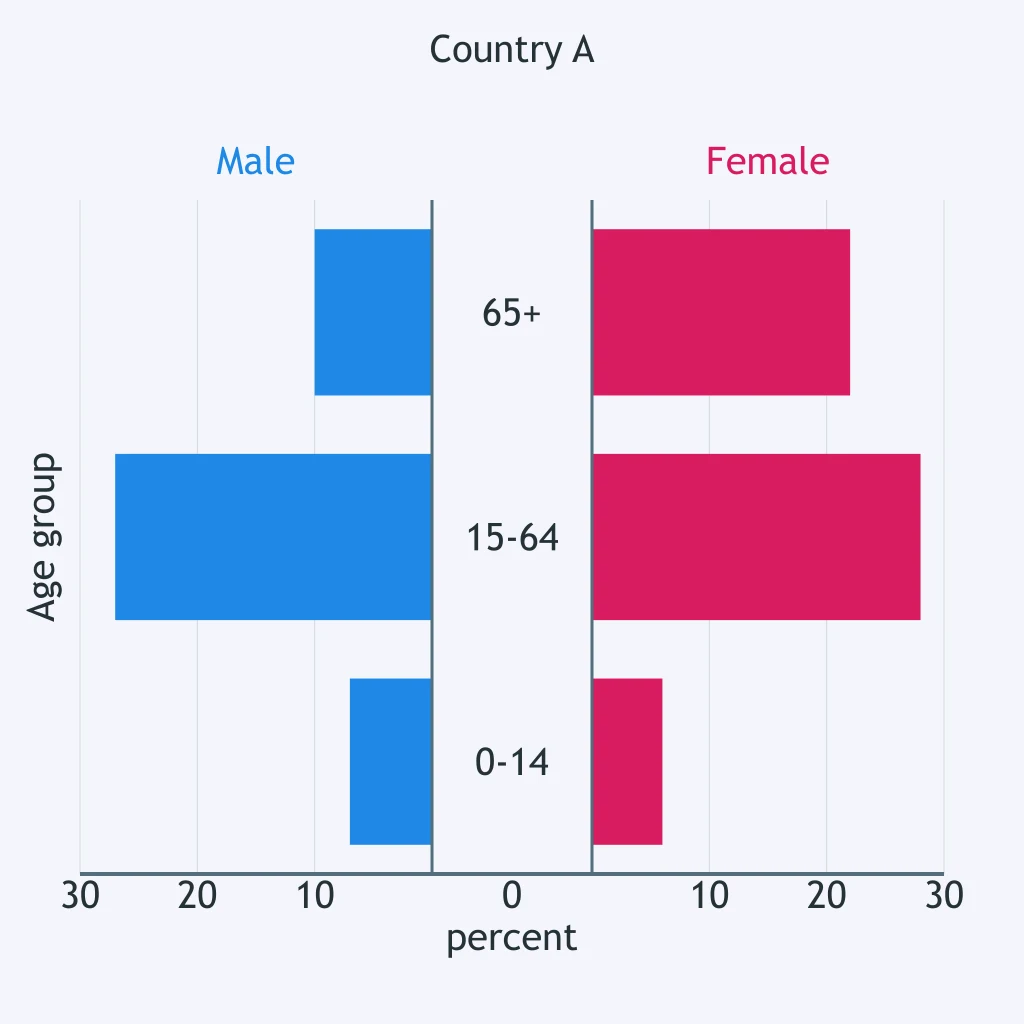
Use the pyramid for Country B. What pressure falls on the working-age cohort?
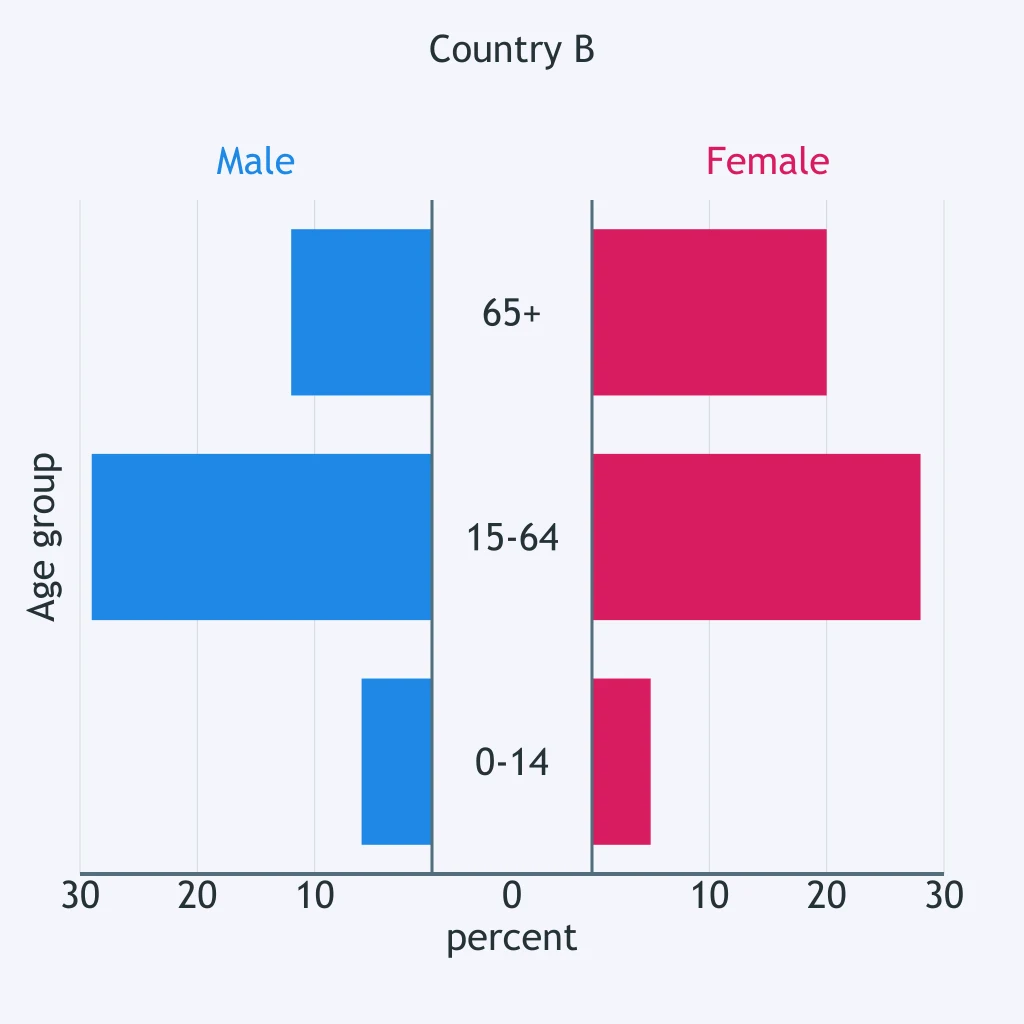
If pensions are funded mainly by ages 15-64, what does this age-sex structure suggest?
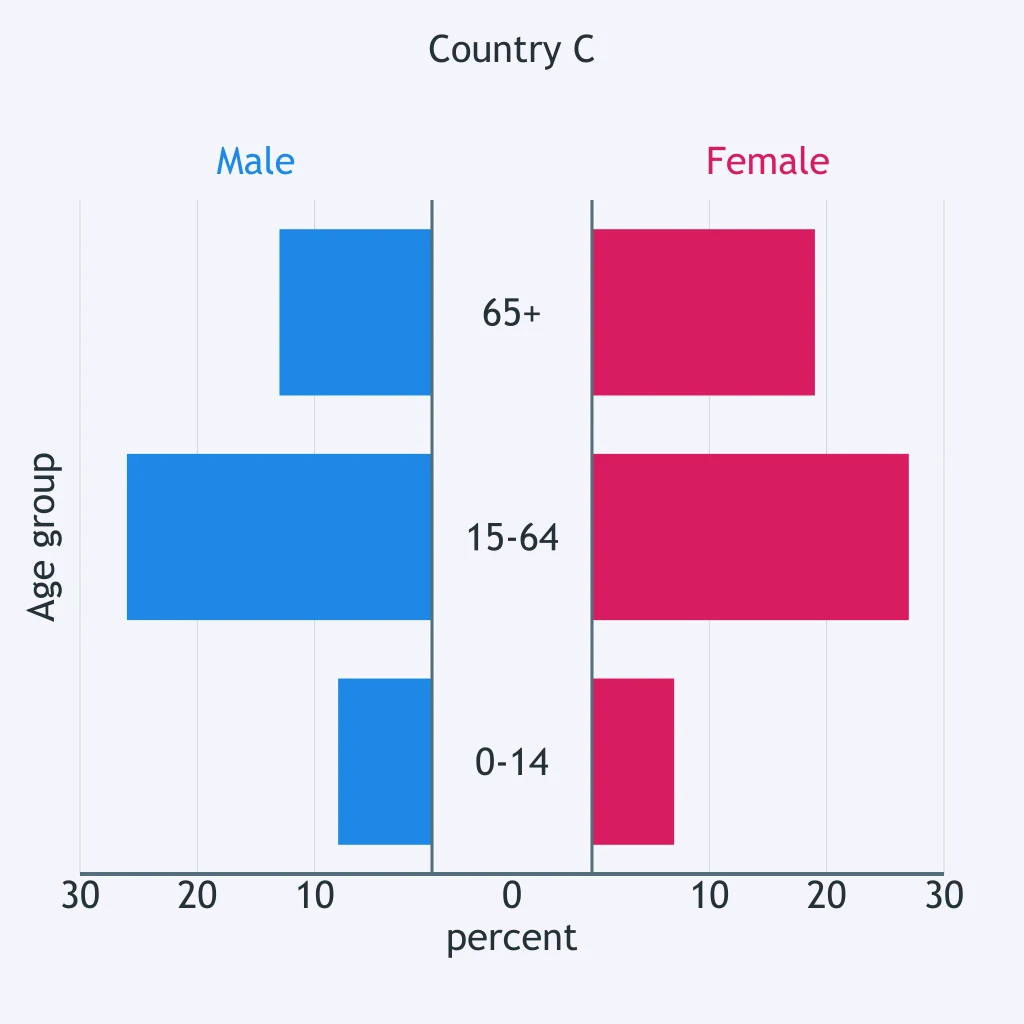
What old-age dependency pattern is shown by the age-sex structure?
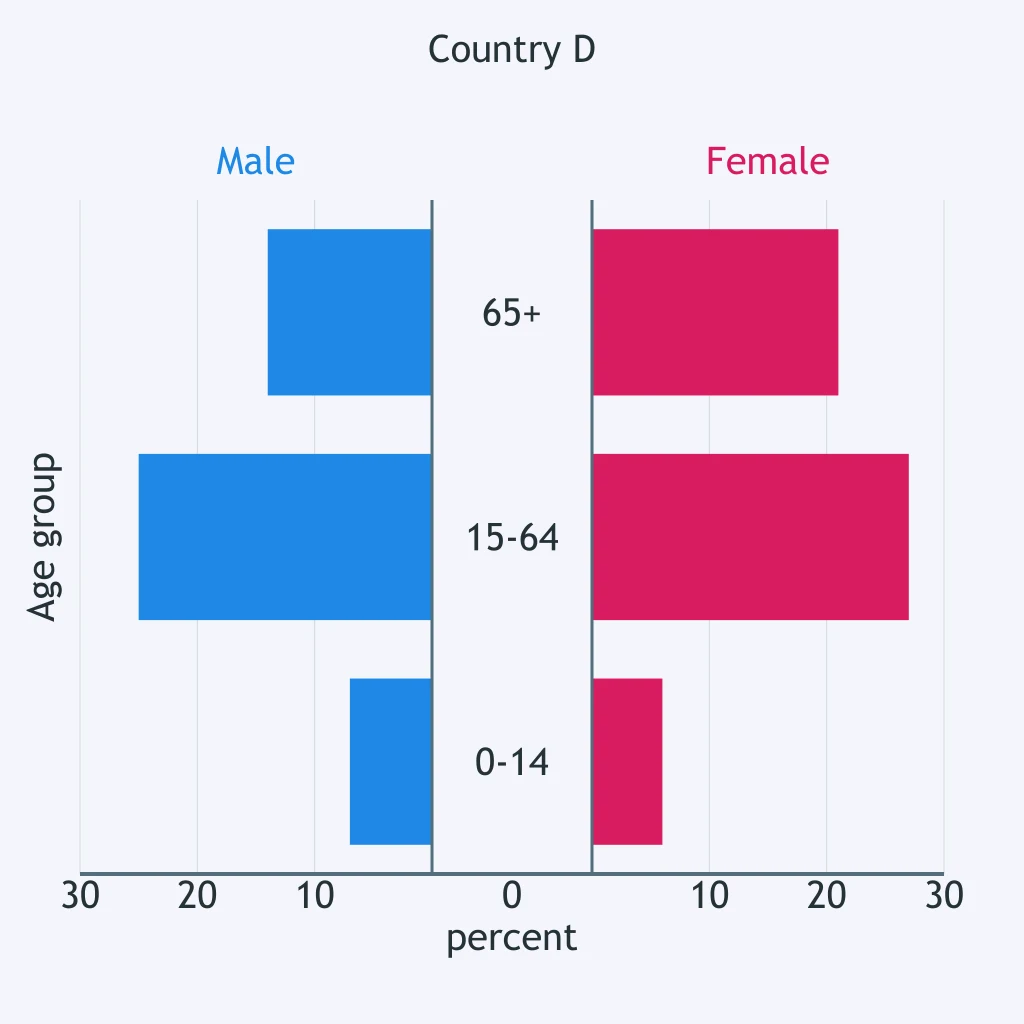
A planner compares the under-15 and 65+ cohorts in this pyramid. What support issue appears?
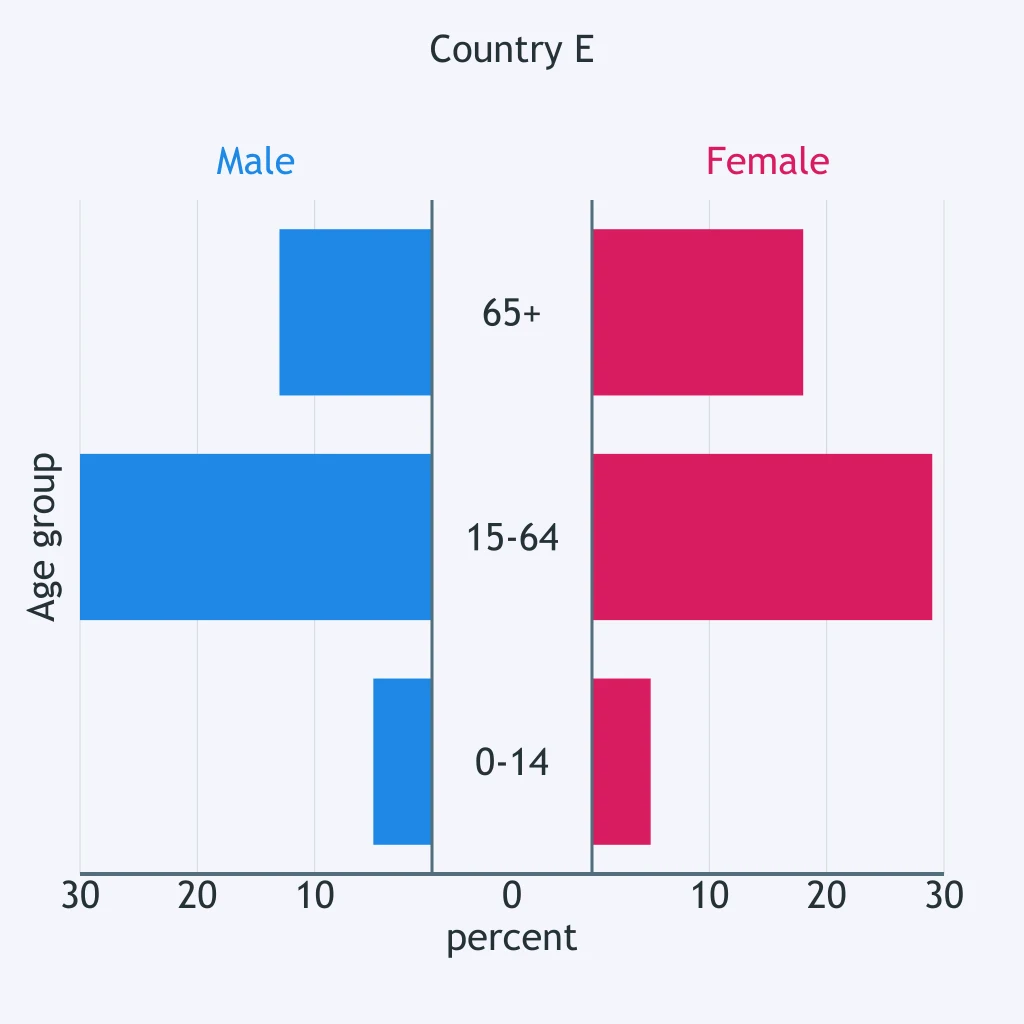
Use the age-sex structure. If cohort shares persist, what happens to the elderly support ratio?
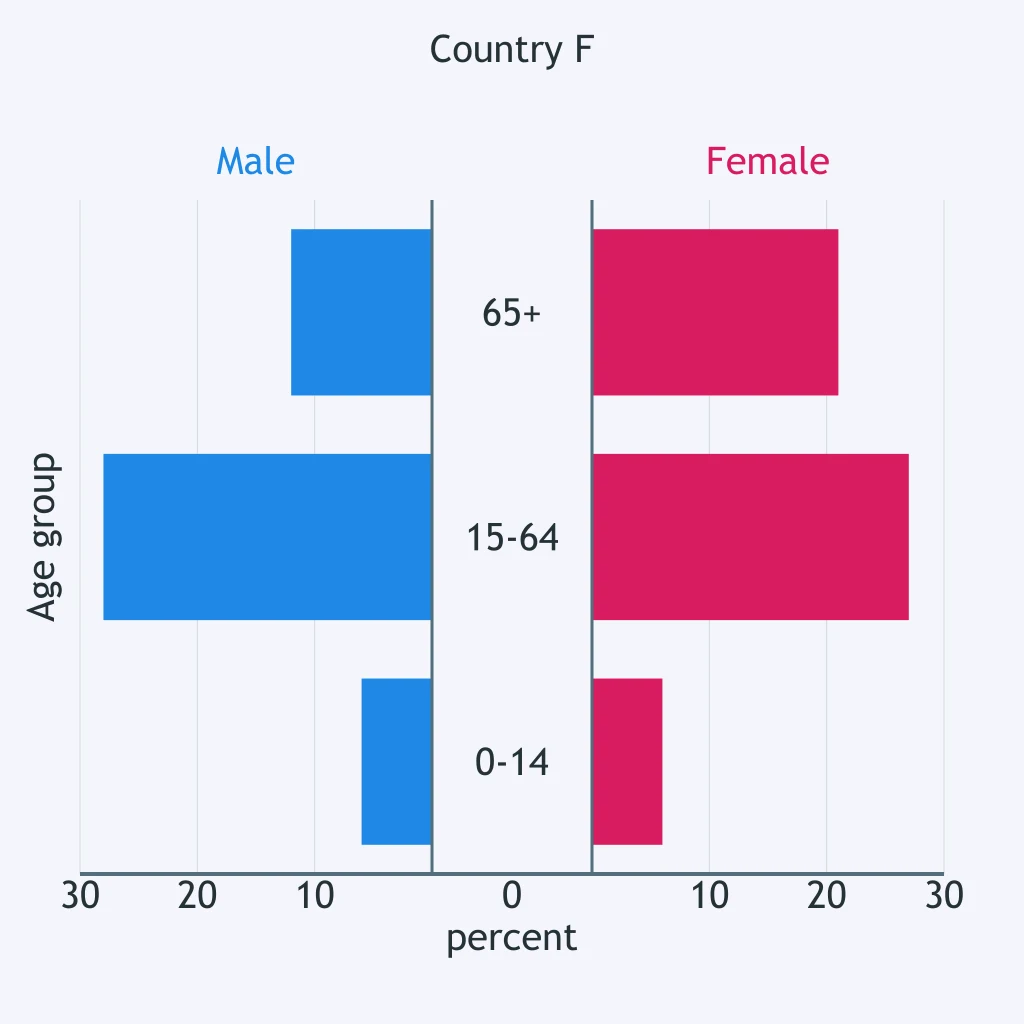
Crack the passcode before the zombies get in.
Answer, then swat bugs for bonus points.
Race through questions at your own speed.
Same question on every screen. Fastest wins.

Pick a tile, answer, hit bonuses and steals.
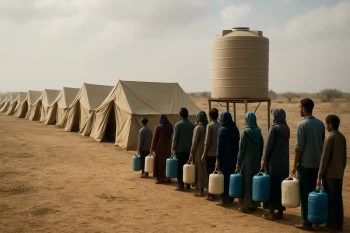
Forced Migration: Refugees, Asylum Seekers and Internally Displaced People
30 questions