Loading
by BlastRoom
Use data to explain why populations grow, level off, or crash when resources change.
#us_grade_7_science
40 questions
One question set, multiple game modes. Tap any game to see it in action. Not sure which to pick?
Answer to place stones and capture territory.
Outrun the snow together.
Earn blasts, then hunt the other team.
Answer to earn energy, then climb.

The class blasts through walls together.
Bid on mystery lots. Most money wins.
Sell tours. Nice, standard, or a total scam.

Answer, restock, and serve the rush.
More correct answers pulls the rope your way.
Answer, then shoot down the alien wave.
Answer, then tap to leap the frozen ridge.
Clover cover was high with 52 rabbits, medium with 33 rabbits, and low with 14 rabbits. Which claim fits the data?
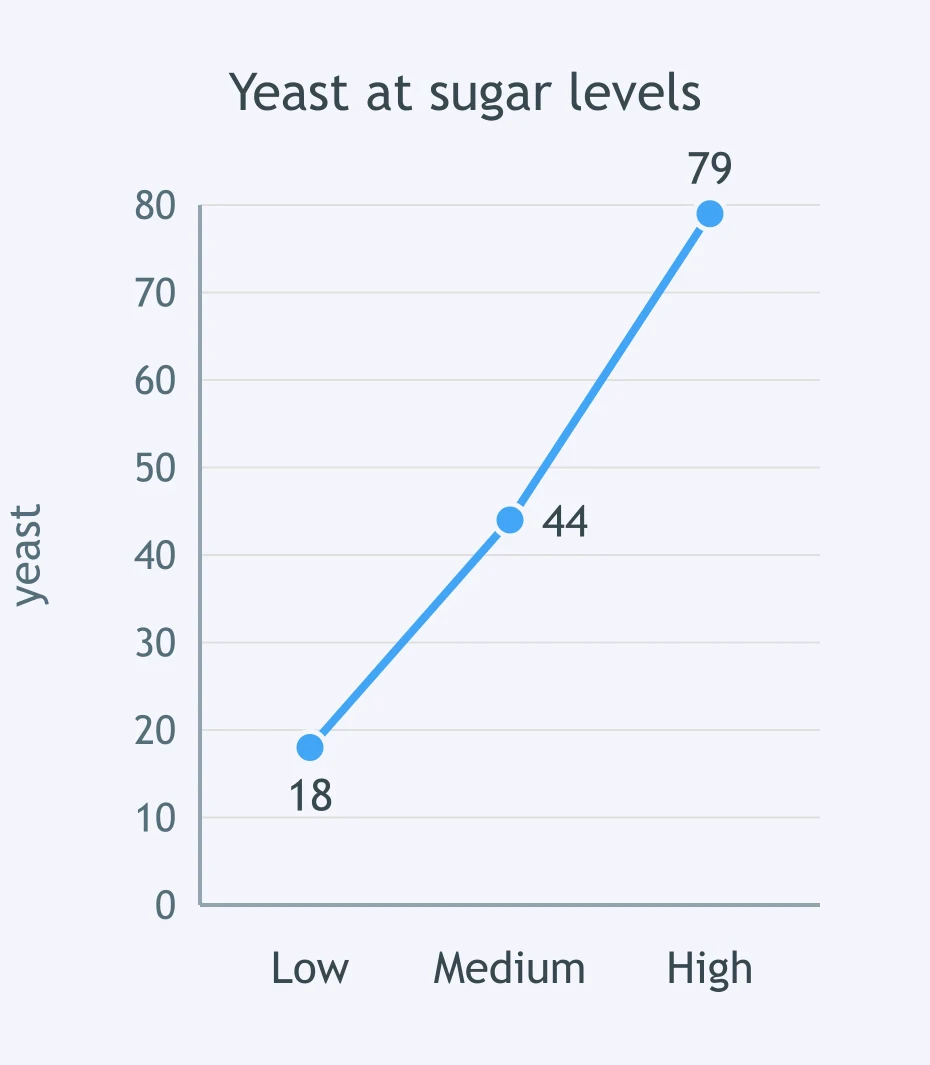
Use the graph of yeast population at low, medium, and high sugar levels. What pattern does the data show?
Shore quadrats with 4 m2 open rock had 80 mussels, 2 m2 had 47, and 0.5 m2 had 12. What pattern appears?
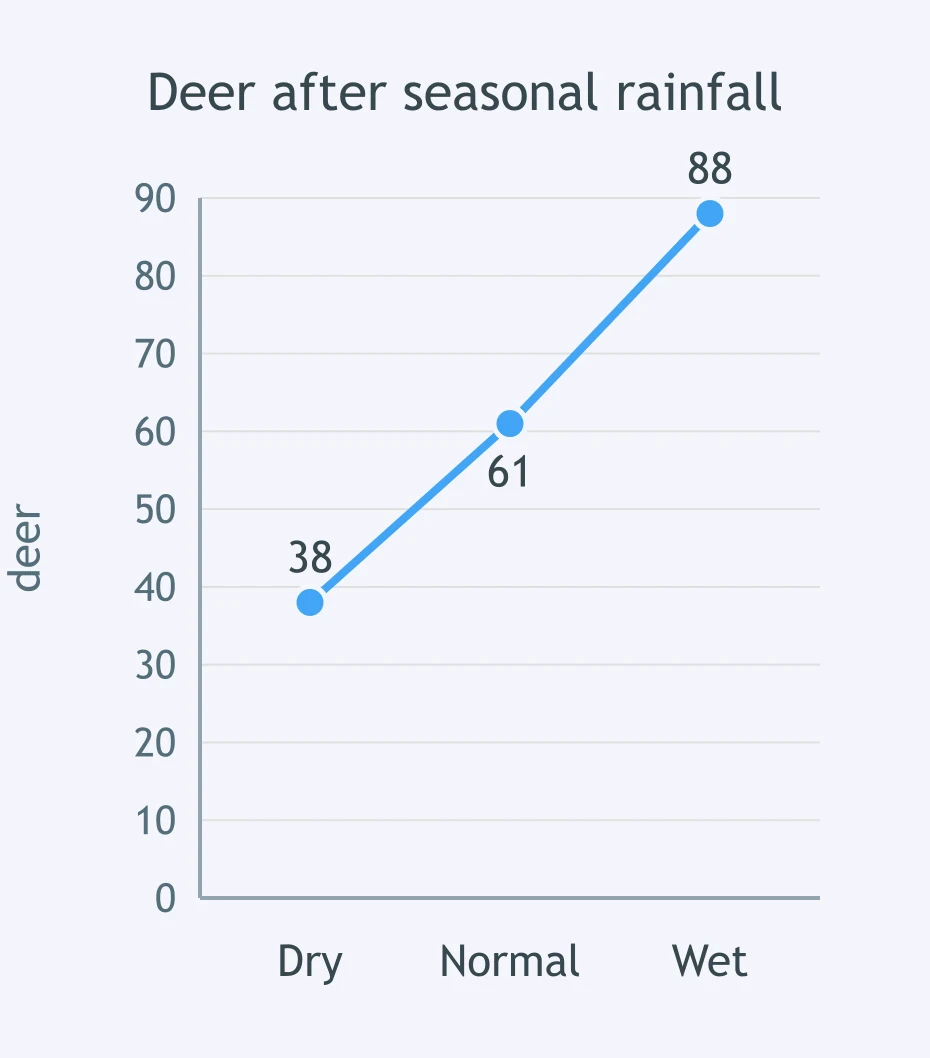
Use the graph of deer counted after dry, normal, and wet seasons. Which claim is best supported?
A pond had 2 mg/L nitrate with 1,200 algae cells/mL, 6 mg/L with 3,700, and 10 mg/L with 6,100. What claim fits?
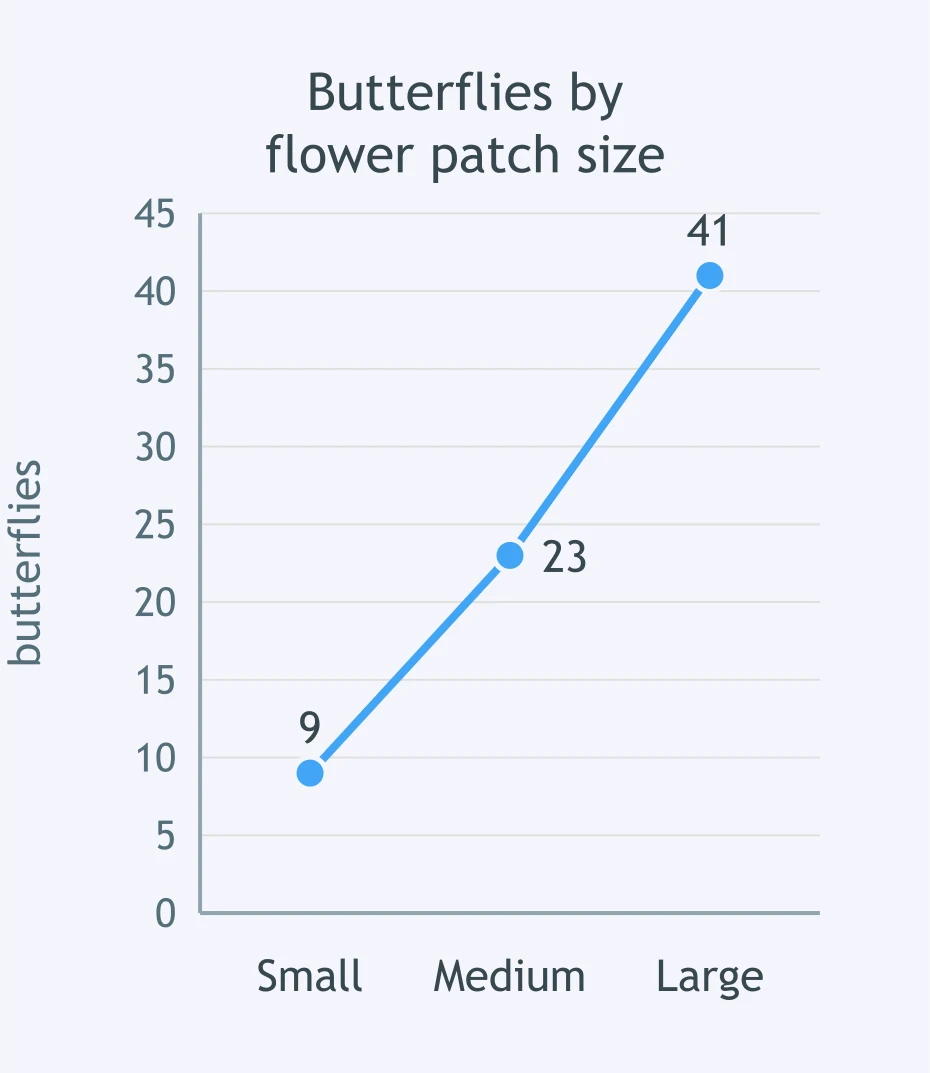
Use the graph of butterfly counts in small, medium, and large flower patches. What does the evidence show?
Desert plots had 2 shelter logs with 6 lizards, 5 logs with 18 lizards, and 9 logs with 31 lizards. Which claim fits?
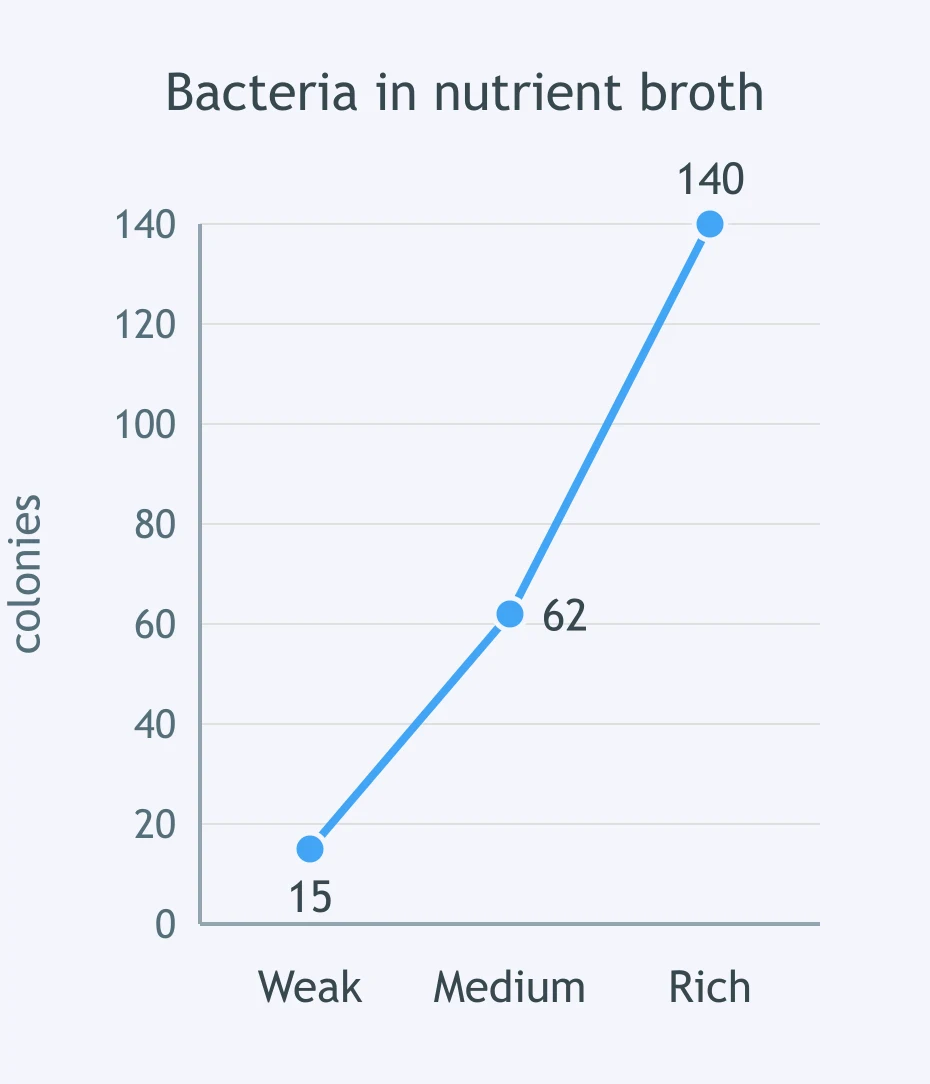
Use the graph of bacterial populations grown in weak, medium, and rich nutrient broth. What pattern is shown?
Fields with 5 mice/ha had 1 owl pair, 18 mice/ha had 4 pairs, and 35 mice/ha had 7 pairs. Which claim is supported?
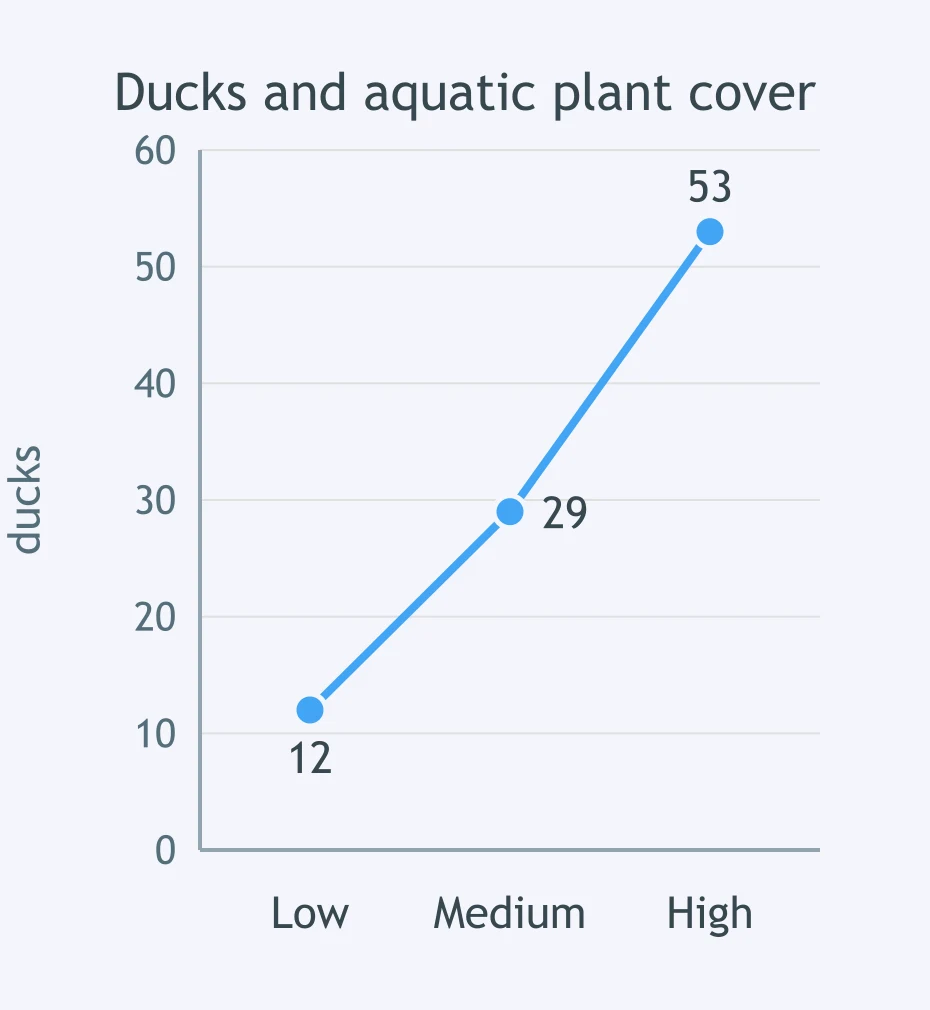
Use the graph of ducks counted at low, medium, and high aquatic plant cover. What relationship does it show?
Tadpole tanks with 5 g algae had 11 tadpoles, 15 g had 26, and 30 g had 48. What does the data show?
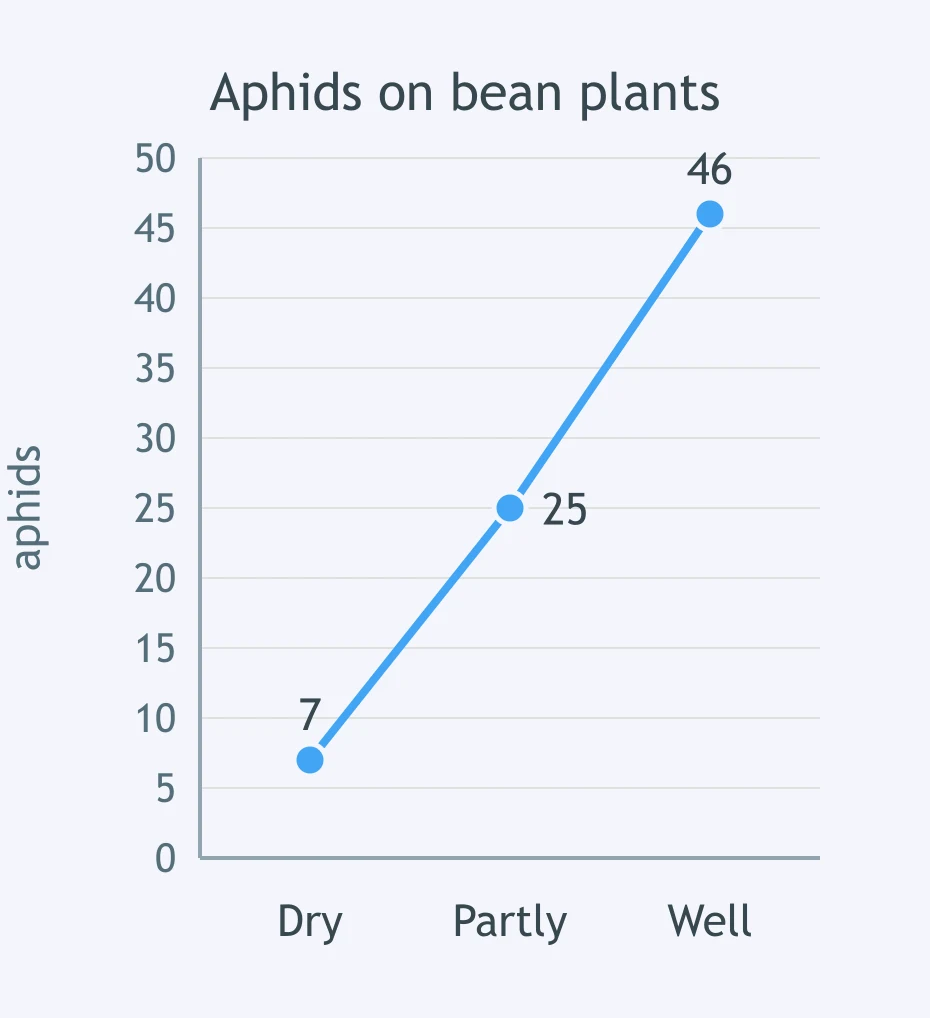
Use the graph of aphids on dry, partly watered, and well-watered bean plants. Which claim fits the data?
Tide pools with 3 empty shells had 2 hermit crabs, 12 shells had 9 crabs, and 25 shells had 21 crabs. Which claim fits?
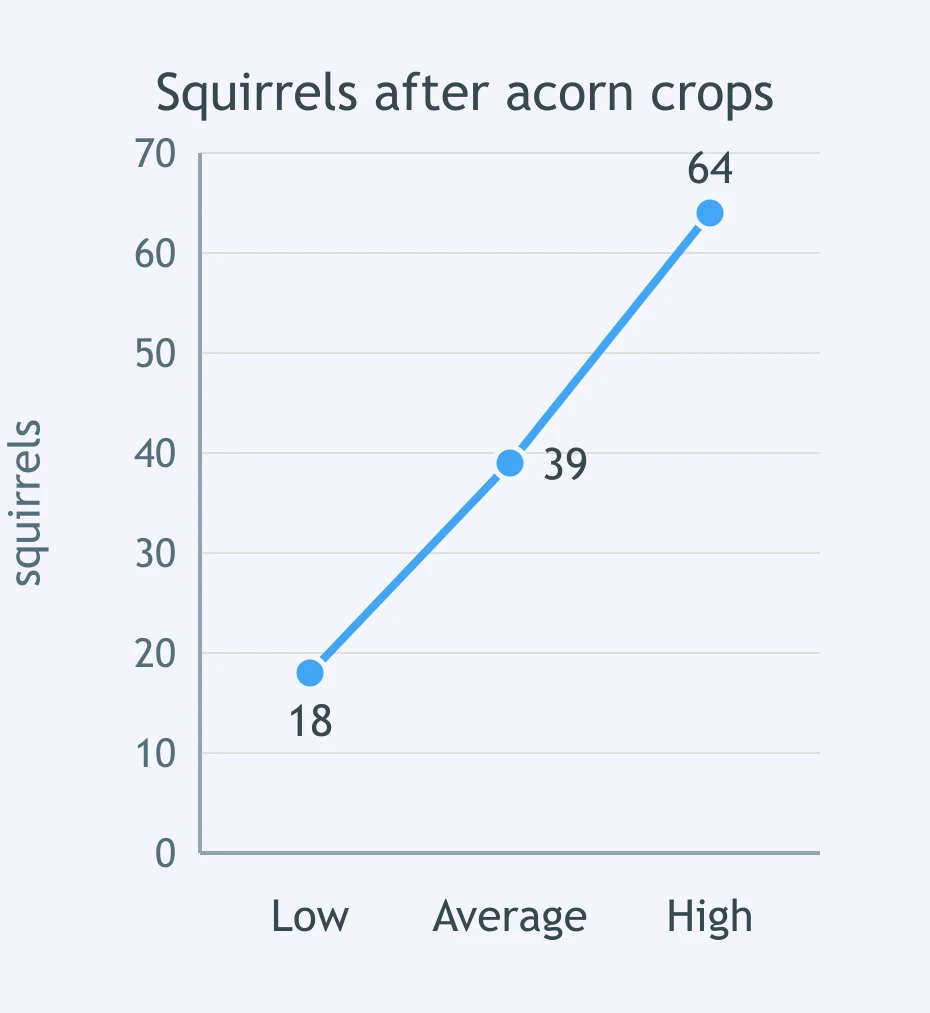
Use the graph of squirrel counts after low, average, and high acorn crops. What pattern is supported?
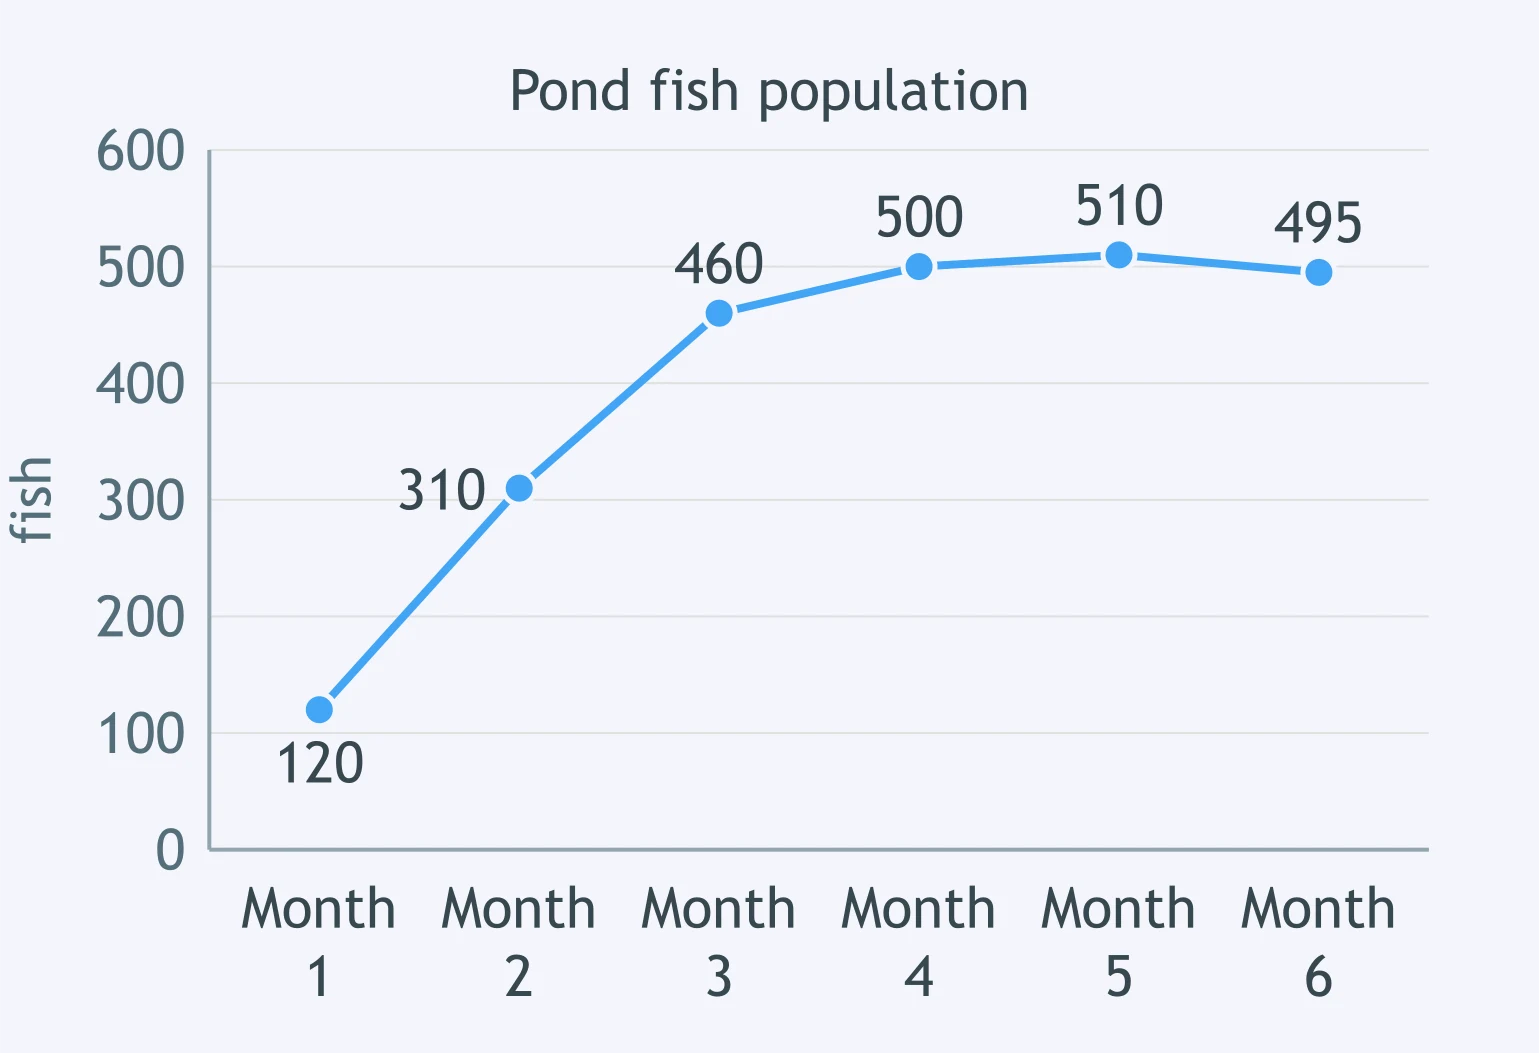
Use the fish graph. Food and nesting spaces did not increase after month 3. Why did the population level off?
Mealworms grew from 40 to 170, then stayed near 175 while weekly bran food and tray space stayed fixed. What best explains the leveling?
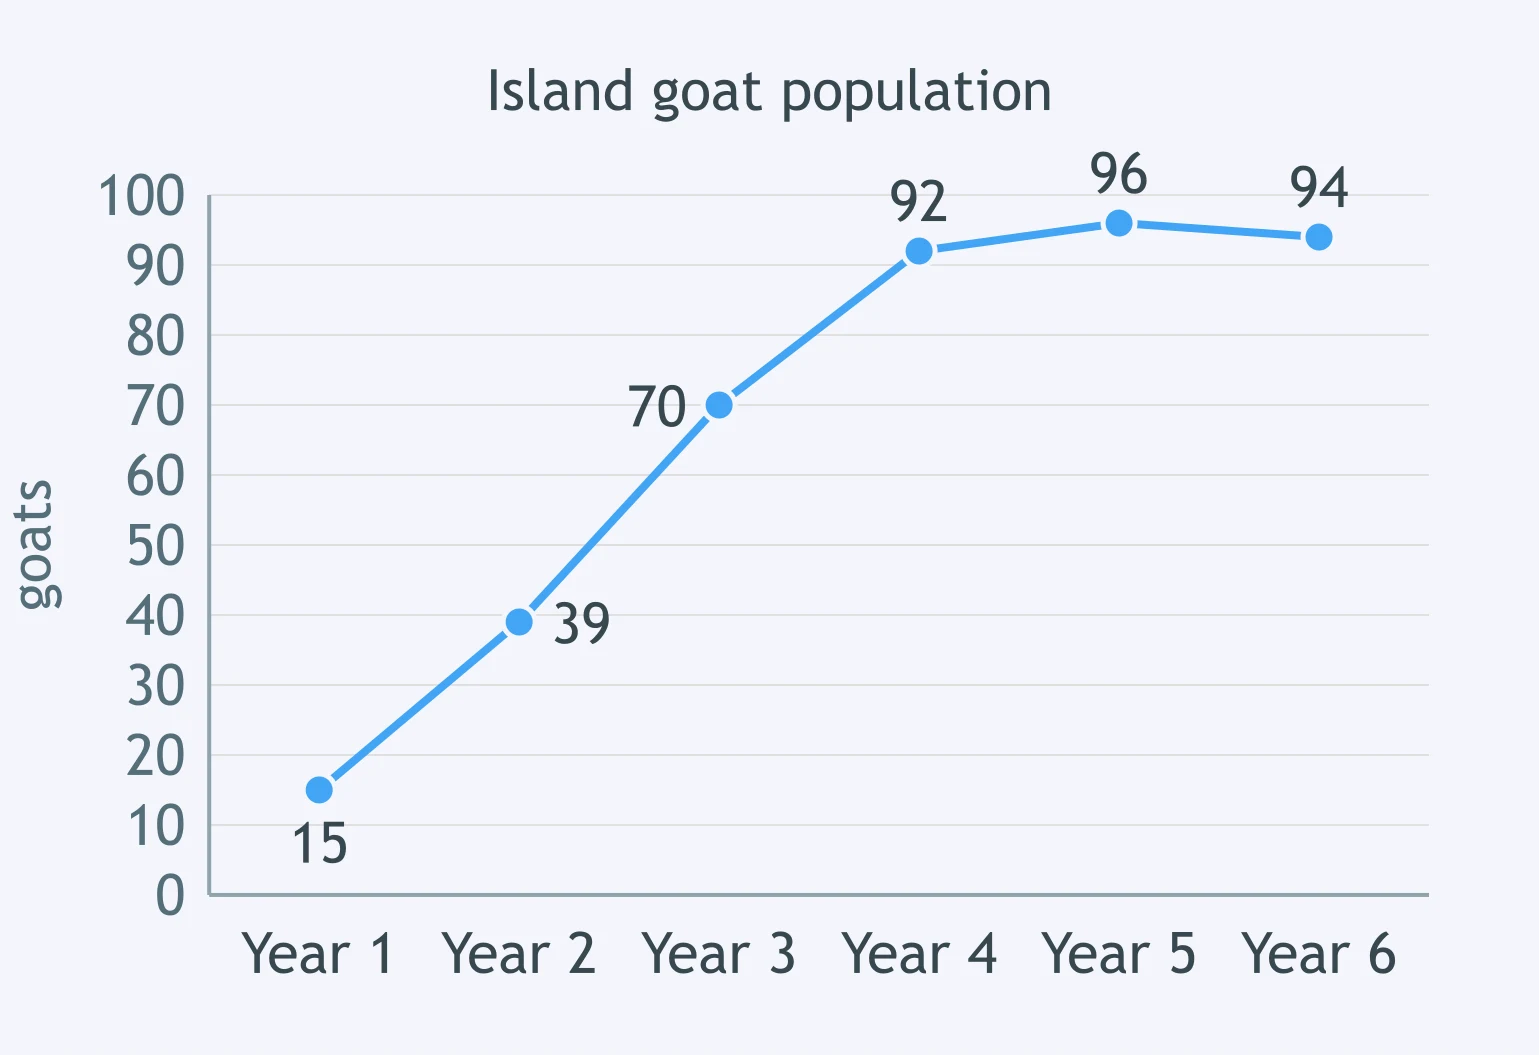
Use the island goat graph. Grass regrew slowly and island size stayed fixed. Why did growth slow after year 4?
Bacteria in a sealed flask of 100 mL broth grew quickly, then stopped increasing. Nothing was added or removed. What best explains the leveling?
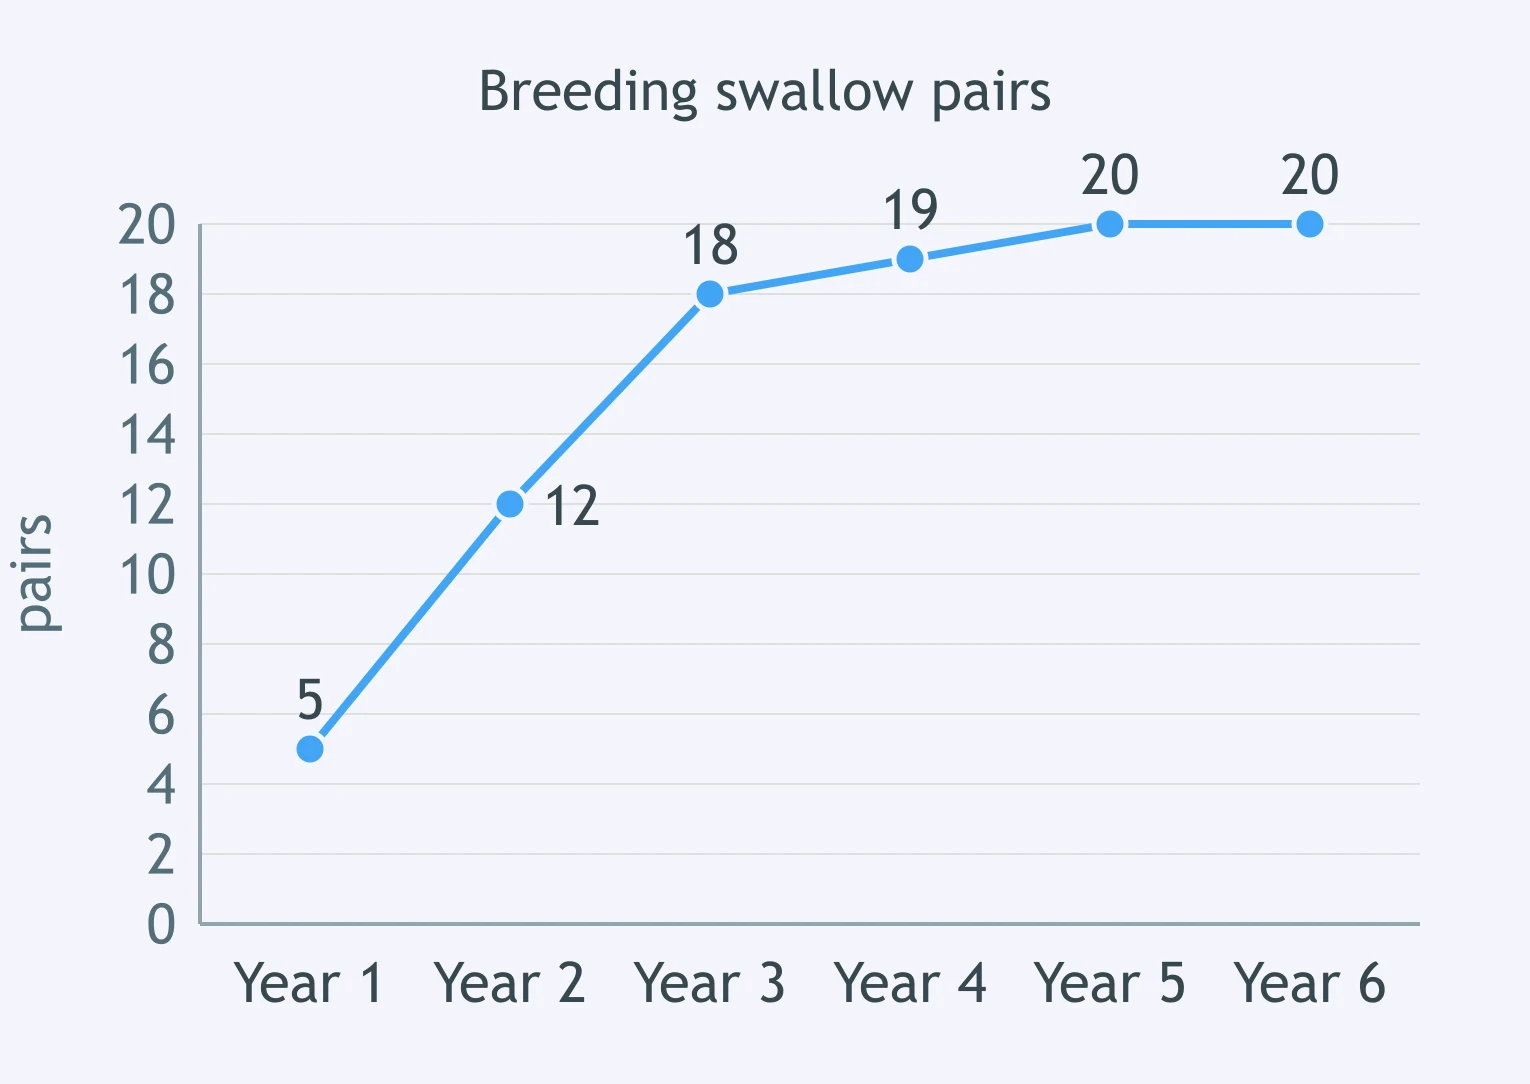
Use the swallow graph. Only 20 nest boxes were available each year. What best explains the near-flat ending?
Aquarium algae doubled for five days, then stayed almost the same after nitrate was used up. Why did growth level off?
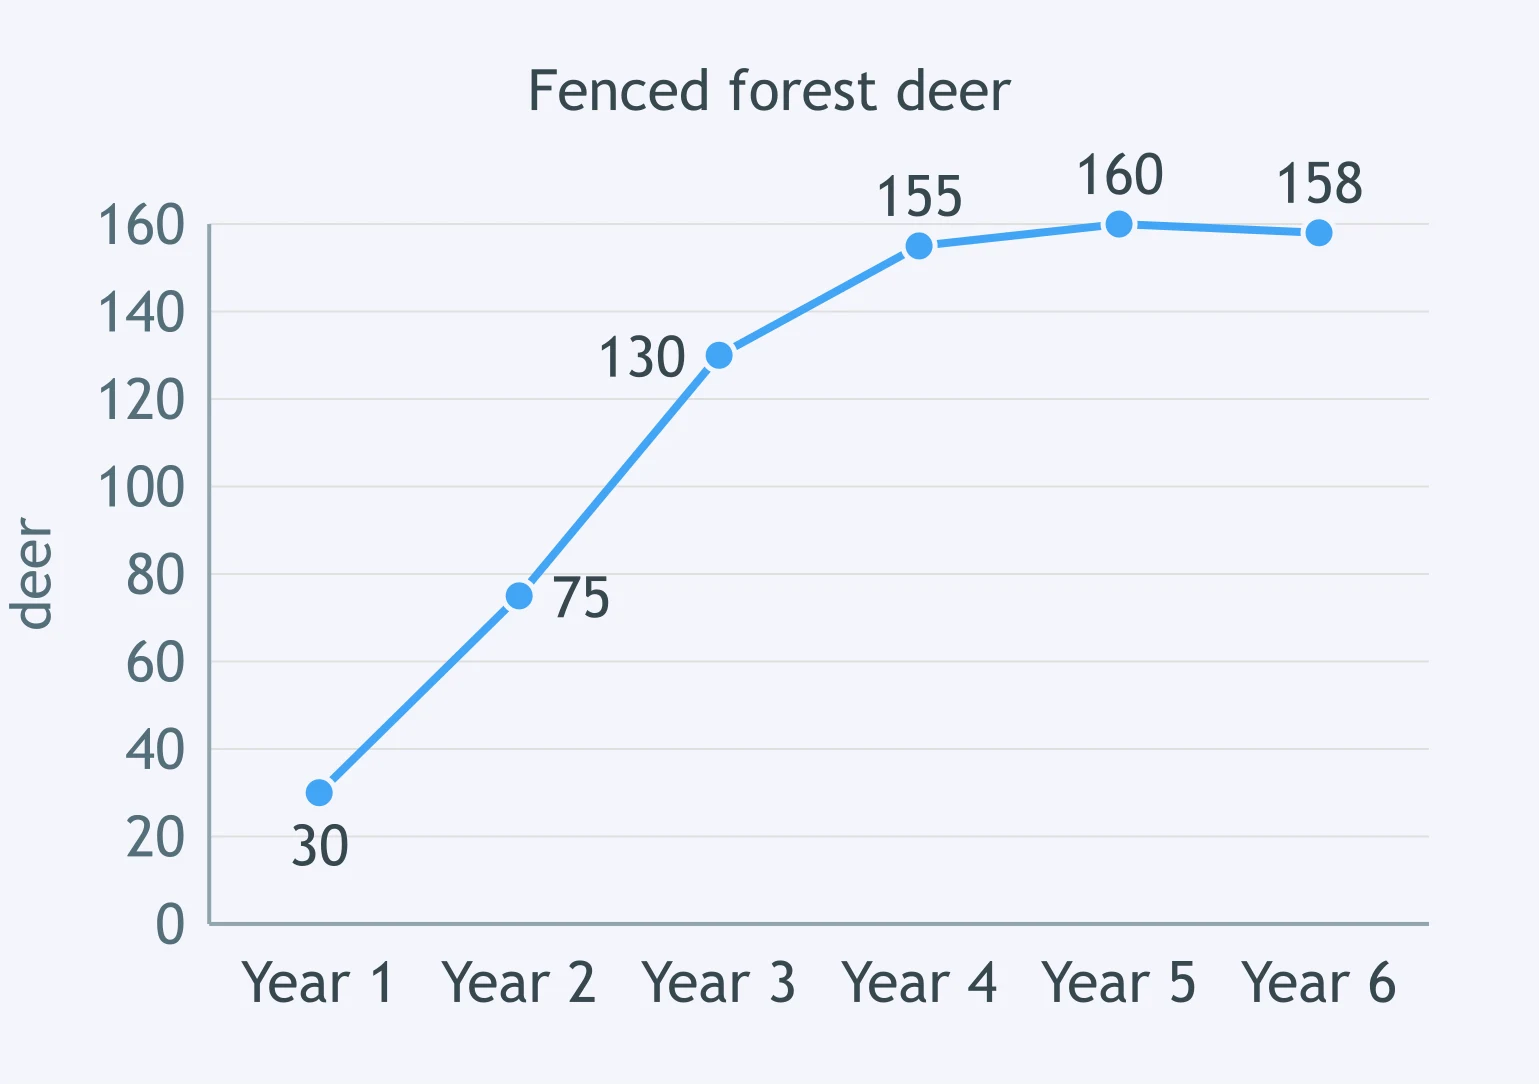
Use the deer graph. Browse plants and space were not added to the fenced forest. Why did the population stabilize?
Snails in a tank rose from 10 to 42, then stayed near 40 while oxygen and plant matter stayed the same. Why?
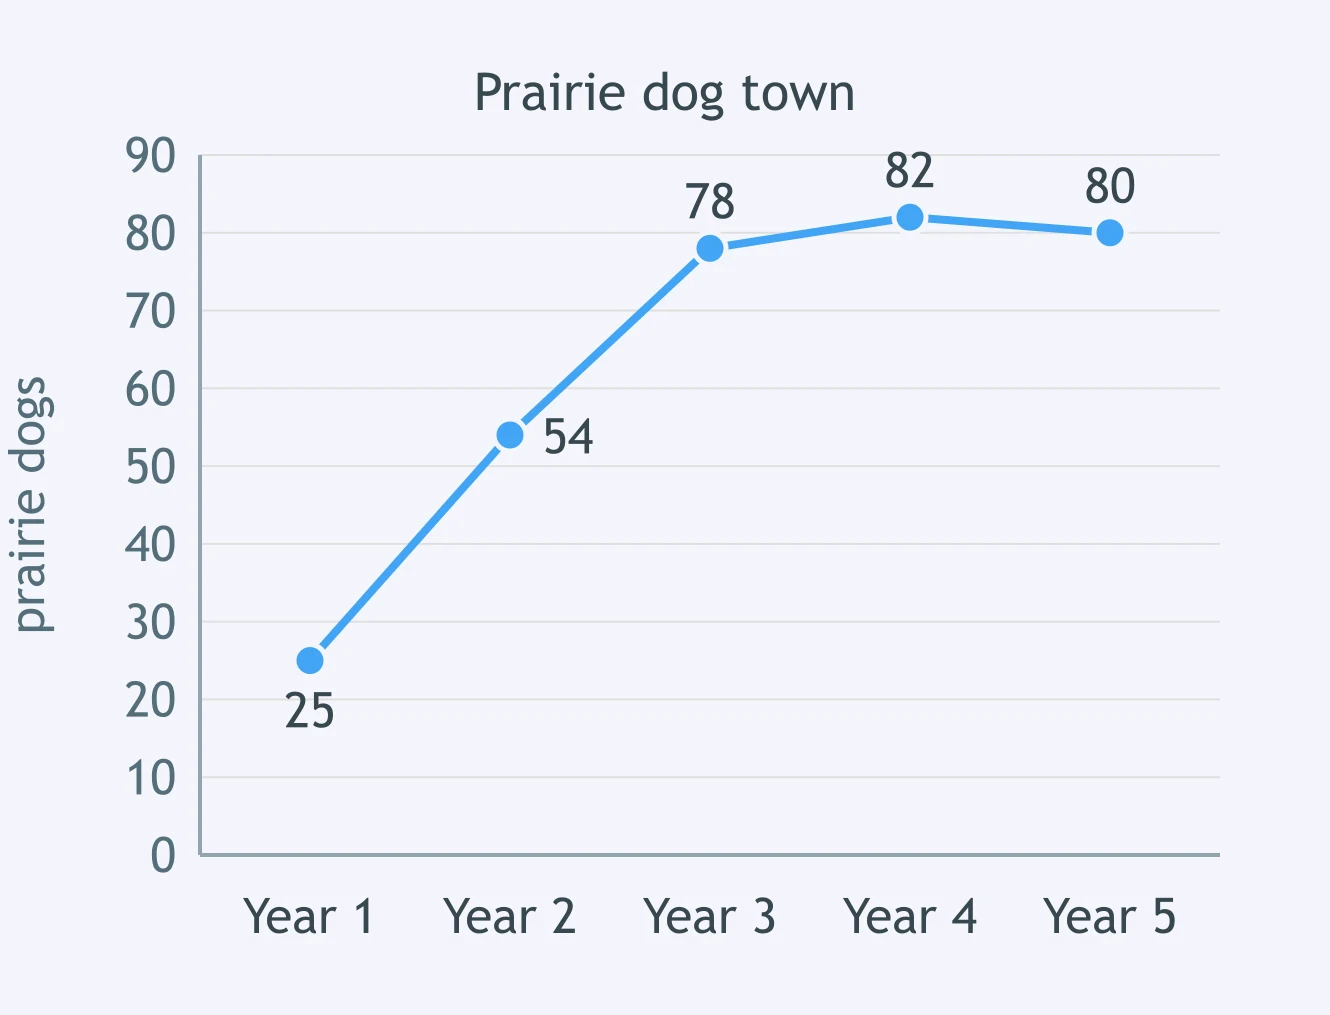
Use the prairie dog graph. Suitable burrow space stayed small. What most likely caused the population to level off?
Yeast in a flask rose from 1,000 to 80,000 cells/mL, then leveled after sugar became low and alcohol waste rose. Why?
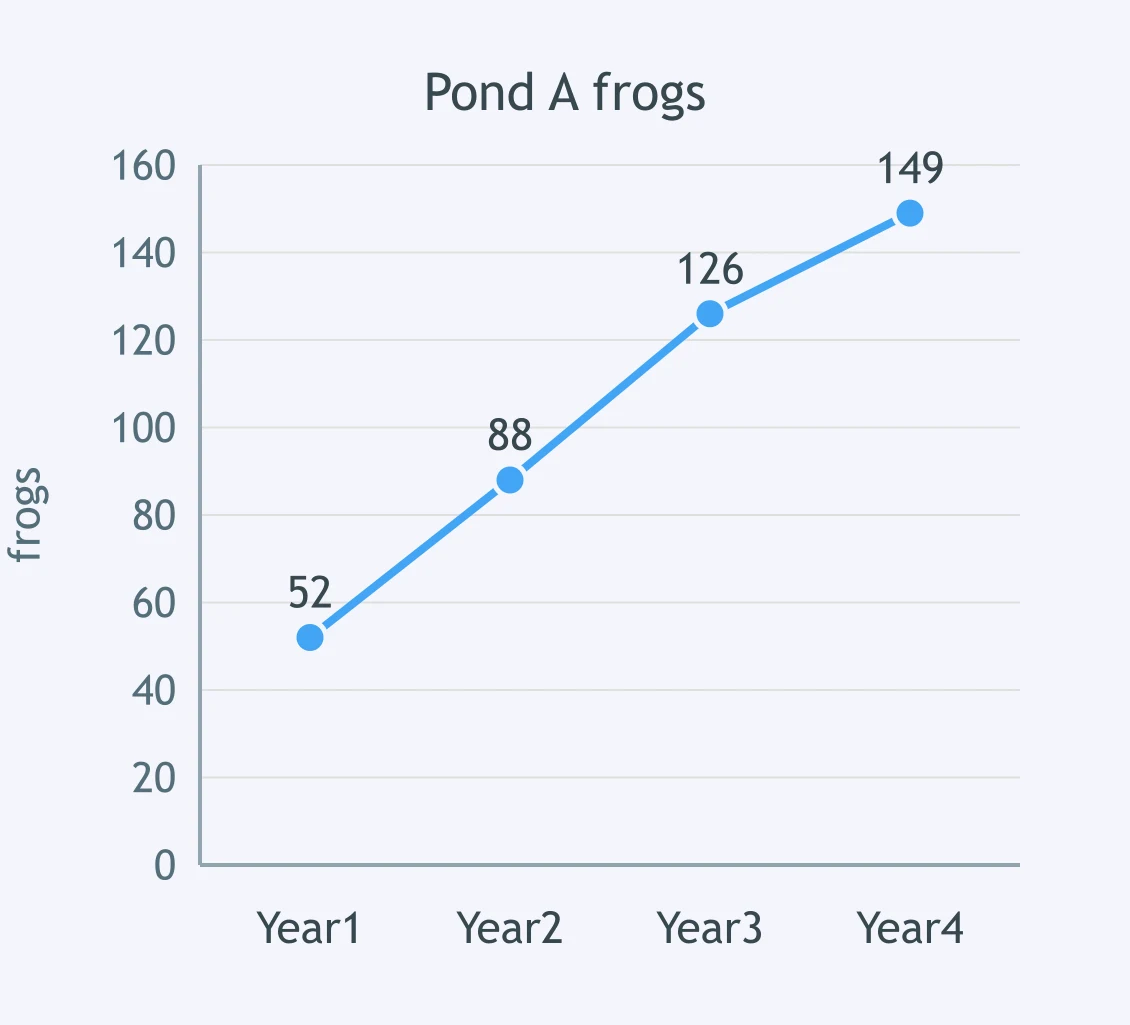
Pond A has many insect larvae; Pond B has few and stayed near 45 frogs. Use Pond A's graph. Which comparison is best?
Two terrariums have the same cricket food. Terrarium X has 6 hiding tiles; Terrarium Y has 1. Which prediction is best?
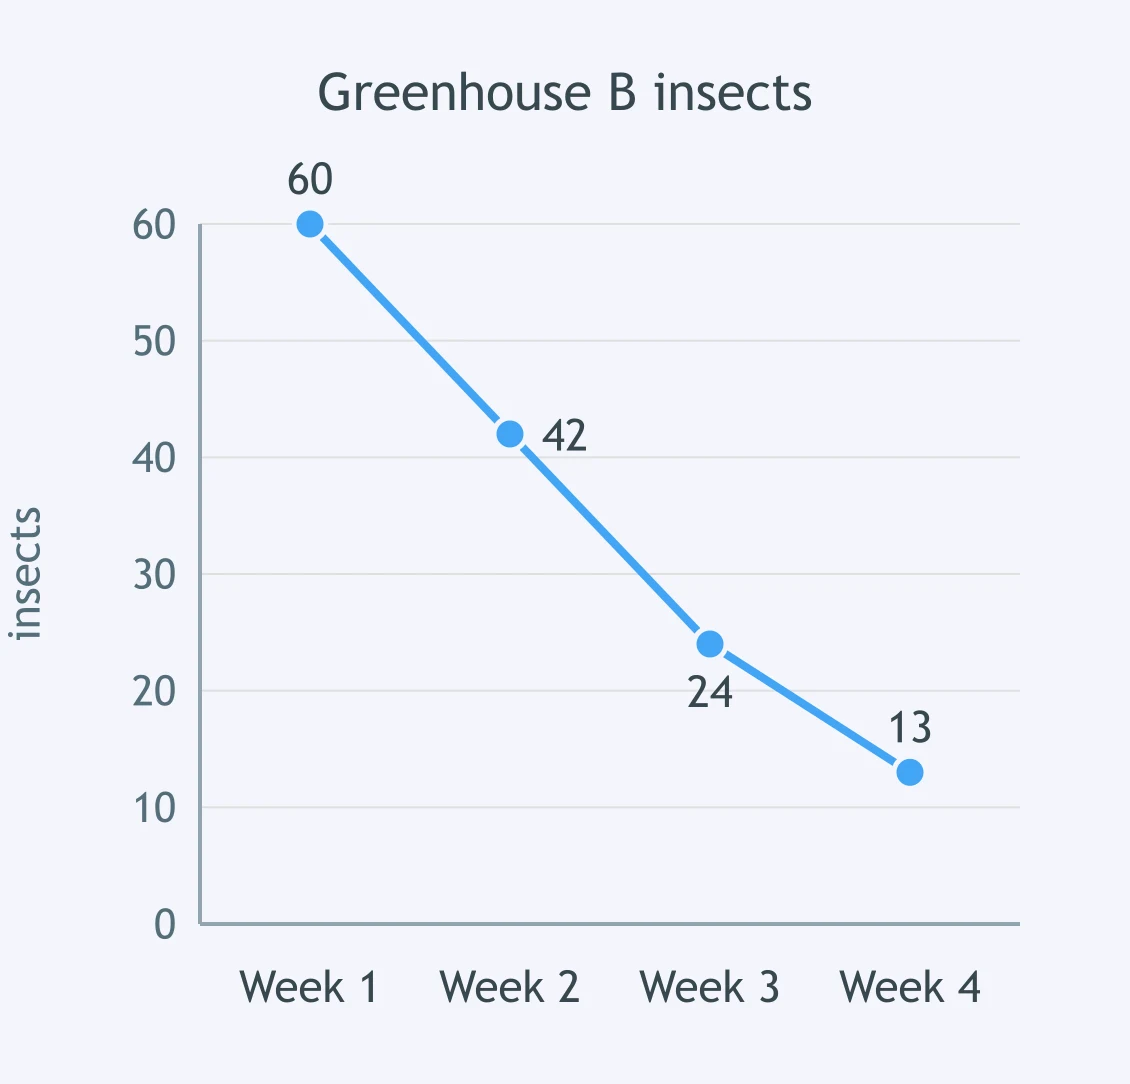
Greenhouse A kept flowering plants and stayed near 65 insects. Use the graph for Greenhouse B after flowers were removed. Which comparison fits?
Two streams have similar algae. Stream 1 is cool and oxygen-rich. Stream 2 is warm with low oxygen. Which mayfly prediction is best?
Island A has many nesting trees and reached 90 breeding birds. Use Island B's graph with few nesting trees. Which comparison fits?
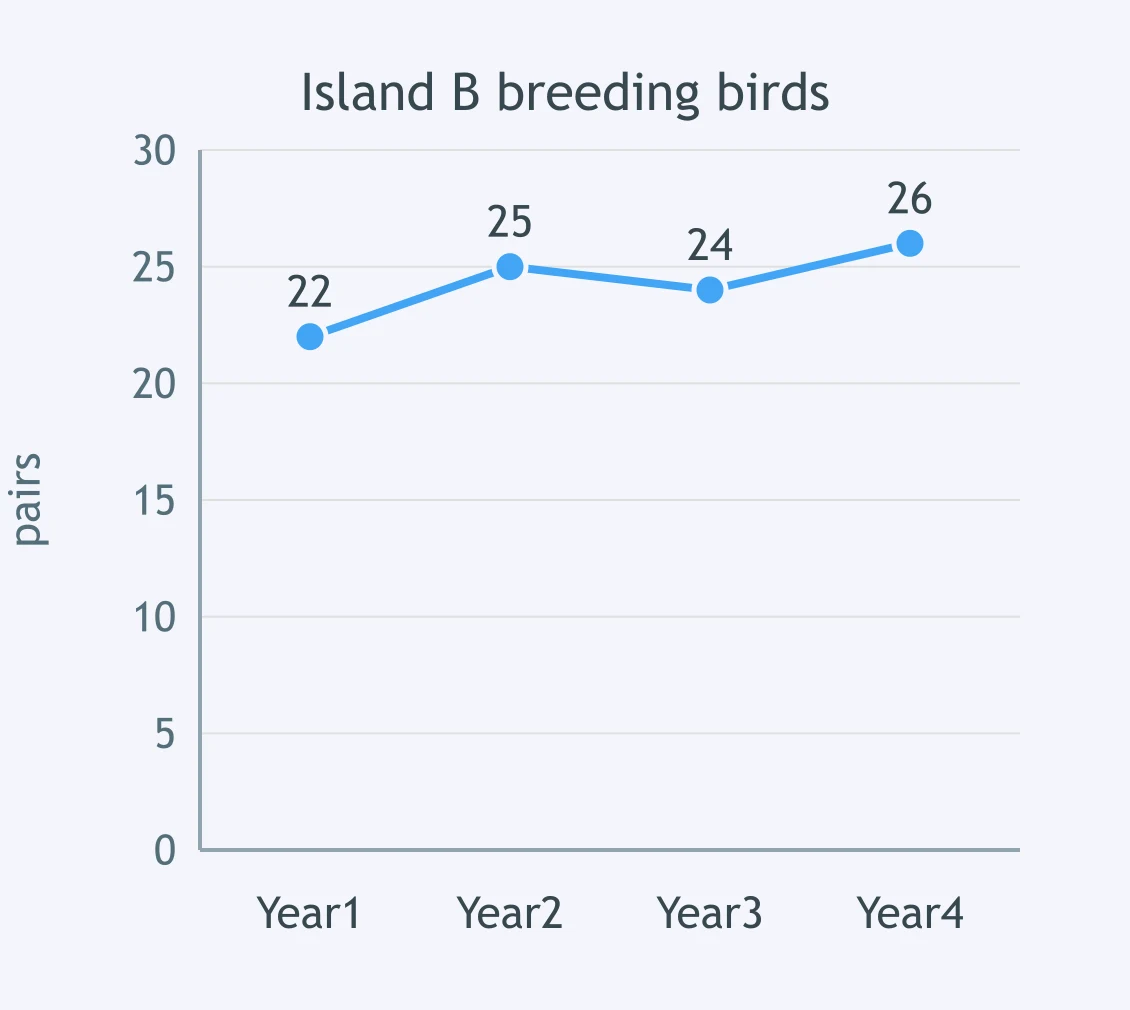
Two lakes get the same sunlight. Lake 1 has high phosphorus. Lake 2 has very low phosphorus. Which algae prediction is best?
Enclosure A had three water stations and stayed near 80 deer. Use Enclosure B's graph with one drying water station. Which comparison fits?
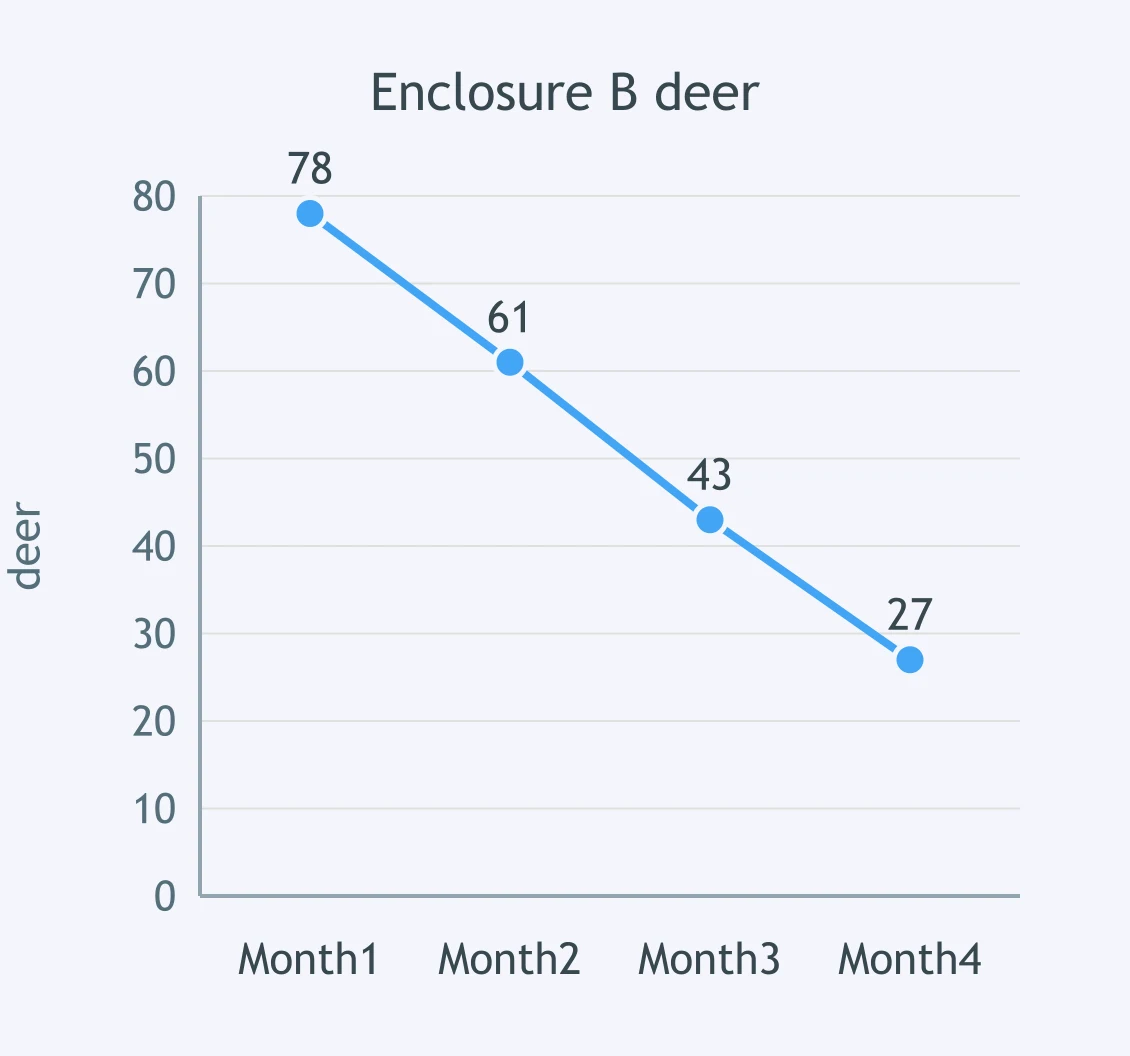
Two cabbage beds have equal predators. Bed A soil stays moist. Bed B dries often. Aphids feed on cabbage sap. Which prediction is best?
Seeds were added in March. Use the sparrow graph. Which evidence best supports that seed availability affected sparrows?
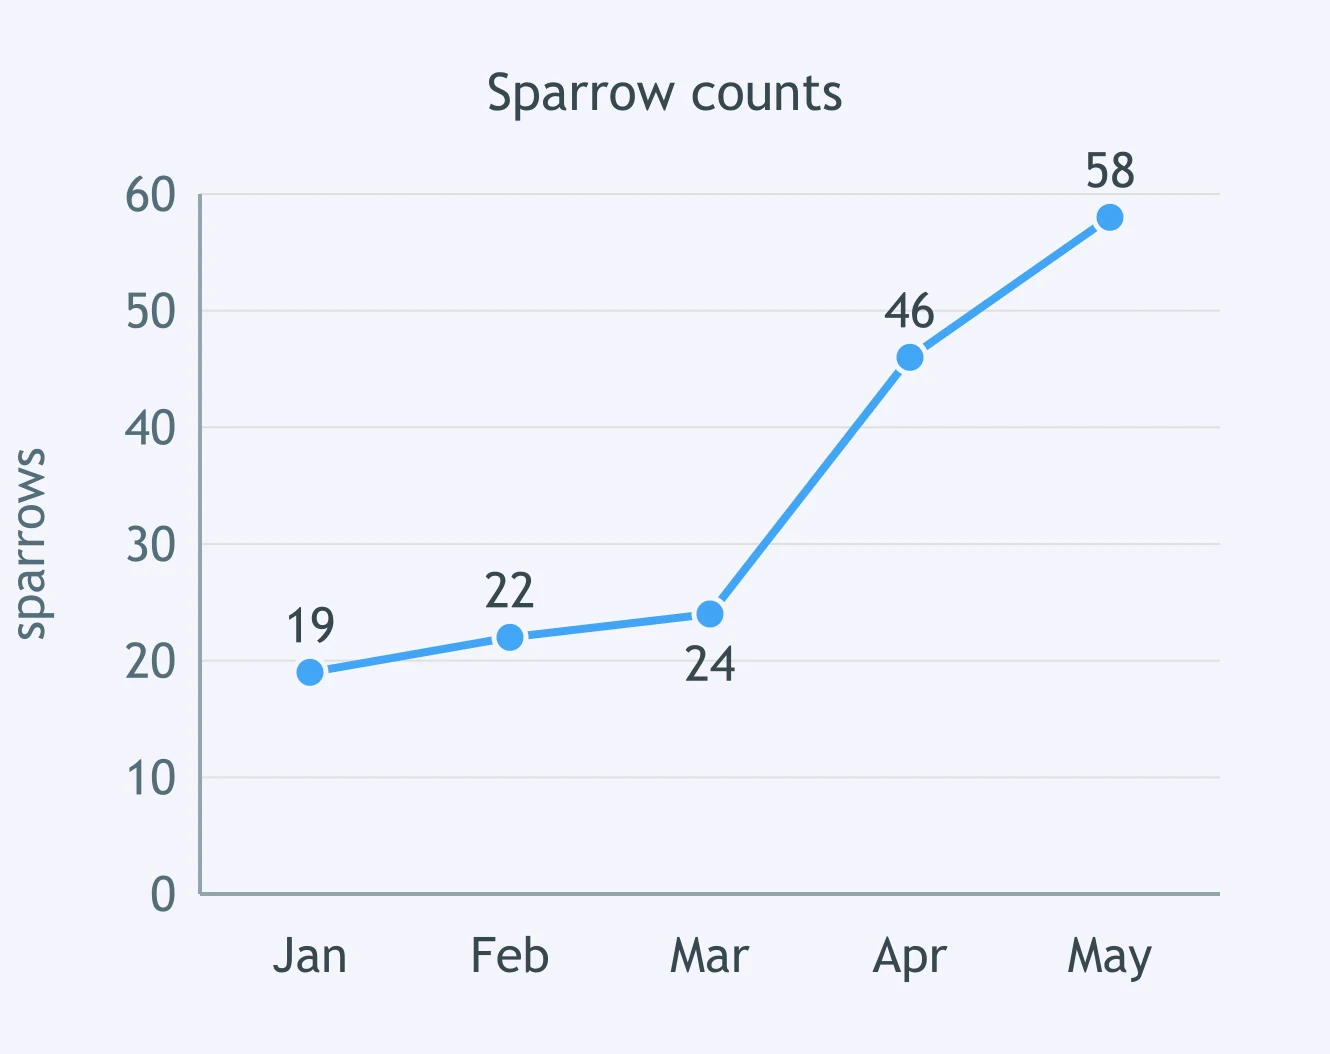
A student claims water limited a deer population. Which evidence best supports the claim?
A grain spill began in March. Use the mouse graph. Which evidence best supports that food affected the mouse population?
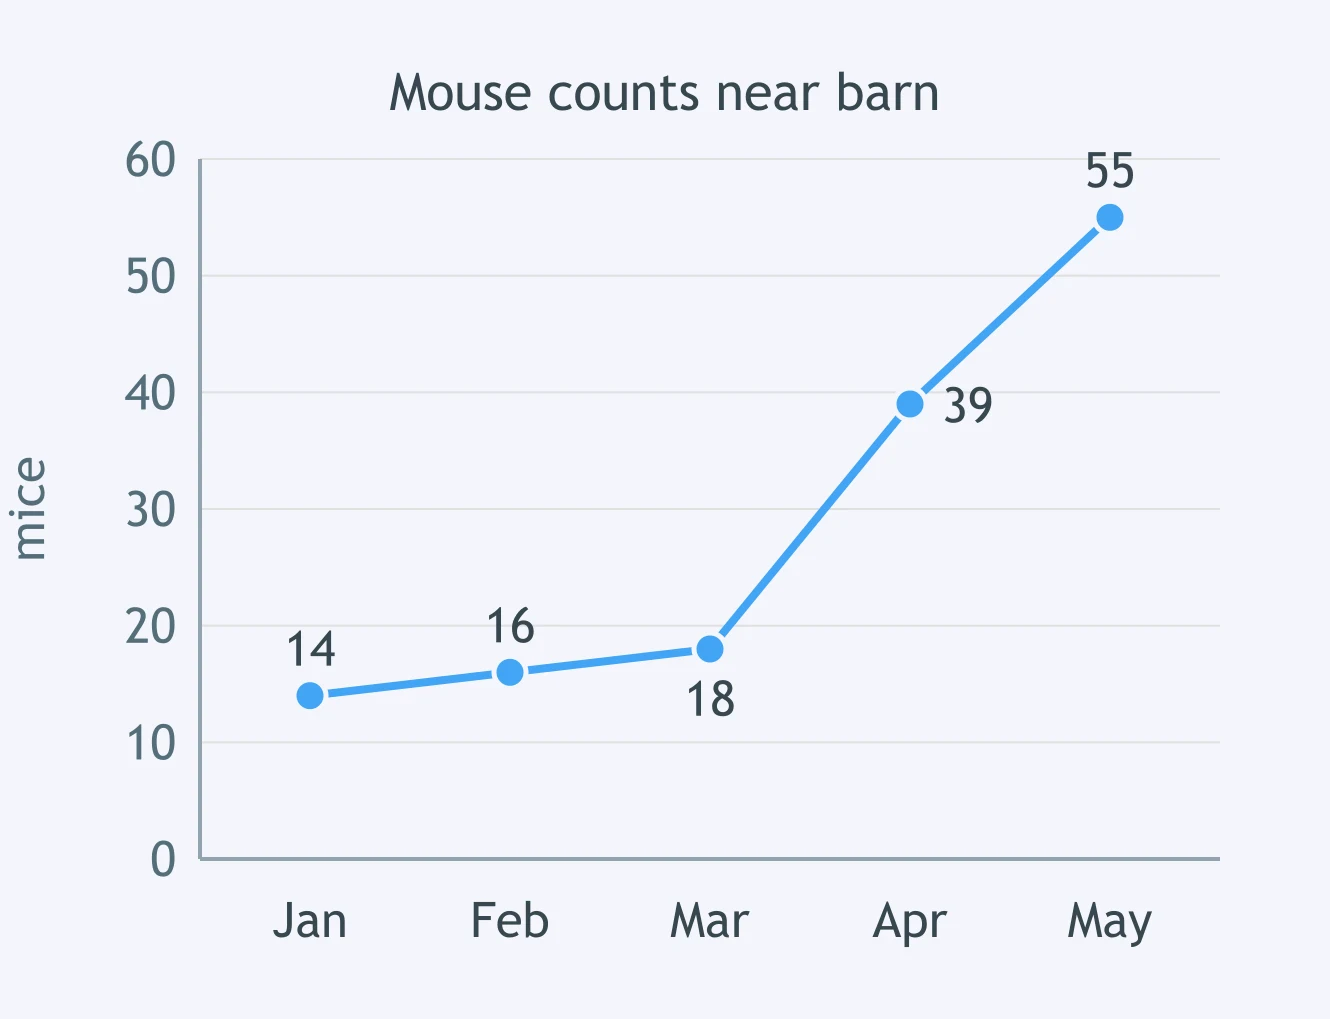
A student claims nest cavities limited bluebirds. Which evidence would best support the claim?
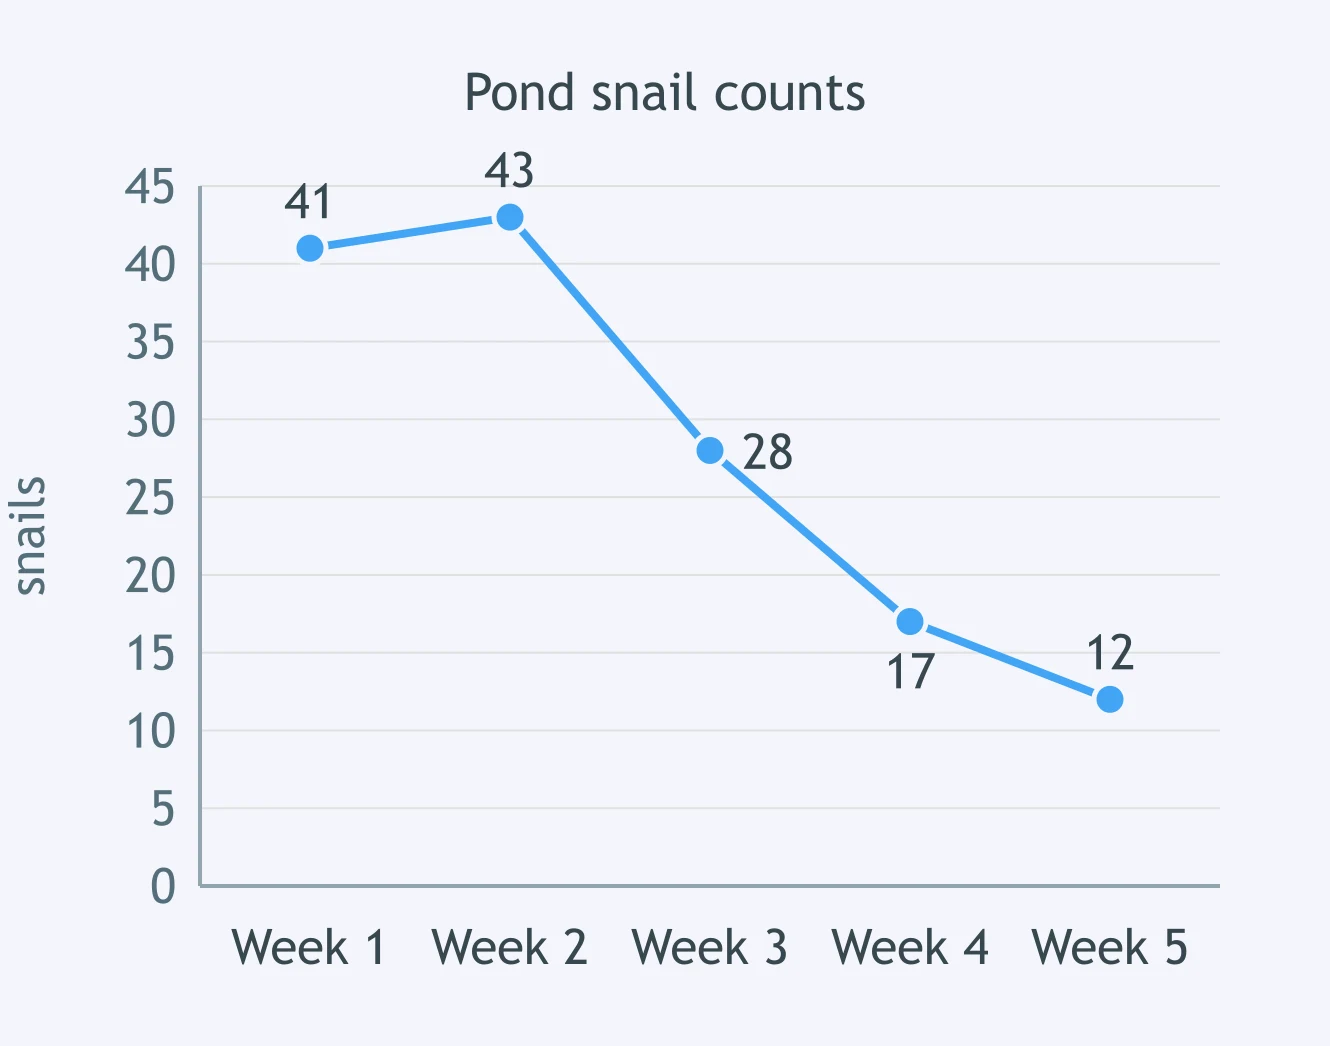
Aquatic plants were removed after week 2. Use the snail graph. Which evidence supports that plants were an important resource?
A student claims open space limited barnacle settlement. Which evidence best supports the claim?
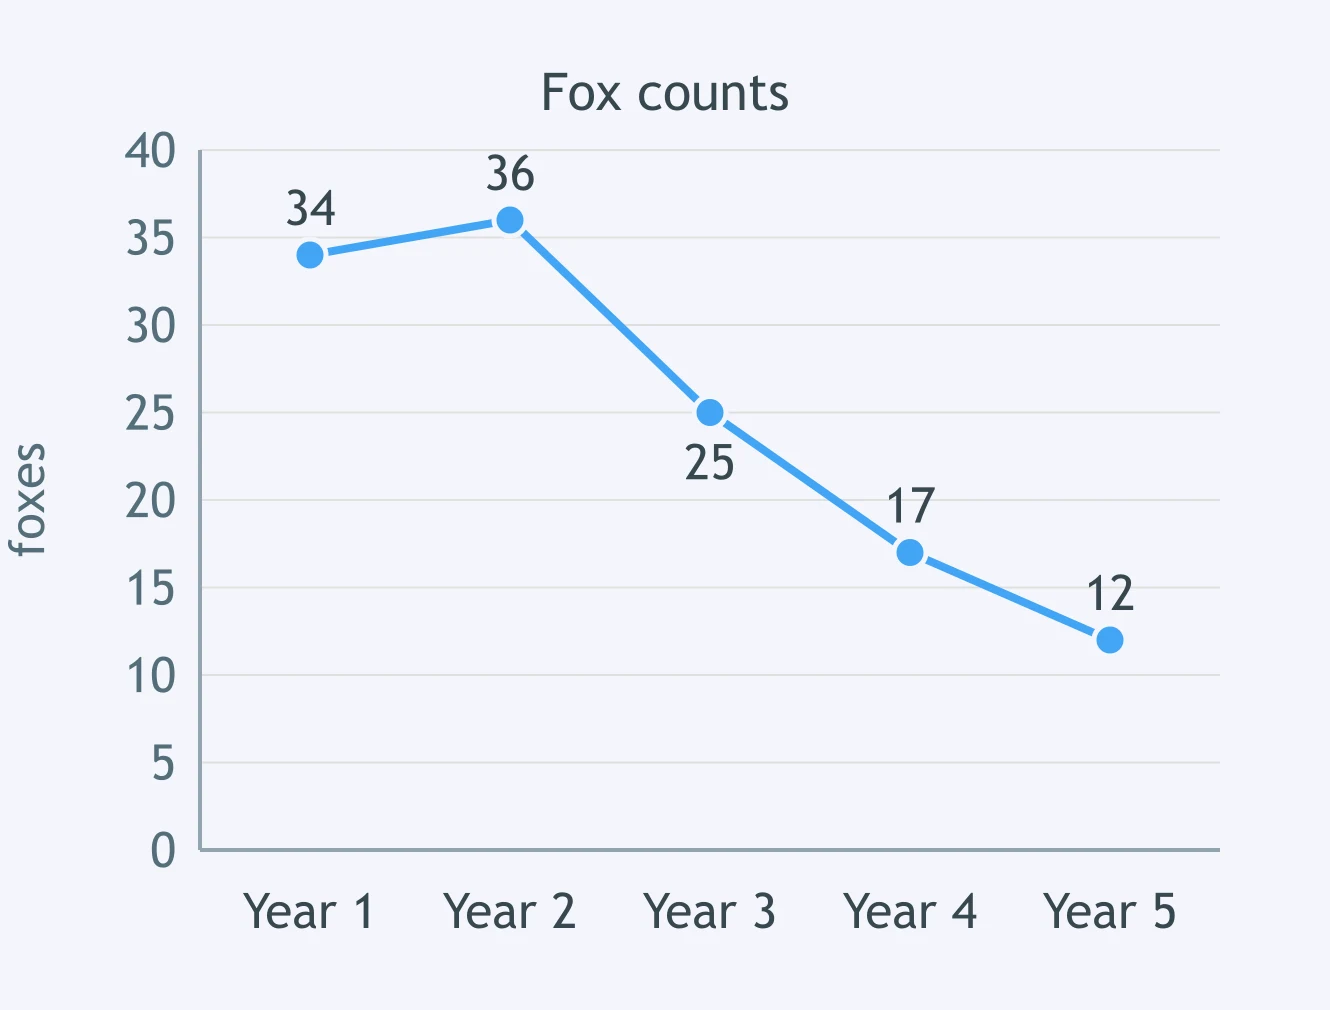
Rabbit numbers dropped after year 2. Use the fox graph. Which evidence supports that prey availability affected foxes?
A student claims shelter limited salamanders. Which evidence best supports the claim?
Crack the passcode before the zombies get in.
Answer, then swat bugs for bonus points.
Race through questions at your own speed.
Same question on every screen. Fastest wins.

Pick a tile, answer, hit bonuses and steals.
When an Ecosystem Is Disrupted
20 questions