Loading
by BlastRoom
Practise selecting strong Task 1 overviews from adequate statements.
#writing_task_1#ielts_7_0

25 questions
One question set, multiple game modes. Tap any game to see it in action. Not sure which to pick?
Answer to place stones and capture territory.
Outrun the snow together.
Earn blasts, then hunt the other team.
Answer to earn energy, then climb.

The class blasts through walls together.
Bid on mystery lots. Most money wins.
Sell tours. Nice, standard, or a total scam.

Answer, restock, and serve the rush.
More correct answers pulls the rope your way.
Answer, then shoot down the alien wave.
Answer, then tap to leap the frozen ridge.
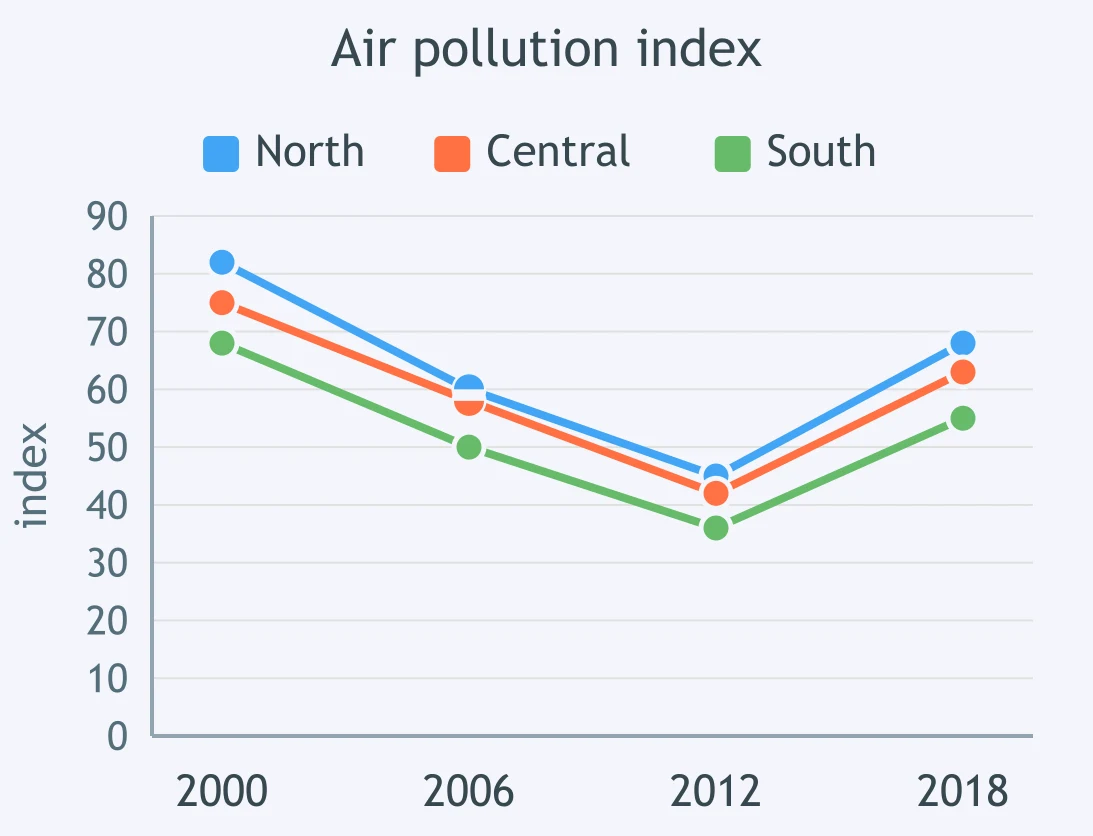
The line chart compares an air-pollution index in three regions across four years. Which overview is stronger?
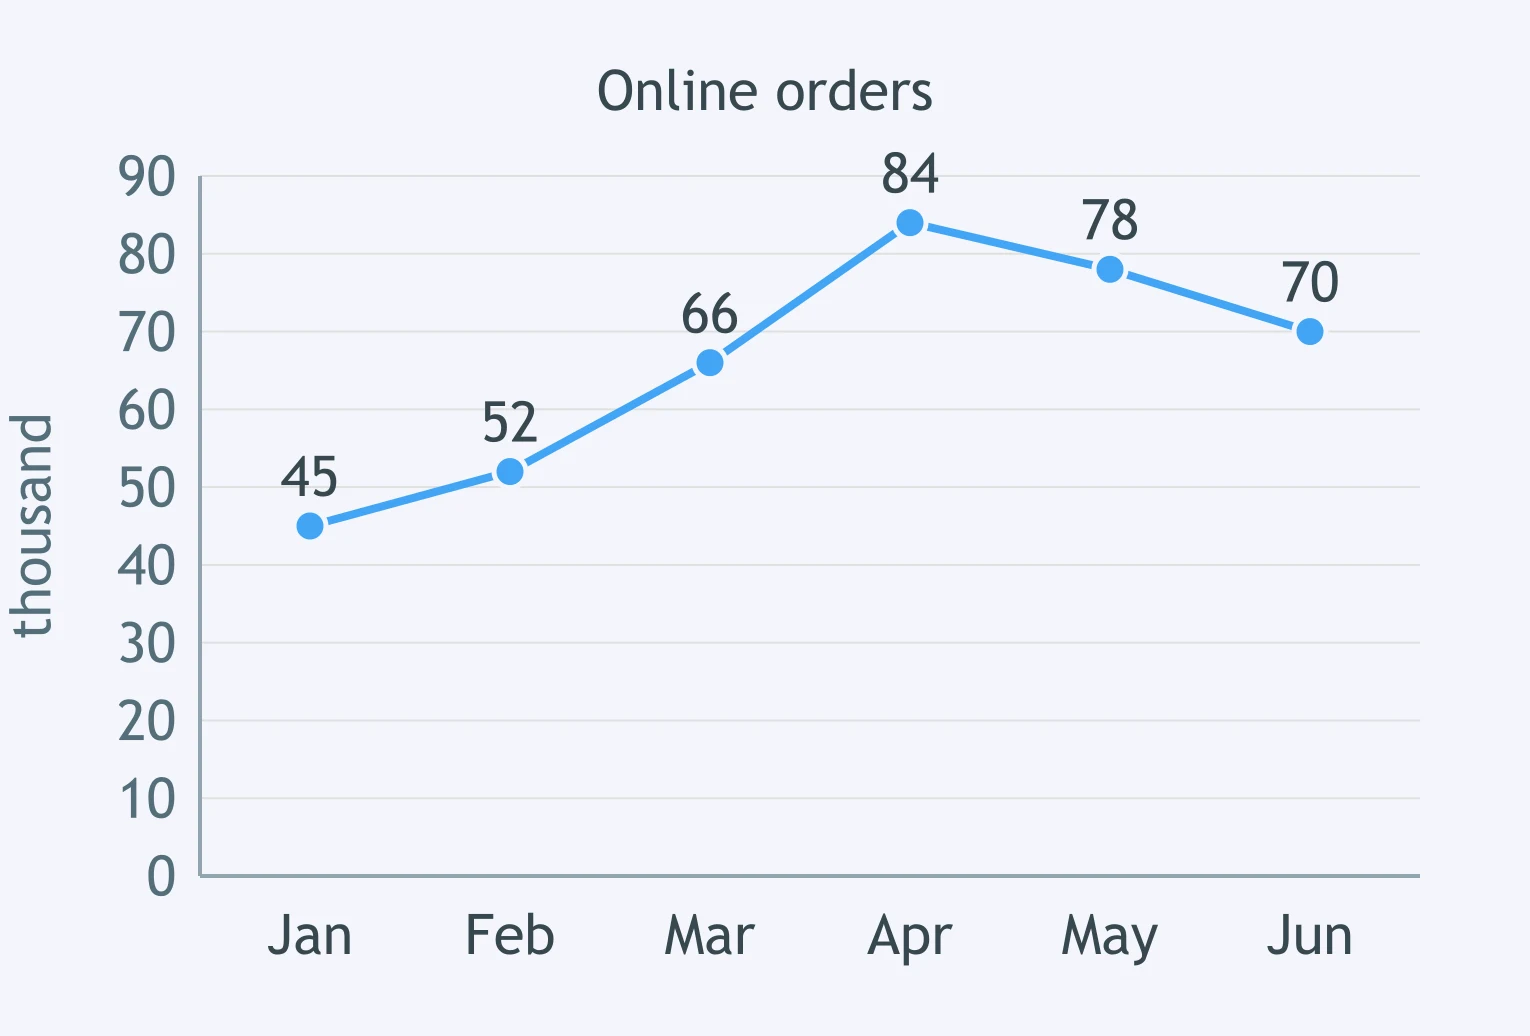
The line graph shows monthly online orders from January to June. Choose the best overview sentence.
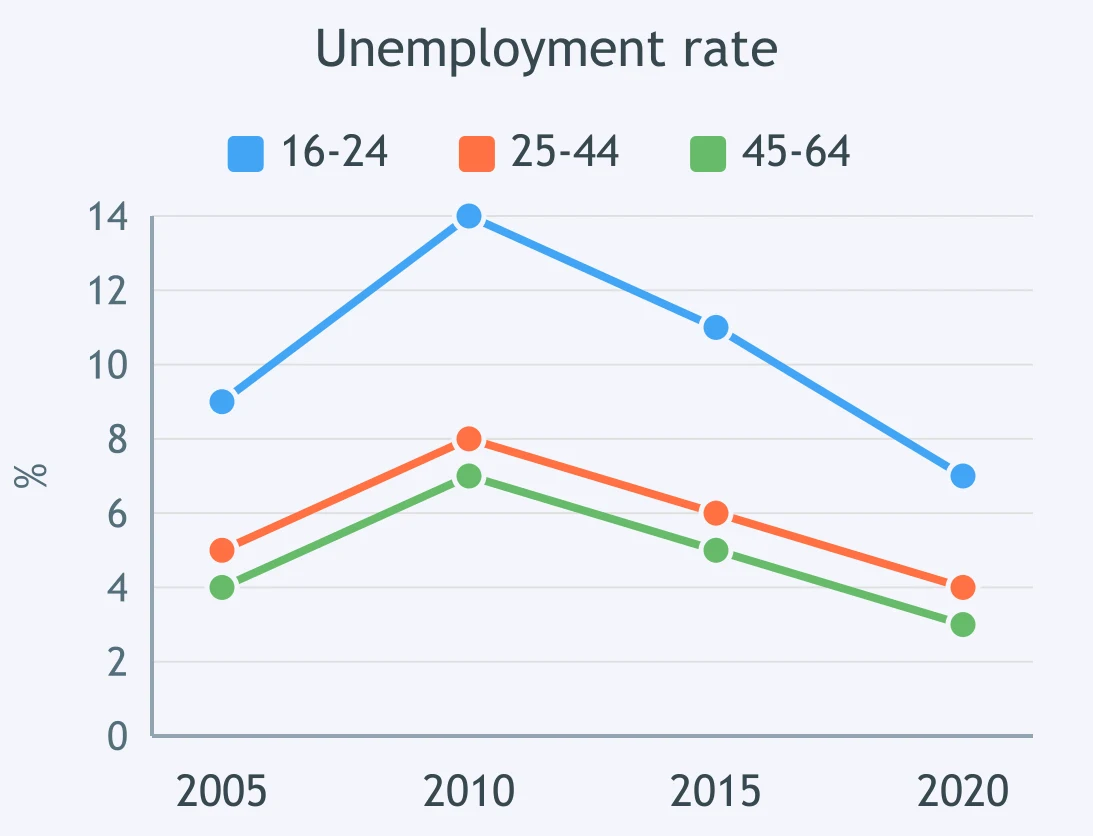
A line chart compares unemployment rates for three age groups. Which candidate sentence gives the strongest overview?
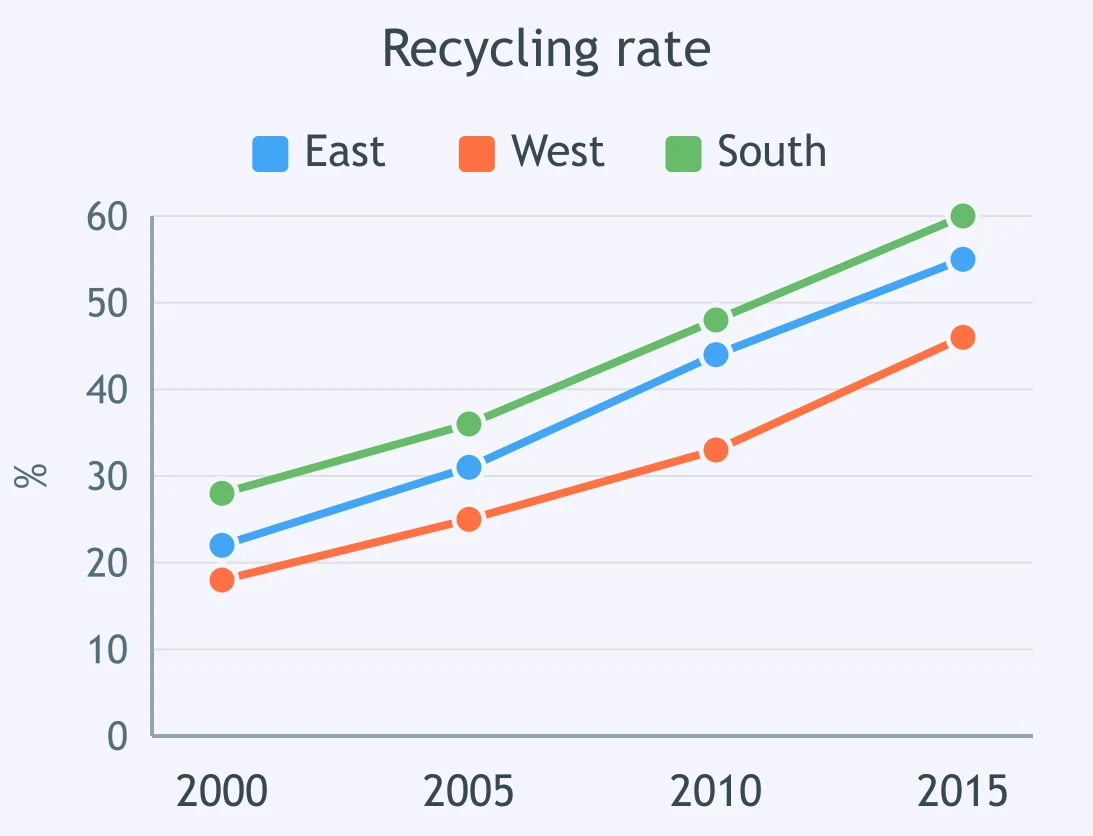
The figure tracks recycling rates in three councils. Which sentence would work best in the overview?
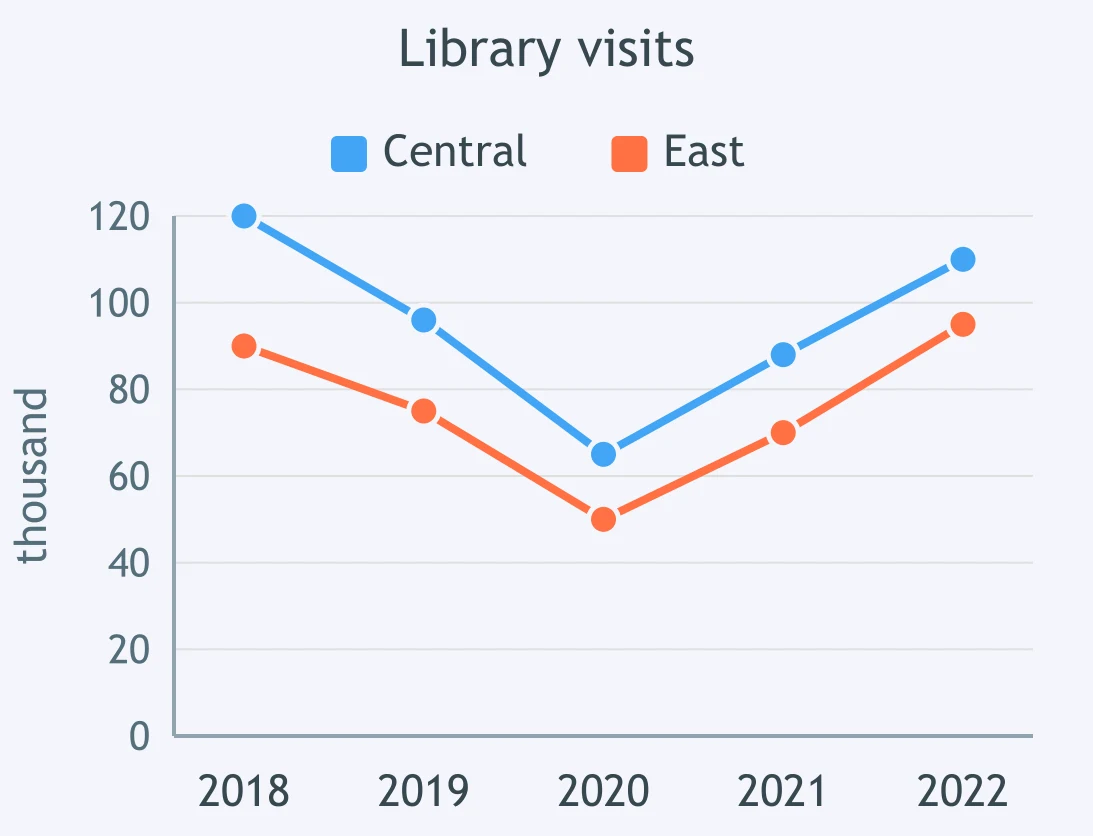
The line chart shows visits to two library branches over five years. Which overview is the strongest?
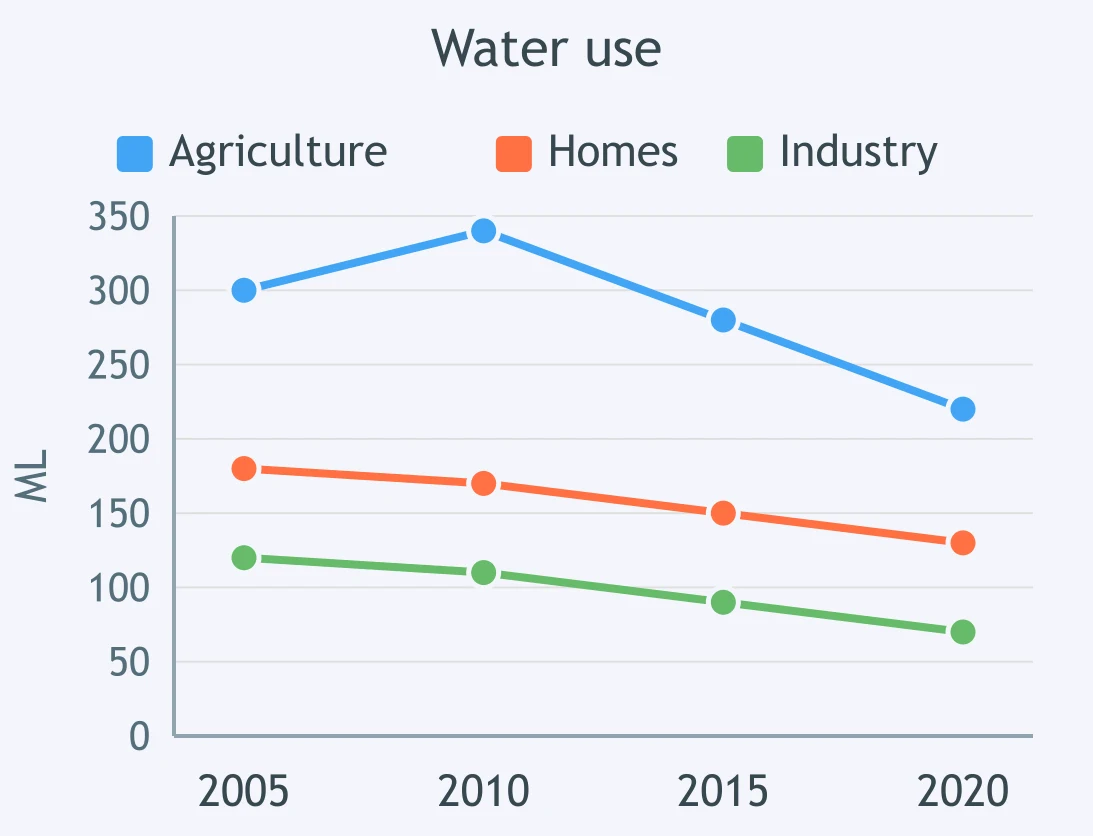
A line chart compares water use in three sectors. Select the more effective overview.
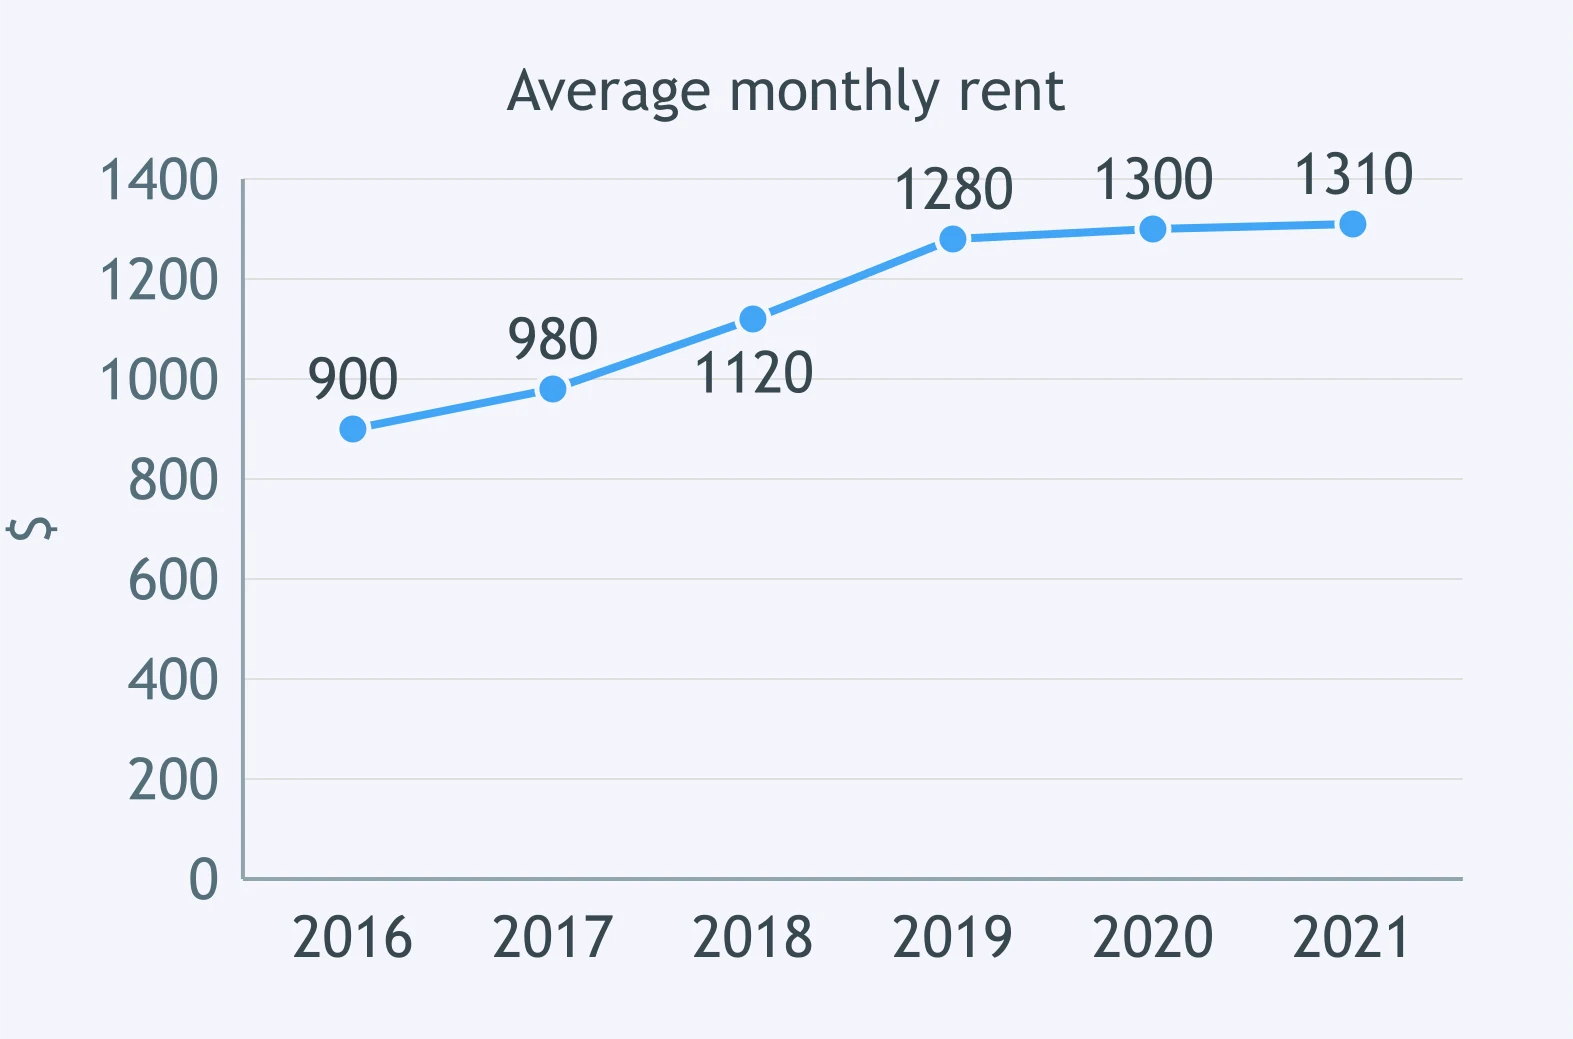
The line graph shows average rent over six years. Which sentence is the best overview?
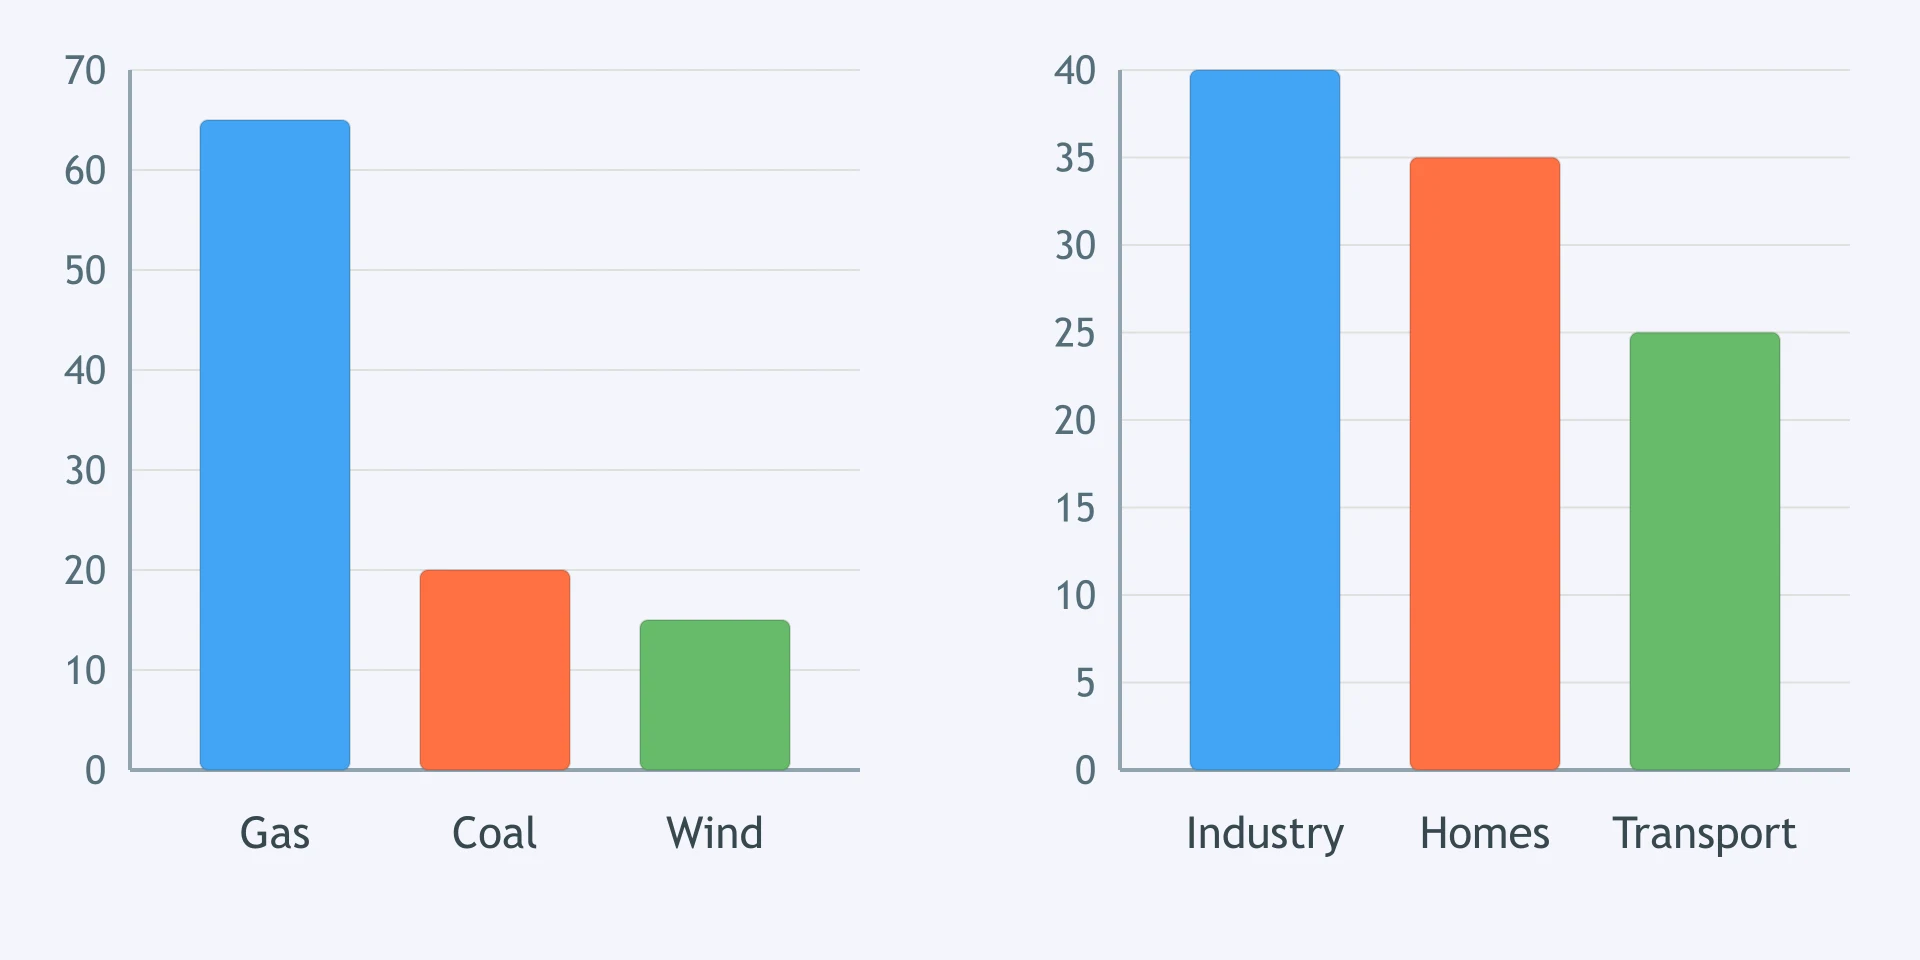
The left bar chart shows energy production by source, and the right one shows consumption by sector. Which overview covers the figure adequately?
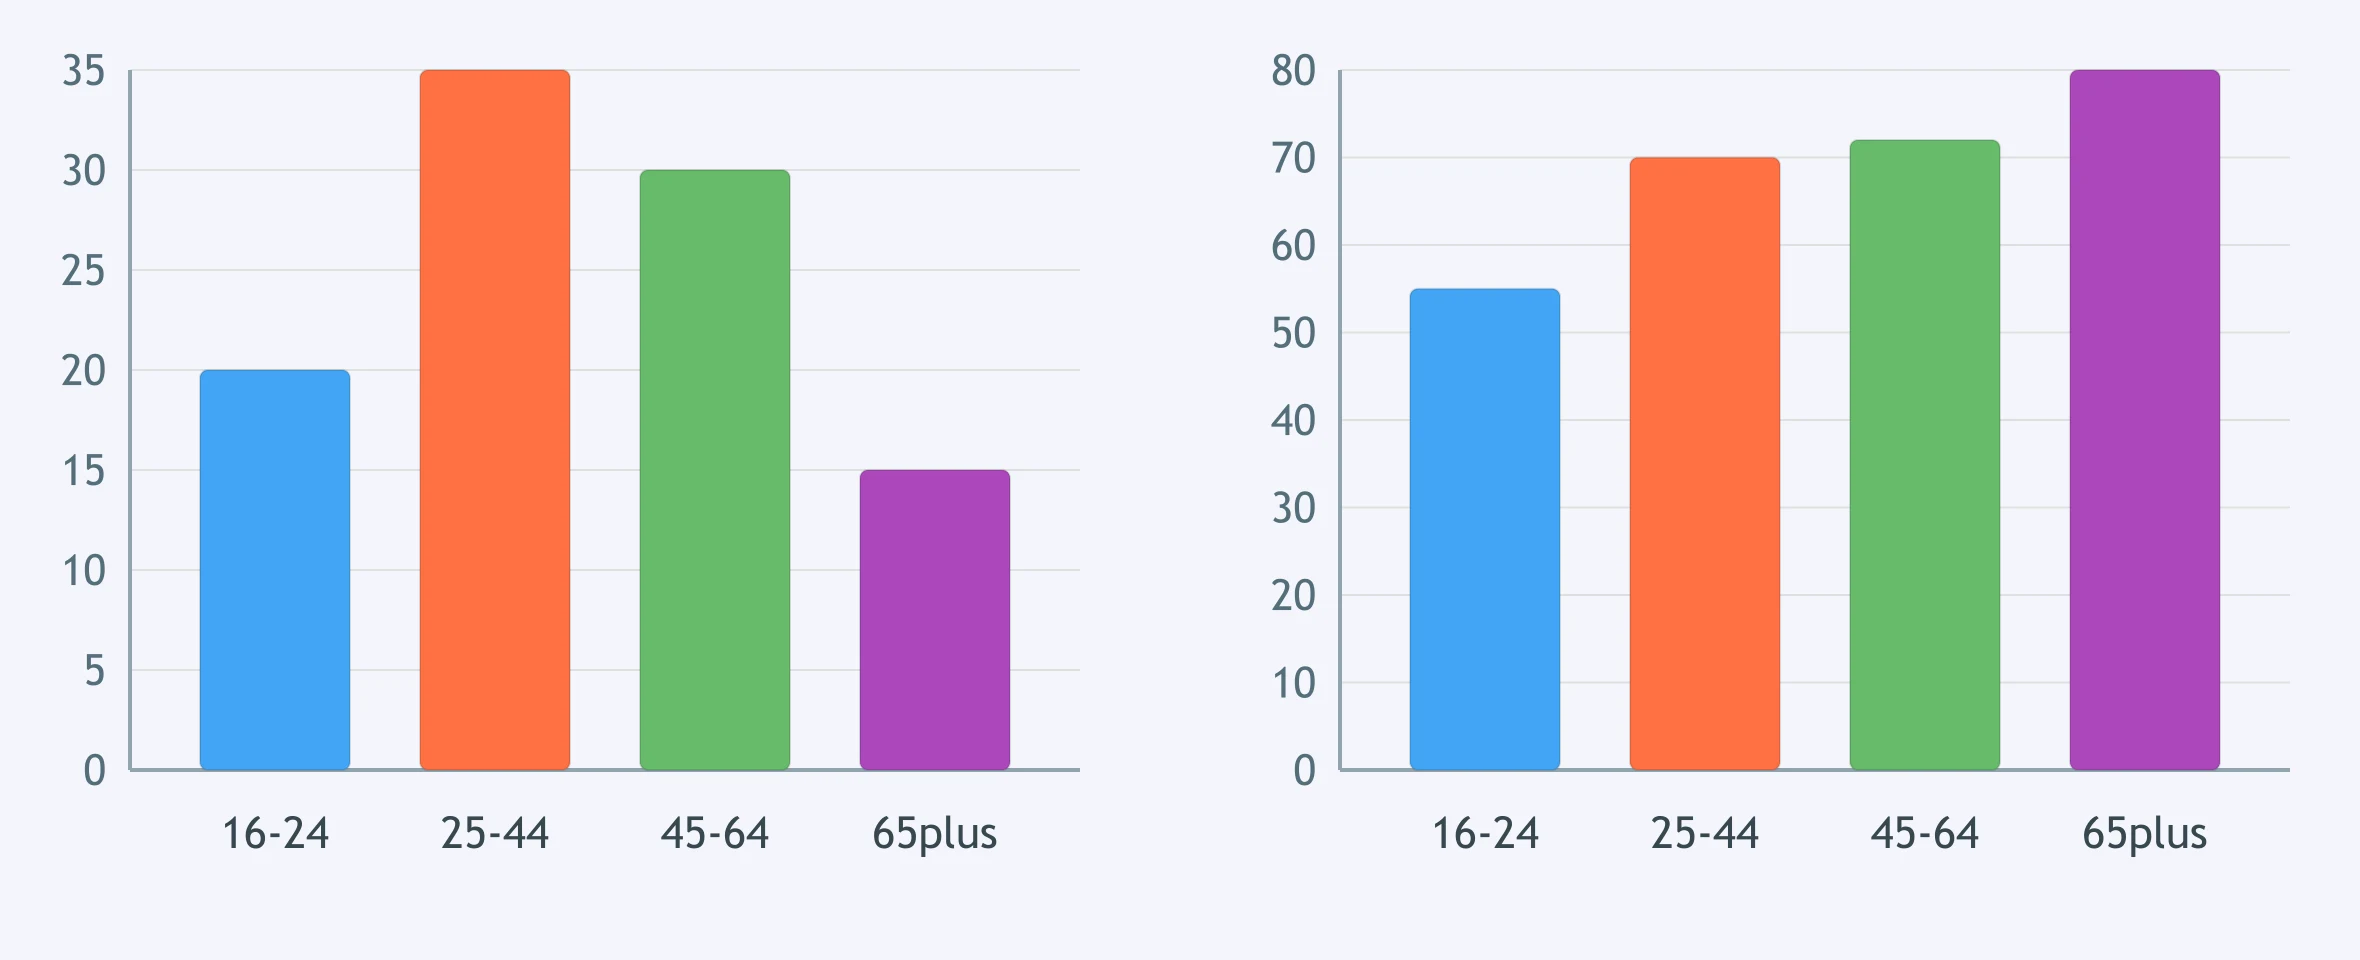
One bar chart shows museum visitors by age; the other shows satisfaction by age. Which overview covers both panels?
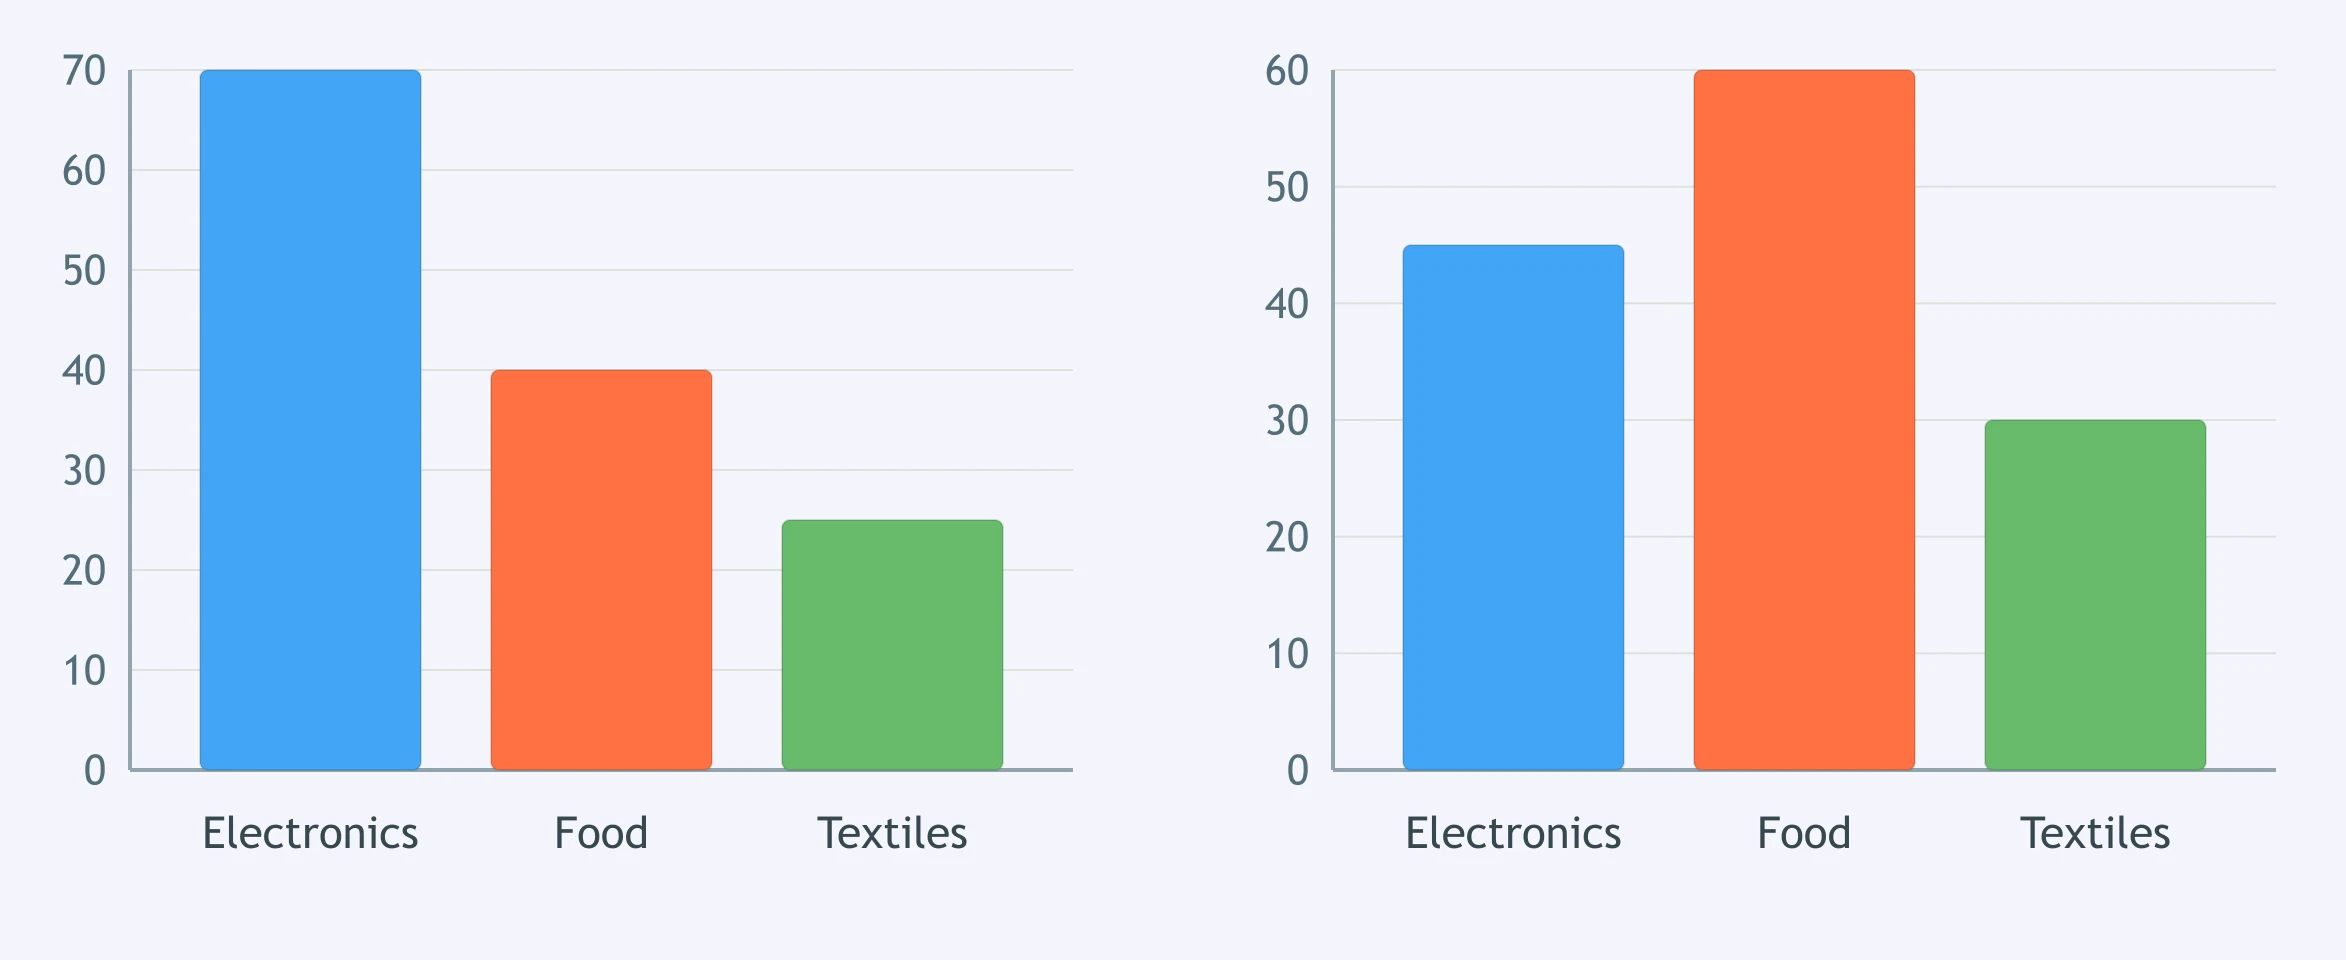
The paired bar charts compare exports and imports by product. Which sentence functions as a complete overview?
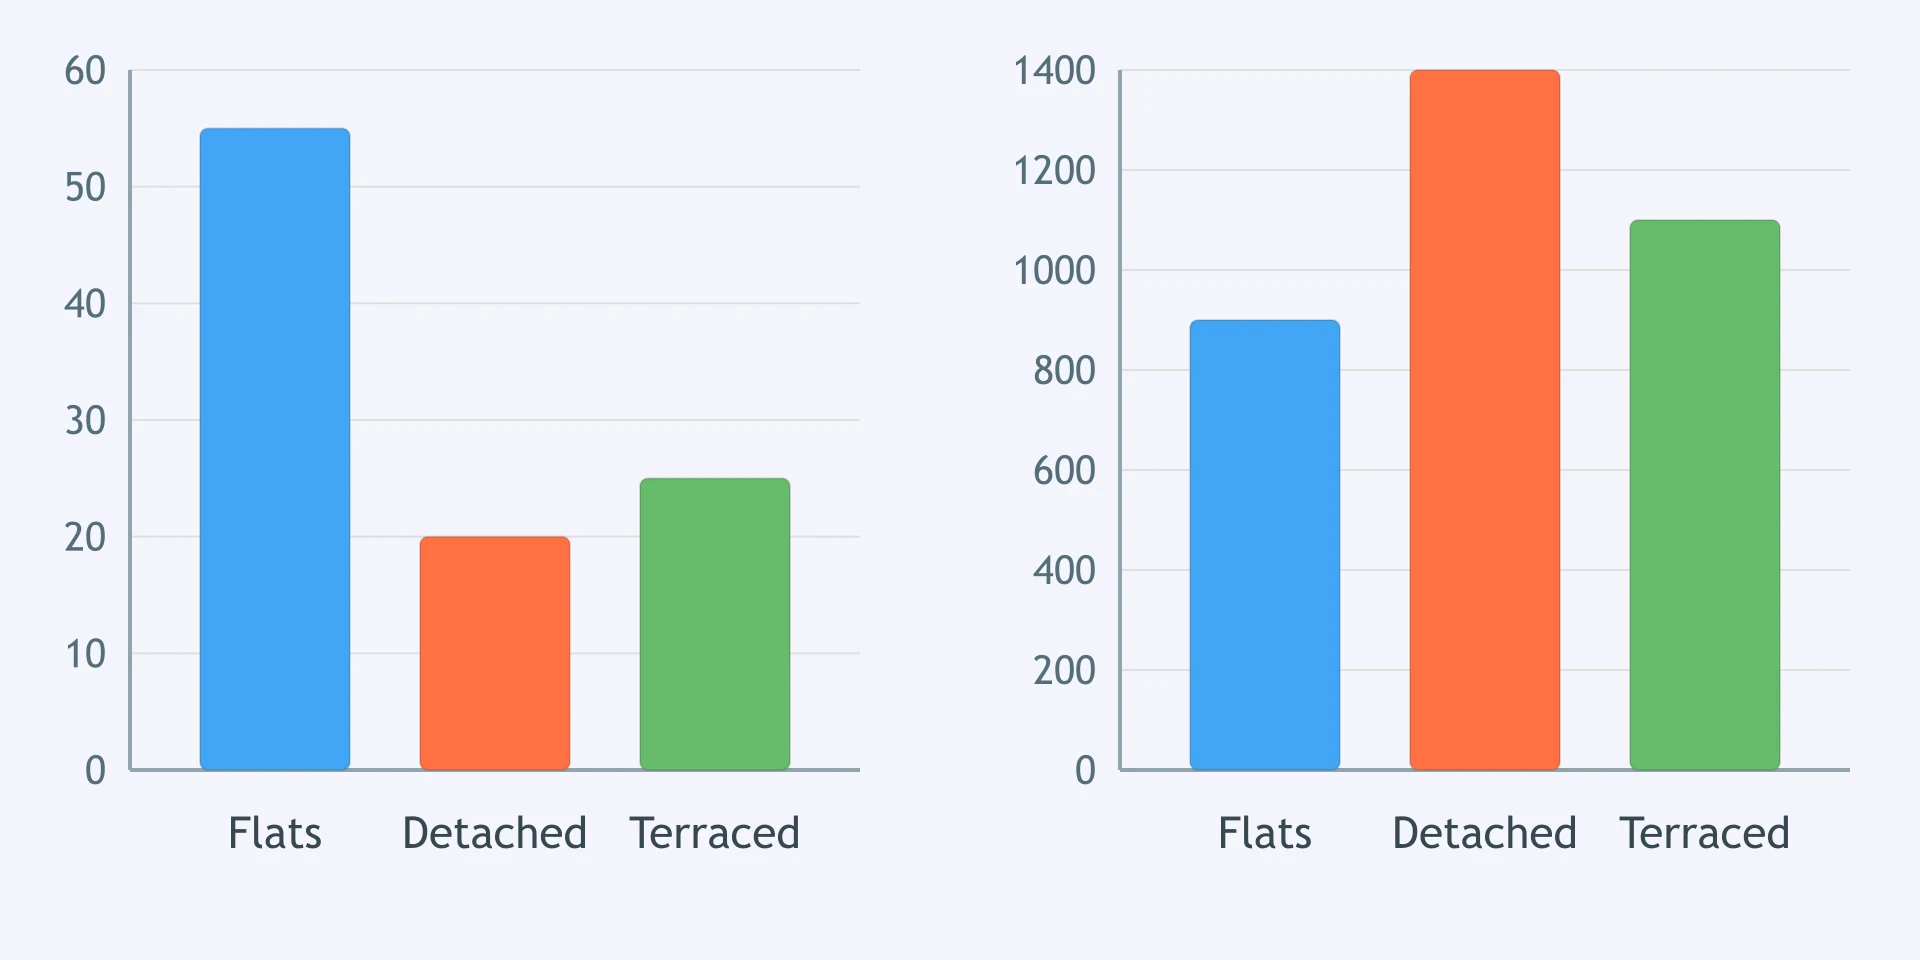
The first bar chart shows new homes by type; the second shows average rent by type. Which overview is best?
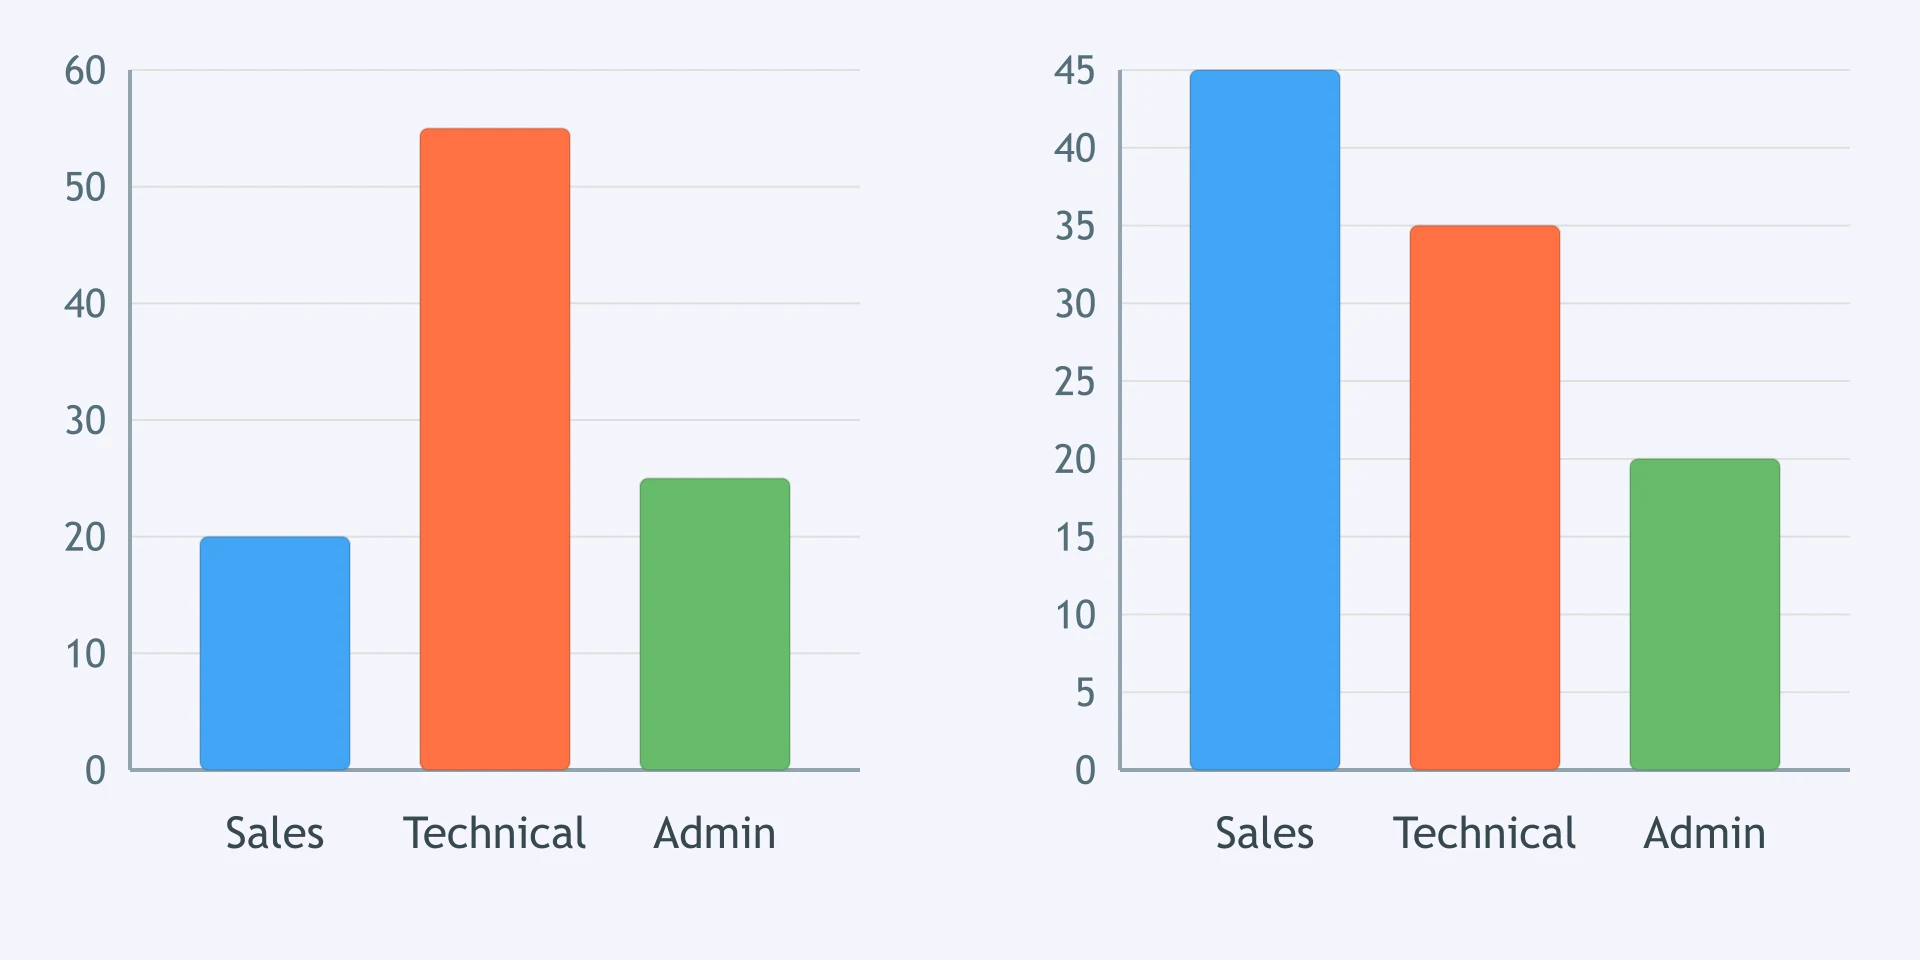
Two bar charts show a company's training budget and attendance by department. Which overview is most adequate?
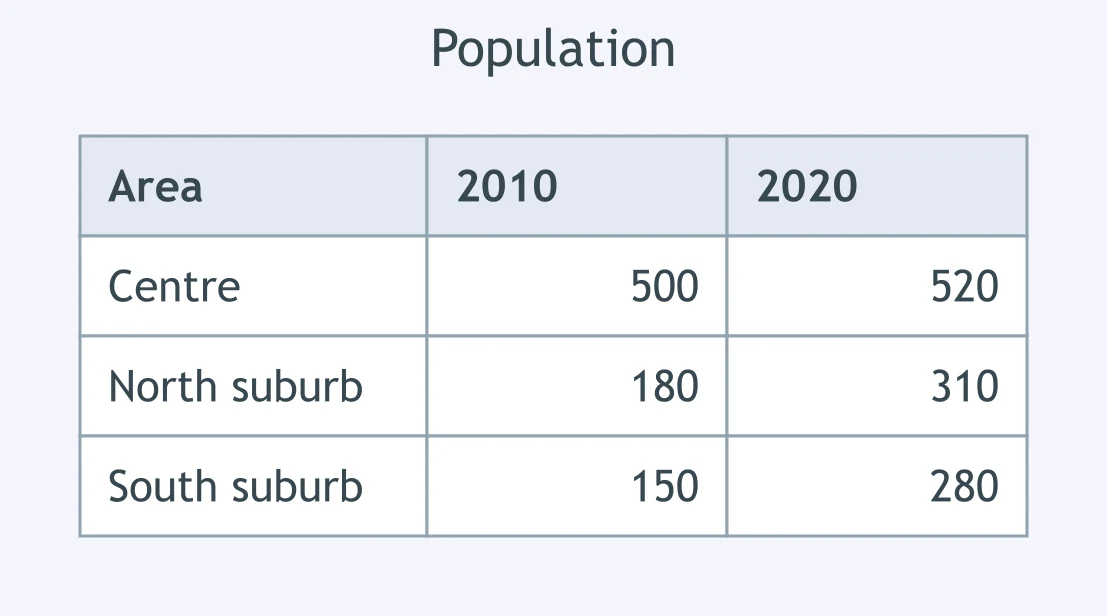
The paired bar charts compare commute modes for students and staff. Which sentence gives the best overview?
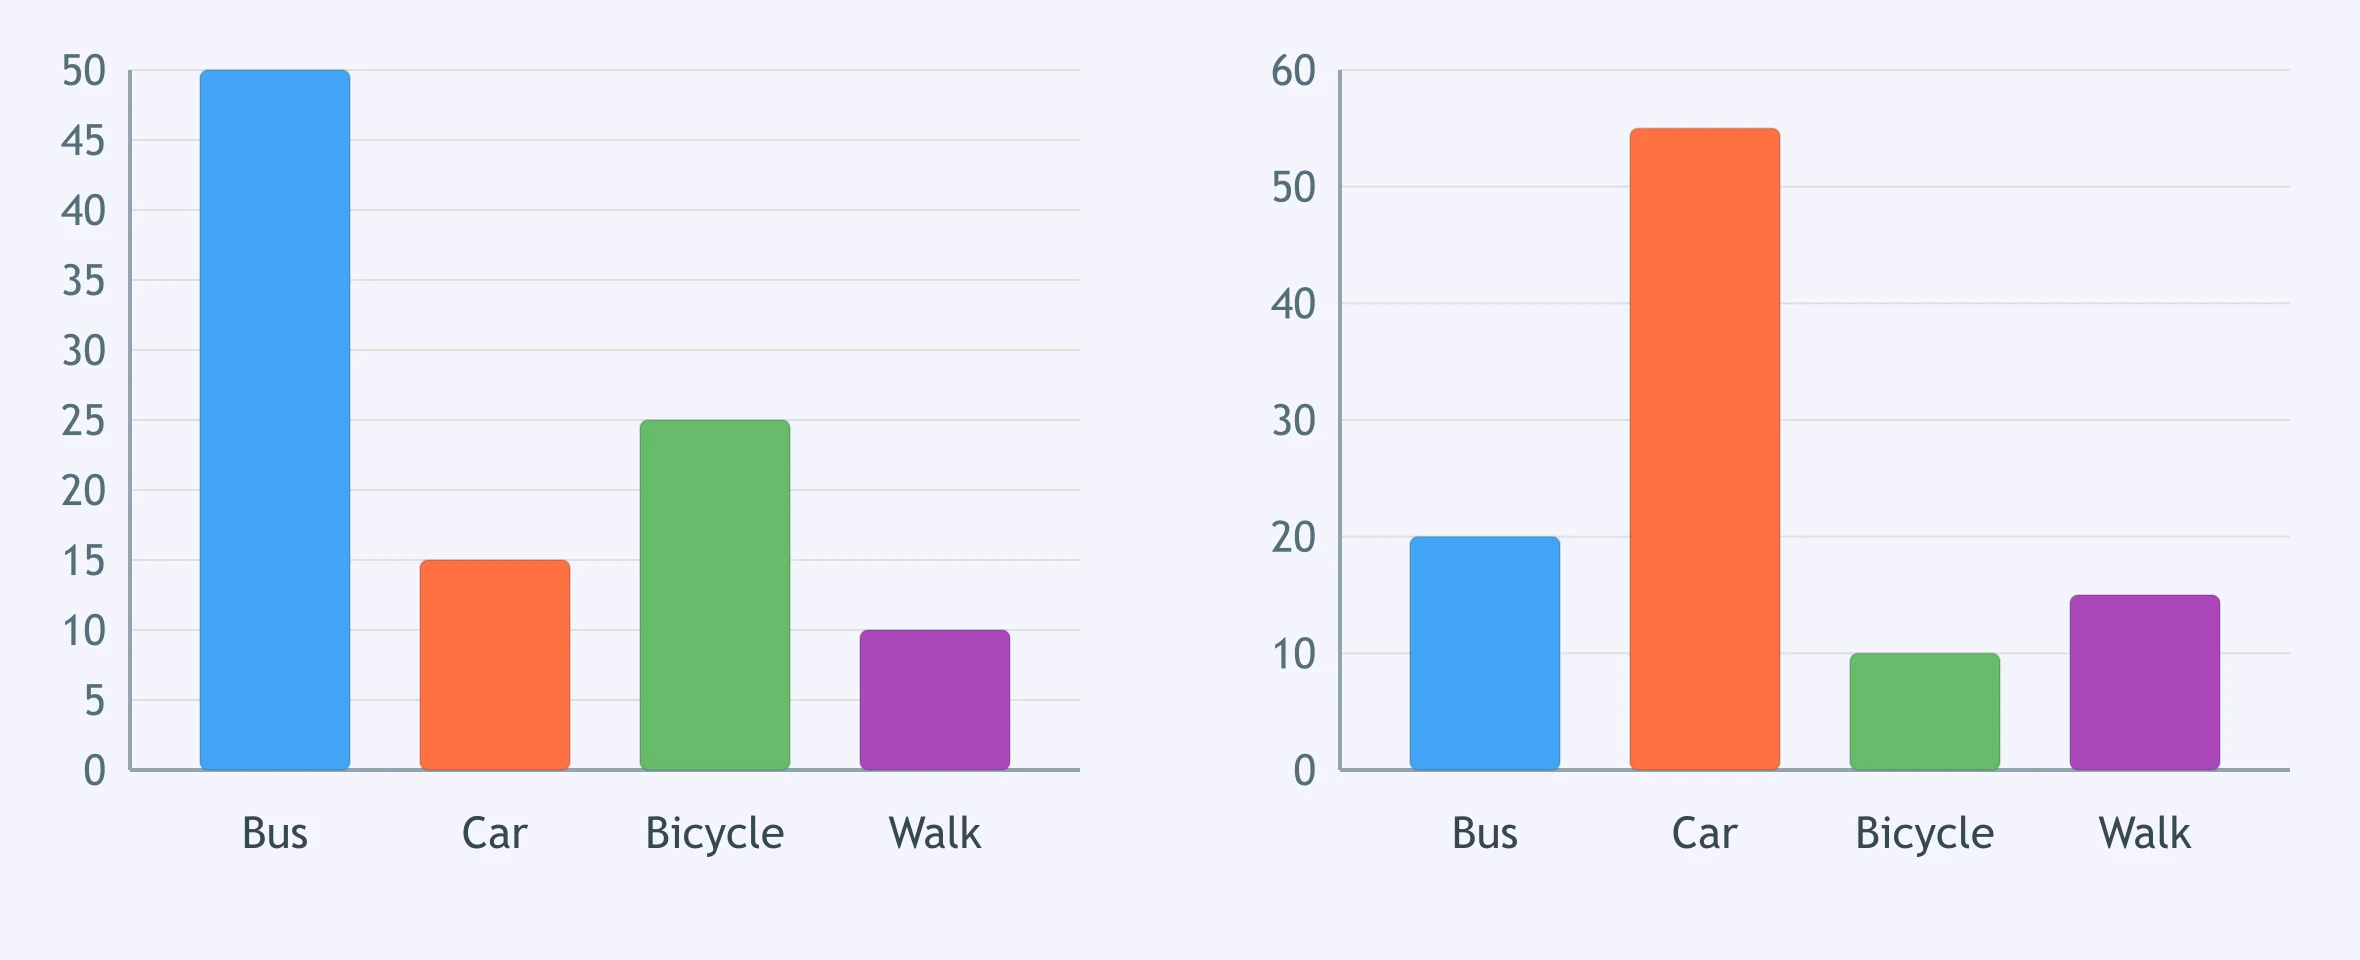
The pie chart divides a university budget into five categories. Which sentence belongs in the overview rather than the detail paragraph?
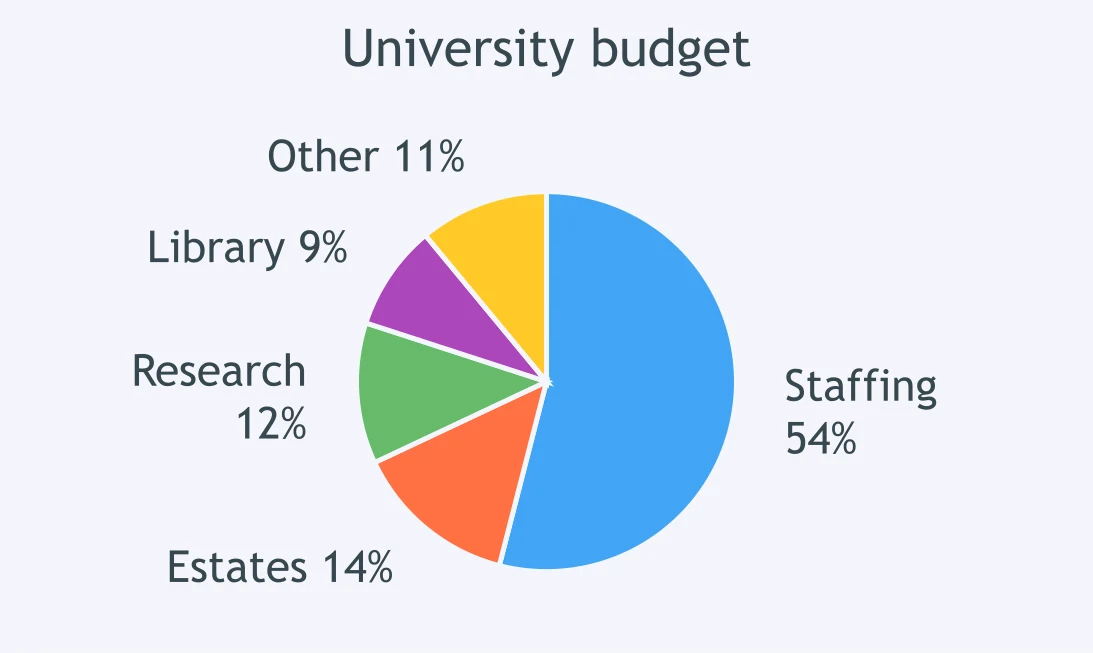
The figure shows monthly rainfall in a coastal city. Which sentence is appropriately overview-level?
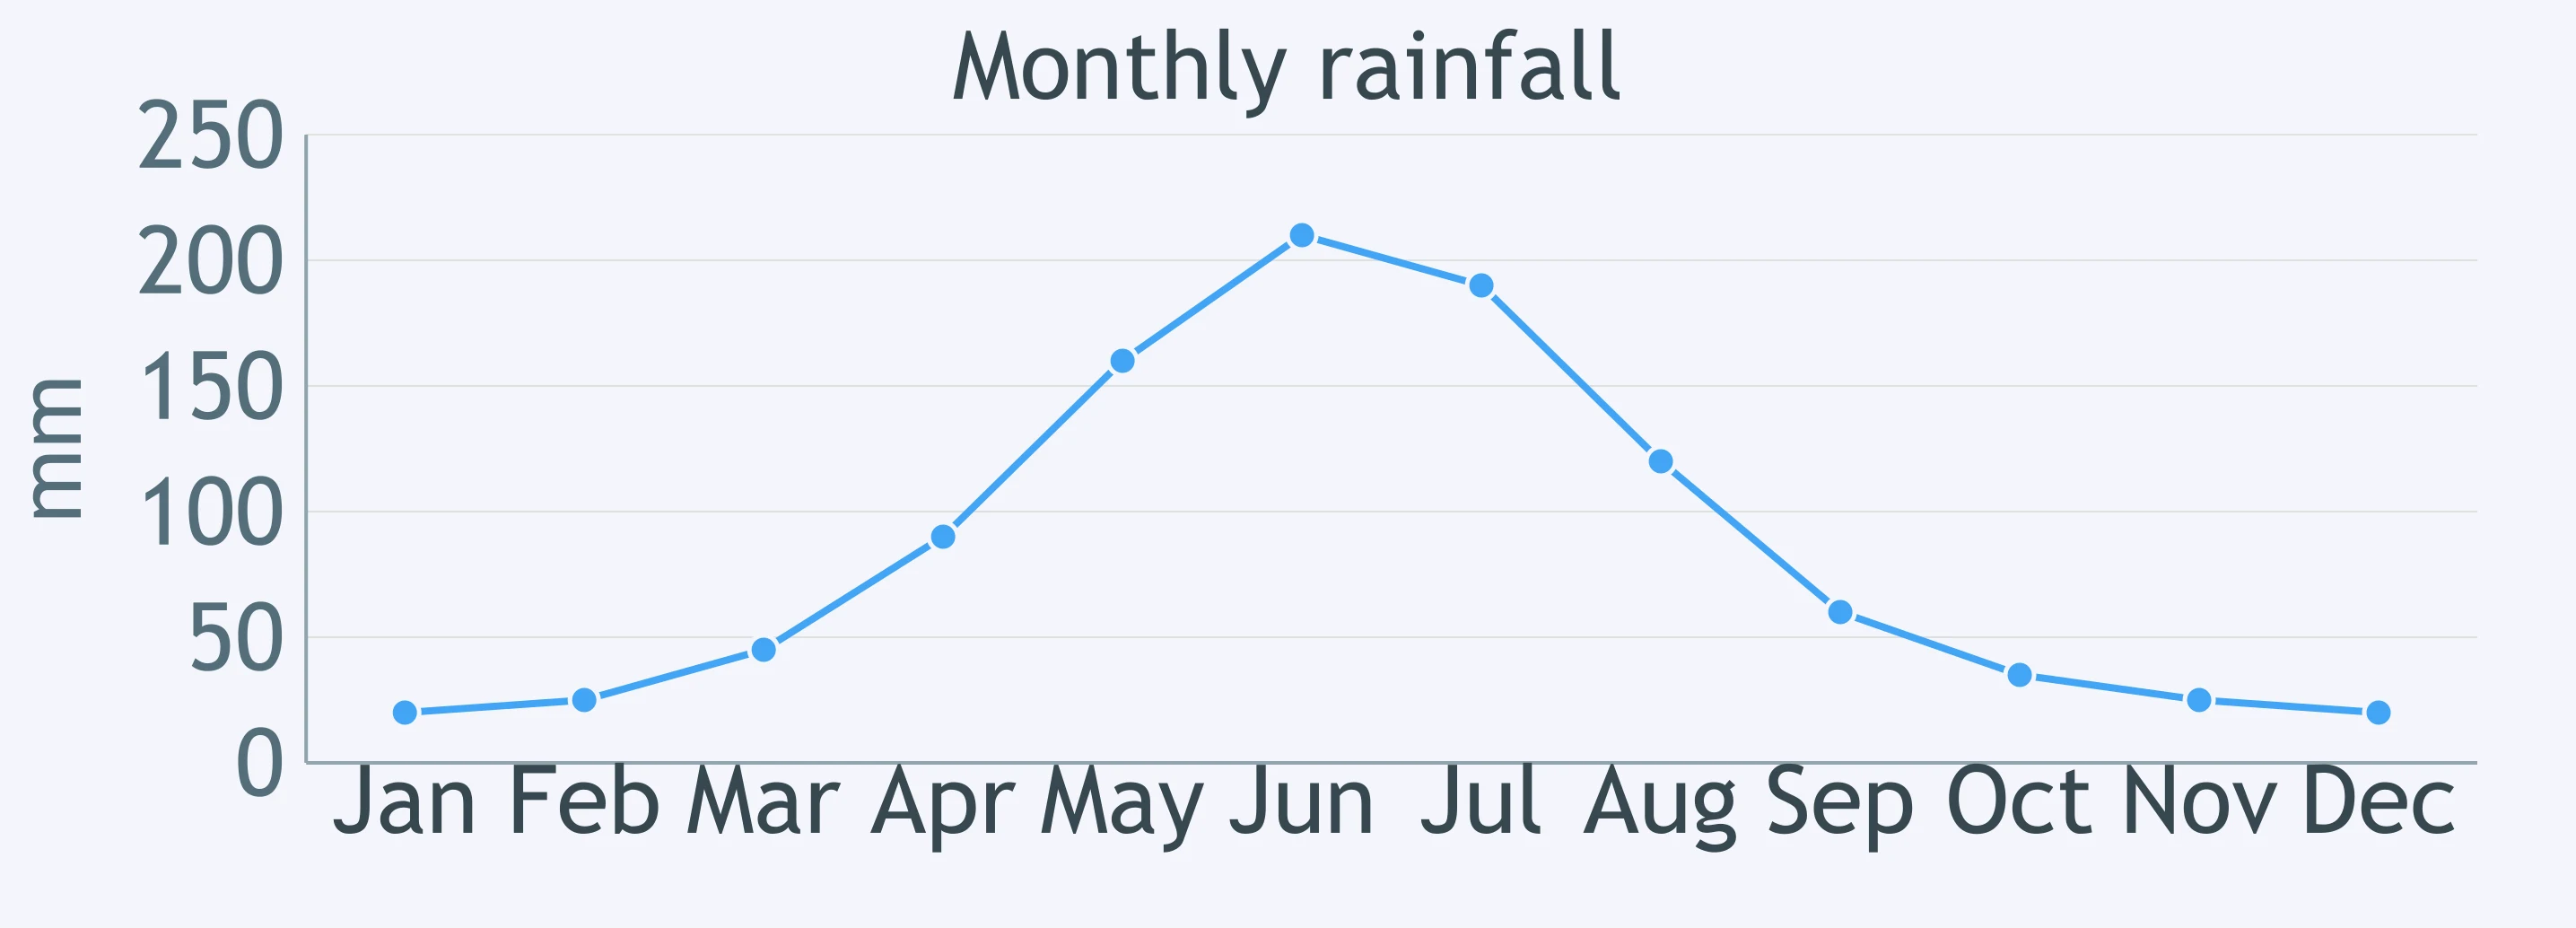
The table compares population in a centre and two suburbs. Which option is an overview, not a detail?
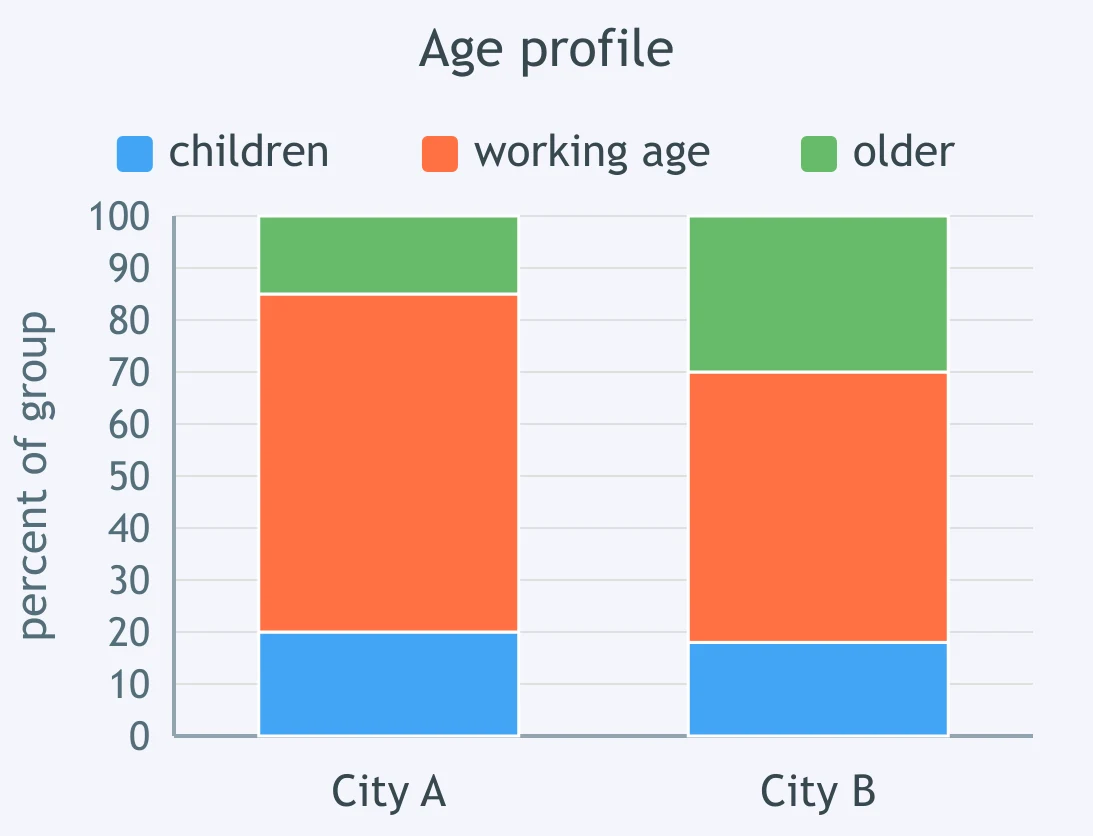
The segmented bars compare the age profile of two cities. Which sentence works best as an overview?
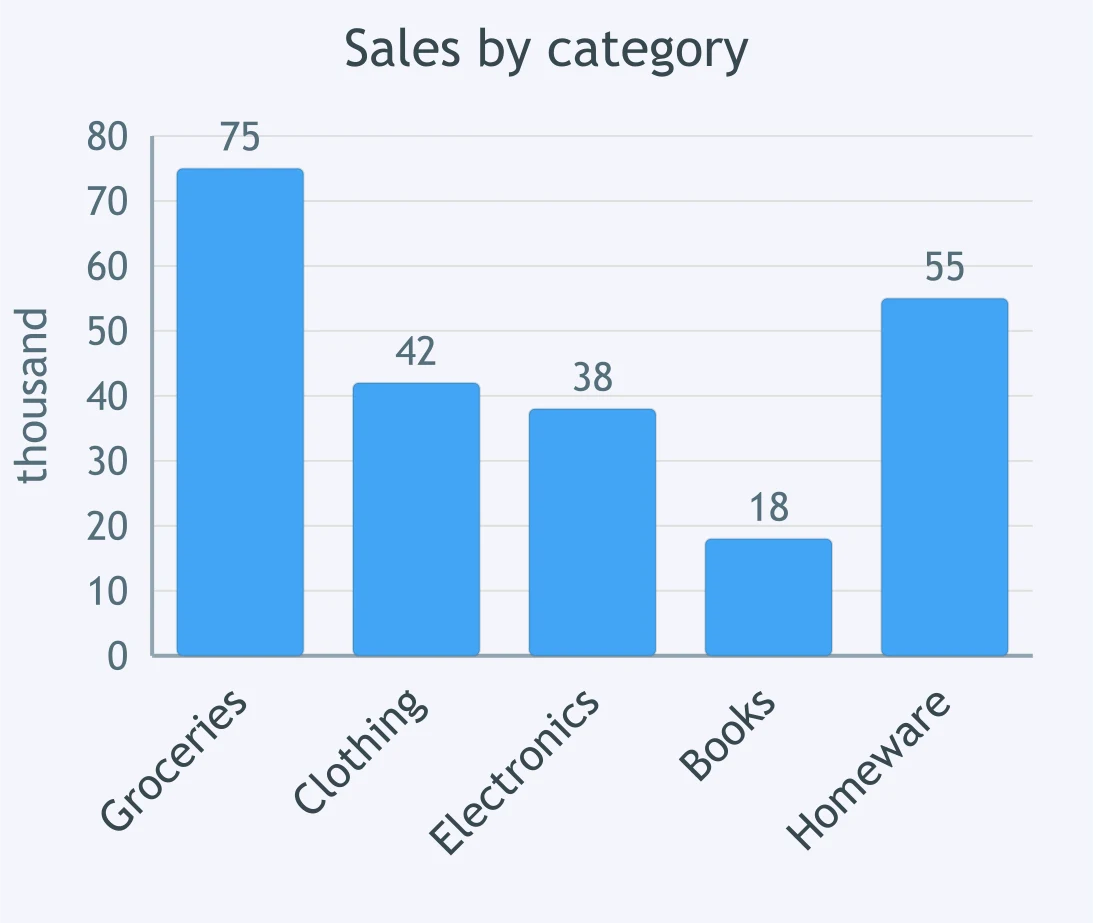
The bar chart shows sales by product category. Which option gives an overview-level summary?
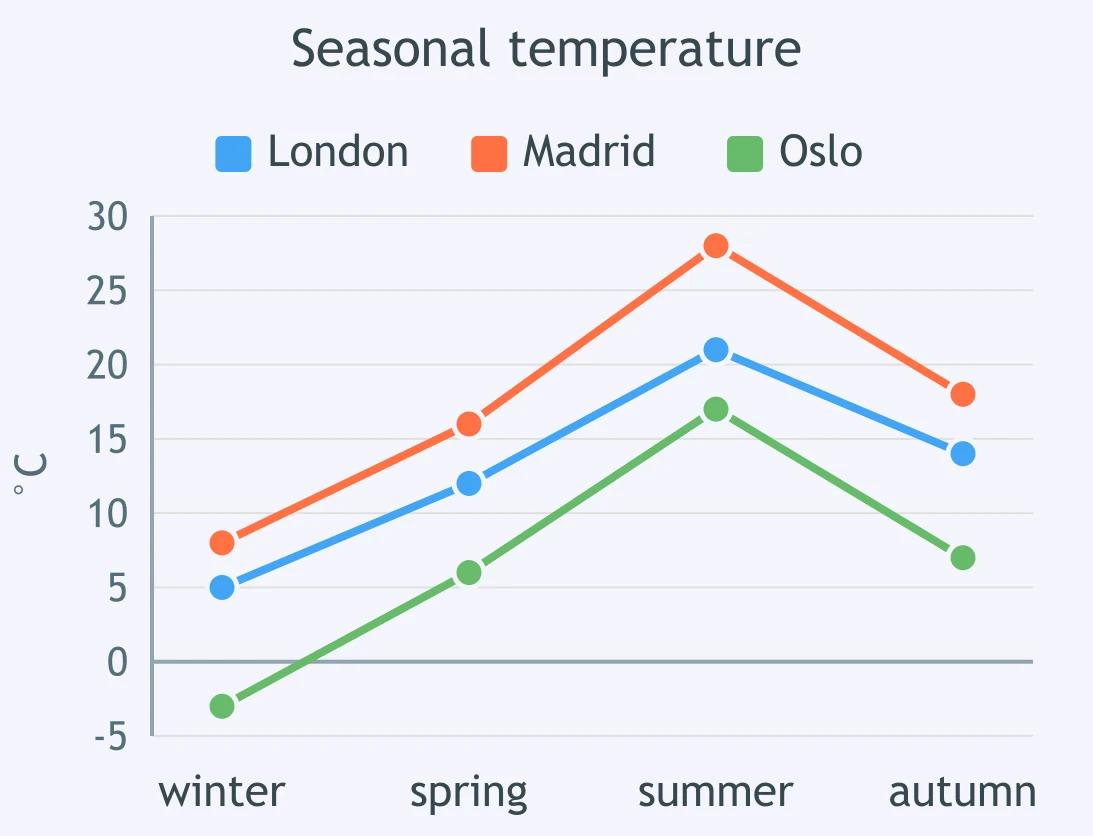
The line chart compares seasonal temperatures in three cities. Which sentence should be in the overview?
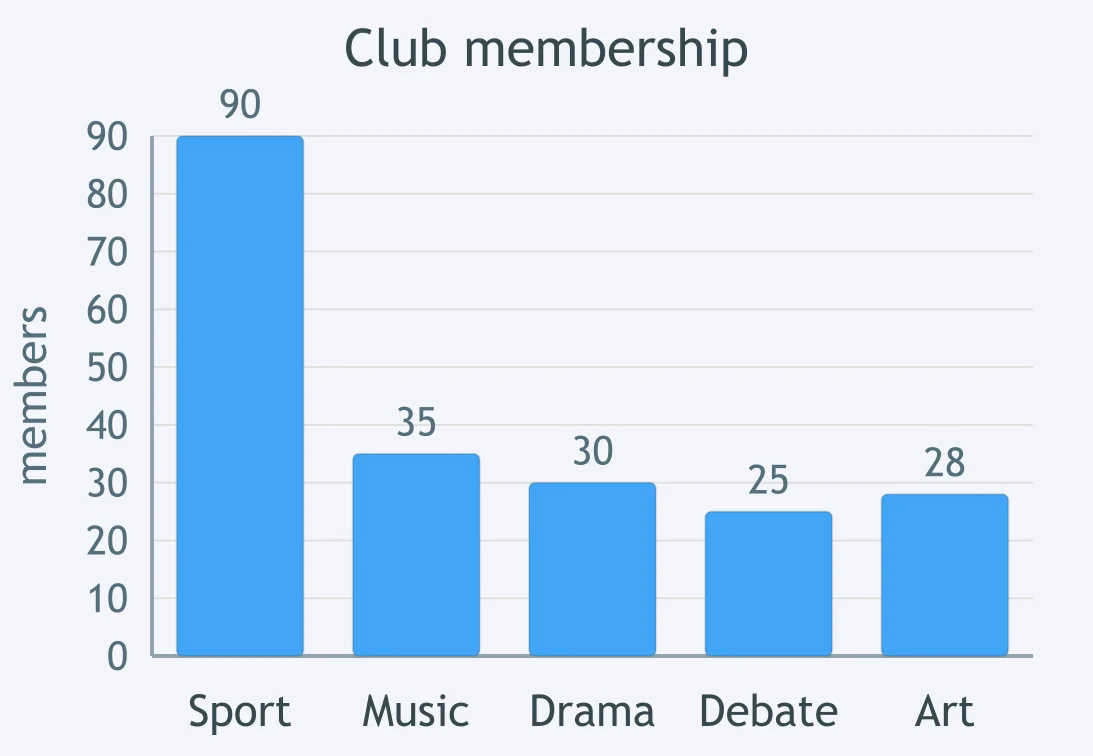
The bar chart shows membership of five college clubs. Which overview is substantive without relying on figures?
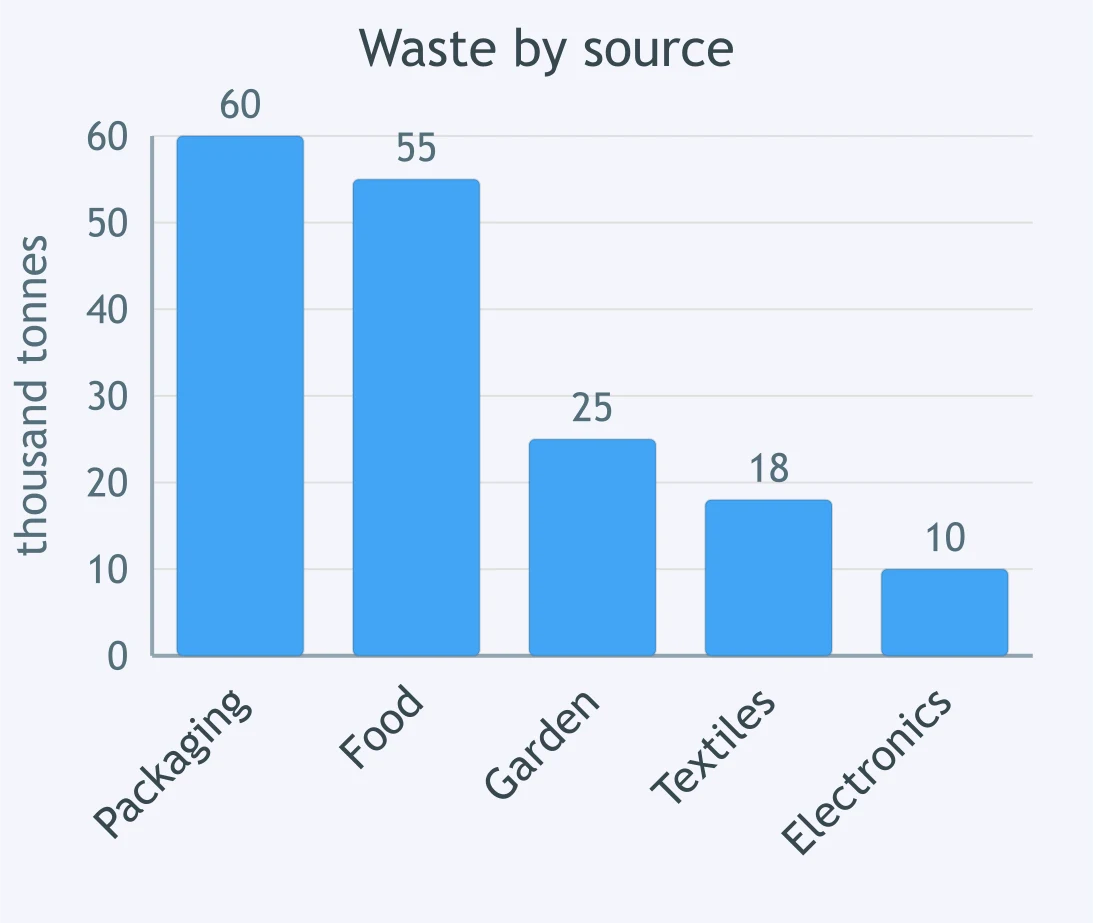
The pie chart shows household spending by category. Which sentence is the stronger overview?
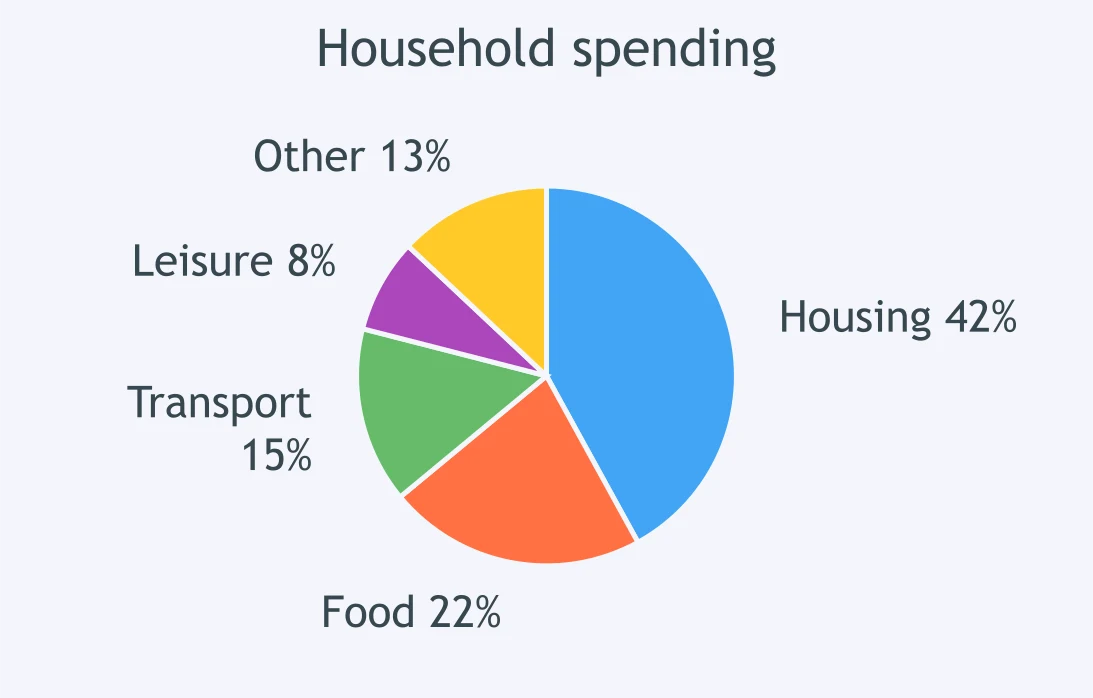
The line graph plots monthly petrol prices over a year. Which overview says something substantive without quoting figures?
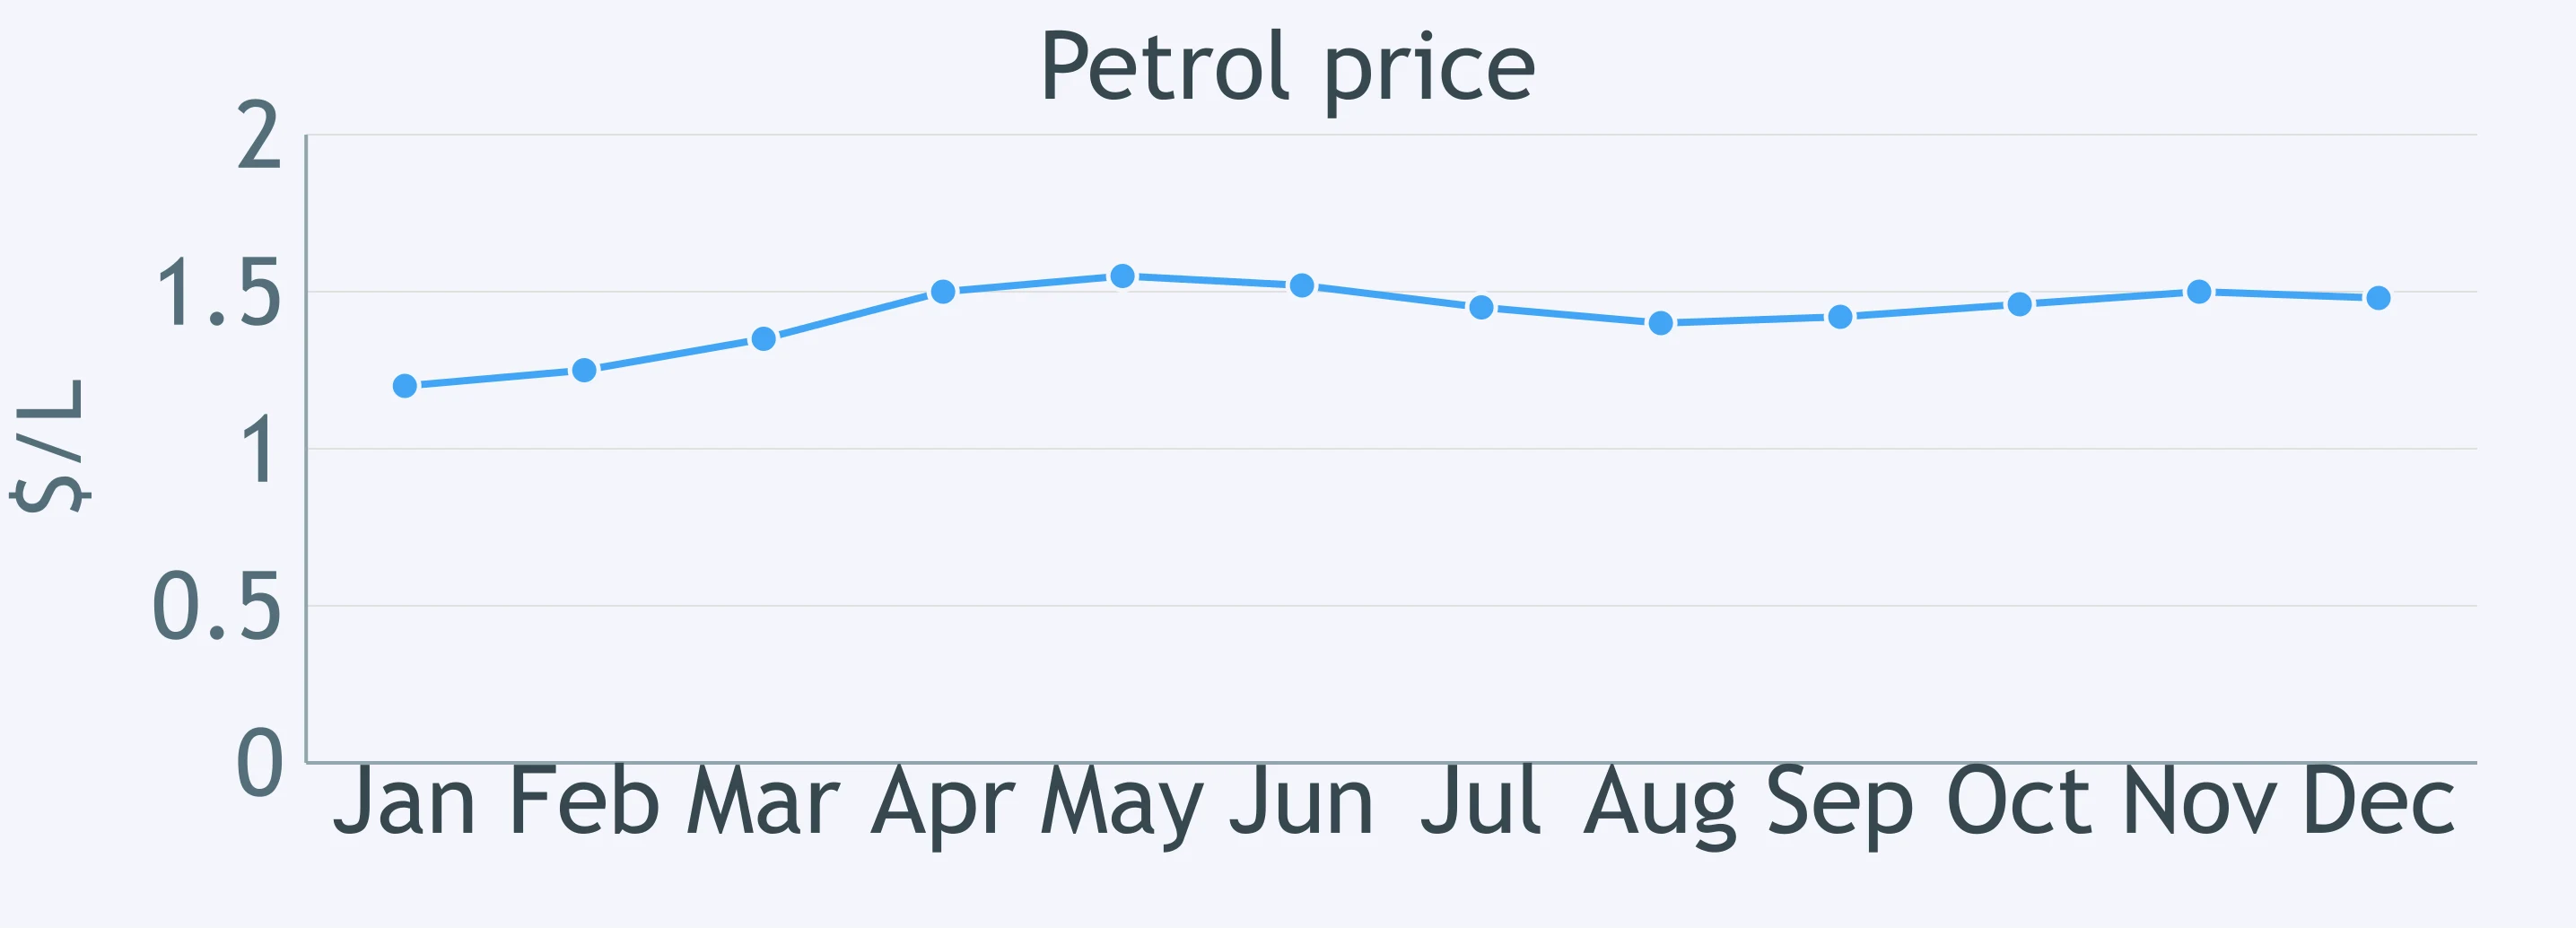
The table shows export values by region over time. Which overview avoids a figure-by-figure report?
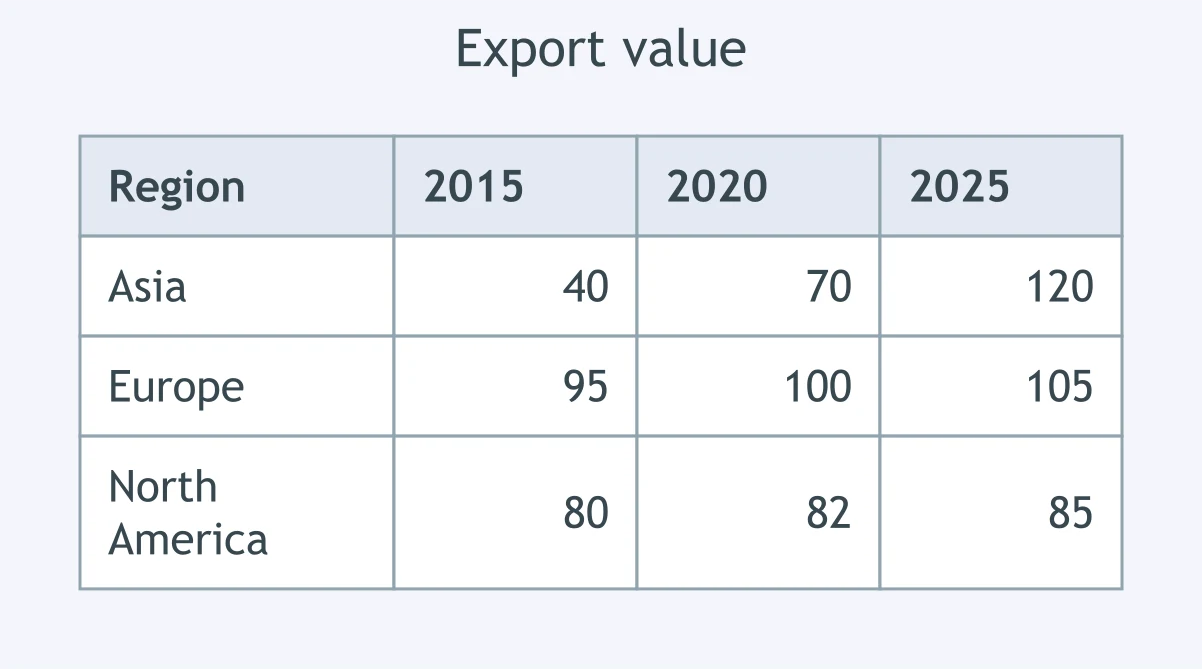
The bar chart breaks down waste by source. Which sentence is the strongest overview?
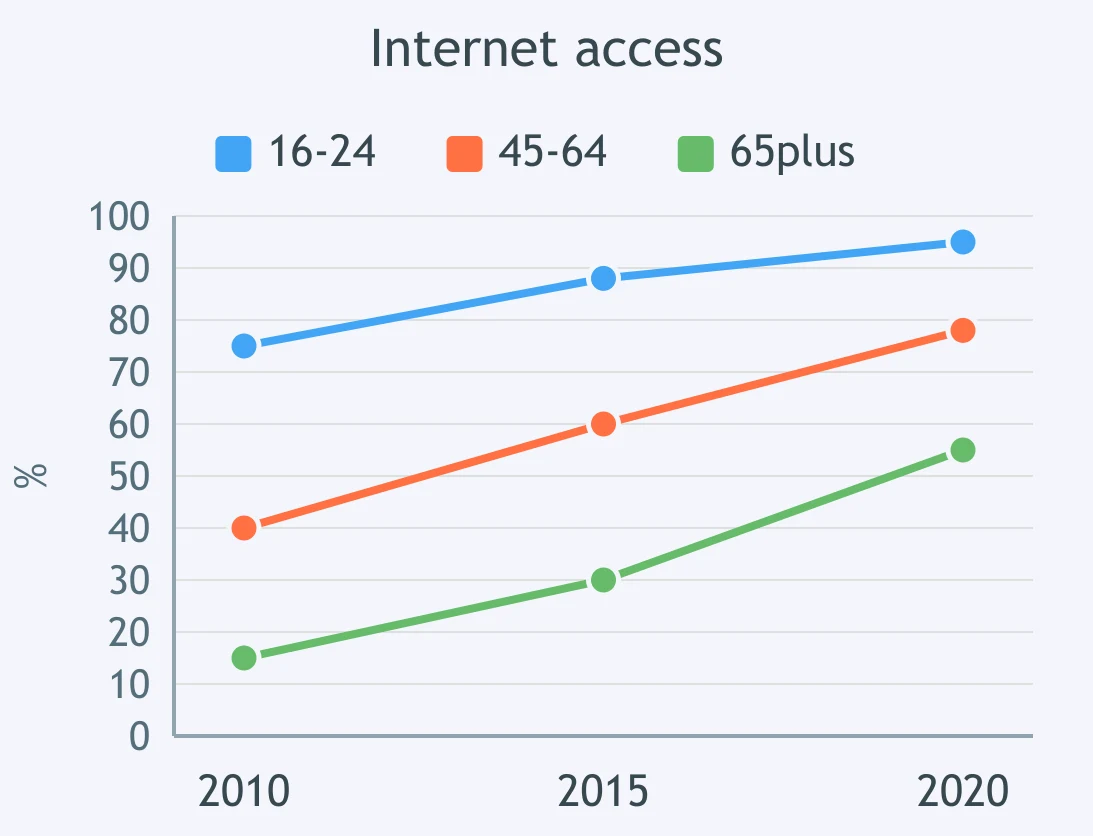
The line chart compares internet access by age group. Which overview is strongest?

Hedged and Qualified Statements - IELTS 7.0 L
15 questions

Tone: Certain, Doubtful or Reluctant? - IELTS 7.0 L
15 questions

Selecting Key Features: What to Leave Out - IELTS 7.0 W T1
25 questions

Precise Comparison and Complex Data Relations - IELTS 7.0 W T1
30 questions

Complex and Multiple-chart Tasks - IELTS 7.0 W T1
25 questions
Crack the passcode before the zombies get in.
Answer, then swat bugs for bonus points.
Race through questions at your own speed.
Same question on every screen. Fastest wins.

Pick a tile, answer, hit bonuses and steals.