Loading
by BlastRoom
IELTS Writing Task 1 practice for linking data across complex figures.
#writing_task_1#ielts_7_0

25 questions
One question set, multiple game modes. Tap any game to see it in action. Not sure which to pick?
Answer to place stones and capture territory.
Outrun the snow together.
Earn blasts, then hunt the other team.
Answer to earn energy, then climb.

The class blasts through walls together.
Bid on mystery lots. Most money wins.
Sell tours. Nice, standard, or a total scam.

Answer, restock, and serve the rush.
More correct answers pulls the rope your way.
Answer, then shoot down the alien wave.
Answer, then tap to leap the frozen ridge.
One panel shows exports in 2000 and 2020; the other shows factory numbers. Which sentence genuinely uses both panels?
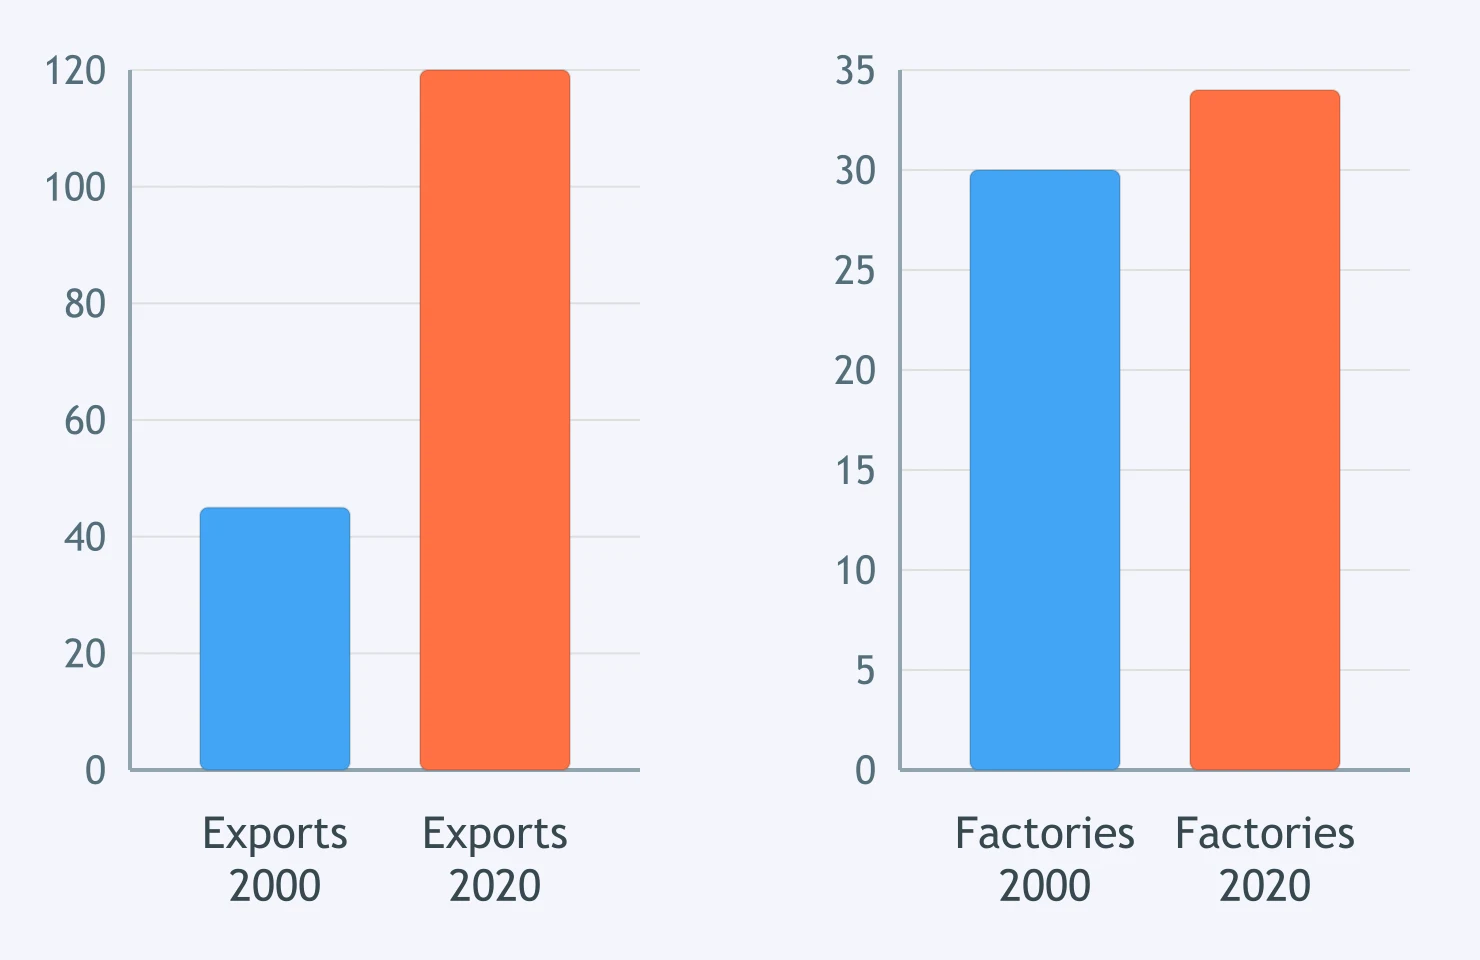
The figure pairs museum visitors with ticket revenue. Which claim cannot be made from only one chart?
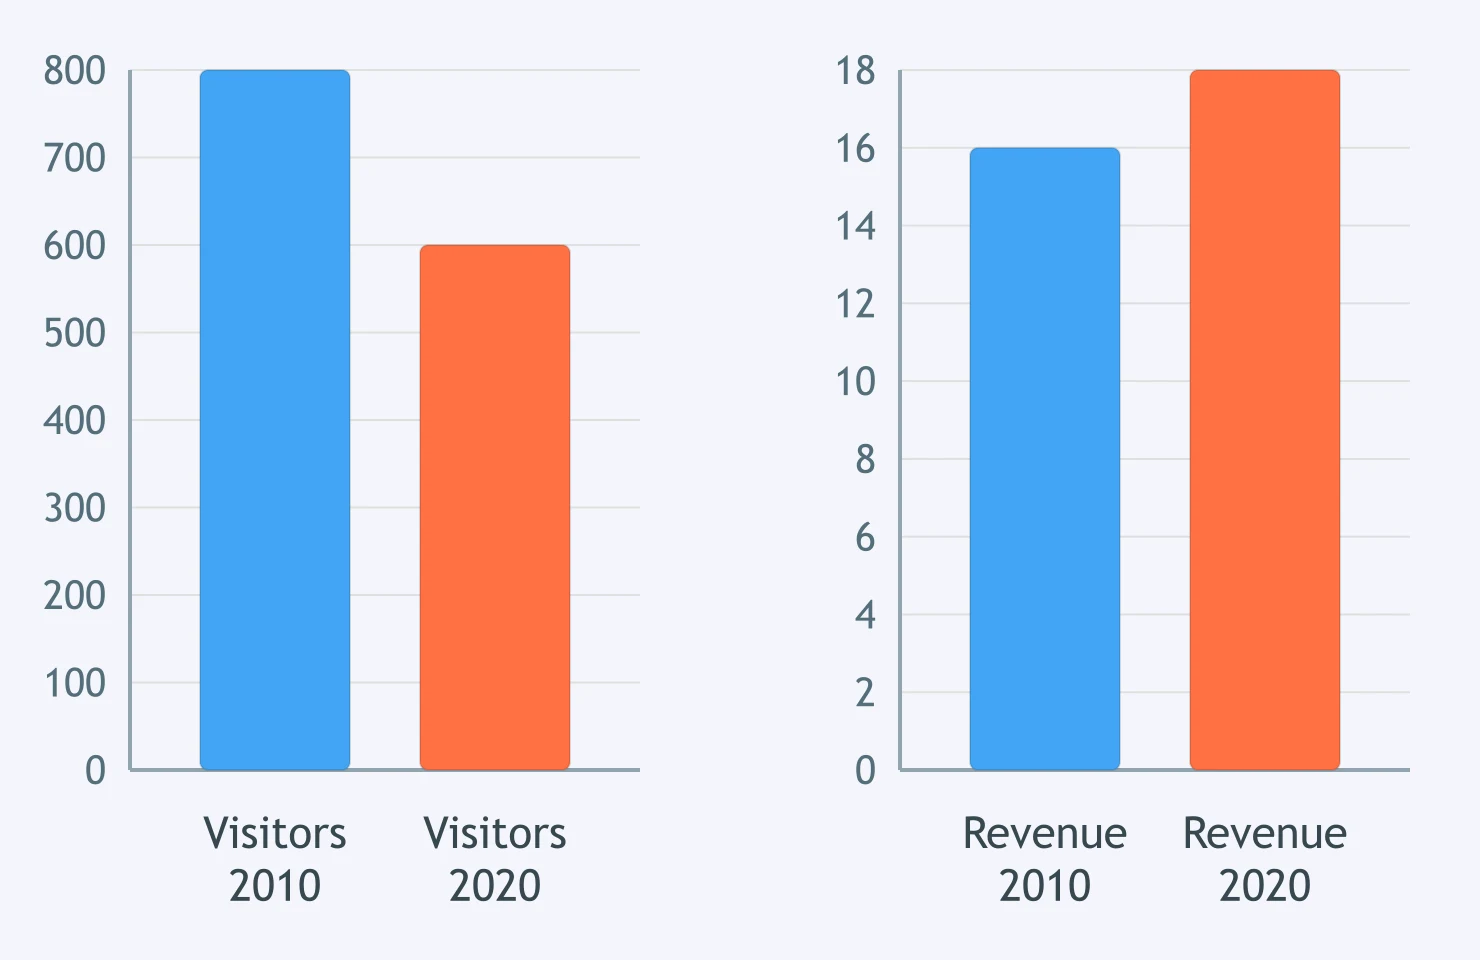
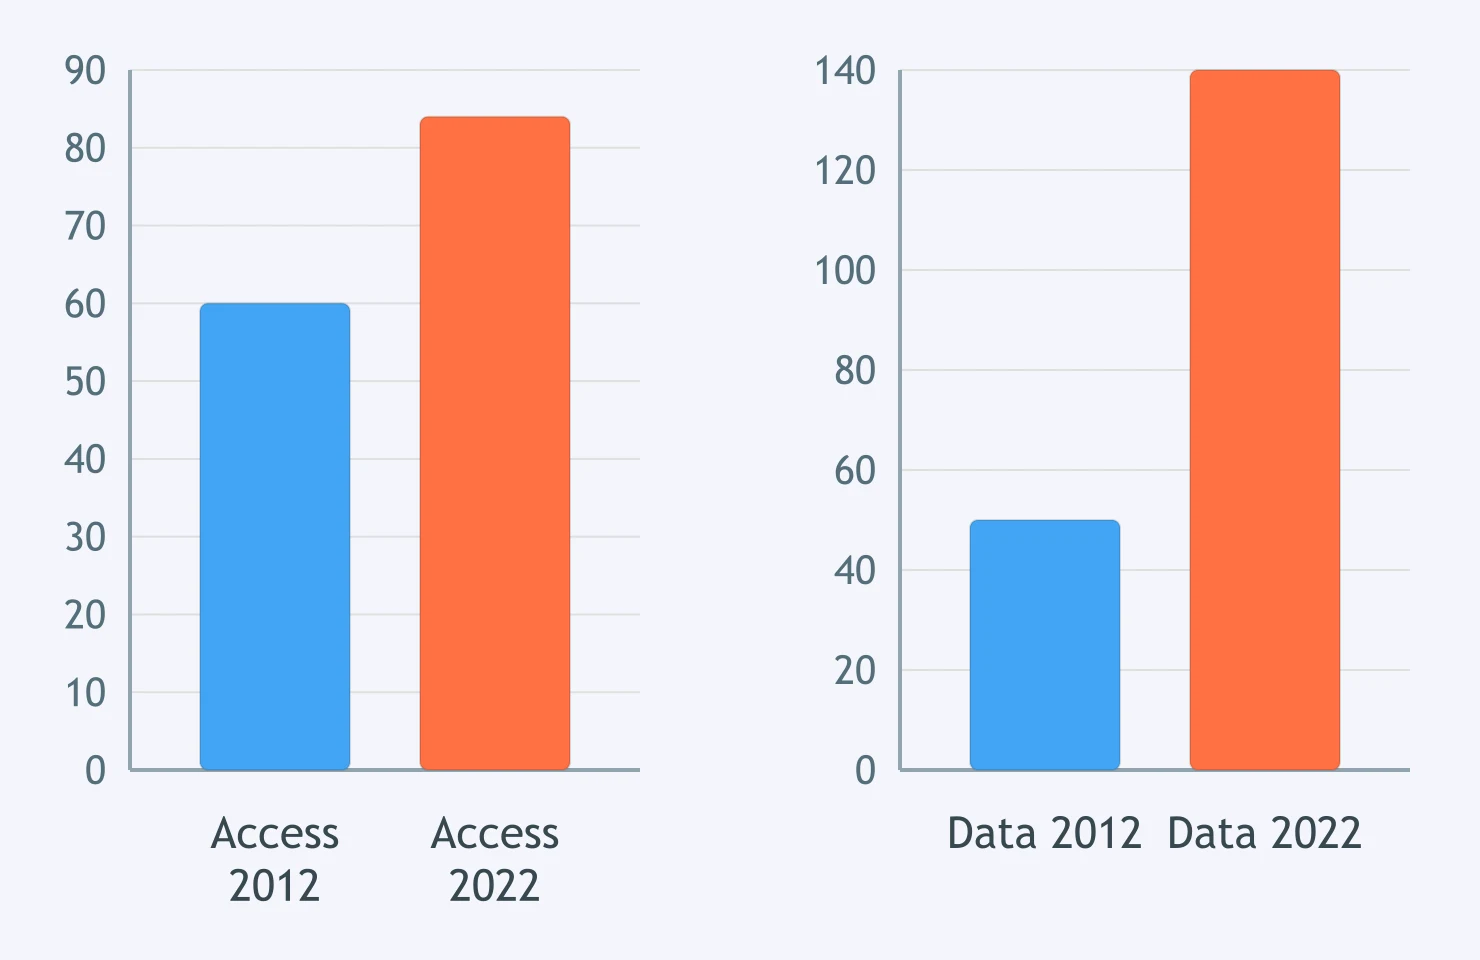
A chart shows households with internet access; a second shows average monthly data use. Which statement depends on cross-reading?
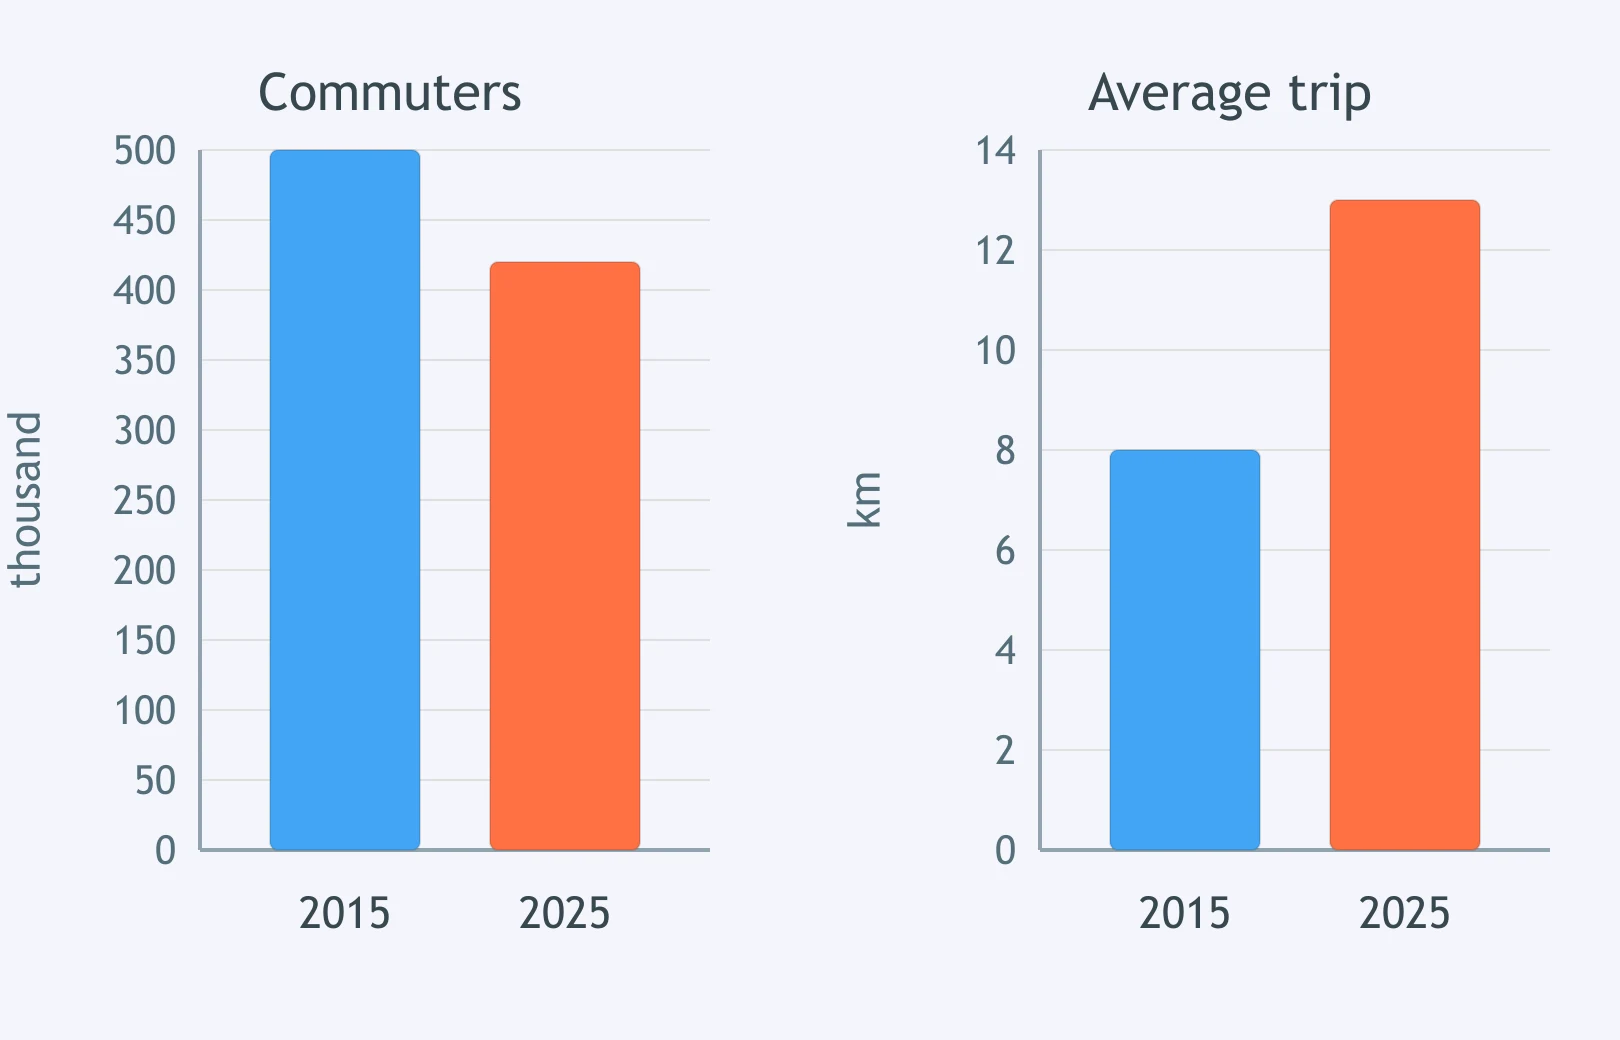
The panels show commuter numbers and average trip distance. Which sentence requires information from both?
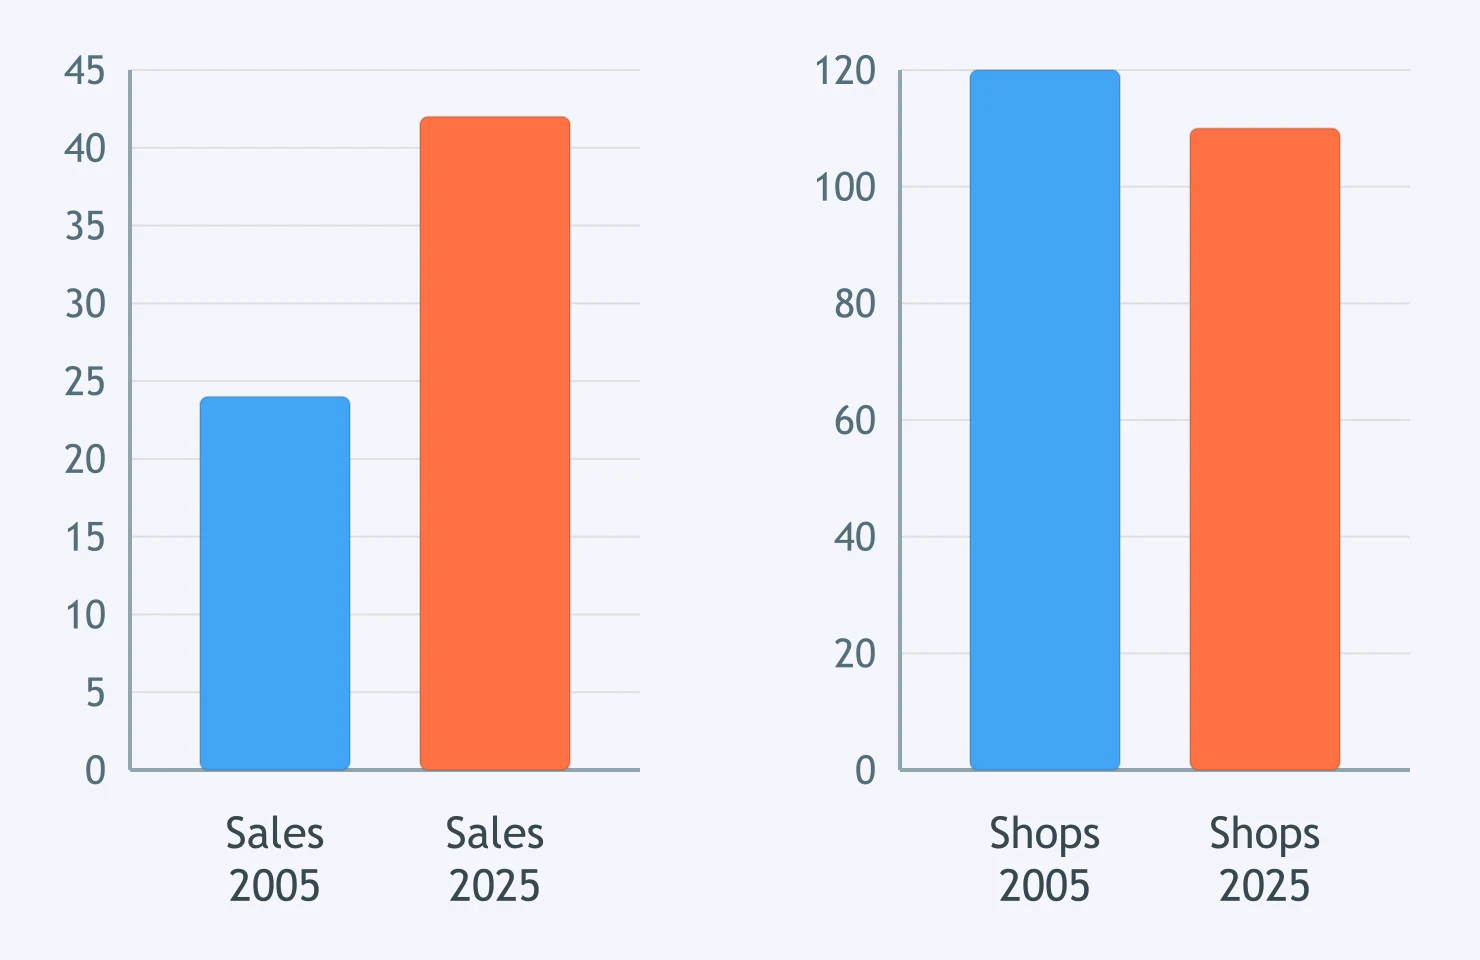
Two panels compare book sales and shop numbers. Which candidate sentence links the two figures rather than reporting one?
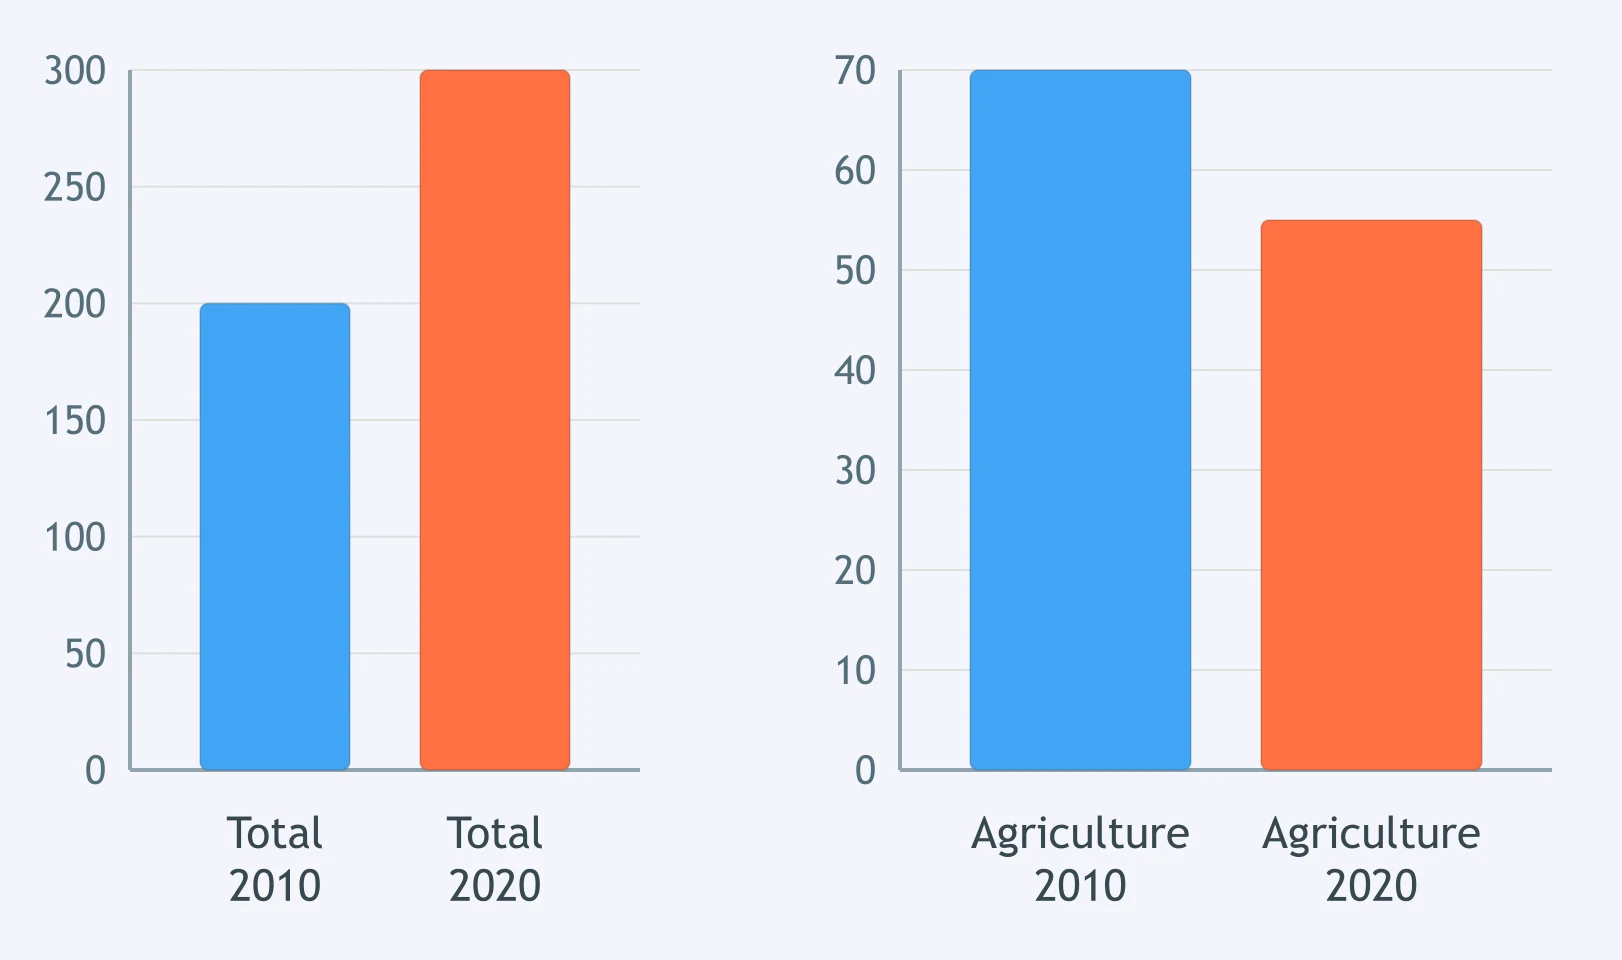
The figure gives total water use and the share used by agriculture. Which overview sentence needs both charts?
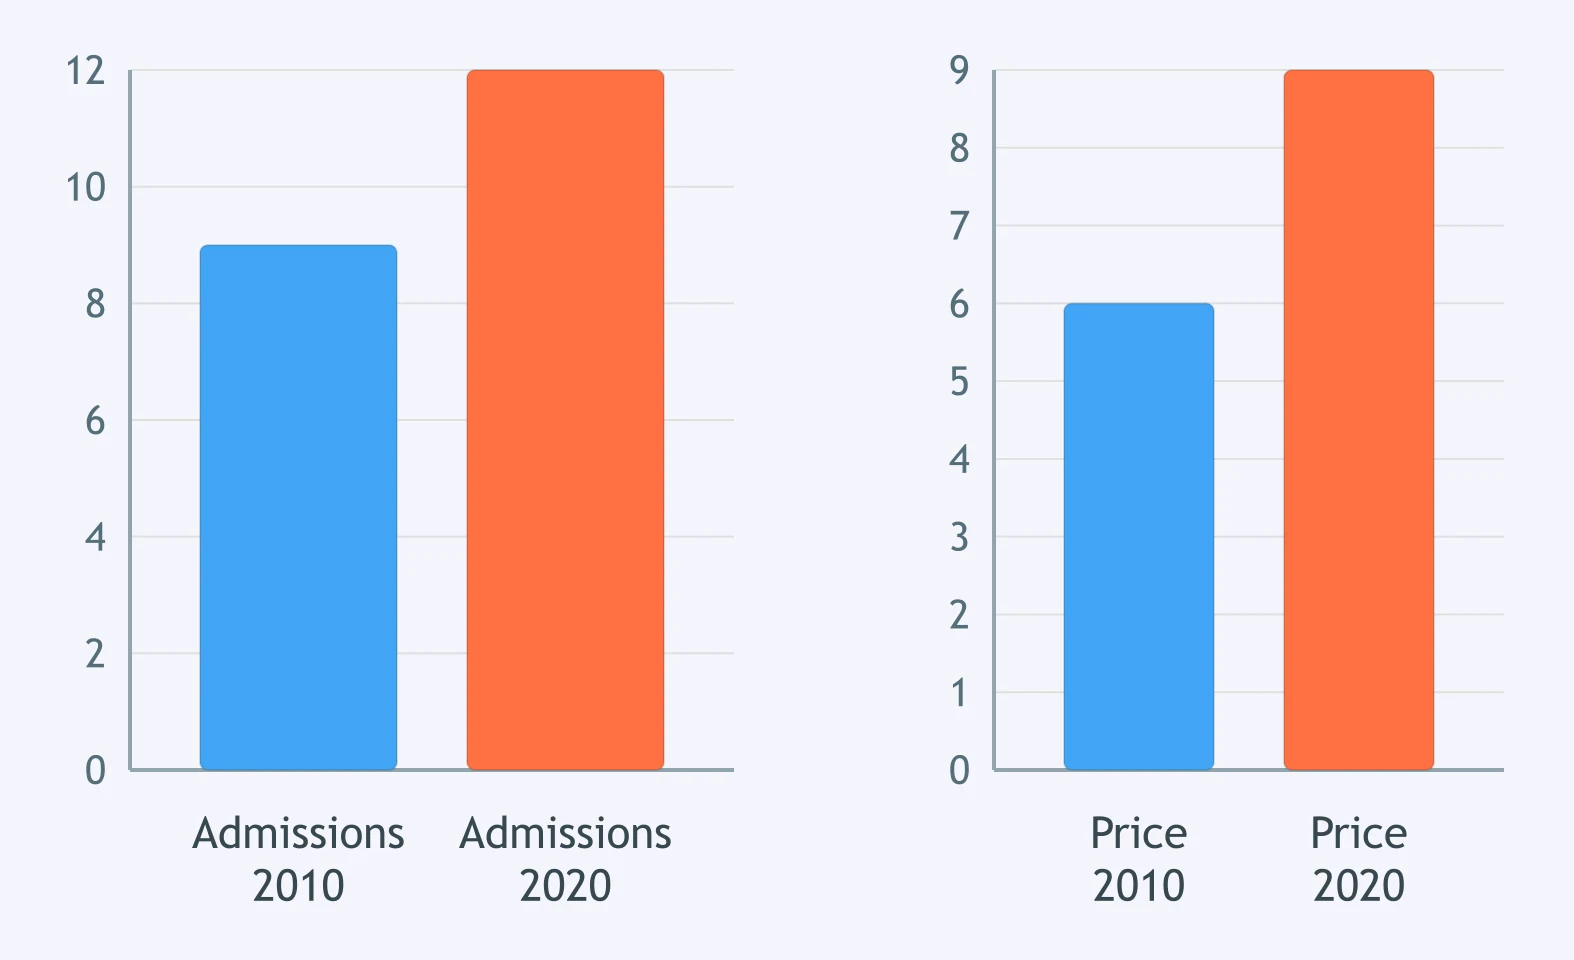
The panels show cinema admissions and average ticket price. Which statement draws on both panels?
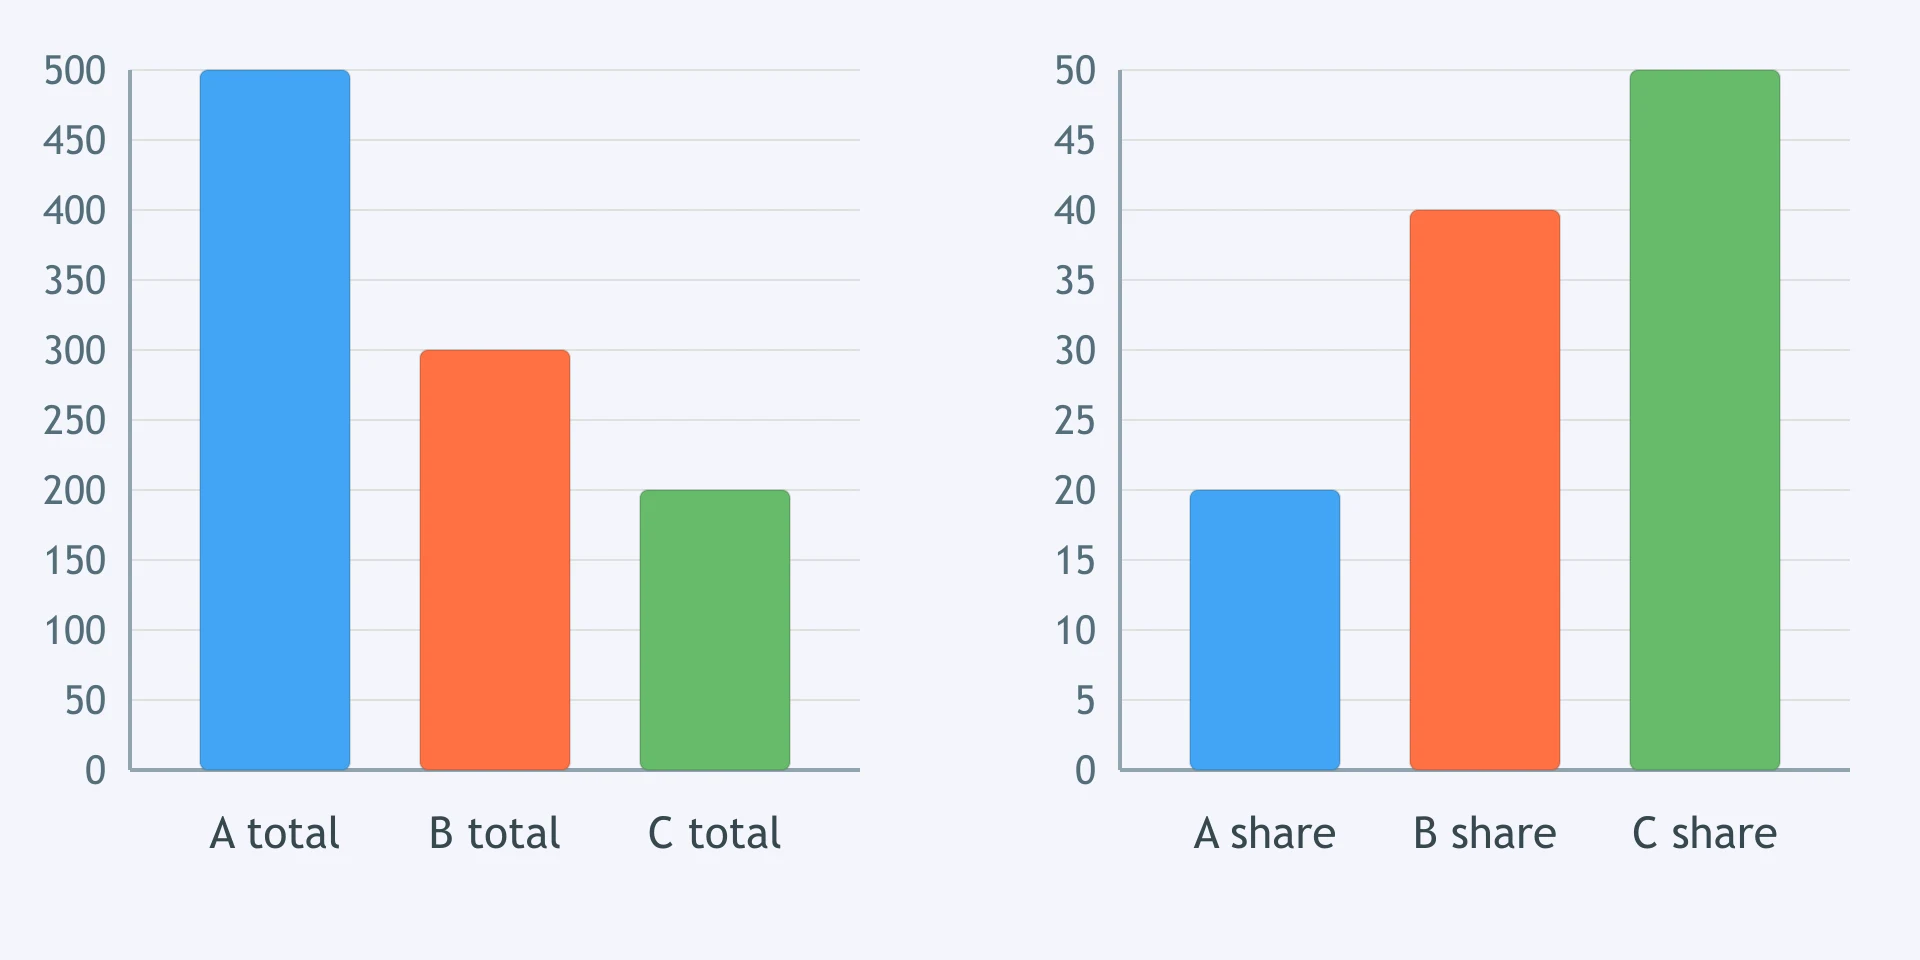
One panel gives total electricity use; the other gives the renewable share. How should absolute renewable use be found?
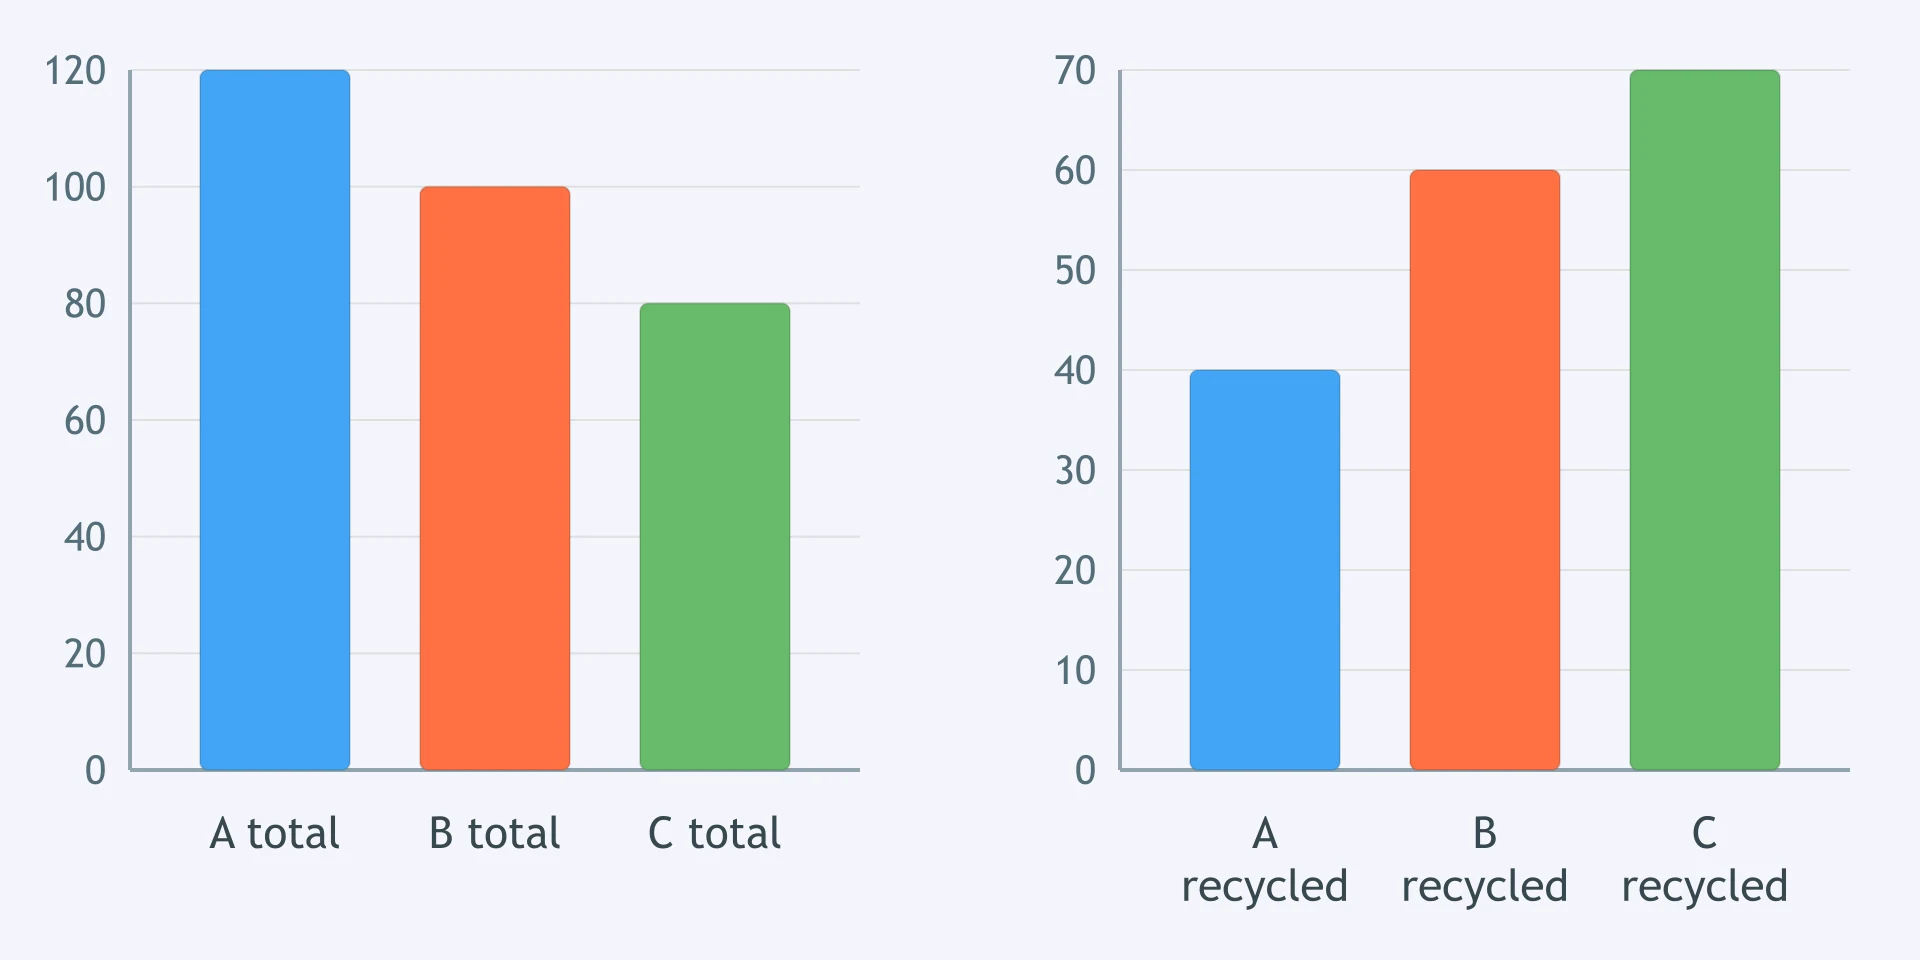
Use the paired charts: total waste is shown with the recycled share. Which sentence is accurate?
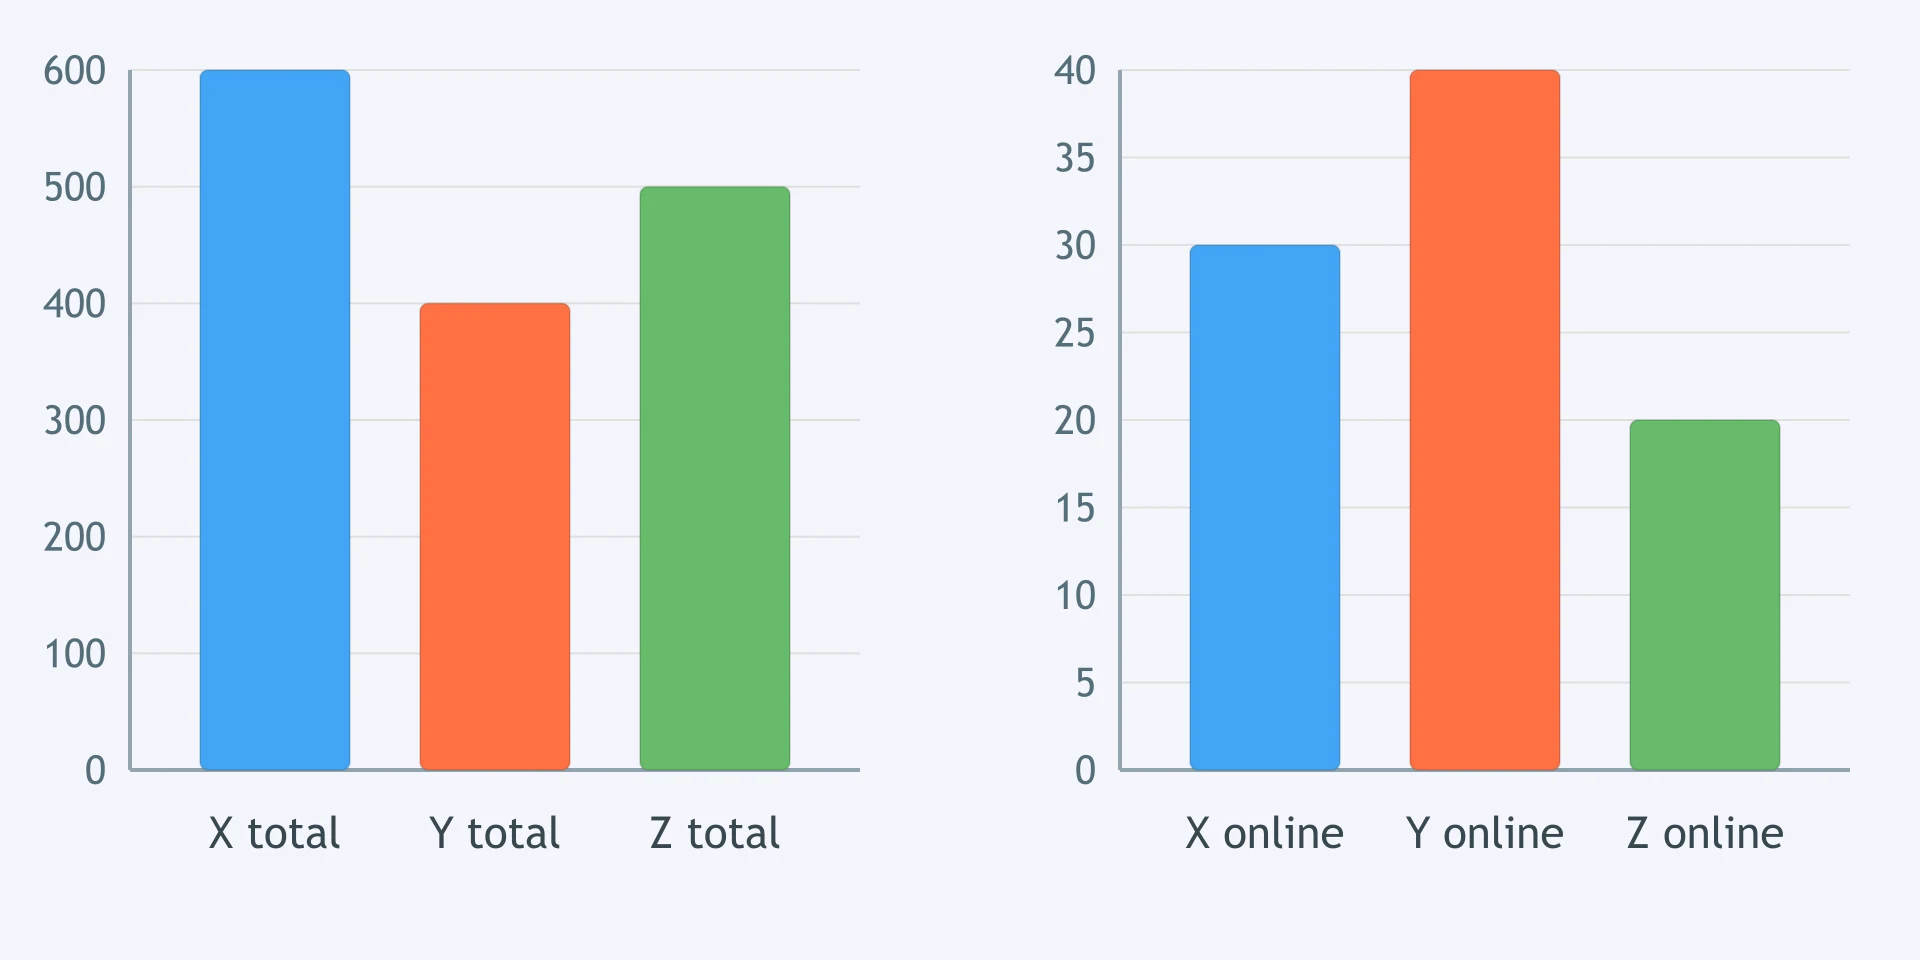
The figure pairs sales totals with online shares. Which reported figure is correct?
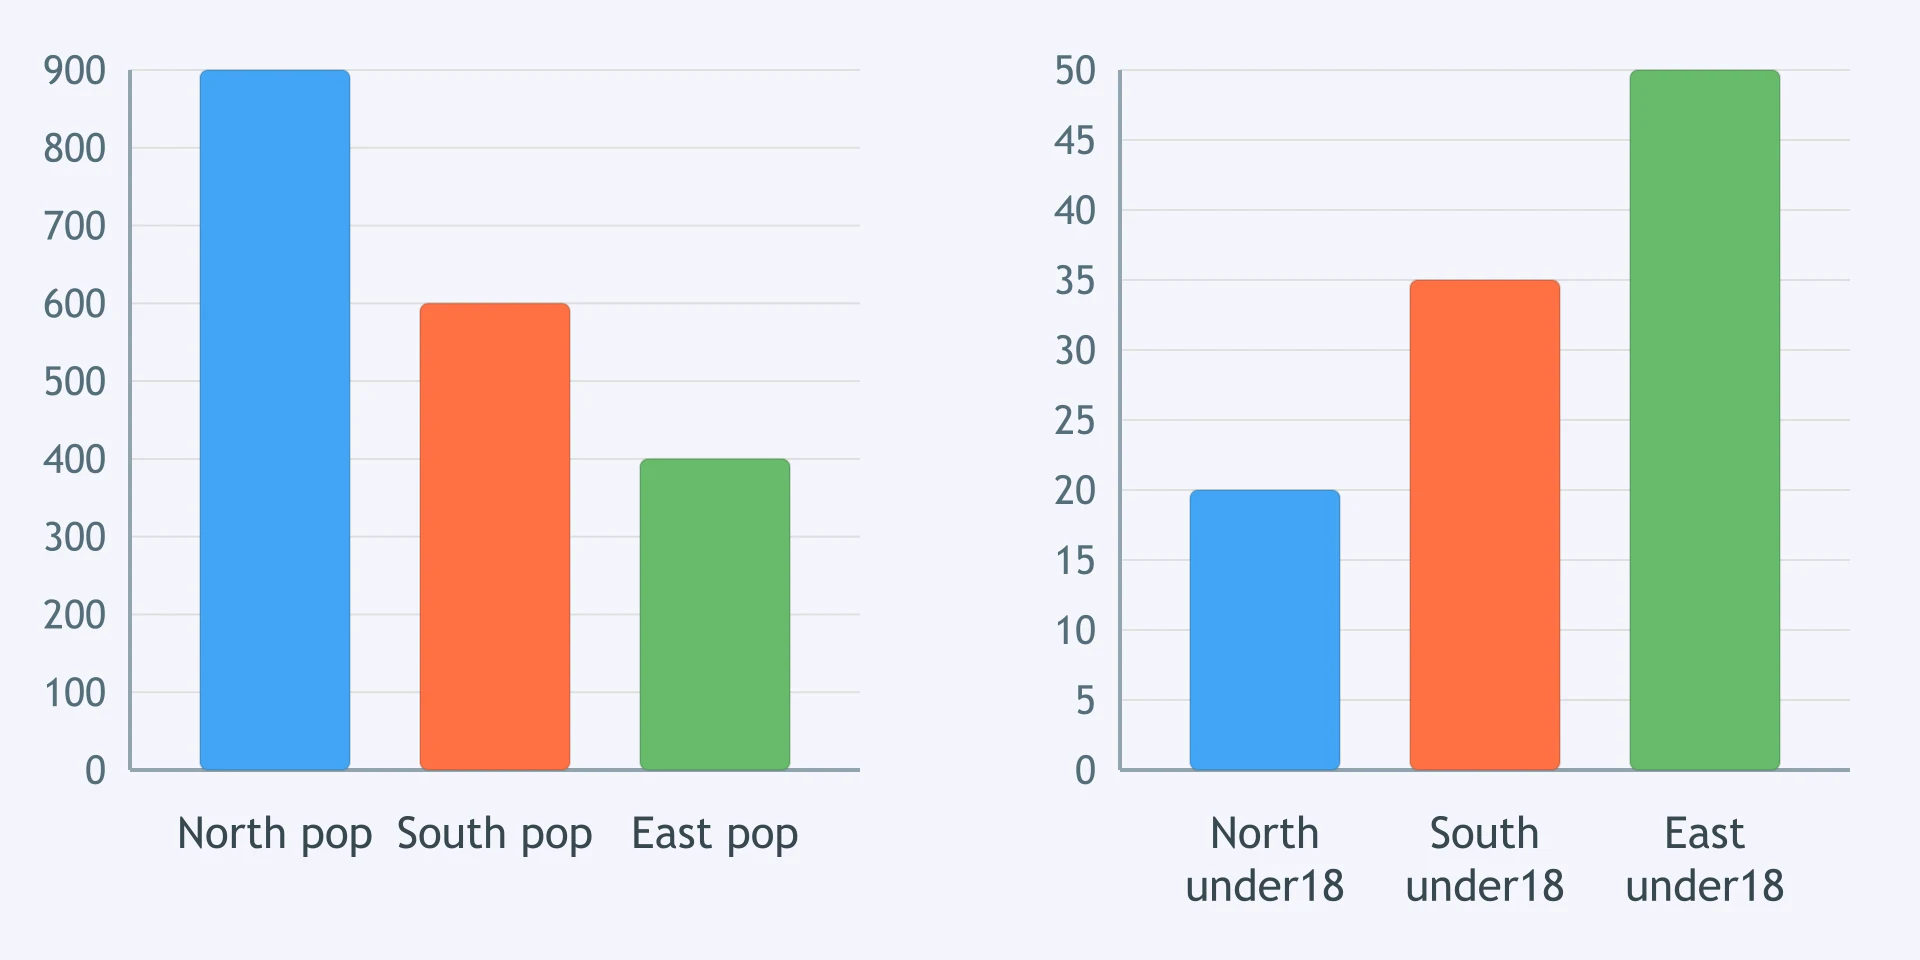
A table gives population and a chart gives the under-18 share. Which handling decision is best?
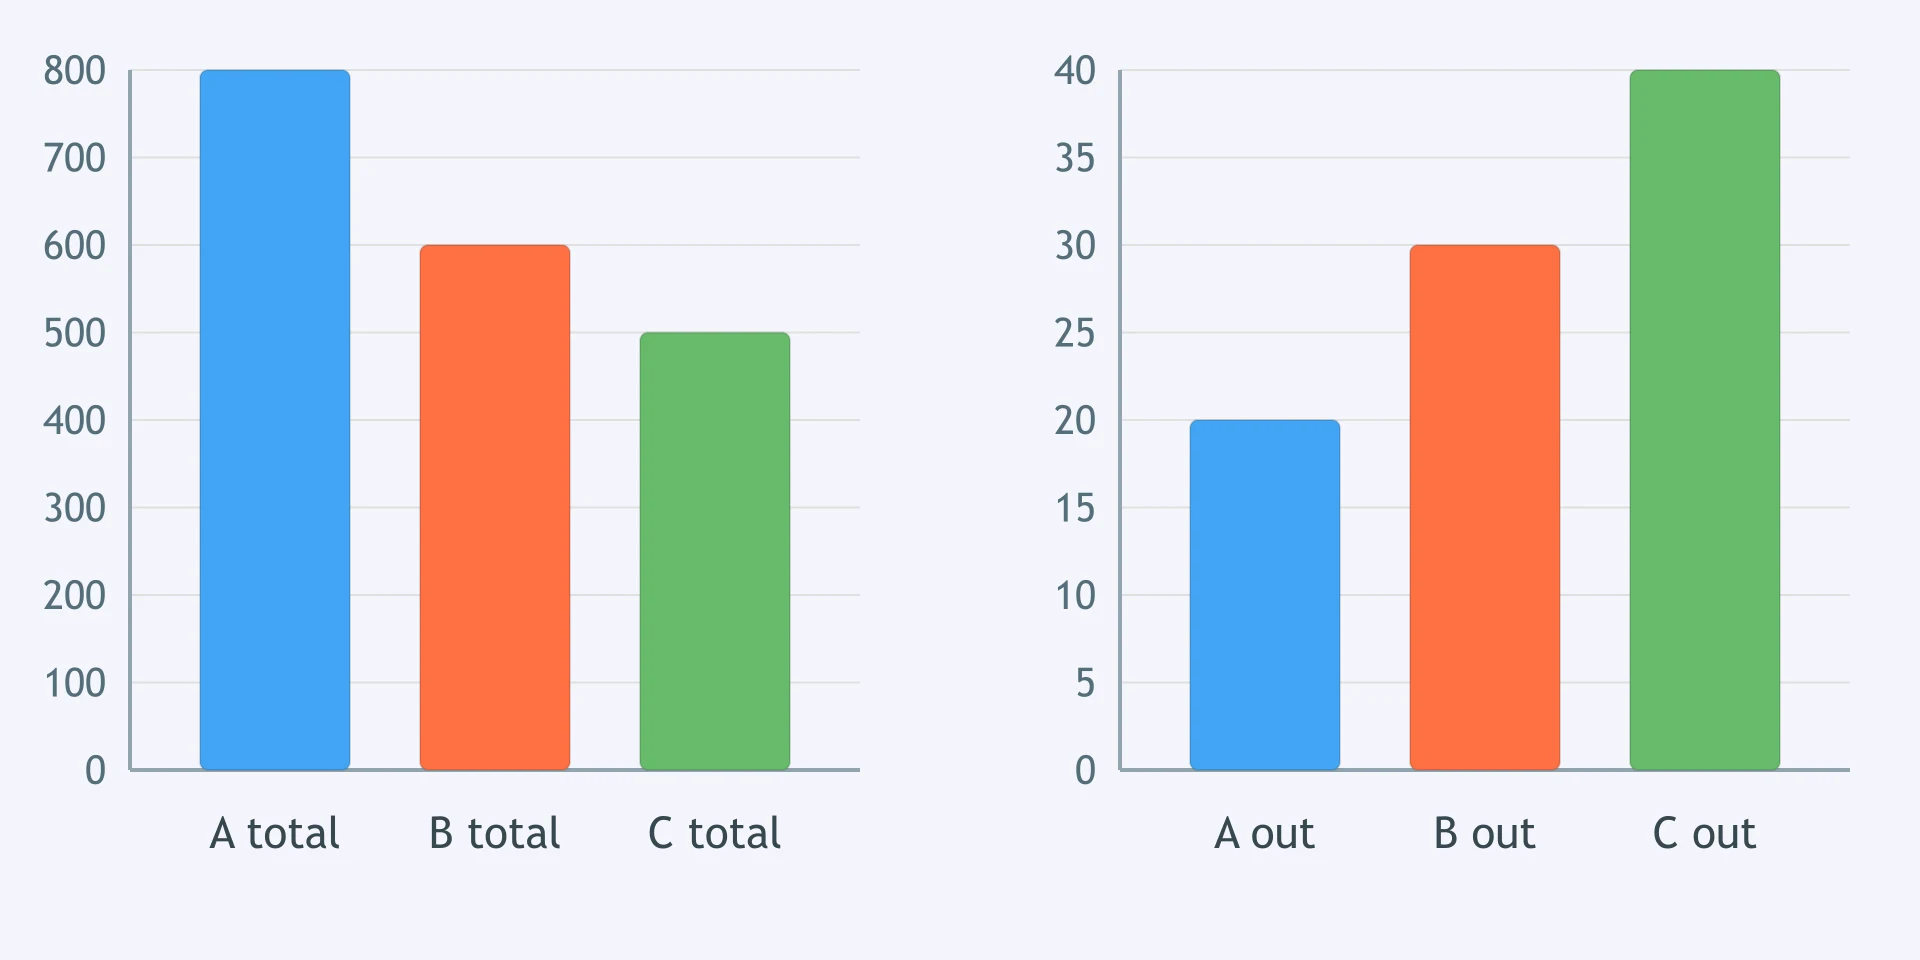
The charts show total food spending and the share spent on eating out. Which result follows?
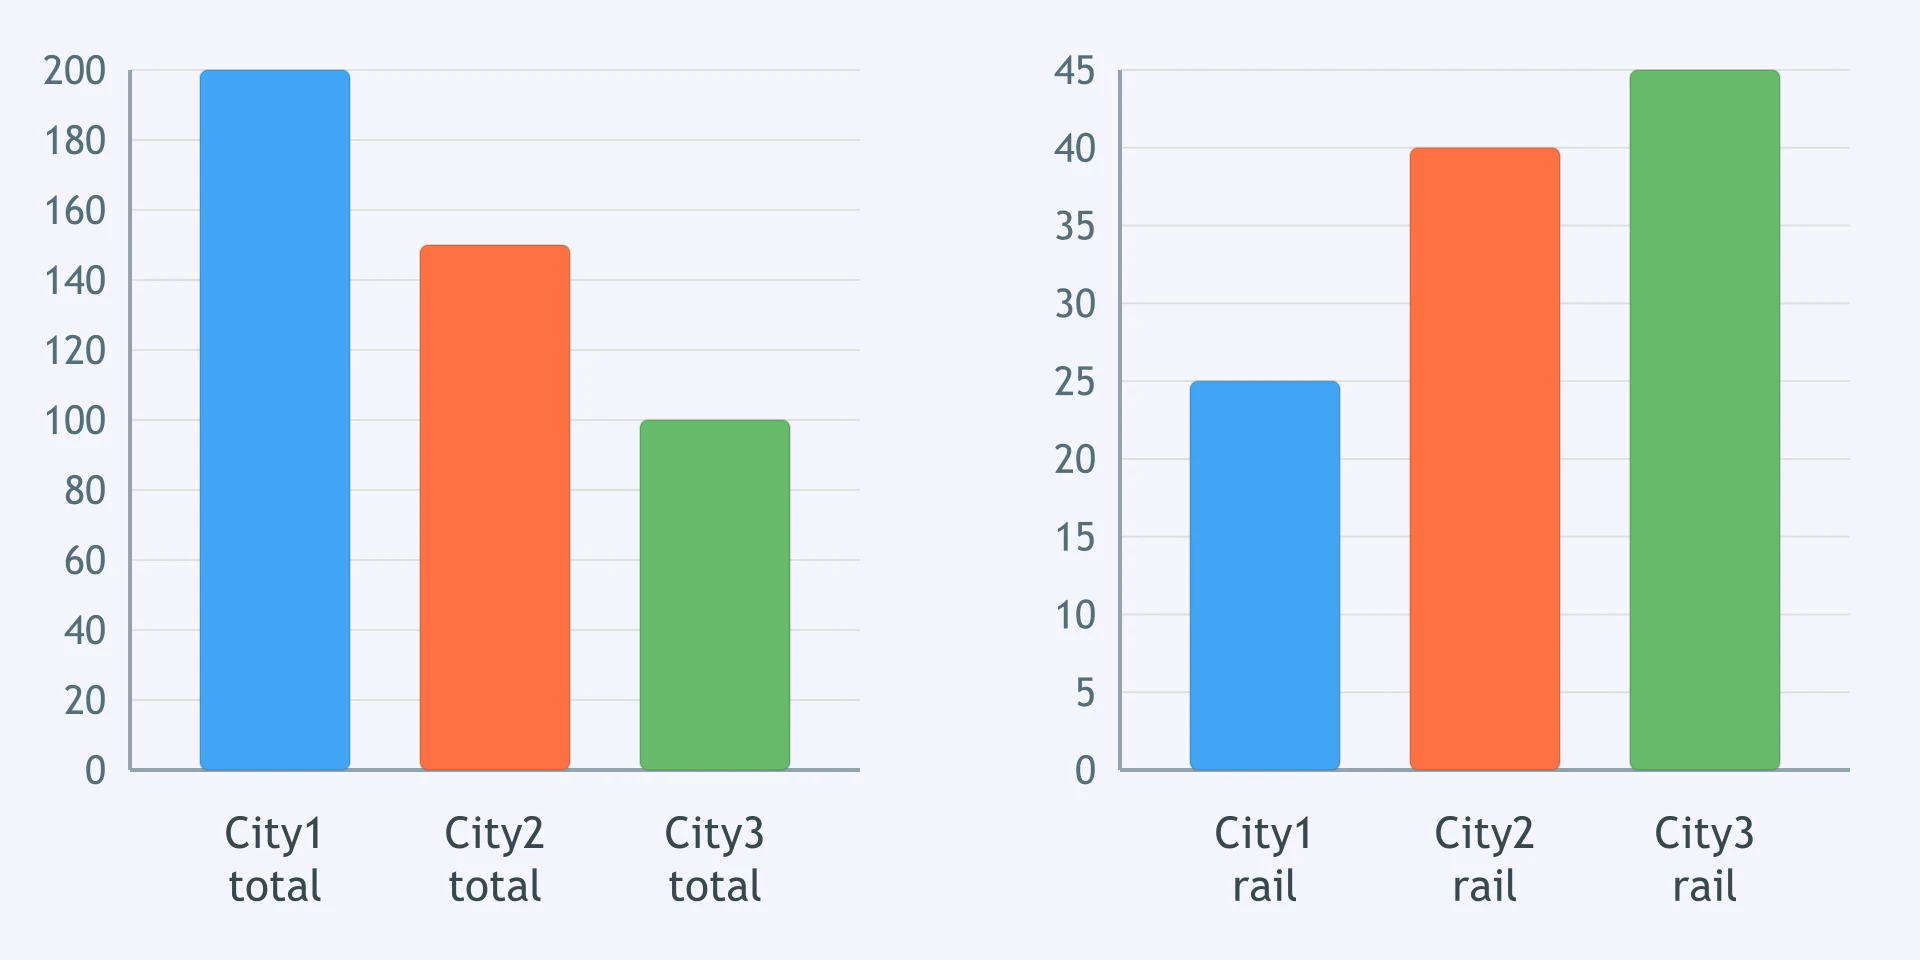
The panels give total journeys and the rail share. What should a precise report do?
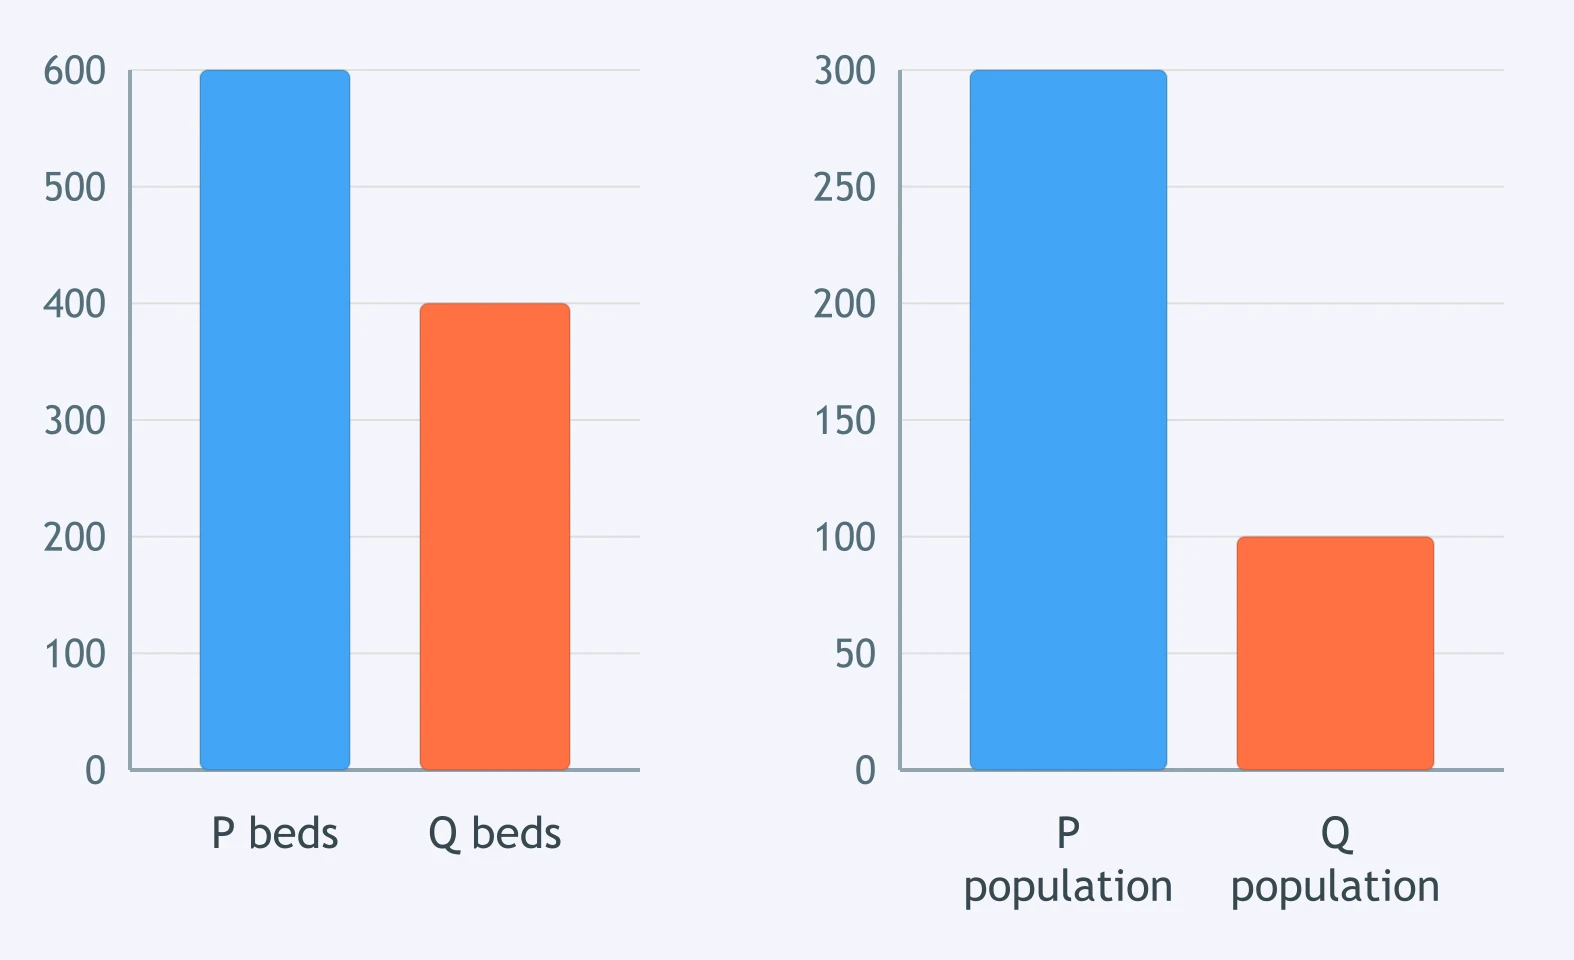
City P has the most hospital beds, while City Q is smaller. Which statement is supported by the pair of panels?
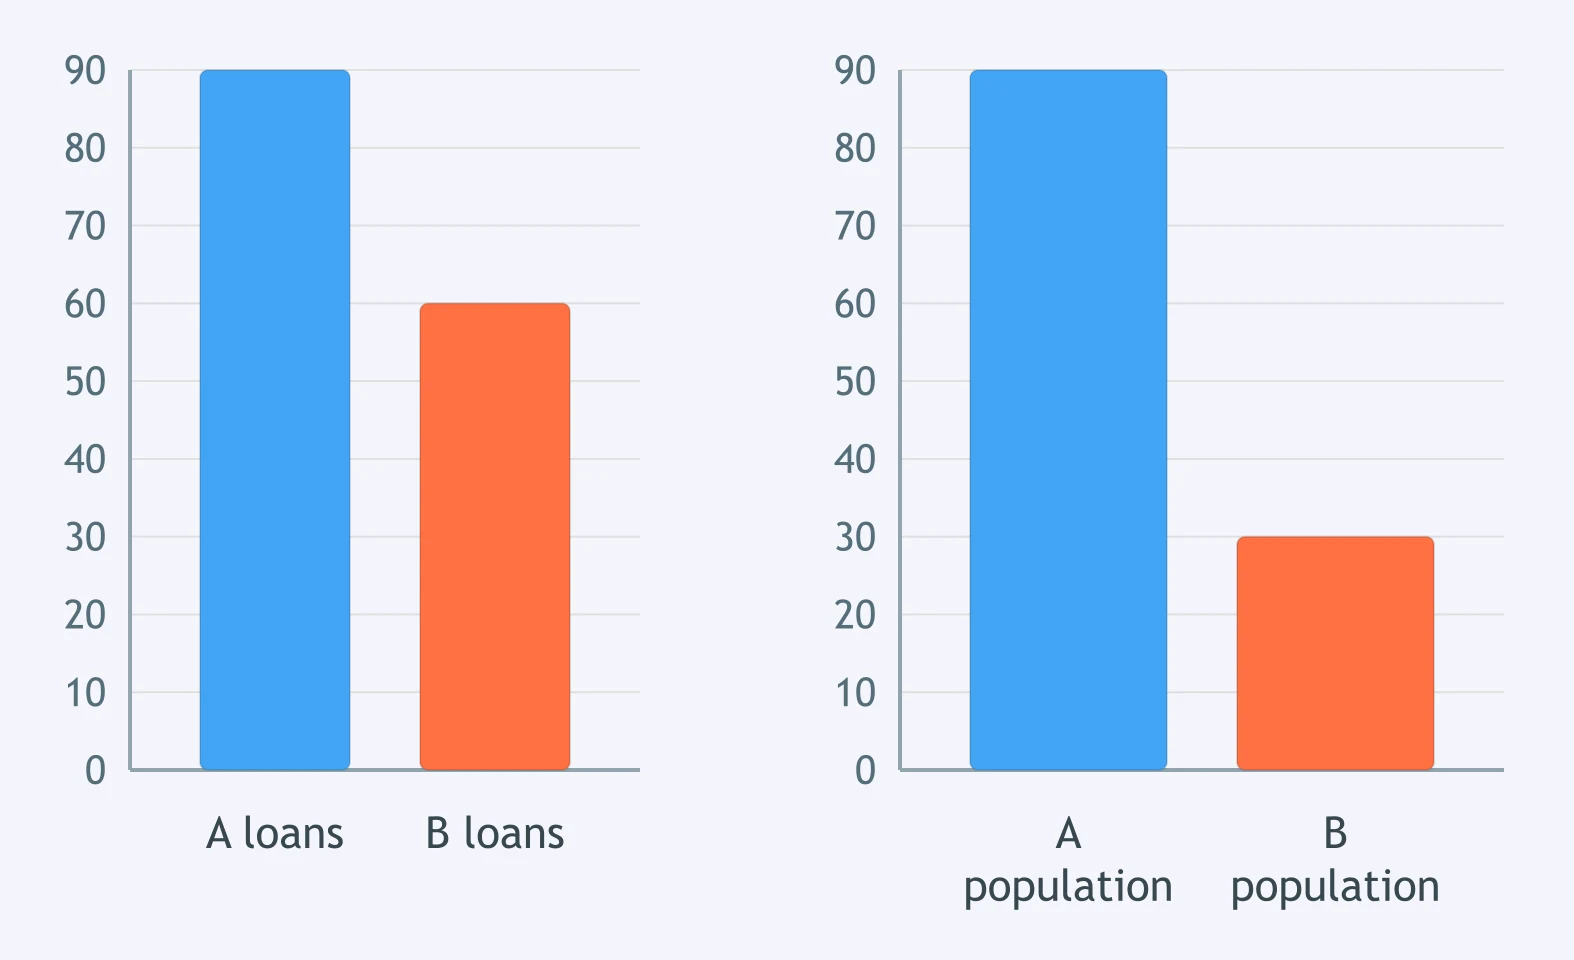
The first chart ranks total library loans; the second shows population. Which claim avoids the cross-chart trap?
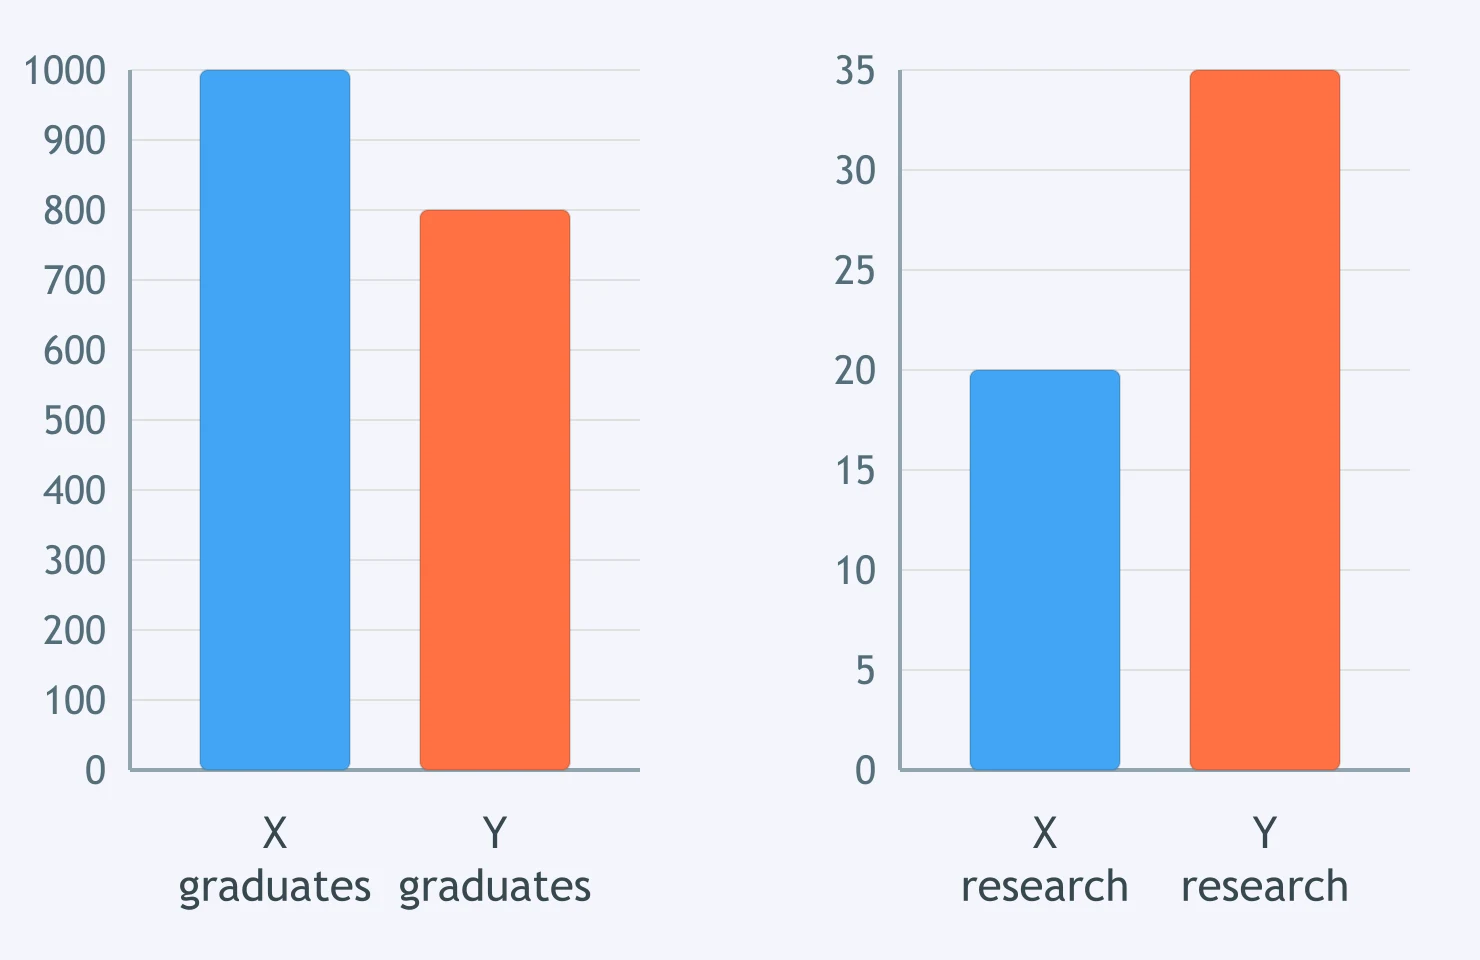
A panel shows total graduates; another shows the percentage entering research jobs. Which statement is safest?
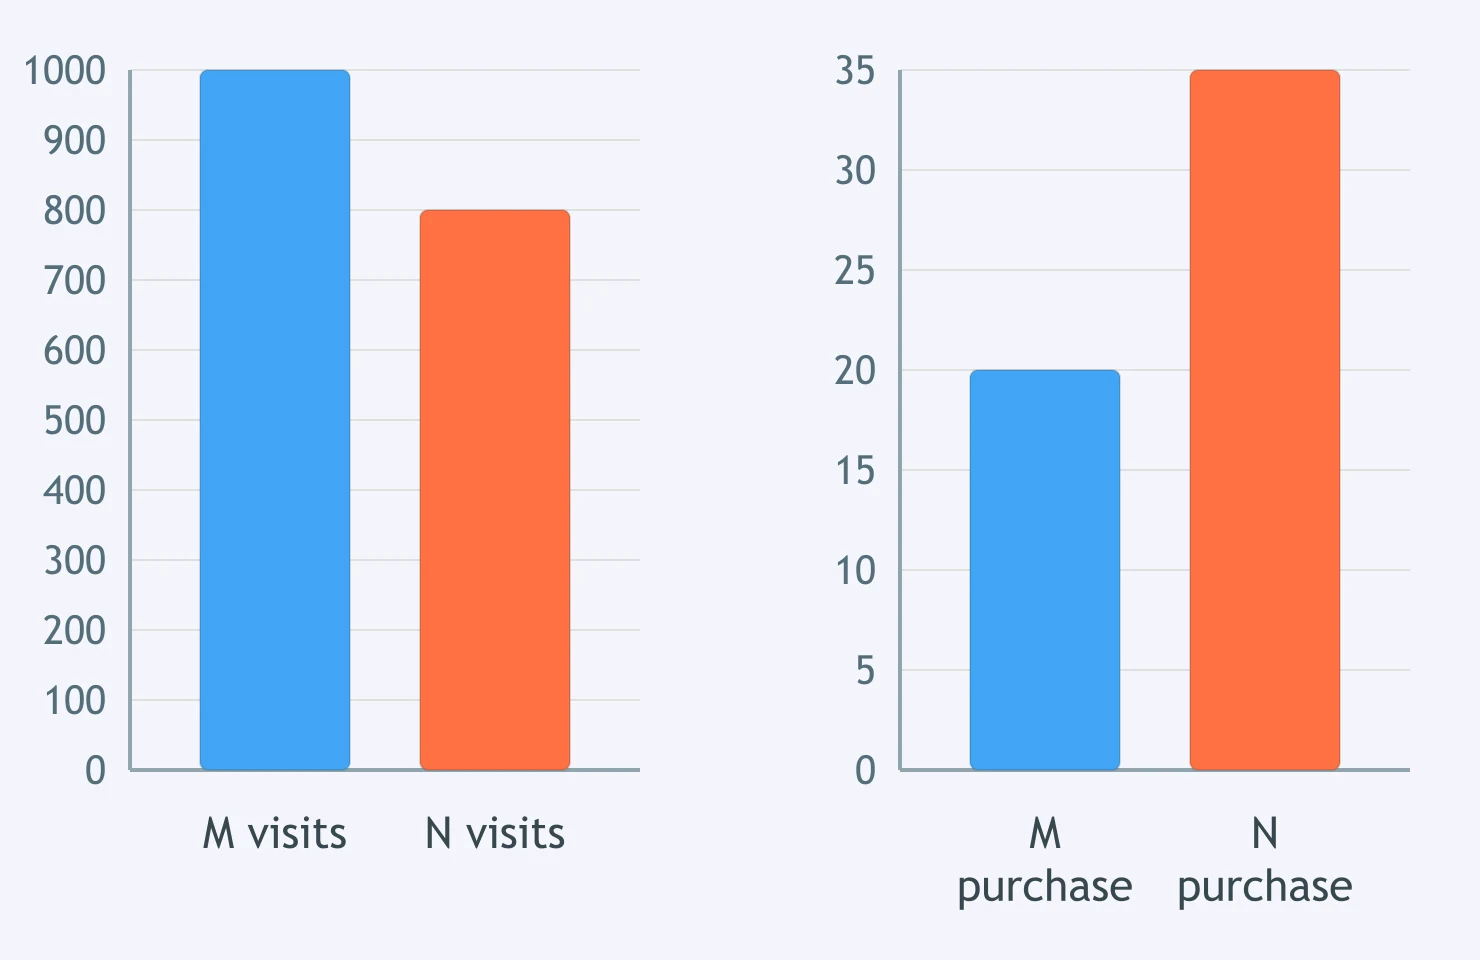
The figure gives store visits and purchase rates. Which sentence is correct for the combined data?
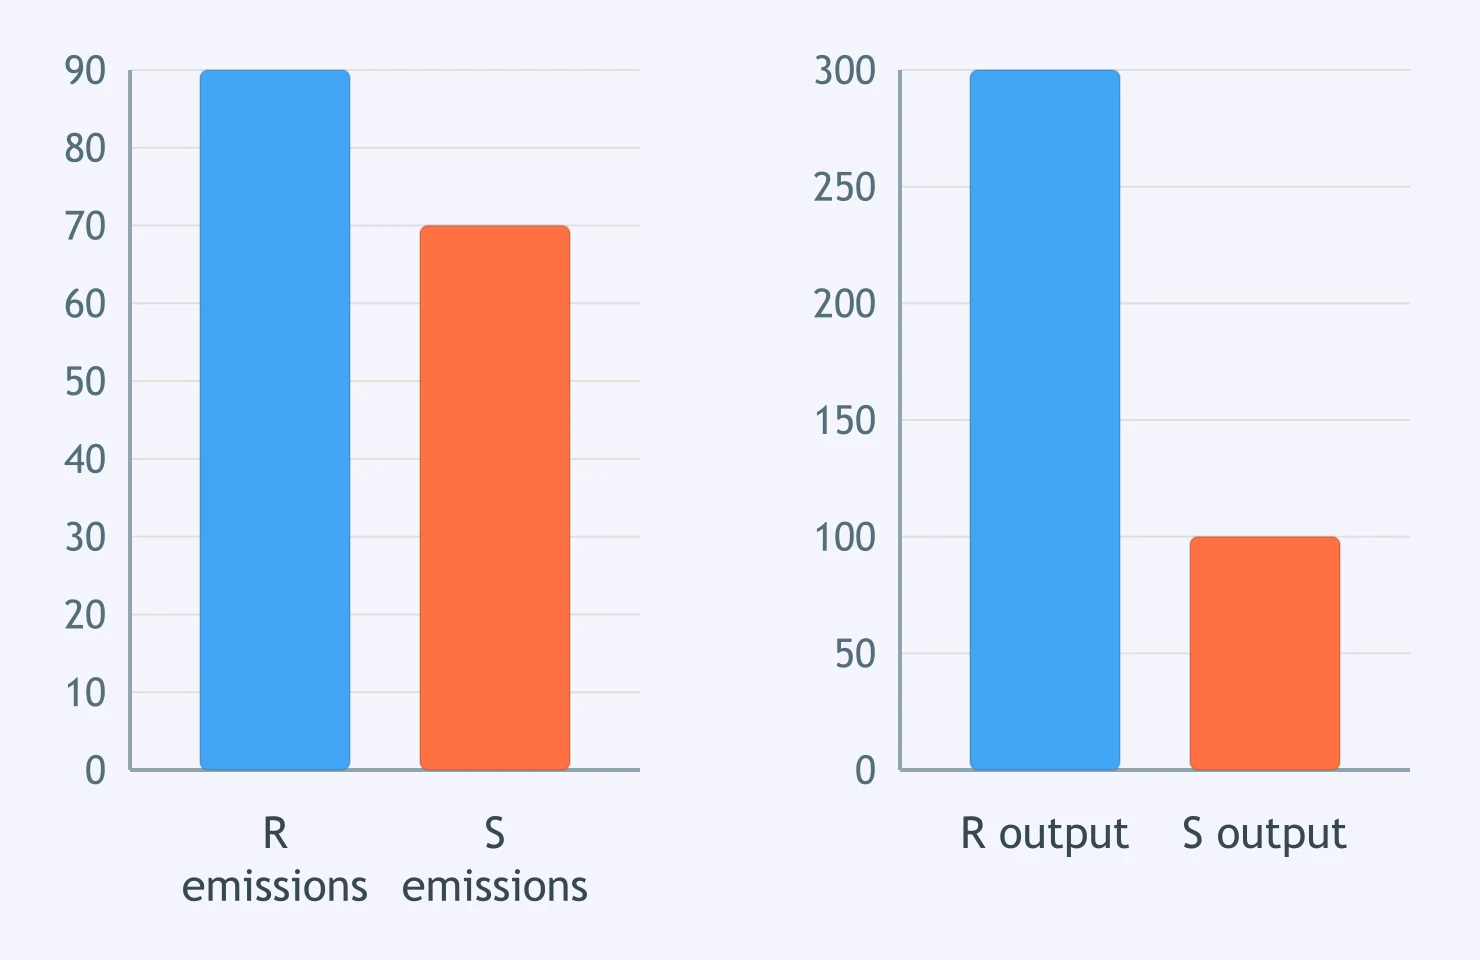
Panel A shows total emissions; Panel B shows output. Which statement best reflects both charts?
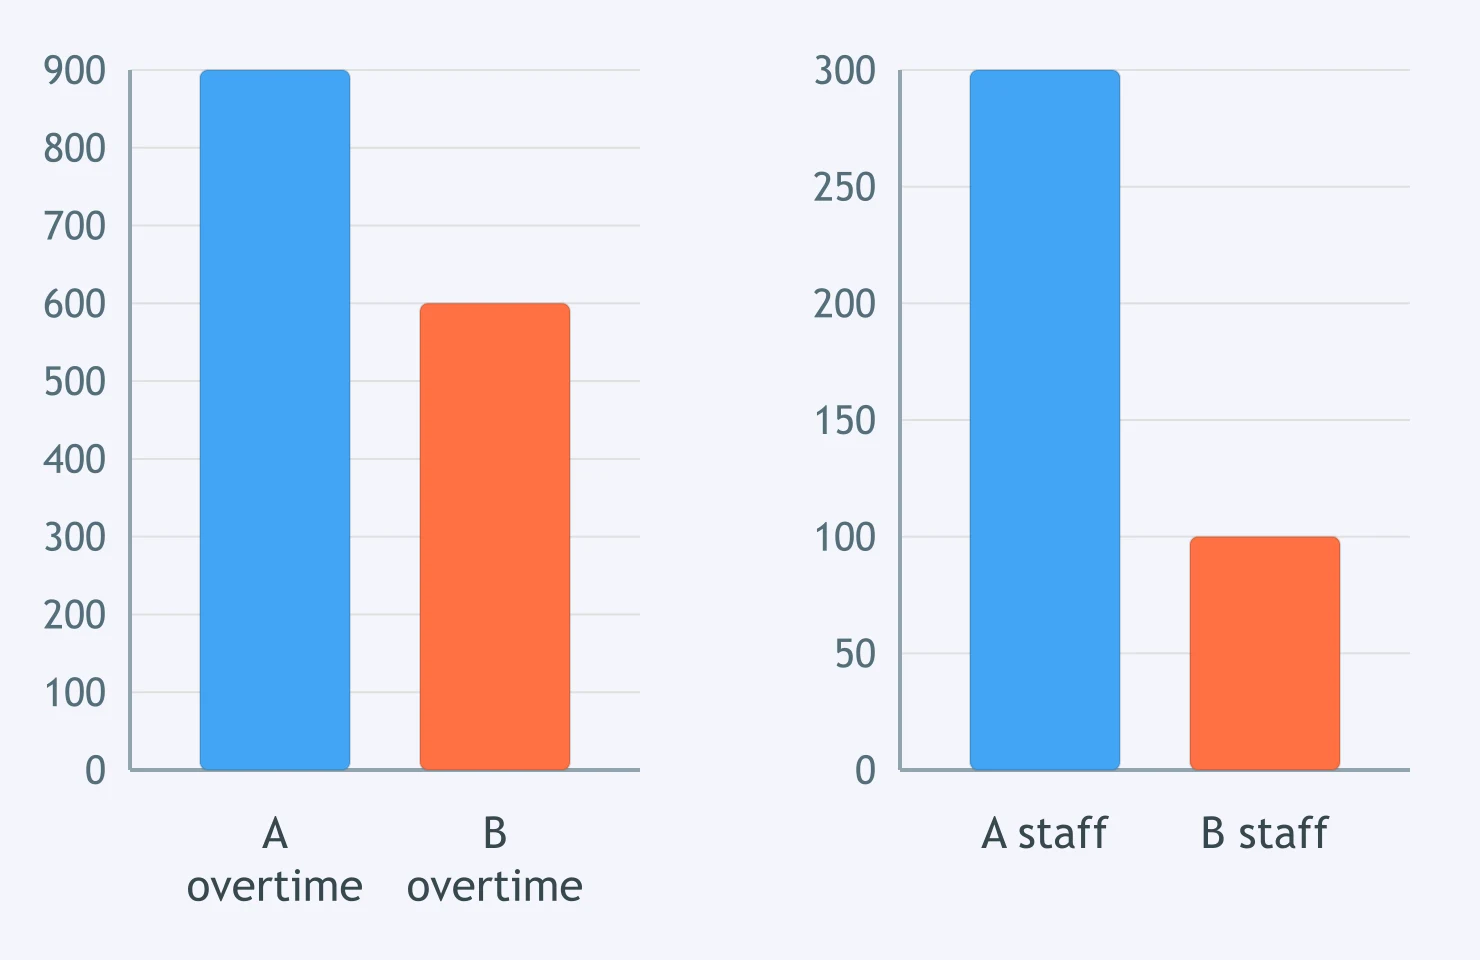
The charts show staff numbers and overtime hours. Which apparent conclusion is overturned by the second chart?
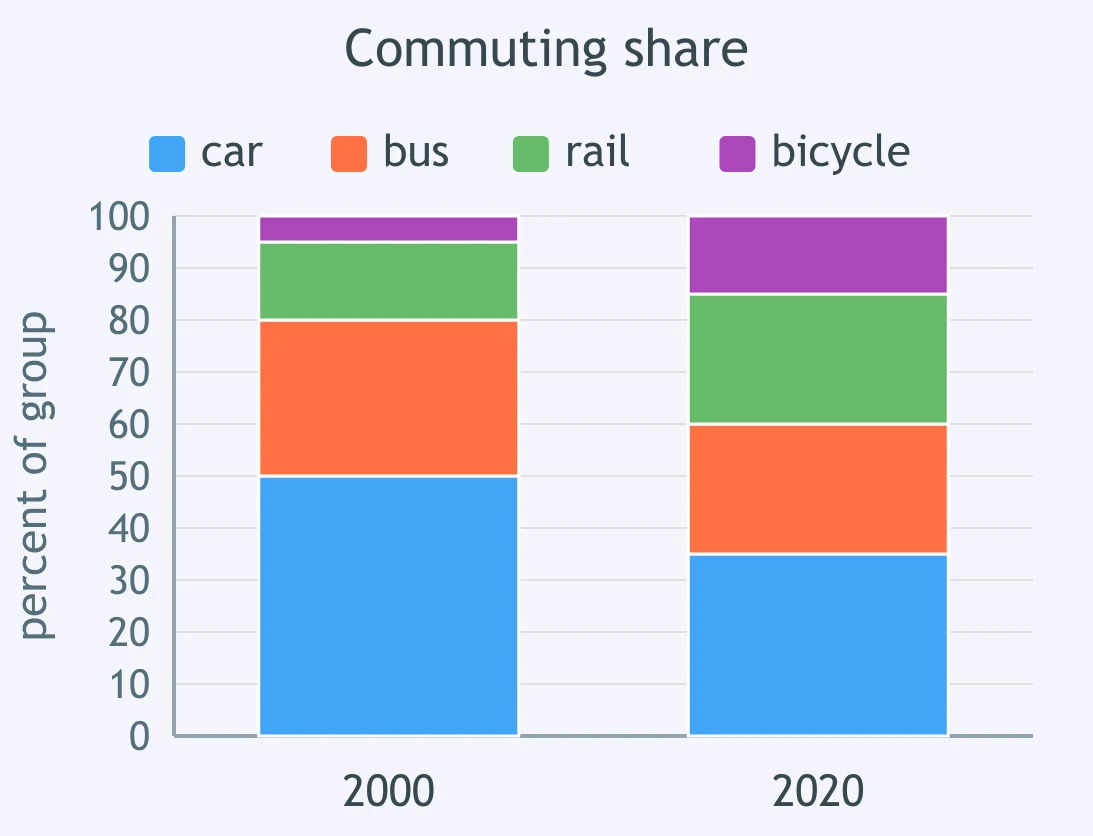
Two segmented bars show transport shares in 2000 and 2020. How should the main body be organised?
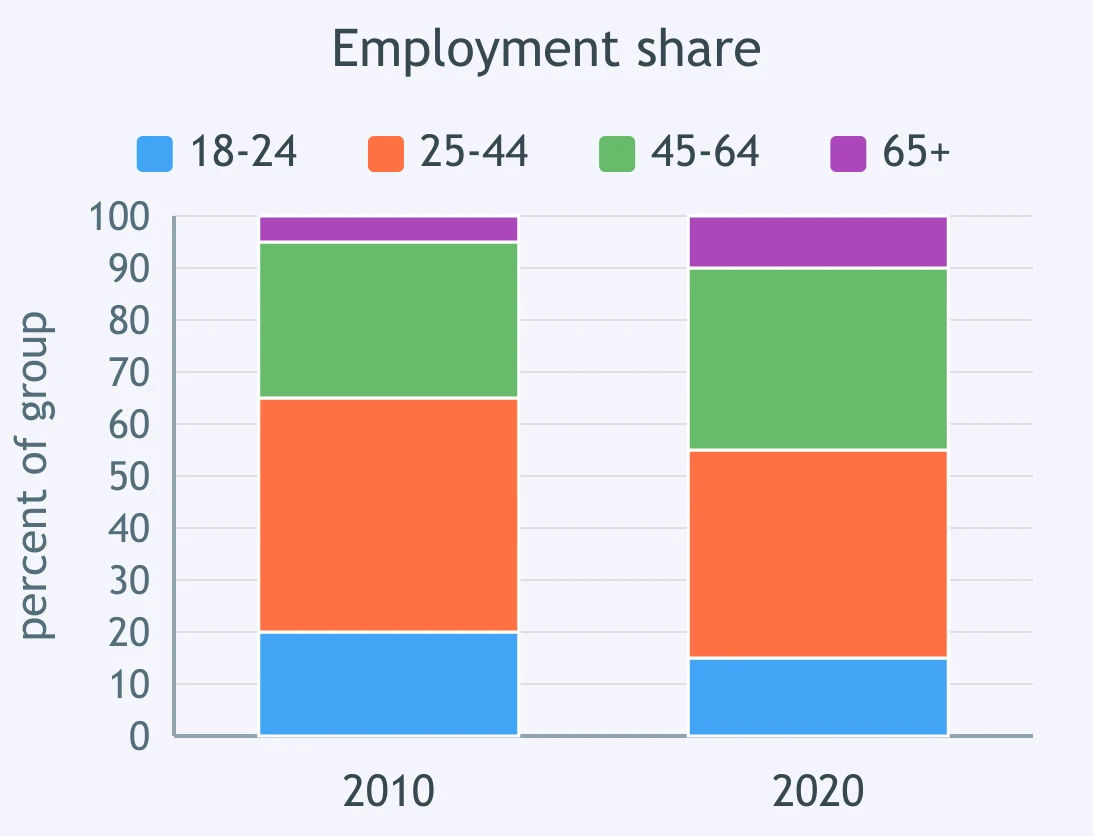
A Task 1 figure pairs age-group employment shares for two years. Which plan best selects key features?
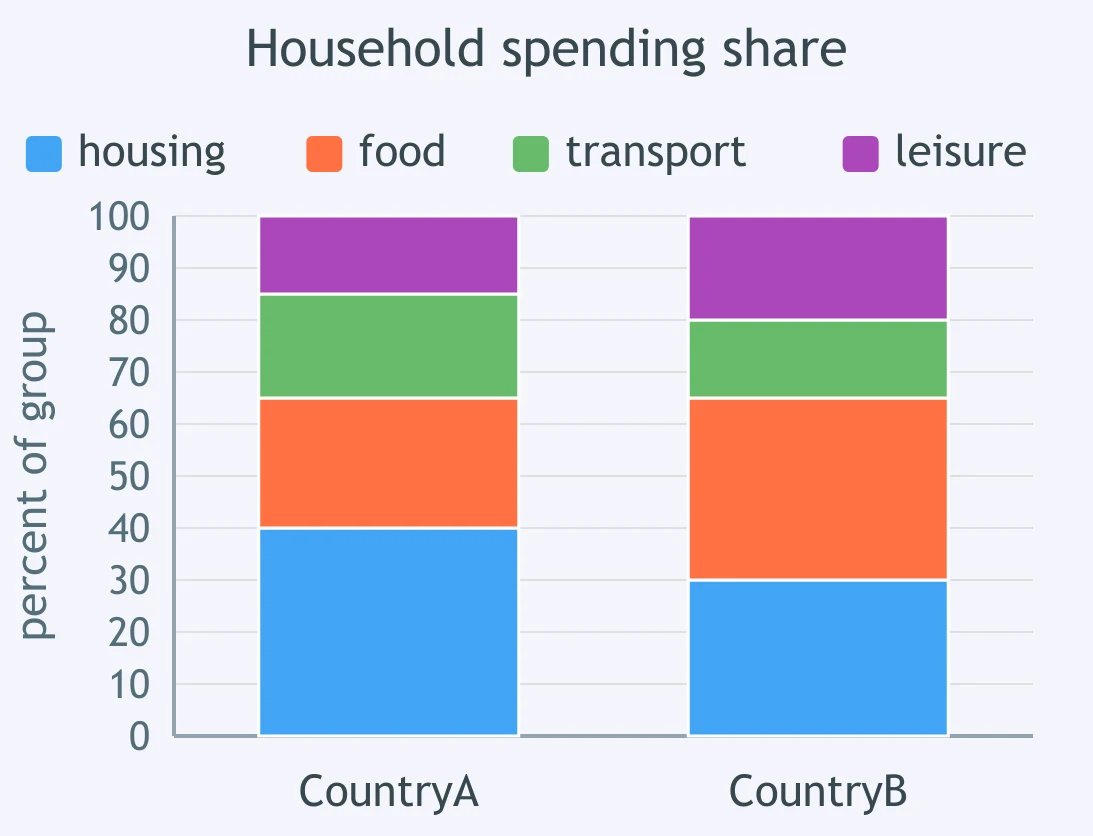
The figure compares spending shares in two countries. Which paragraphing choice would be strongest?
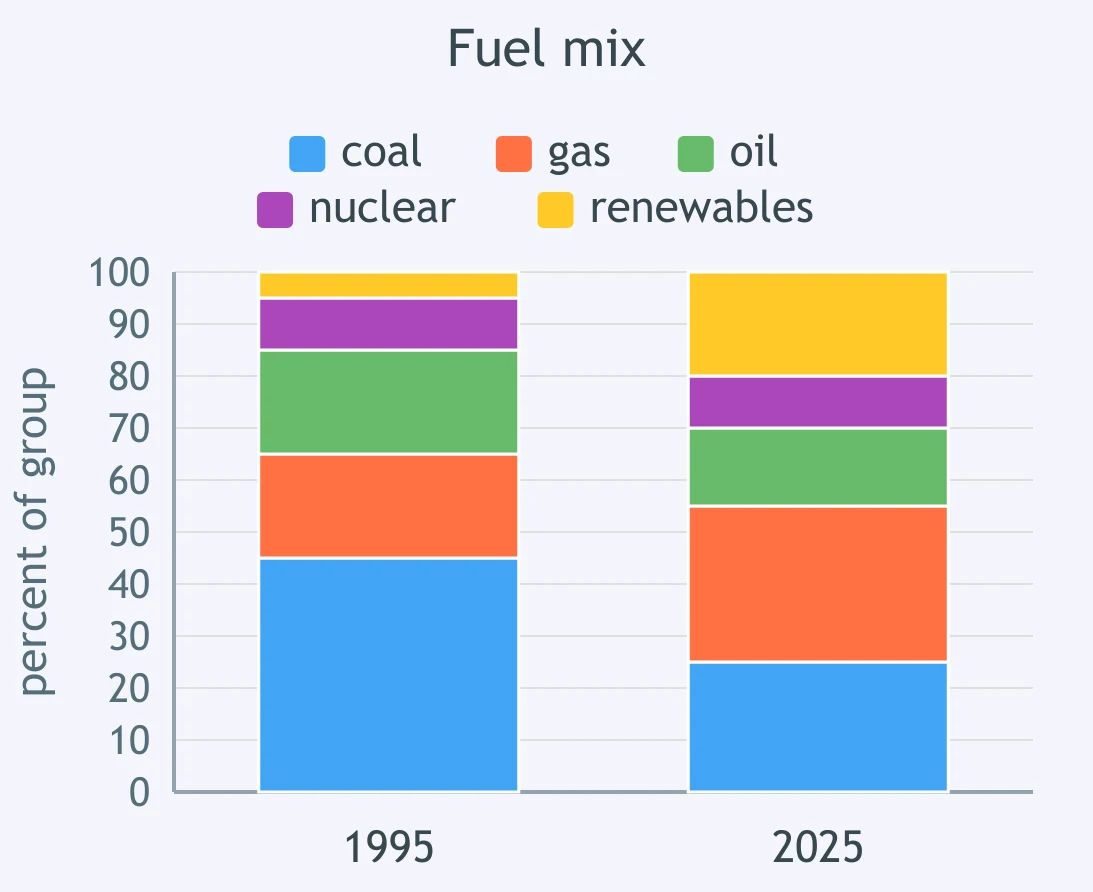
Two panels show fuel mix in 1995 and 2025. Which overview is best suited to the figure?
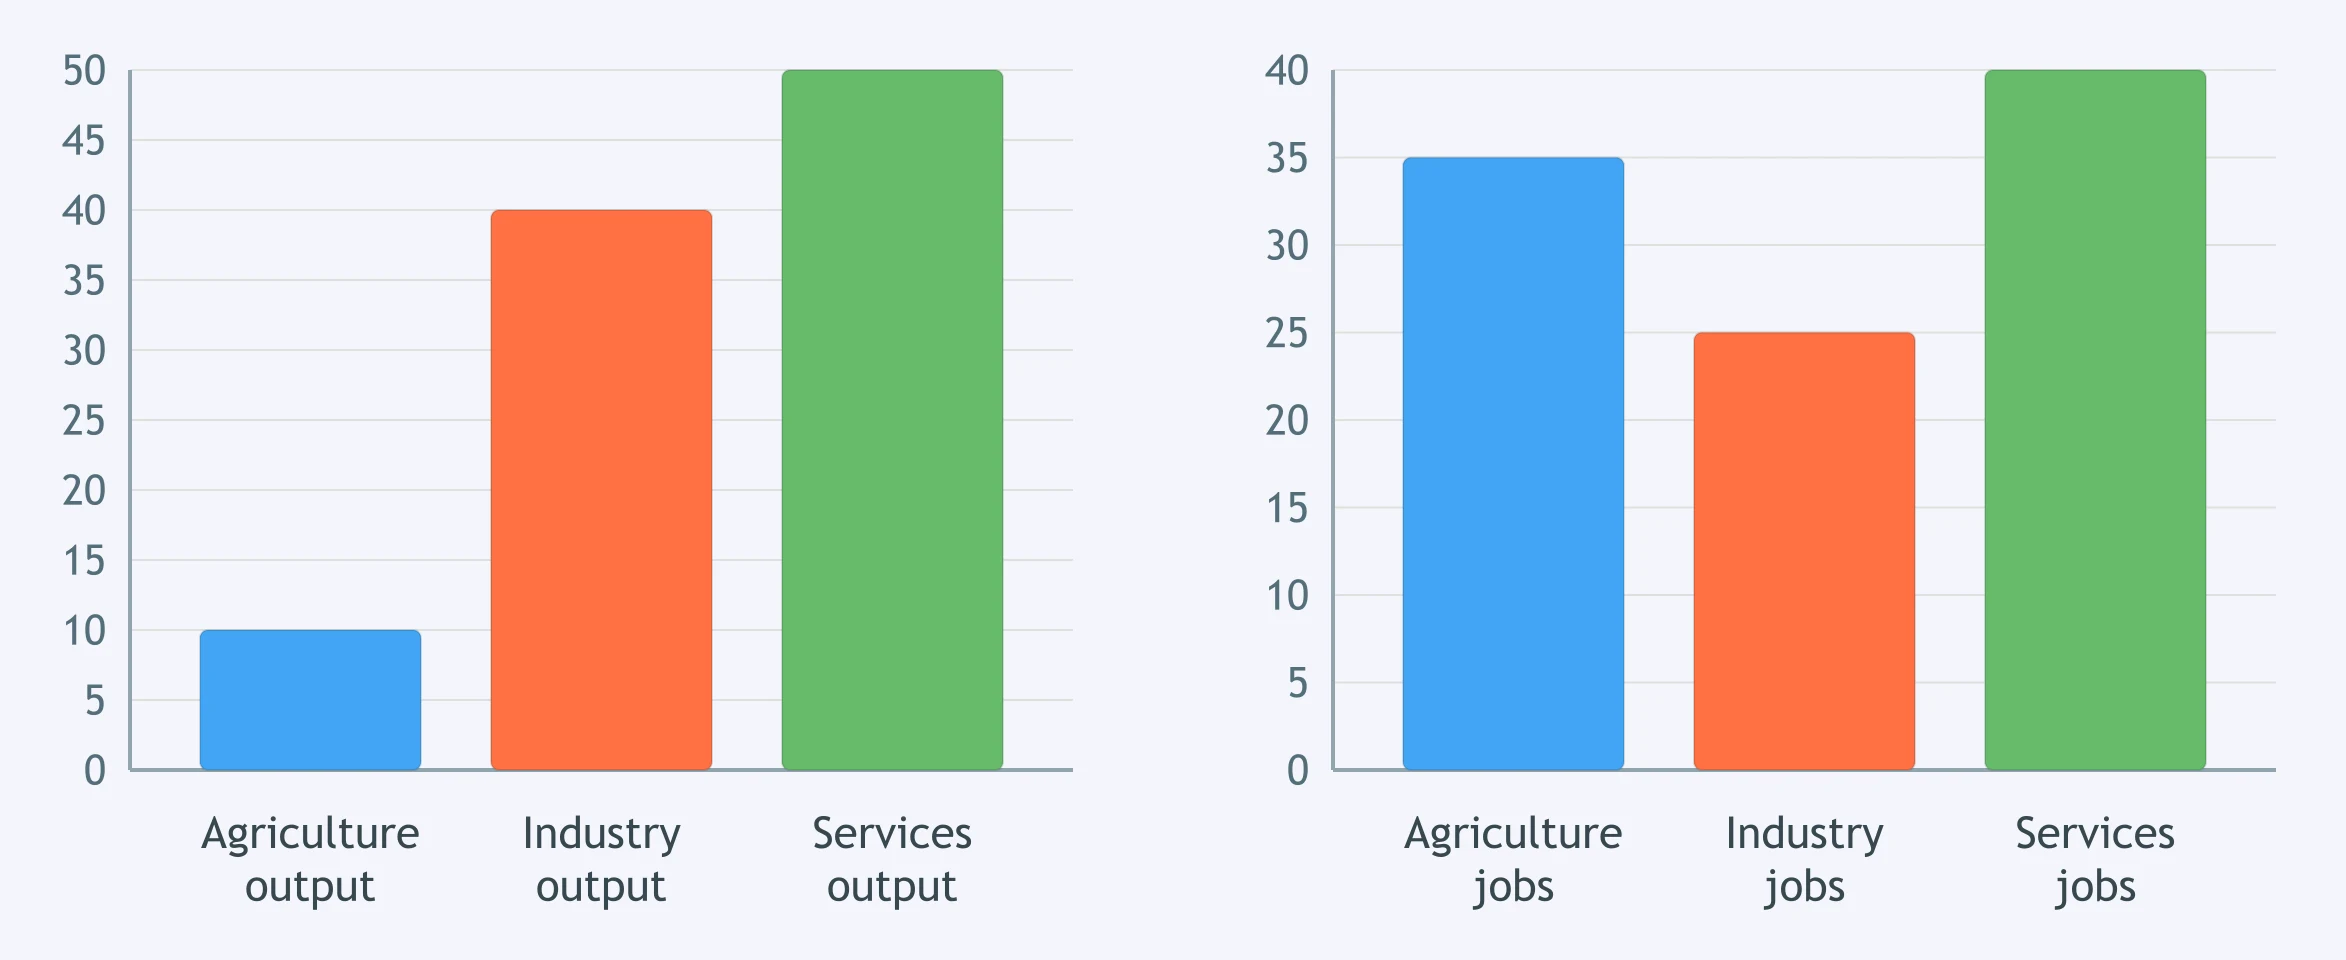
A report must handle two charts: output by sector and employment by sector. What organisation best avoids listing?
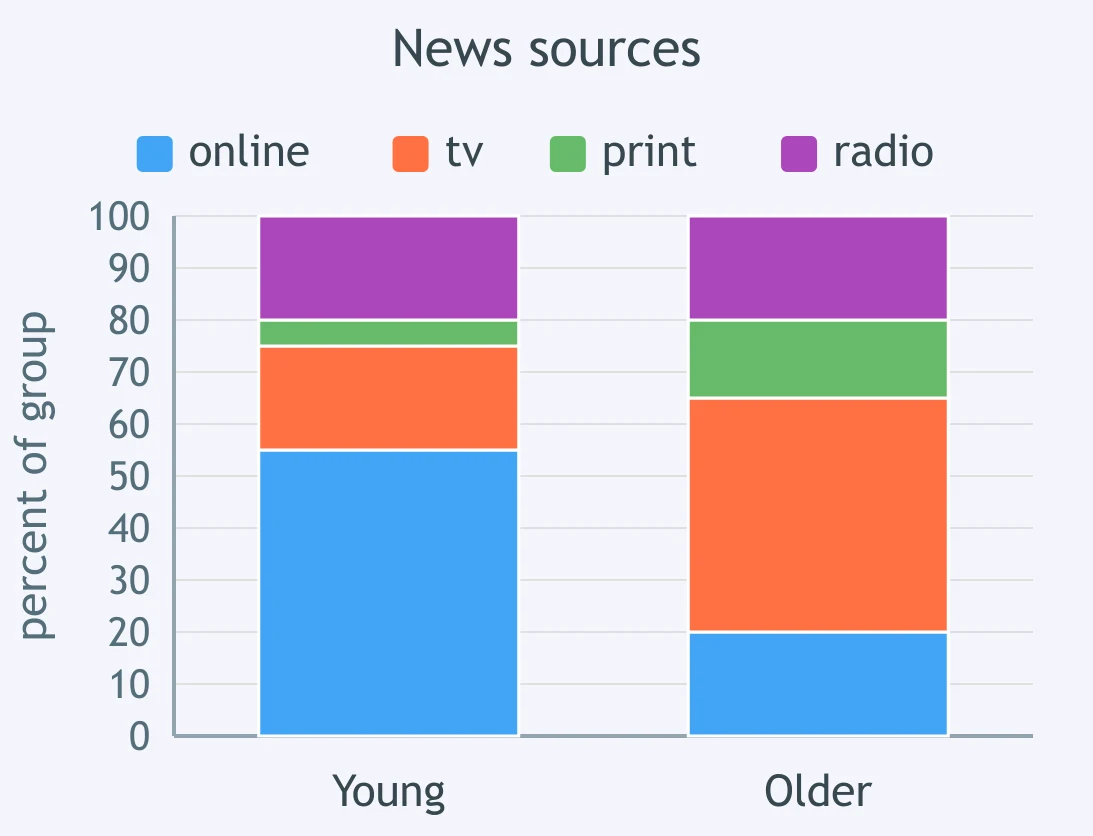
Two bars compare sources of news by age group. Which approach gives a coherent IELTS Task 1 report?

Tone: Certain, Doubtful or Reluctant? - IELTS 7.0 L
15 questions

Selecting Key Features: What to Leave Out - IELTS 7.0 W T1
25 questions

Precise Comparison and Complex Data Relations - IELTS 7.0 W T1
30 questions
Overview Quality: Adequate versus Strong - IELTS 7.0 W T1
25 questions

Precision With Figures: Avoiding Vague Reporting - IELTS 7.0 W T1
30 questions
Crack the passcode before the zombies get in.
Answer, then swat bugs for bonus points.
Race through questions at your own speed.
Same question on every screen. Fastest wins.

Pick a tile, answer, hit bonuses and steals.