Loading
by BlastRoom
IELTS Task 1 practice in choosing precise language for figures and trends.
#writing_task_1#ielts_7_0

30 questions
One question set, multiple game modes. Tap any game to see it in action. Not sure which to pick?
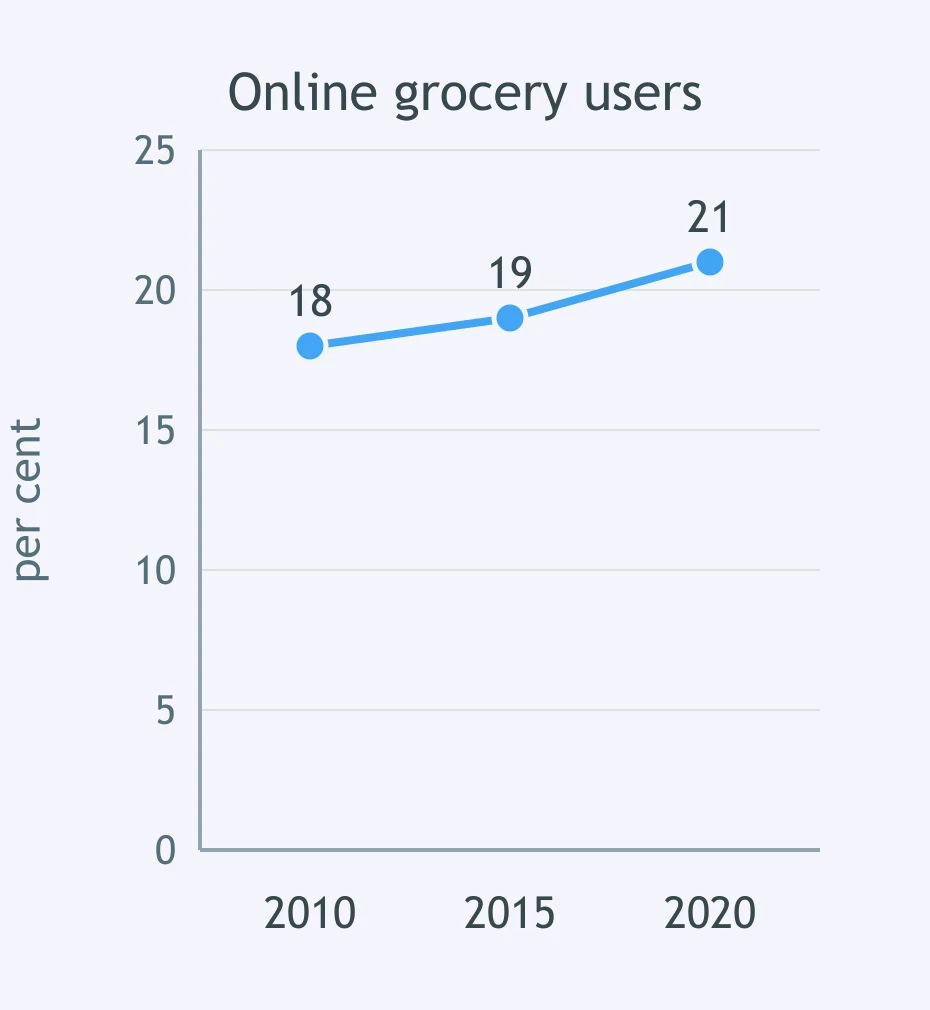
The graph shows online grocery users. Which report of the change is most precise?
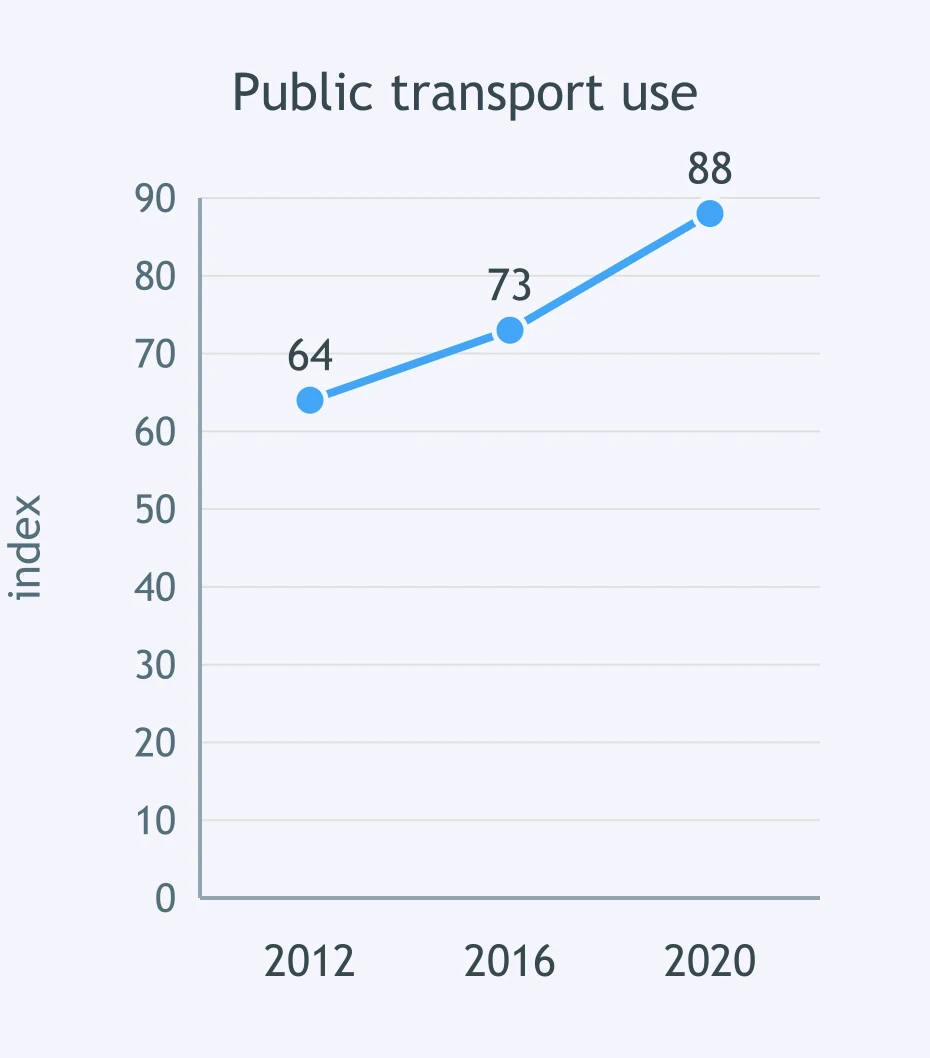
The graph shows an index of public transport use. Which wording best fits the size of the change?
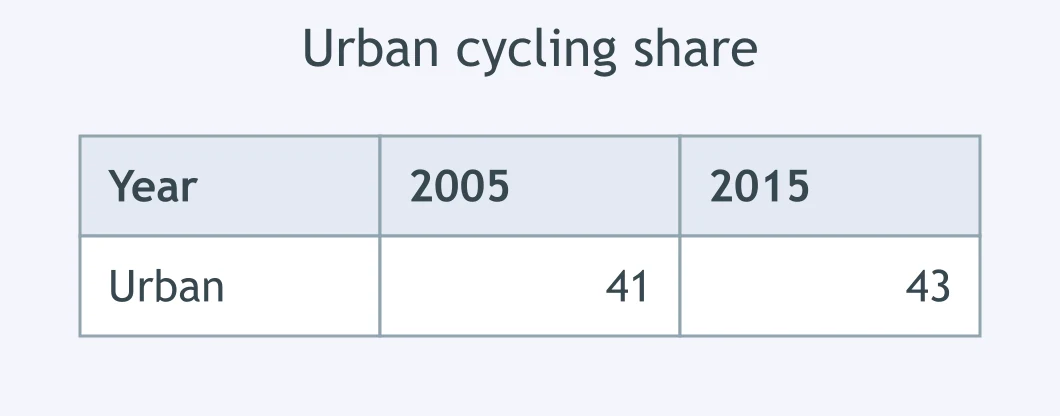
The table shows the urban cycling share in 2005 and 2015. Which sentence avoids exaggeration?
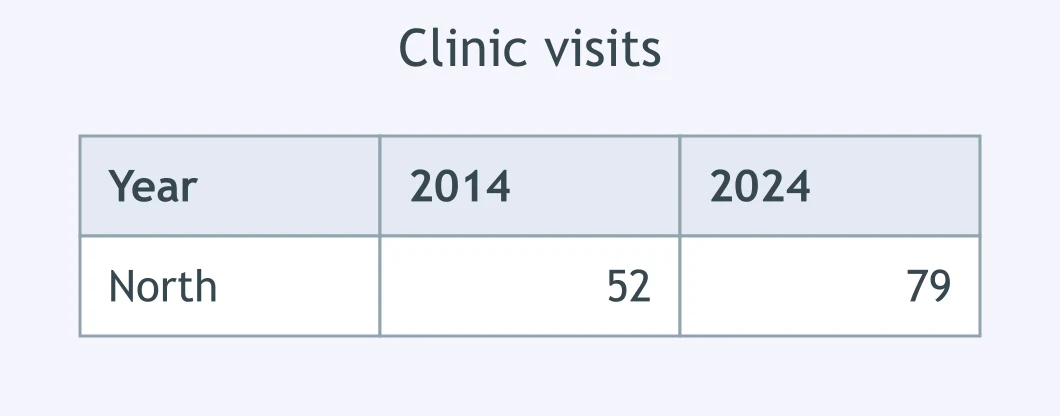
The table shows clinic visits in the North district in 2014 and 2024. Which description fits the change?
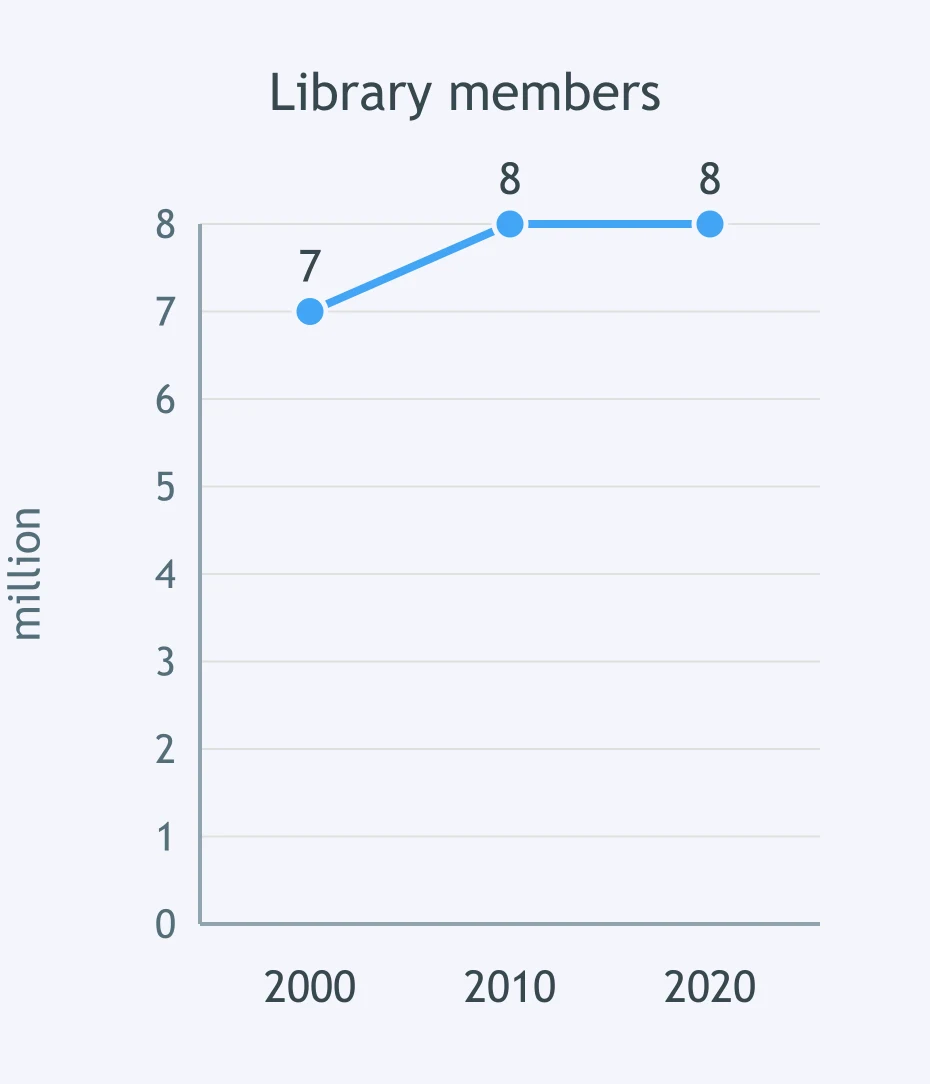
The graph shows library membership. Which summary is best?
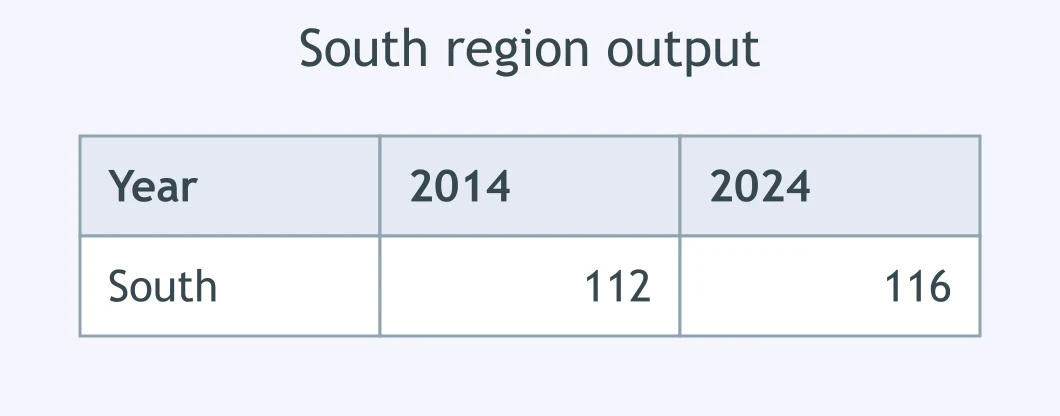
The table shows output in the South region in 2014 and 2024. Which report is accurate?
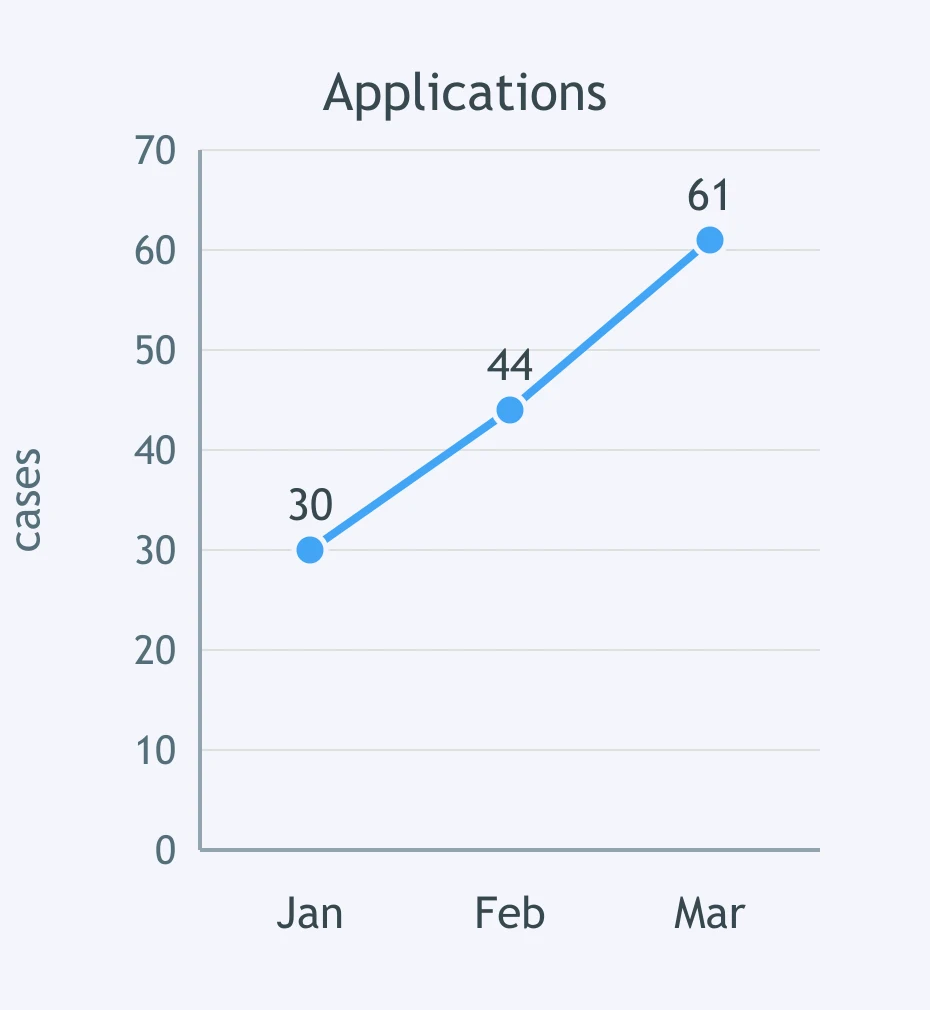
The graph shows monthly applications. Which sentence reports the change best?
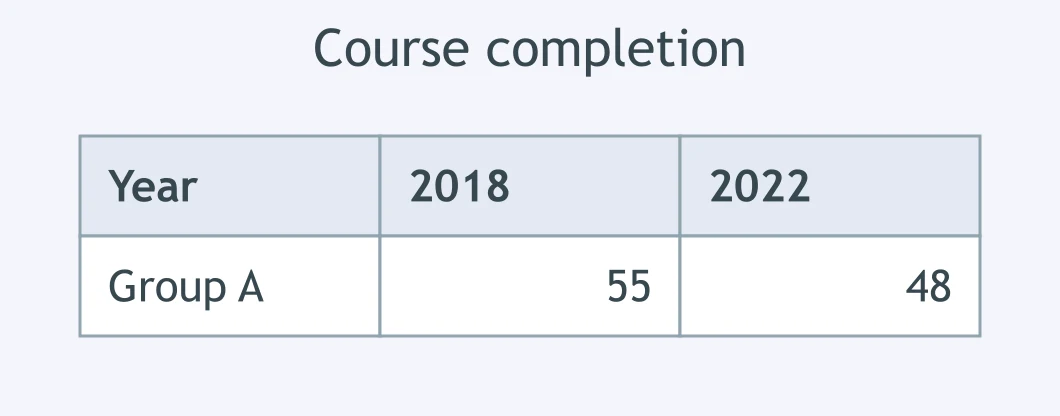
The table shows course completion for Group A in 2018 and 2022. Which wording is best?
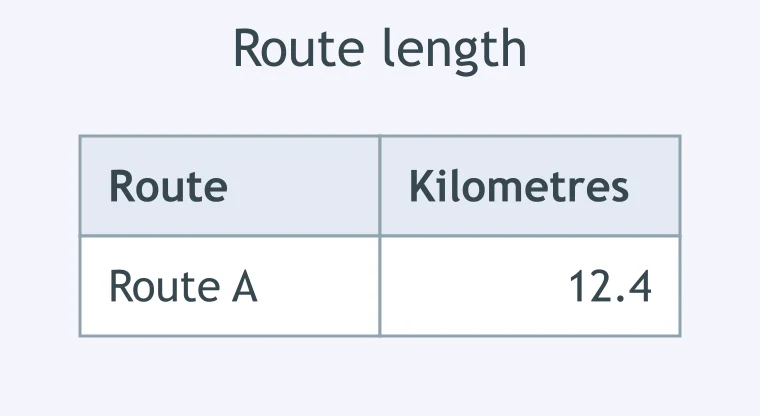
The chart shows waste collected in 2019. Which approximation is acceptable?
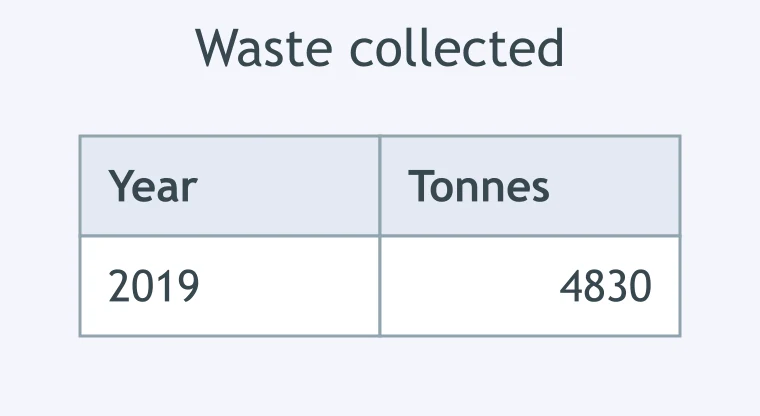
The chart shows water use in the Central zone. Which rounded report is best?
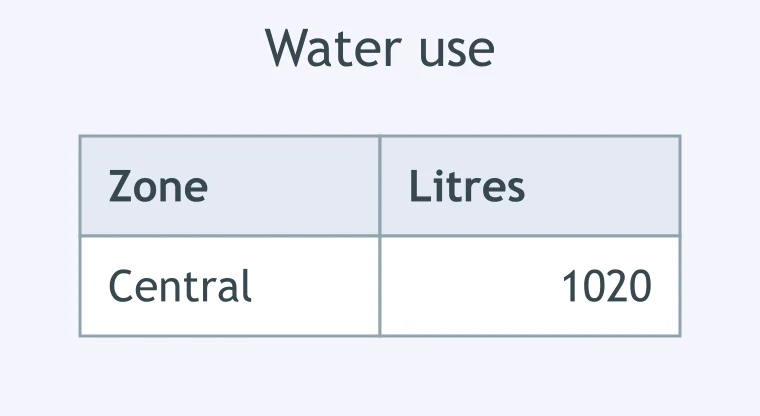
The chart shows recycling in April. Which phrase rounds it suitably?
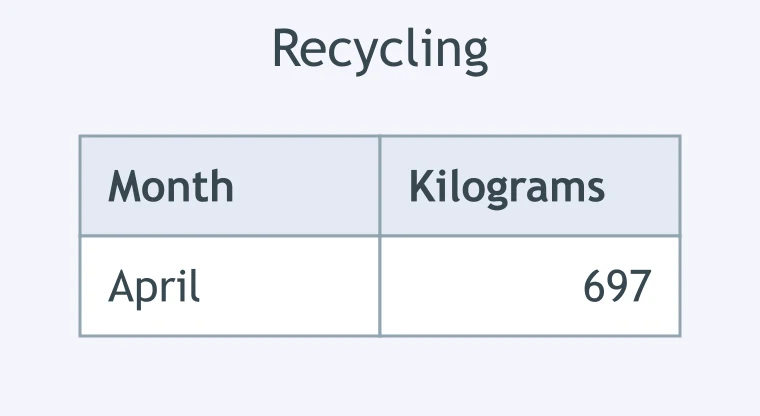
The chart shows the length of Route A. Which sentence reports it appropriately?
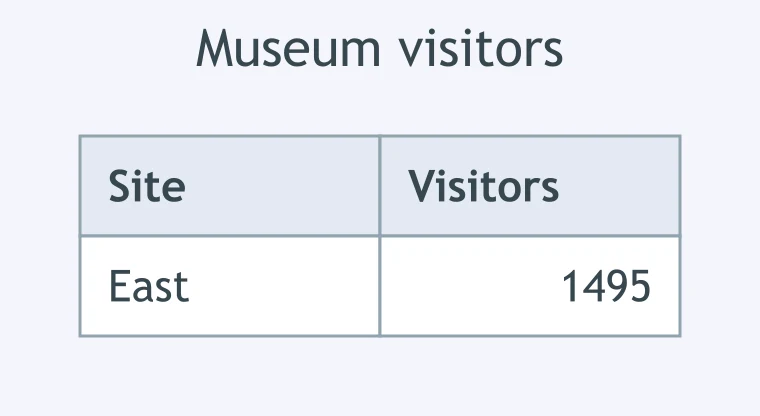
The chart shows visitors to the East site. Which approximation is most accurate?
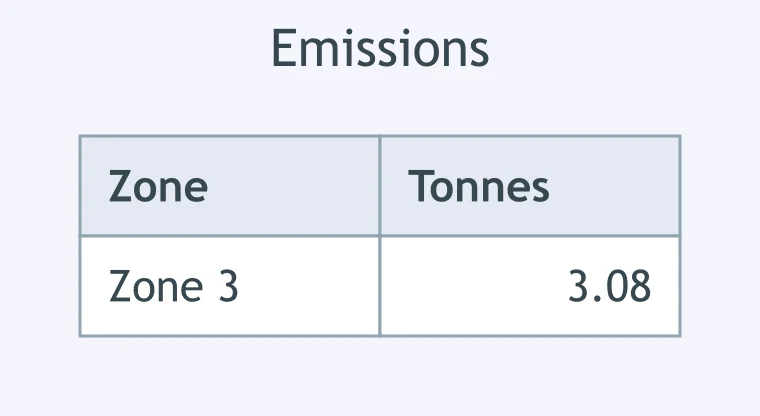
The chart shows emissions in Zone 3. Which wording reports the value well?
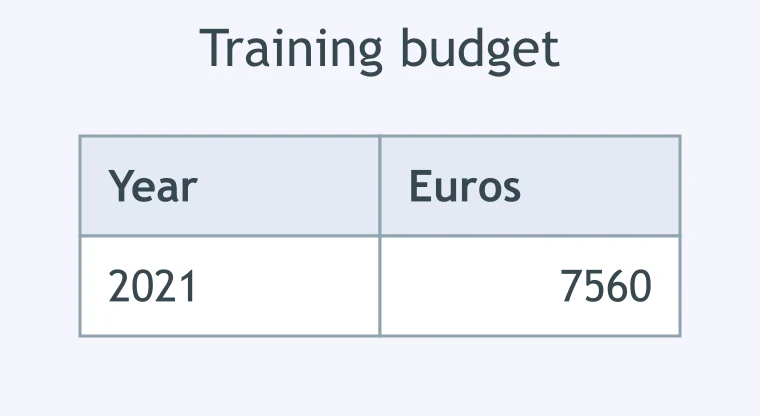
The chart shows the 2021 training budget. Which approximation is defensible?
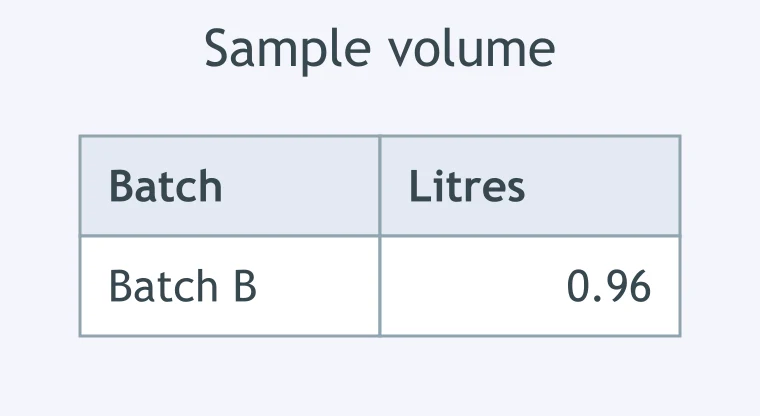
The chart shows the volume of Batch B. Which report is suitably precise?
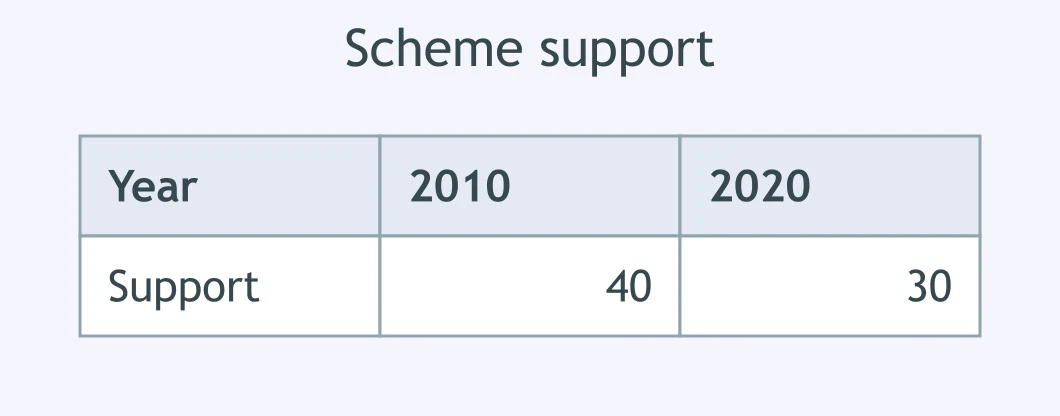
The table shows support for the scheme in 2010 and 2020. Which sentence is correct?
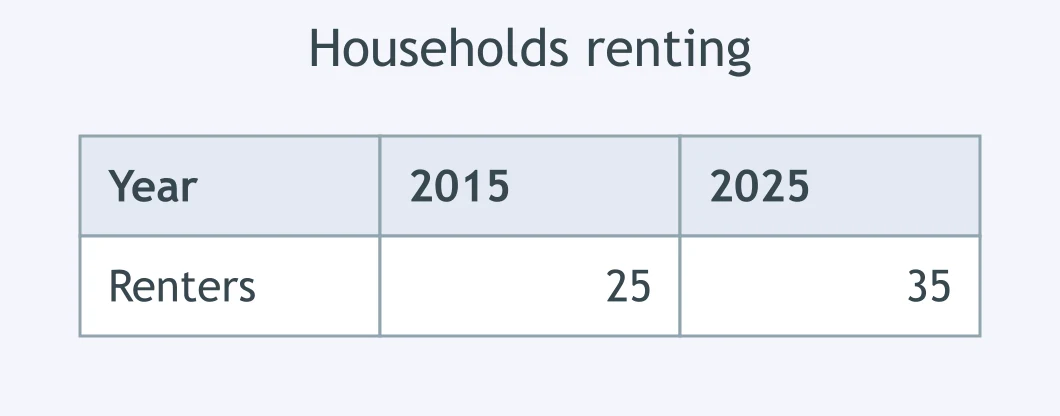
The table shows the share of households renting in 2015 and 2025. Which report is accurate?
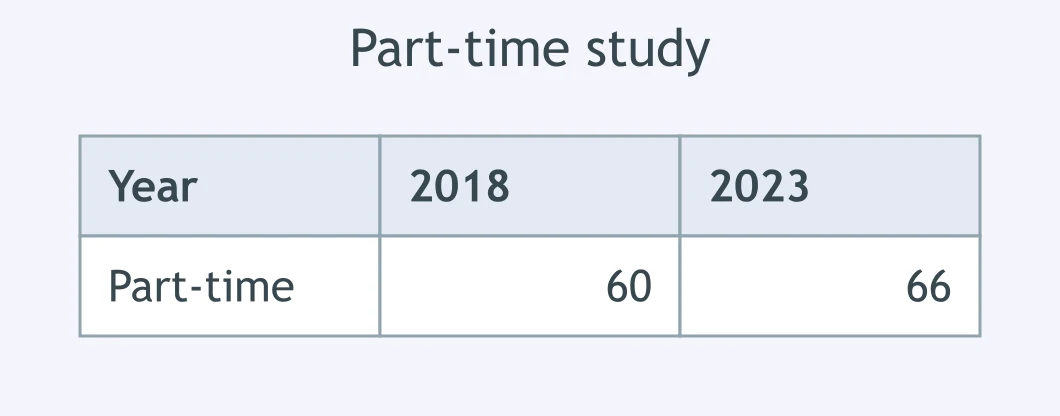
The table shows part-time study in 2018 and 2023. Which wording is correct?
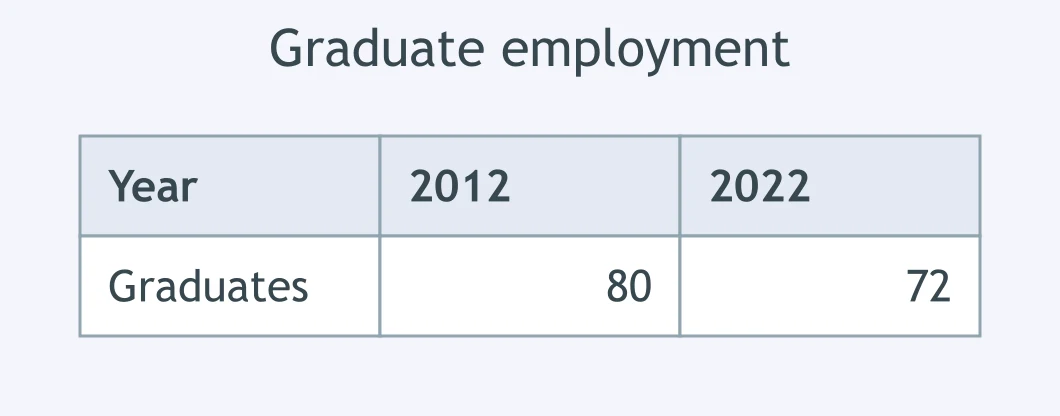
The table shows graduate employment in 2012 and 2022. Which sentence is precise?
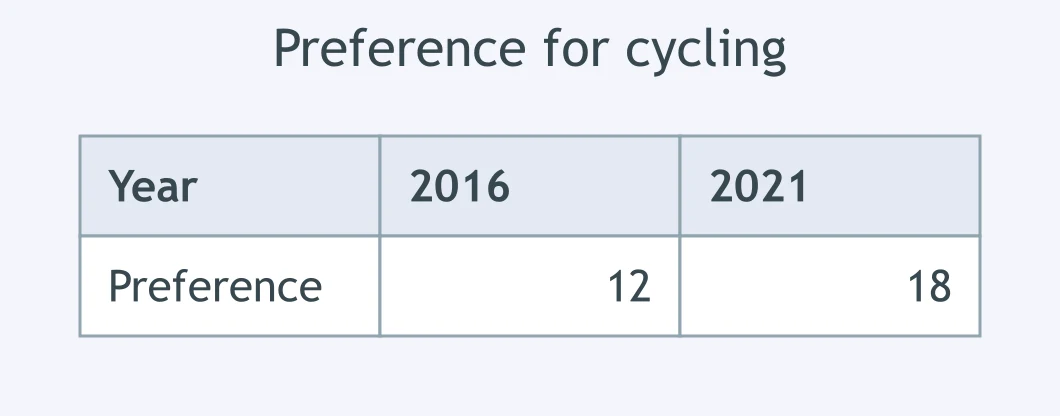
The table shows stated preference for cycling in 2016 and 2021. Which report is correct?
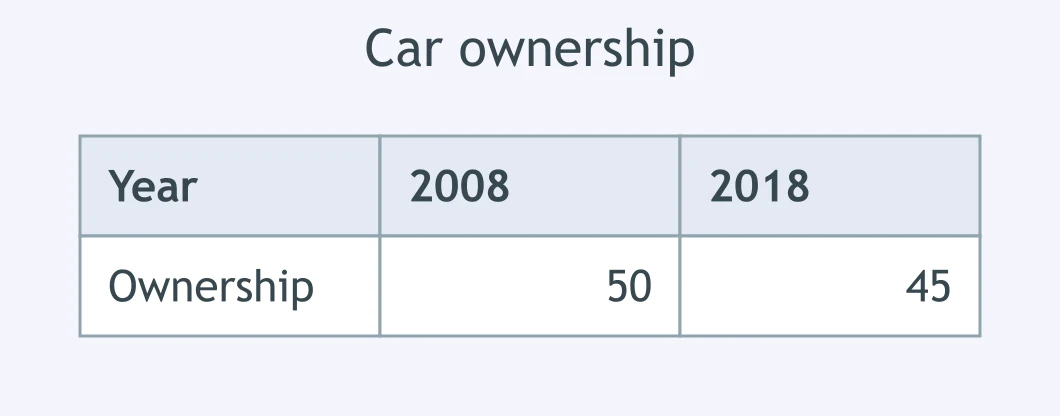
The table shows car ownership in 2008 and 2018. Which statement is accurate?
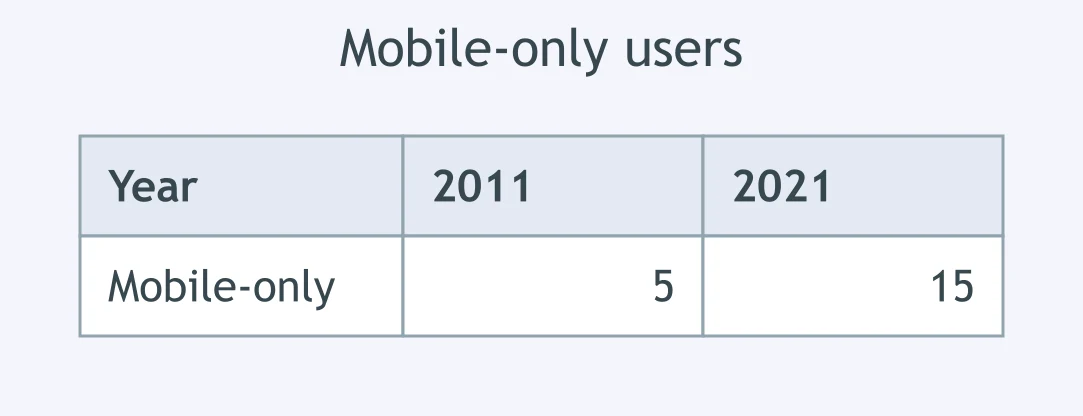
The table shows mobile-only users in 2011 and 2021. Which wording is correct?
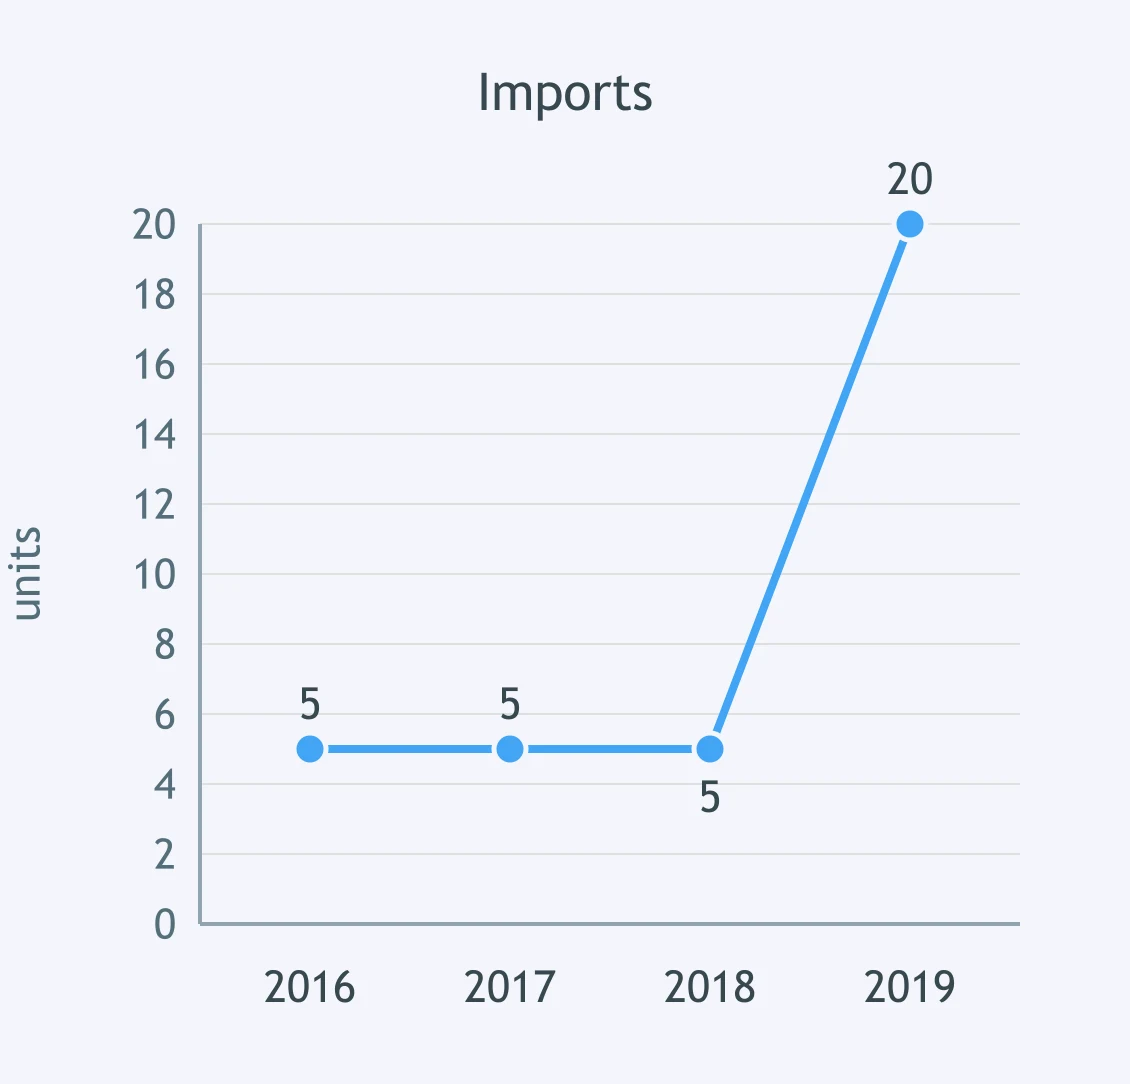
The graph shows imports from 2016 to 2019. Which description fits?
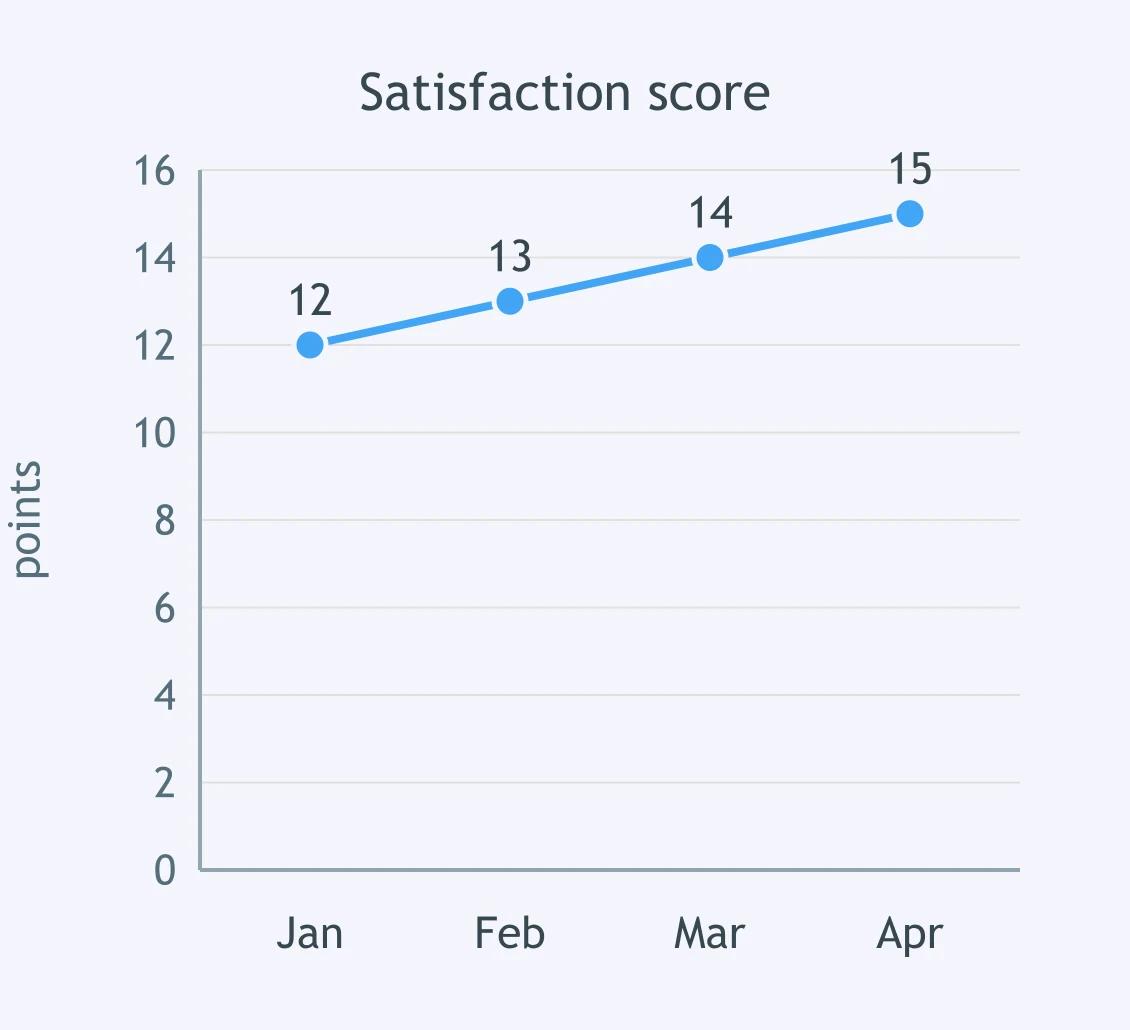
The graph shows a monthly satisfaction score. Which sentence is best?
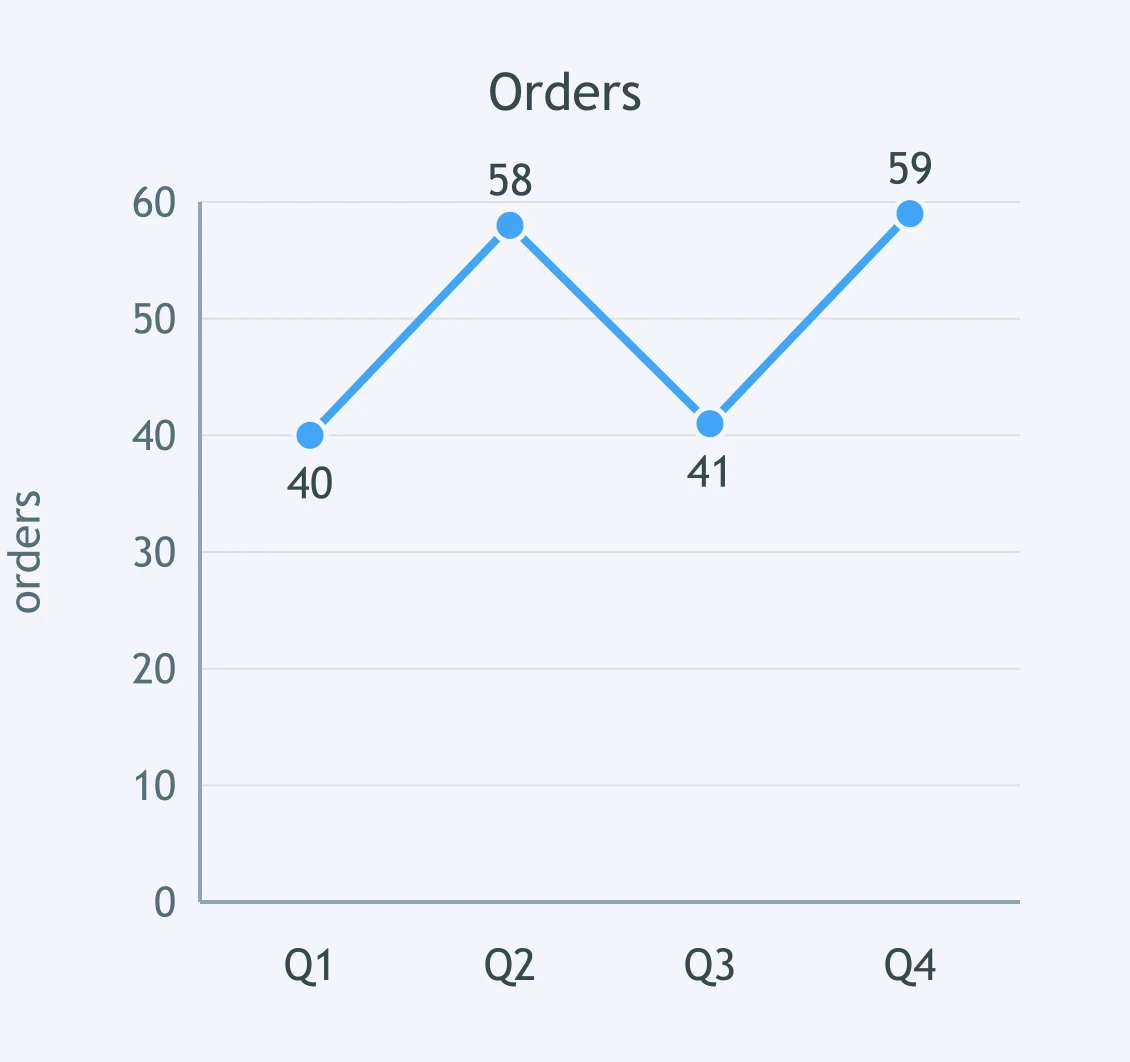
The graph shows quarterly orders. Which report captures the shape?
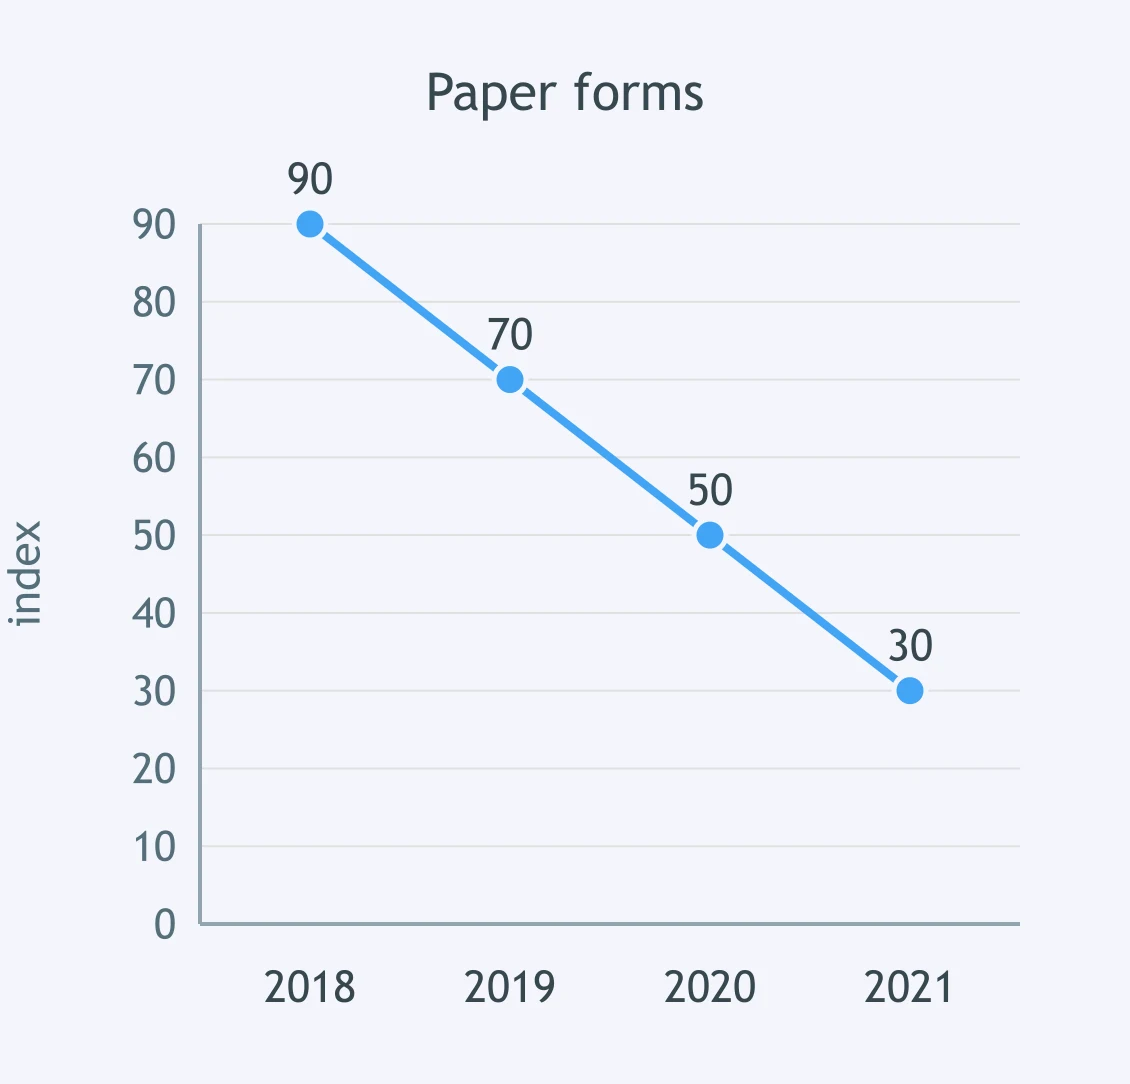
The graph shows an index of paper-form use. Which description is precise?
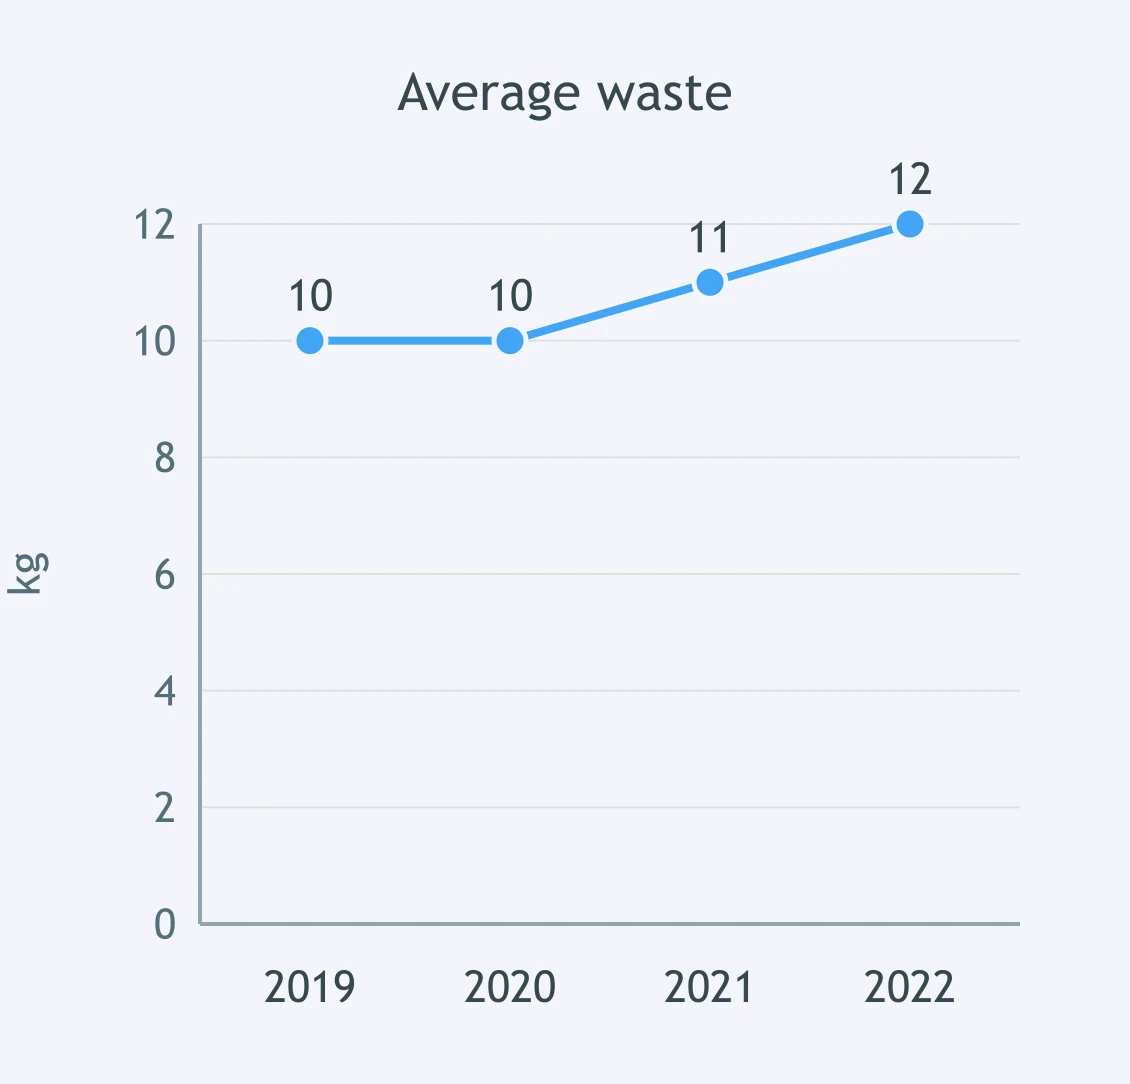
The graph shows average waste per household. Which summary is best?
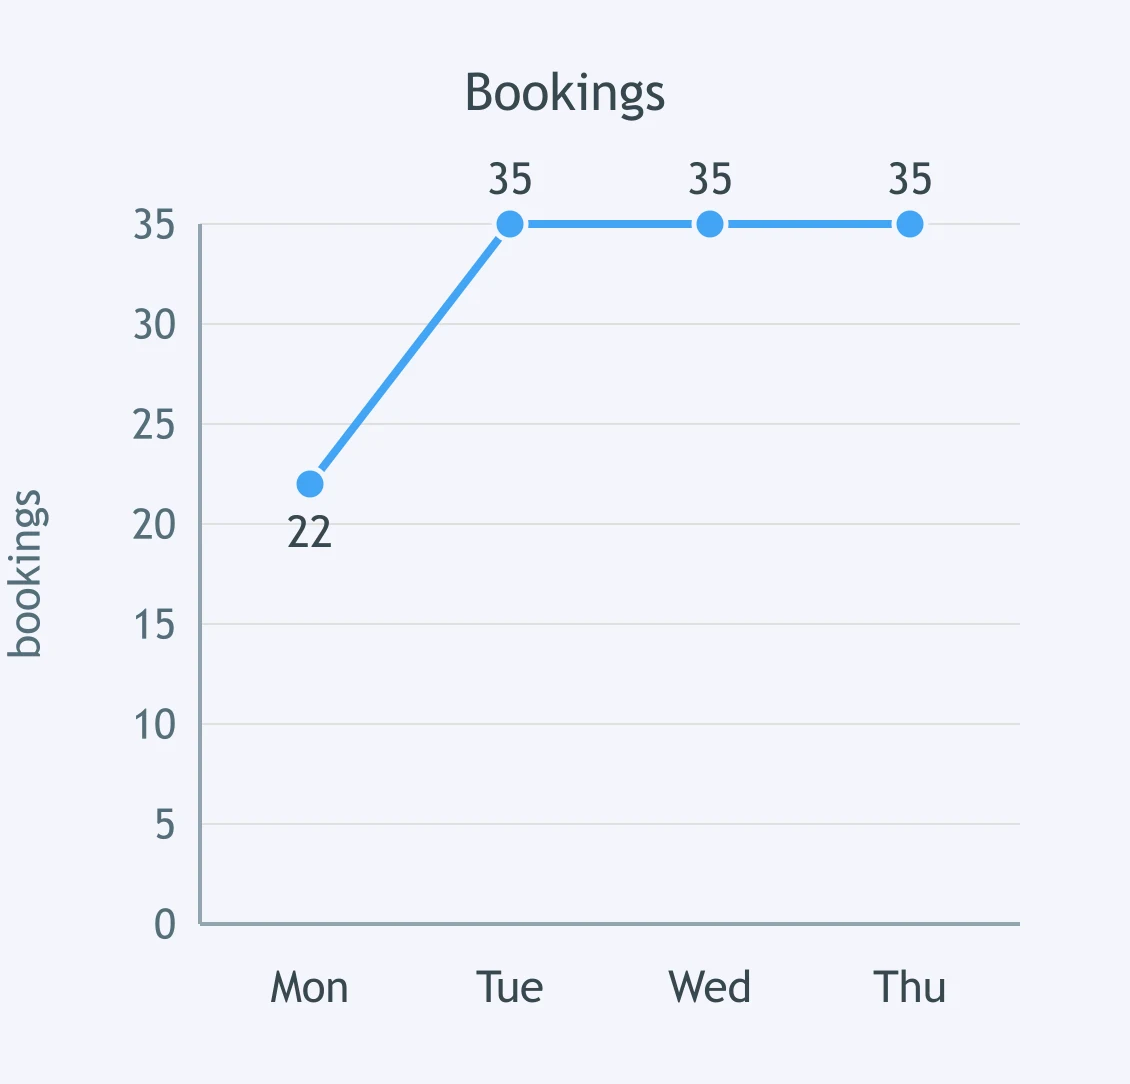
The graph shows daily bookings. Which description is accurate?
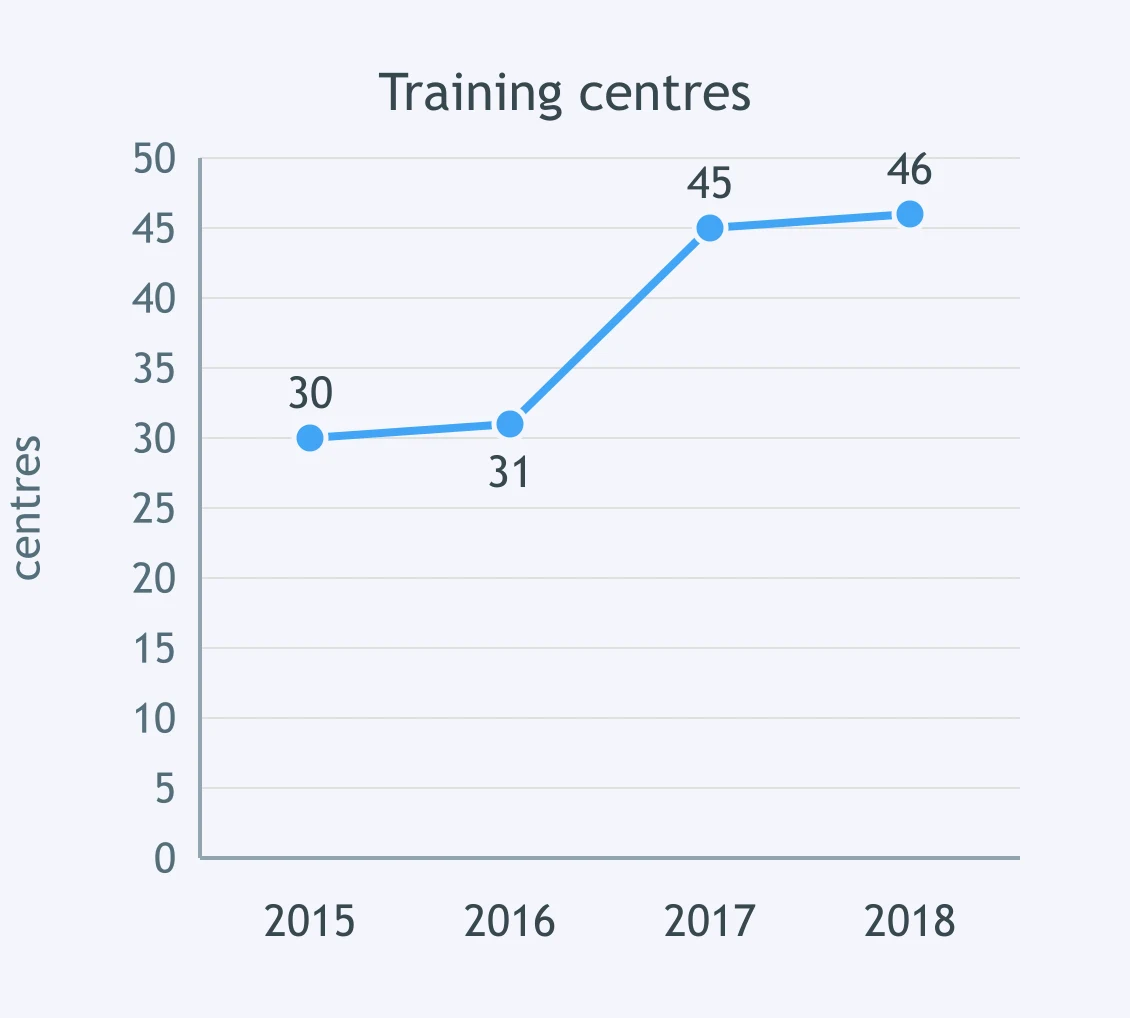
The graph shows the number of training centres. Which wording best describes the trend?

Selecting Key Features: What to Leave Out - IELTS 7.0 W T1
25 questions

Precise Comparison and Complex Data Relations - IELTS 7.0 W T1
30 questions
Overview Quality: Adequate versus Strong - IELTS 7.0 W T1
25 questions

Complex and Multiple-chart Tasks - IELTS 7.0 W T1
25 questions
Nuanced Position: Beyond Agree and Disagree - IELTS 7.0 W T2
25 questions
Crack the passcode before the zombies get in.

Pick a tile, answer, hit bonuses and steals.