Loading
by BlastRoom
Practise selecting report-worthy Task 1 features and omitting minor detail.
#writing_task_1#ielts_7_0

25 questions
One question set, multiple game modes. Tap any game to see it in action. Not sure which to pick?
Answer to place stones and capture territory.
Outrun the snow together.
Earn blasts, then hunt the other team.
Answer to earn energy, then climb.

The class blasts through walls together.
Bid on mystery lots. Most money wins.
Sell tours. Nice, standard, or a total scam.

Answer, restock, and serve the rush.
More correct answers pulls the rope your way.
Answer, then shoot down the alien wave.
Answer, then tap to leap the frozen ridge.
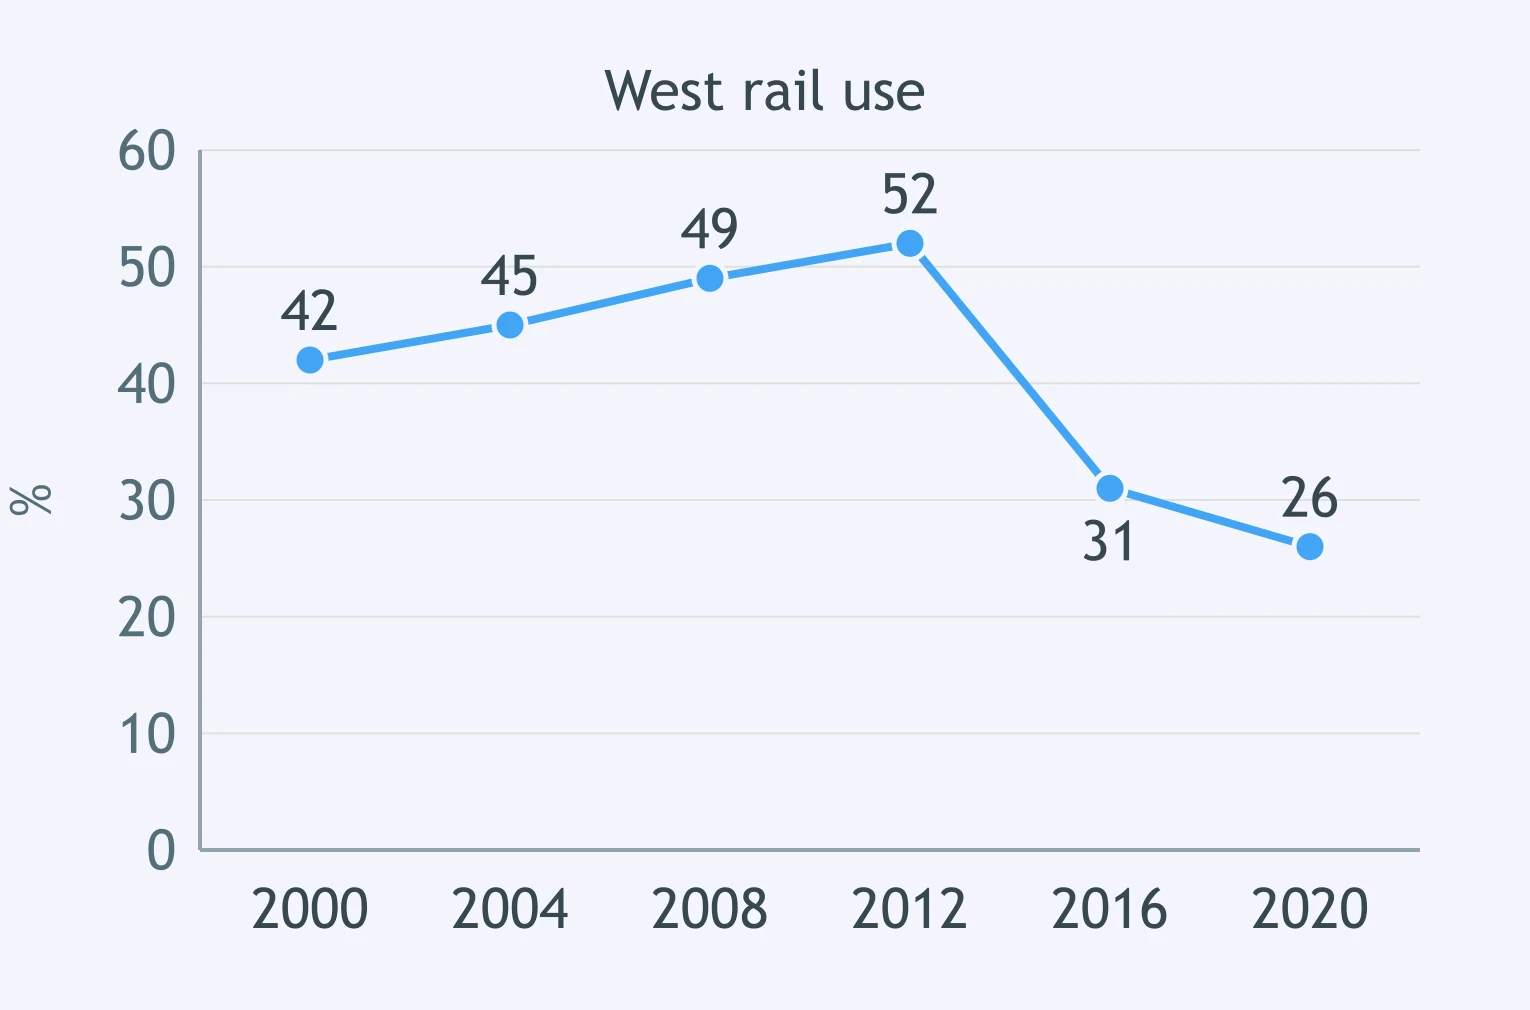
The line graph shows West rail use from 2000 to 2020, rising steadily until 2012, then dropping sharply. Which feature most deserves a place in the report?
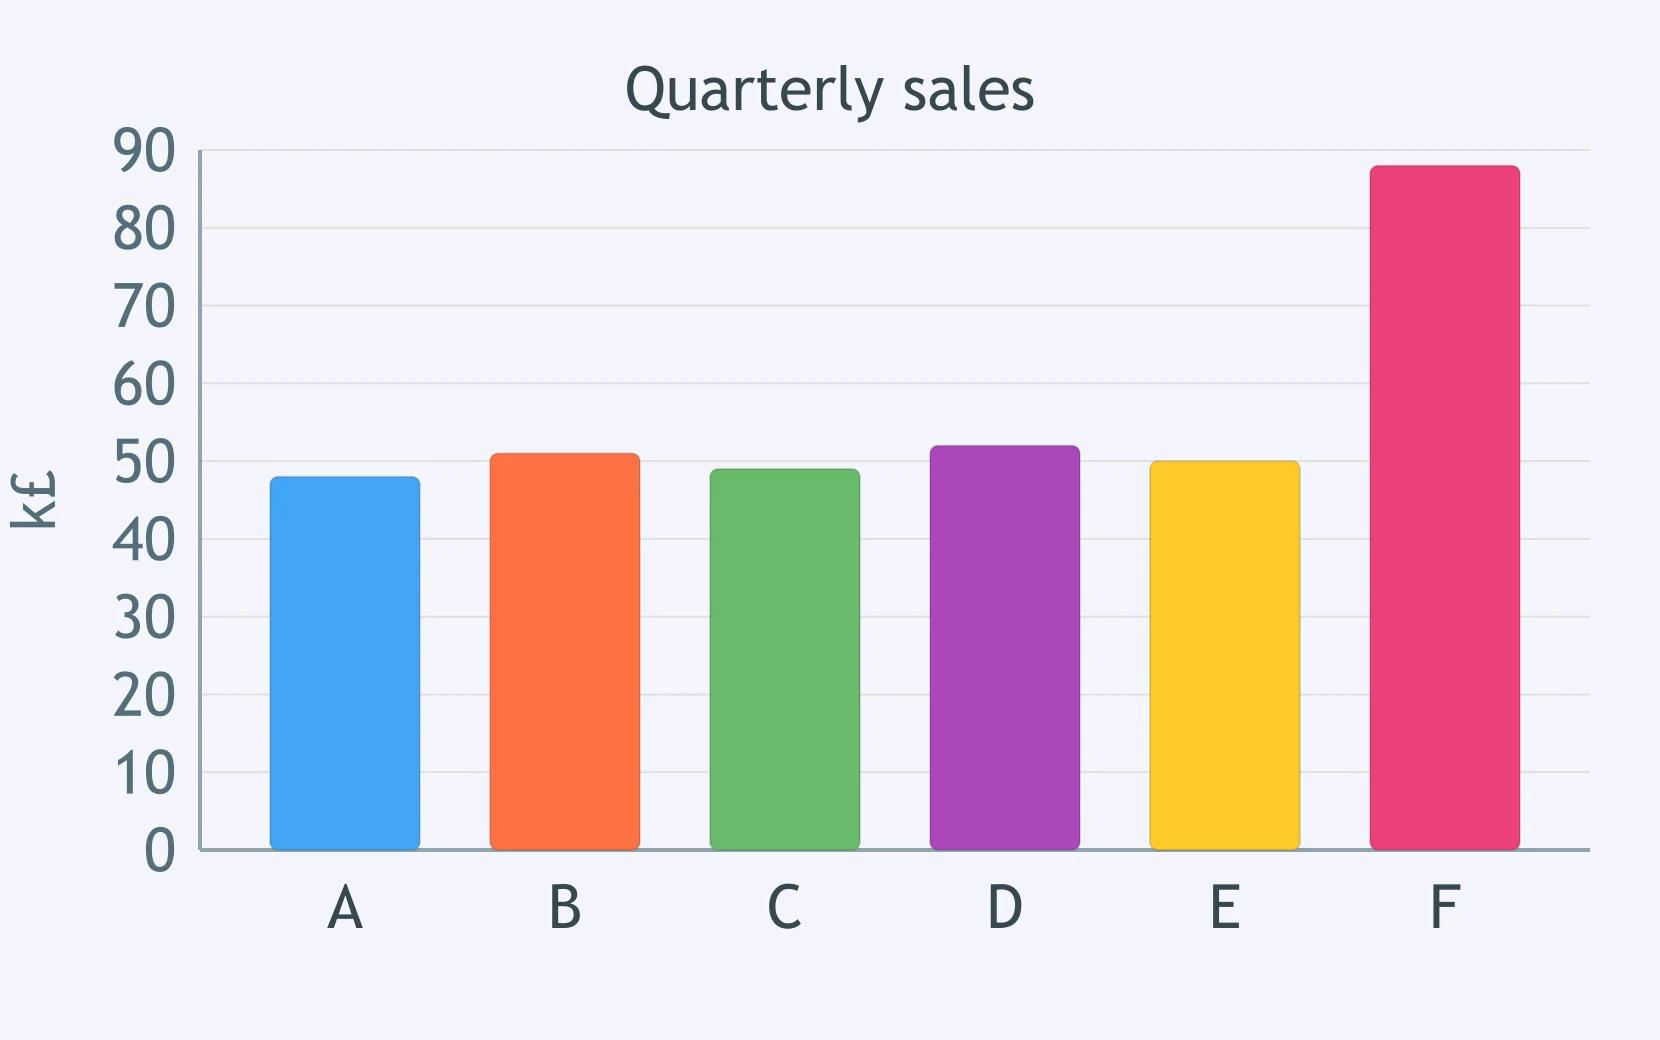
The bar chart compares six branches: five make similar quarterly sales, but Branch F is much higher. Which feature belongs in the overview?
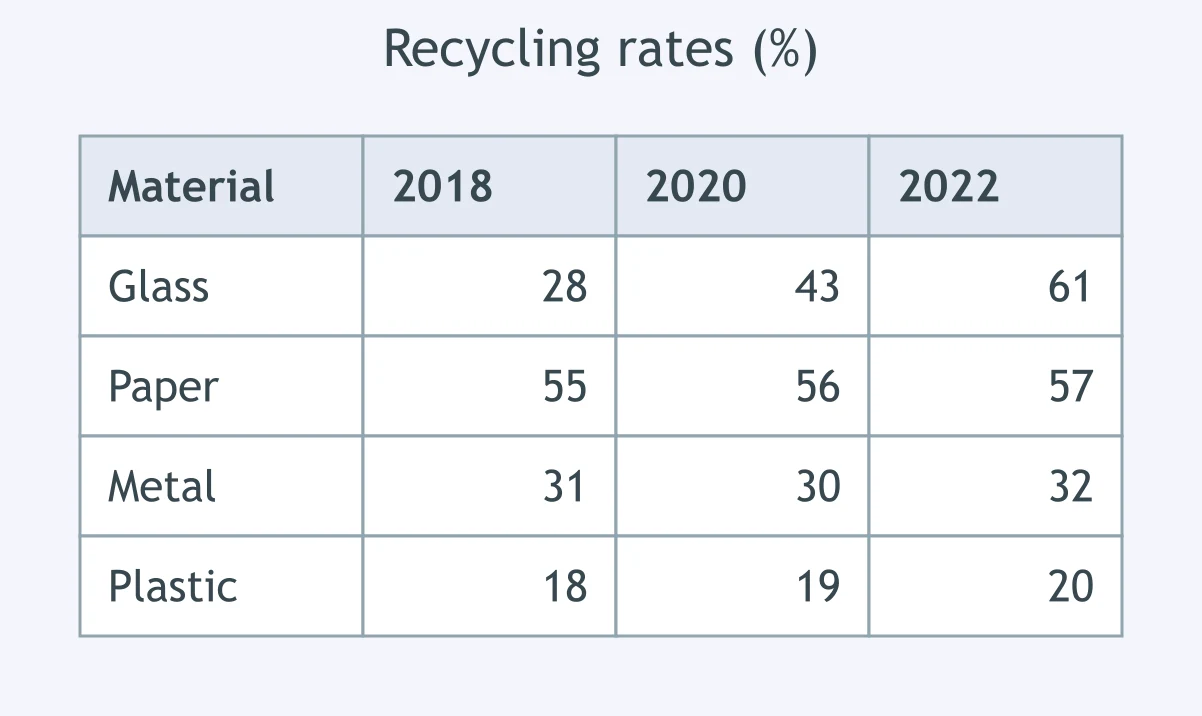
The table shows recycling in four materials across three years: glass rises strongly, while the other materials remain almost unchanged. What should be selected?
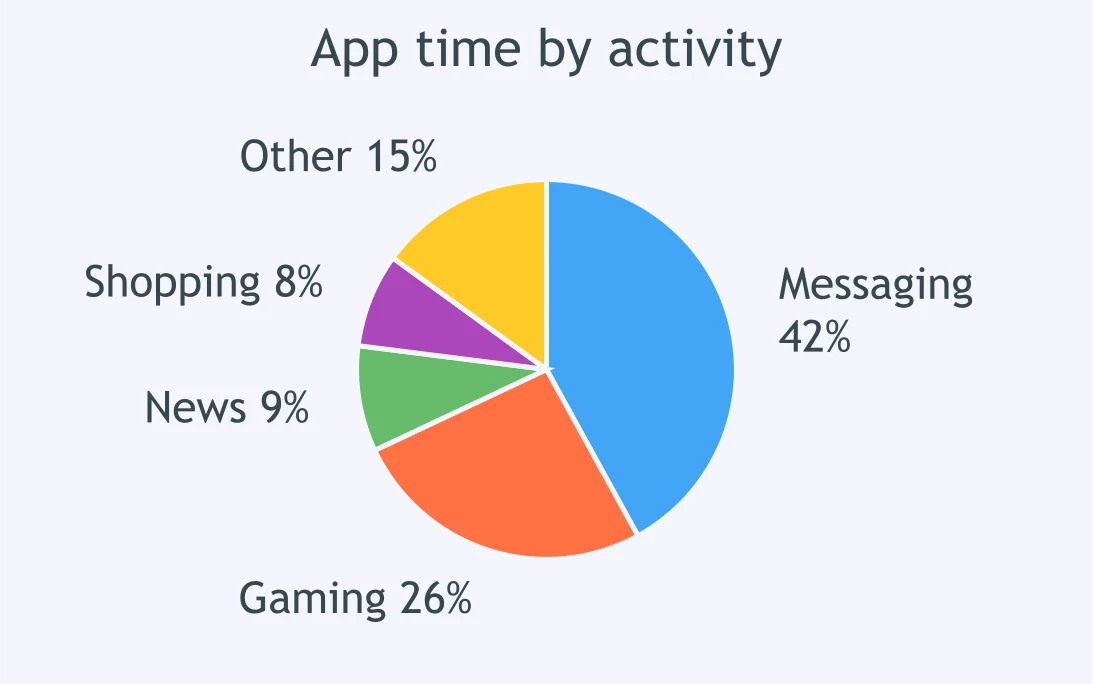
The pie chart shows app time: messaging takes the largest share, gaming is second, and the remaining uses are small. Which point is worth reporting?
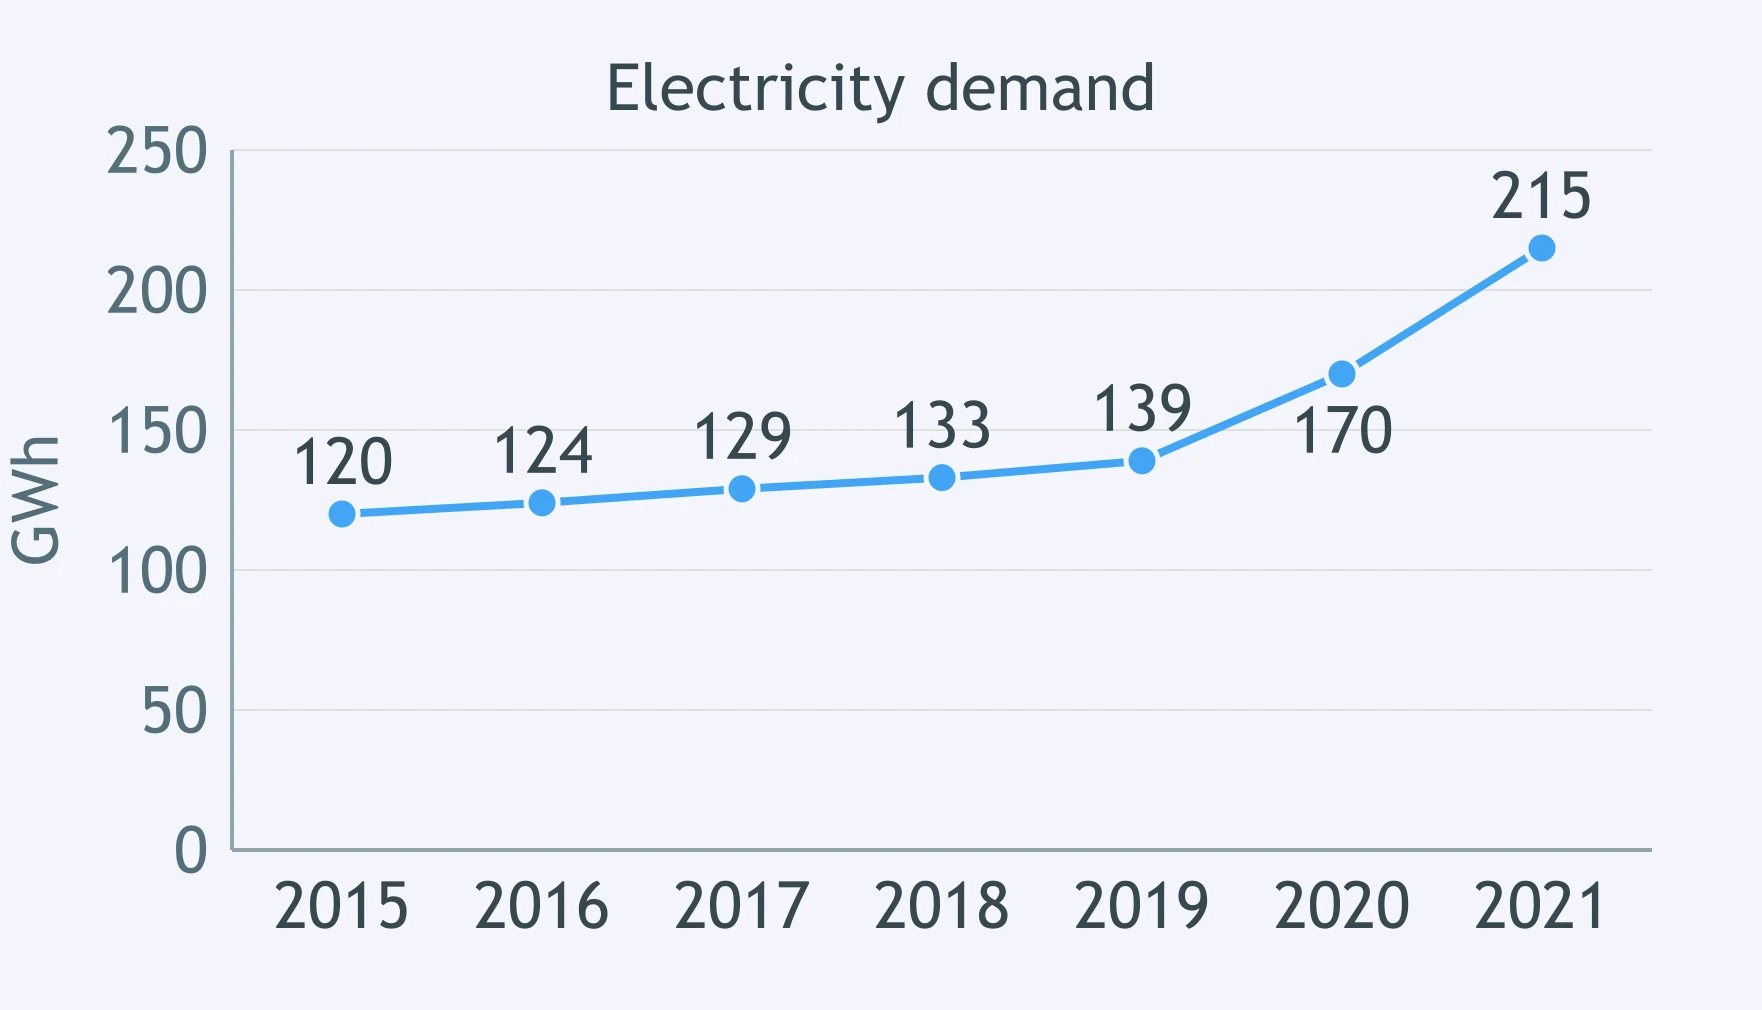
The line graph shows electricity demand: demand climbs slowly for years, then surges at the end. Which feature should the report include?
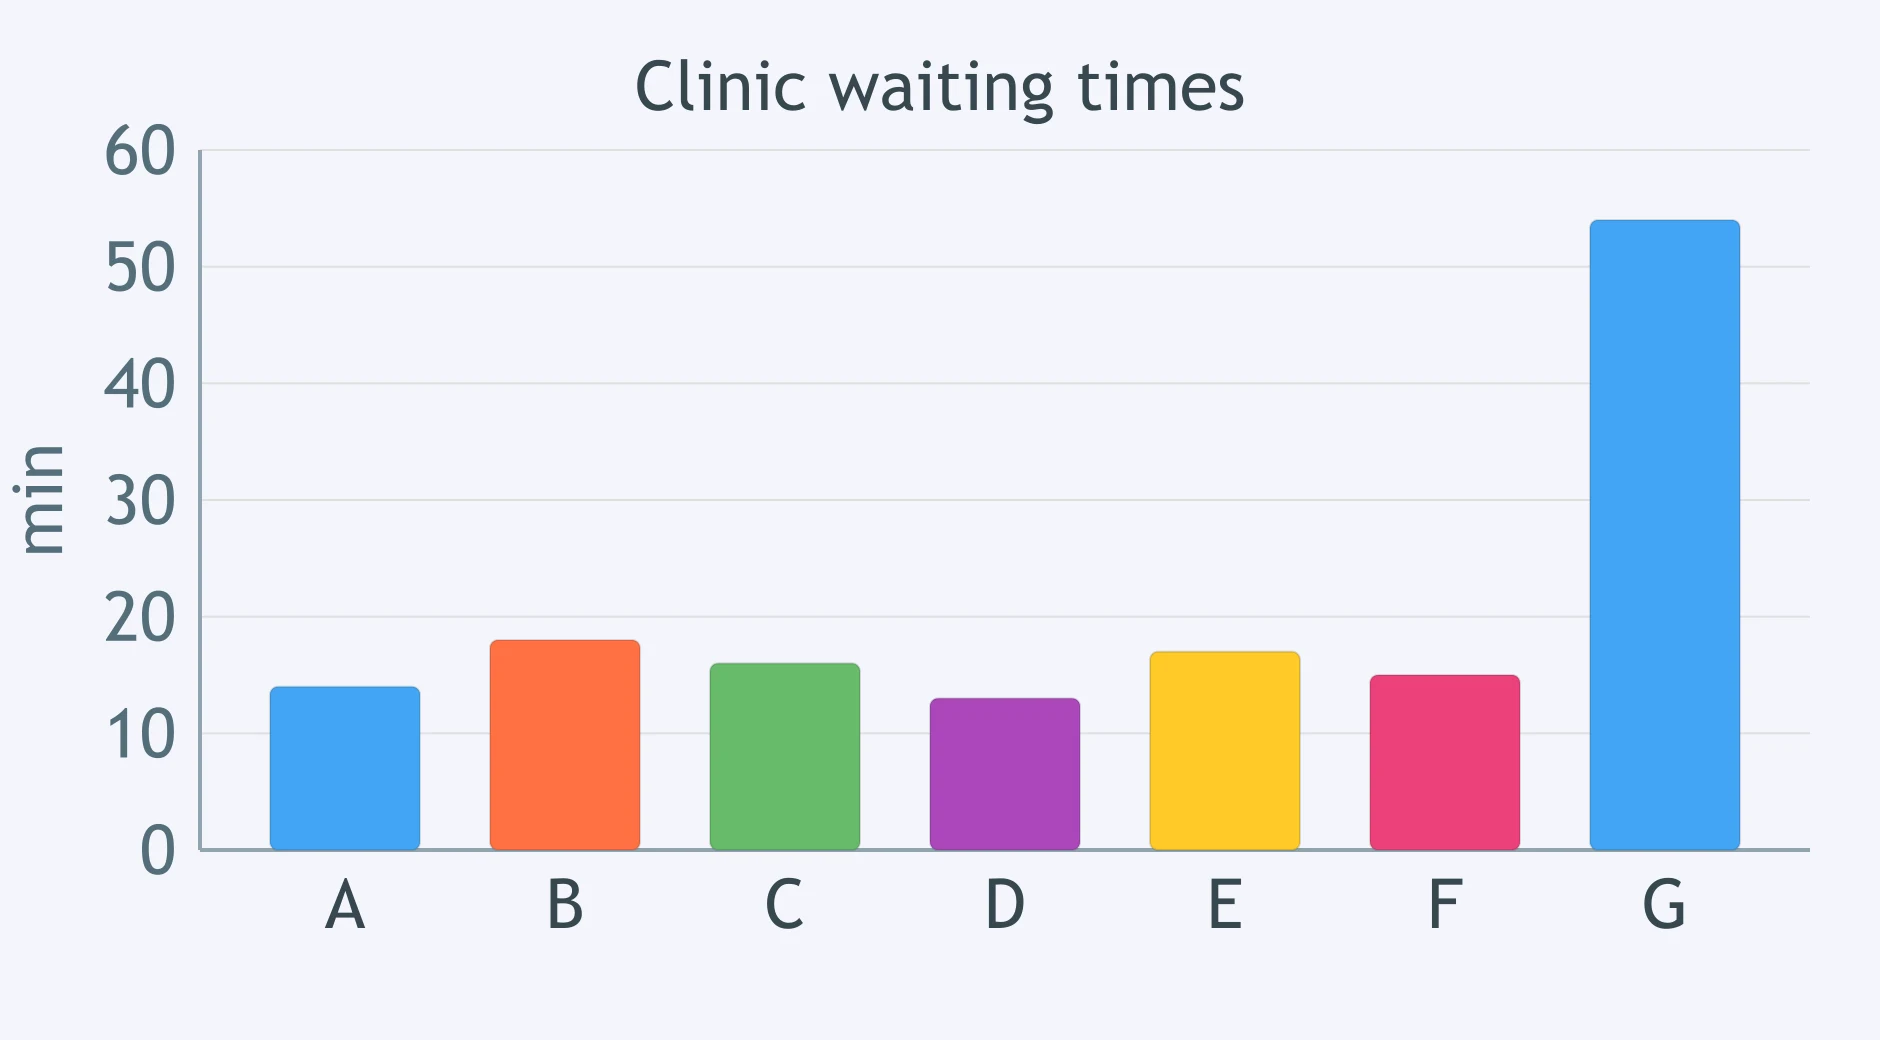
The bar chart compares waiting times at seven clinics: six are under 20 minutes, but one is over 50. Which feature earns space in the report?
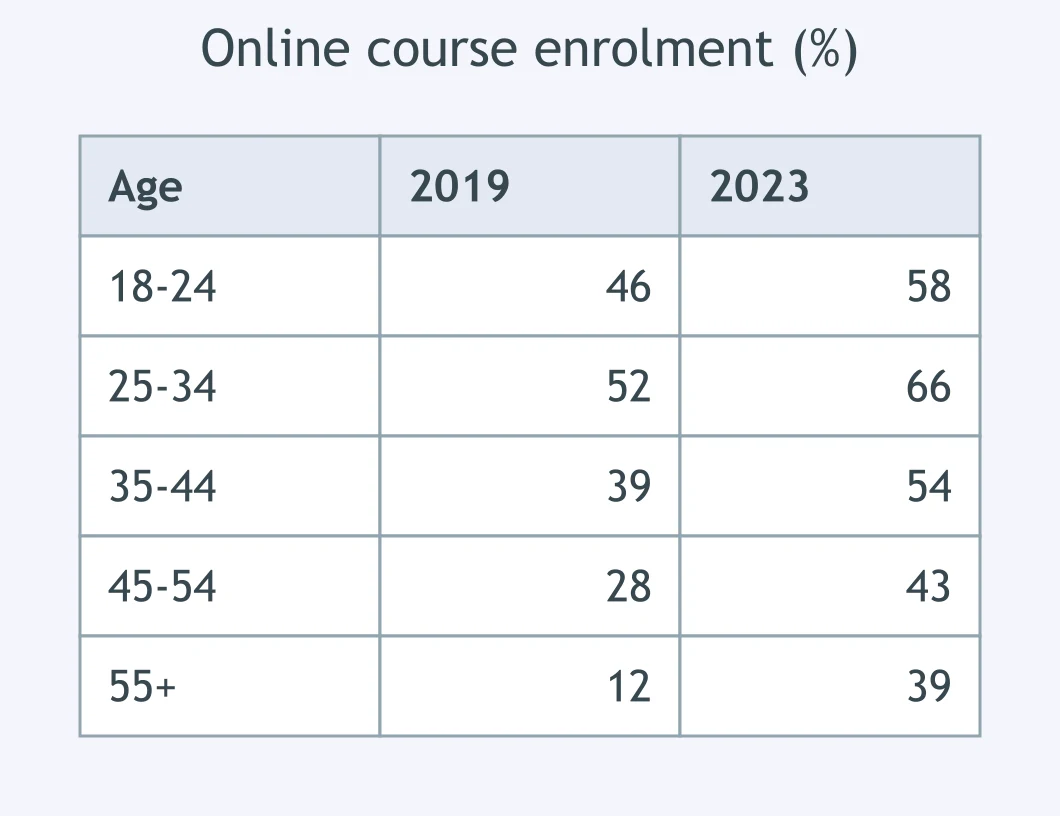
The table compares online enrolment by age group in 2019 and 2023: every group rises, but over-55s more than triple. What deserves mention?
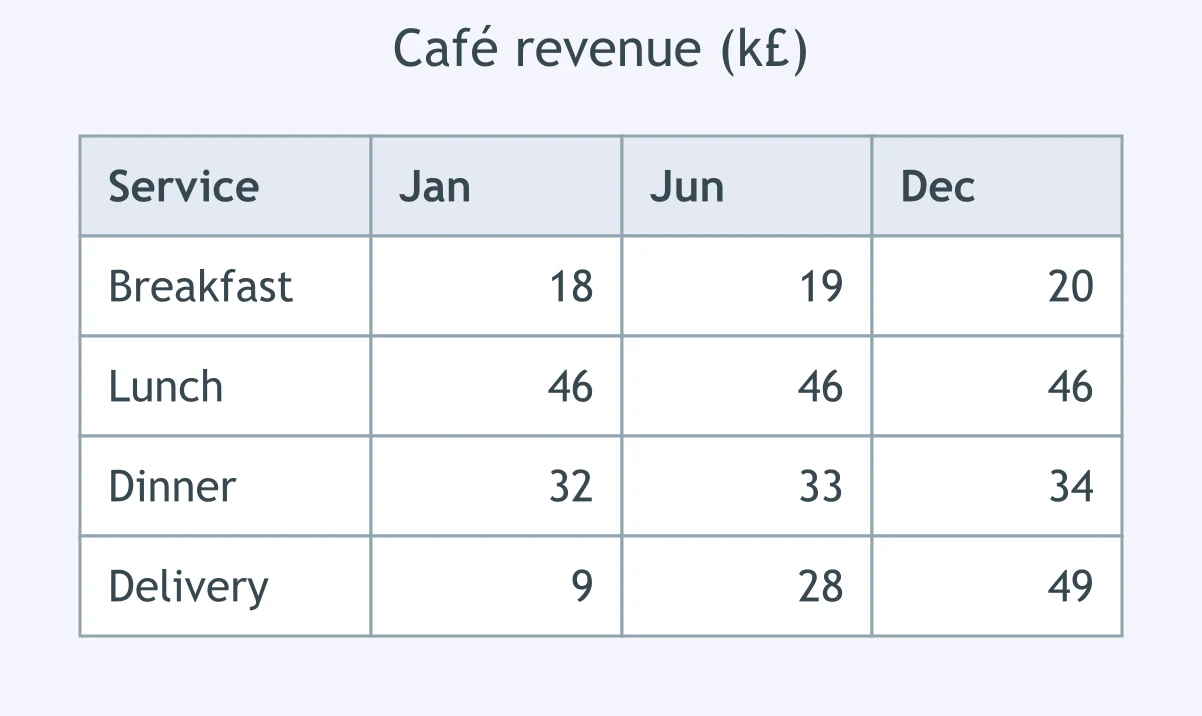
The table shows café revenue at three points in the year: lunch is stable, while delivery rises from a small to the largest source. Which detail should be left out of the summary?
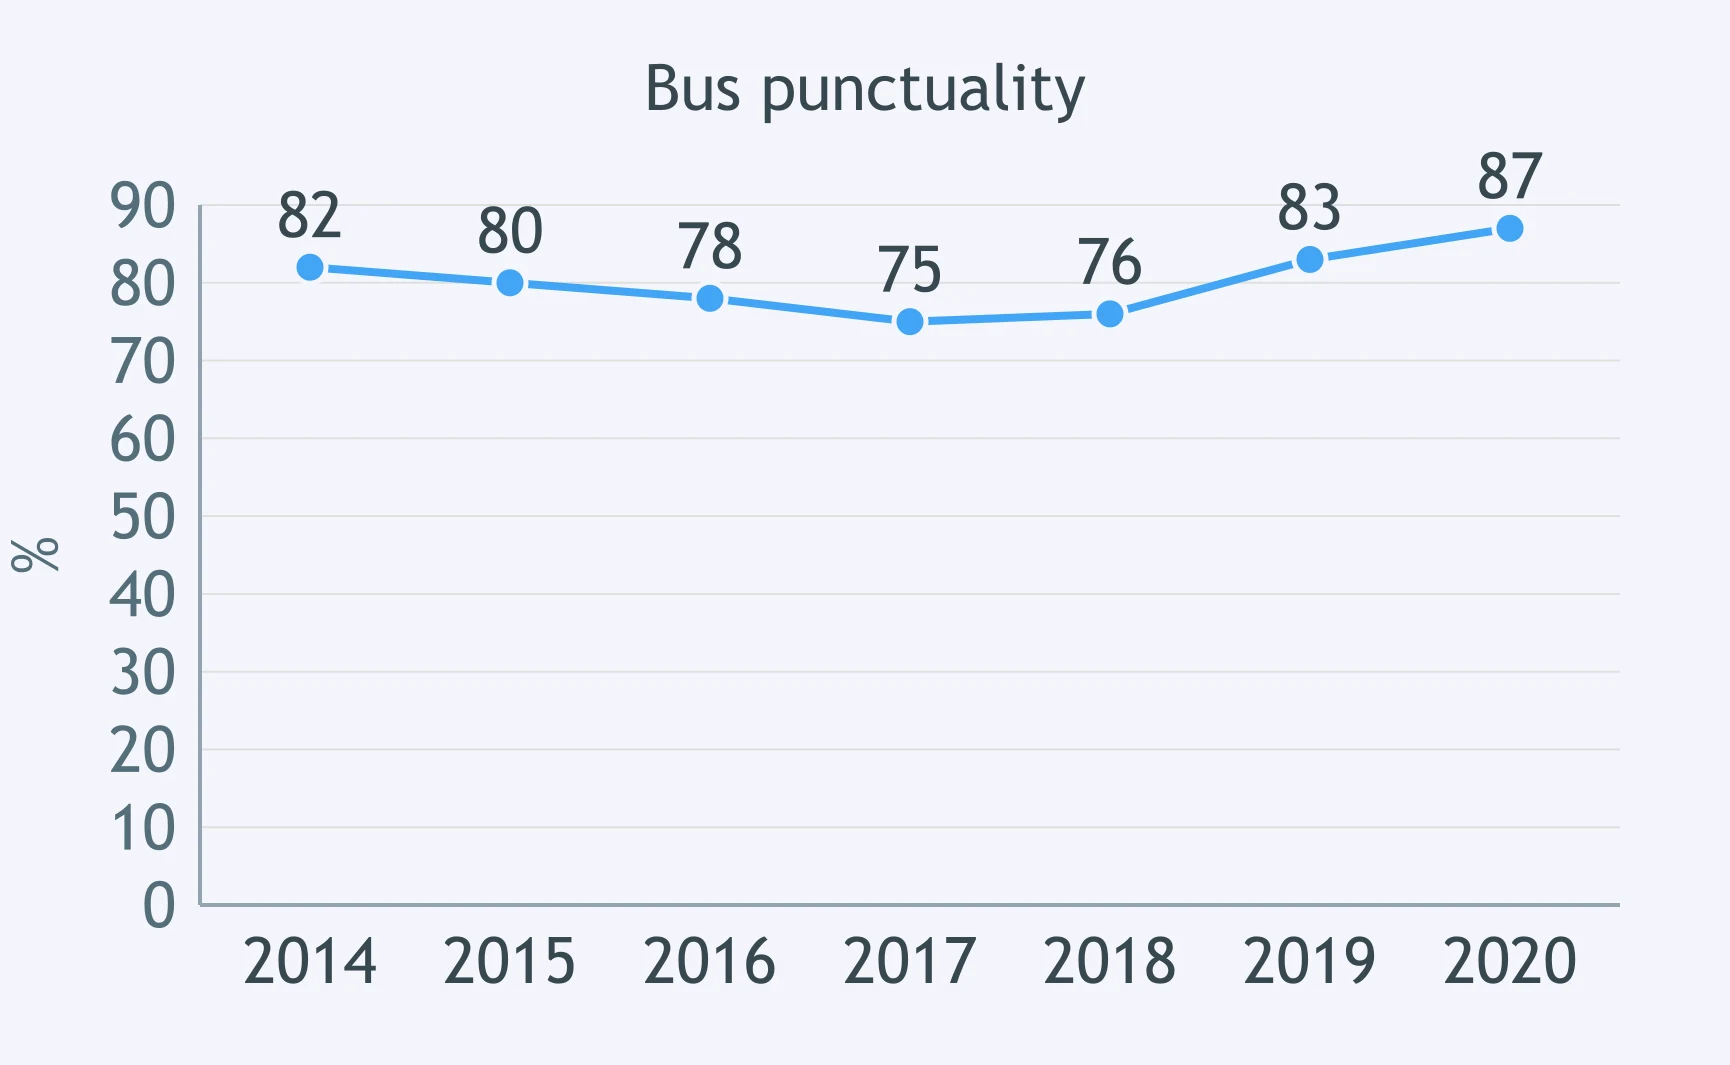
The line graph shows bus punctuality falling slightly until 2017, then recovering above its starting level. What belongs outside an overview?
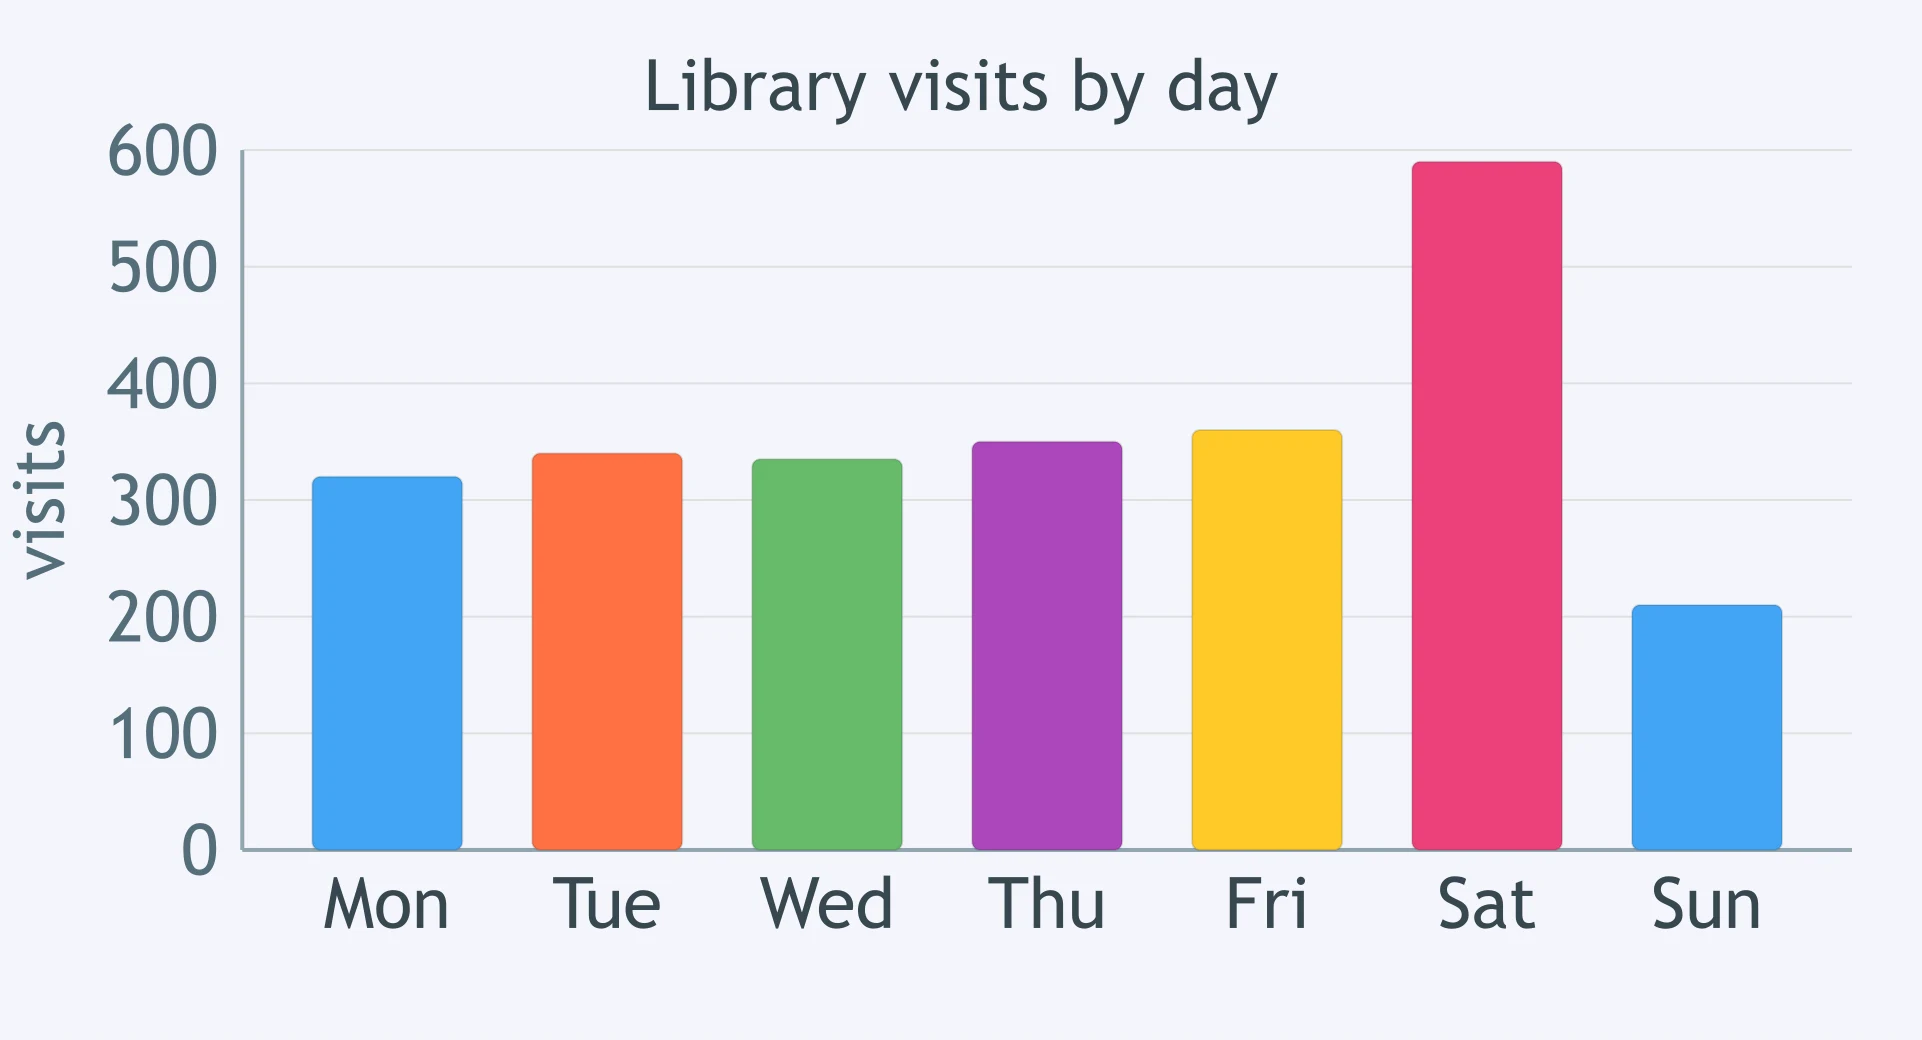
The bar chart compares library visits by day: Saturday is highest and Sunday is lowest. Which choice is least suitable for a summary?
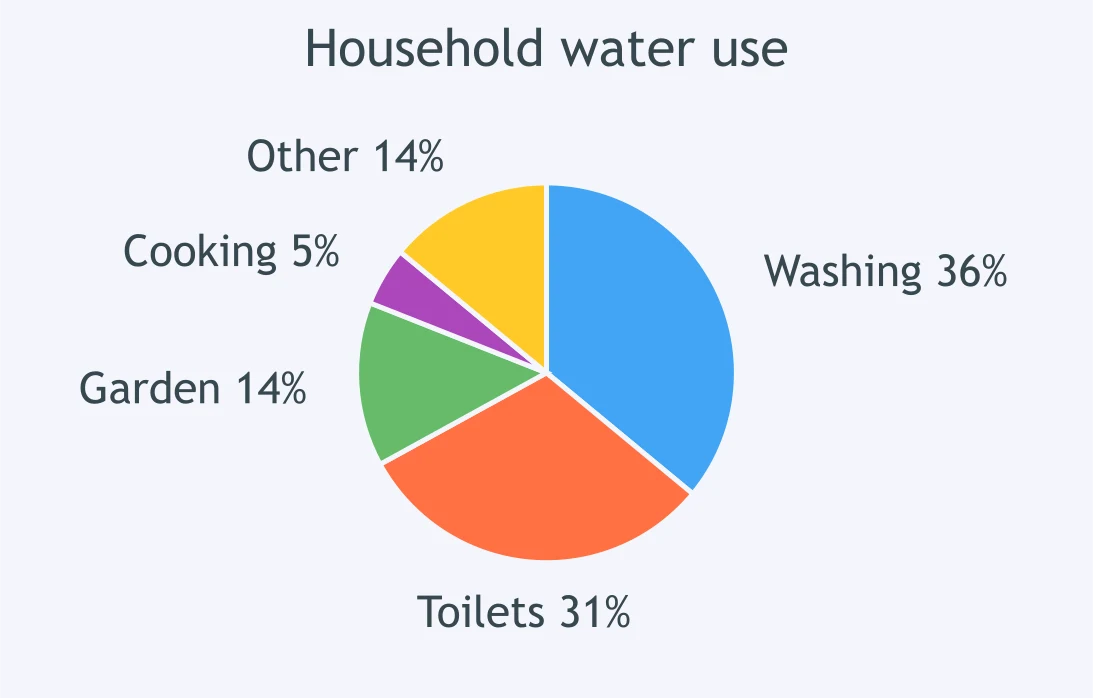
The pie chart shows household water use: washing and toilets dominate, while cooking is tiny. Which detail should be excluded from the summary?
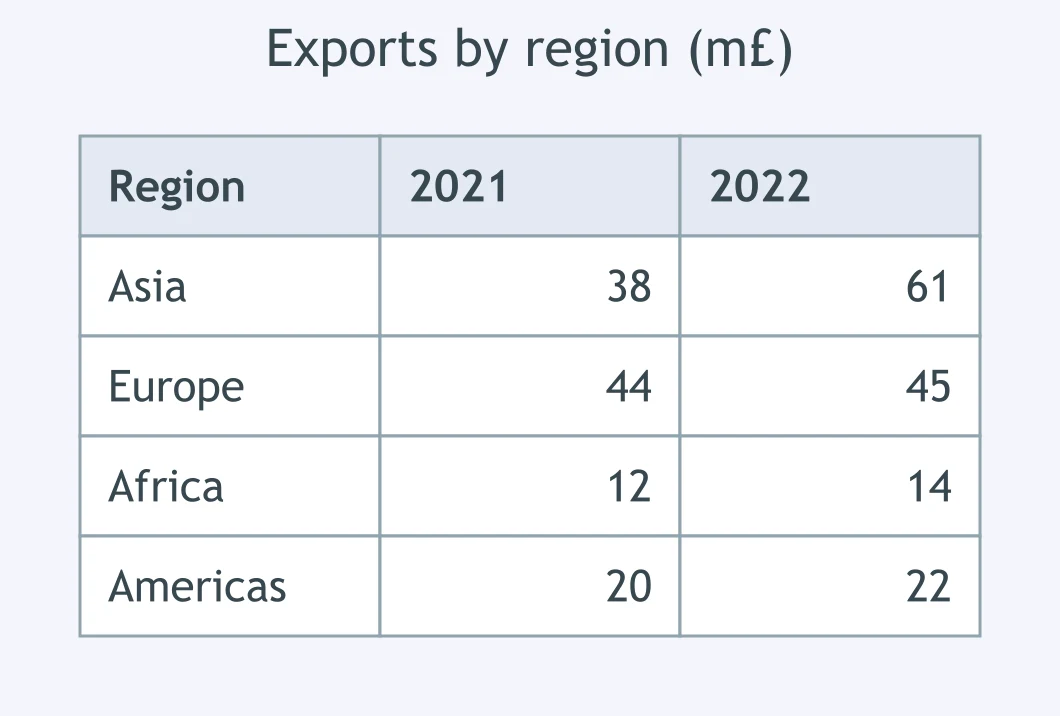
The table compares exports to four regions over two years: Asia rises strongly, Europe is almost unchanged, and the others move slightly. What should be left out?
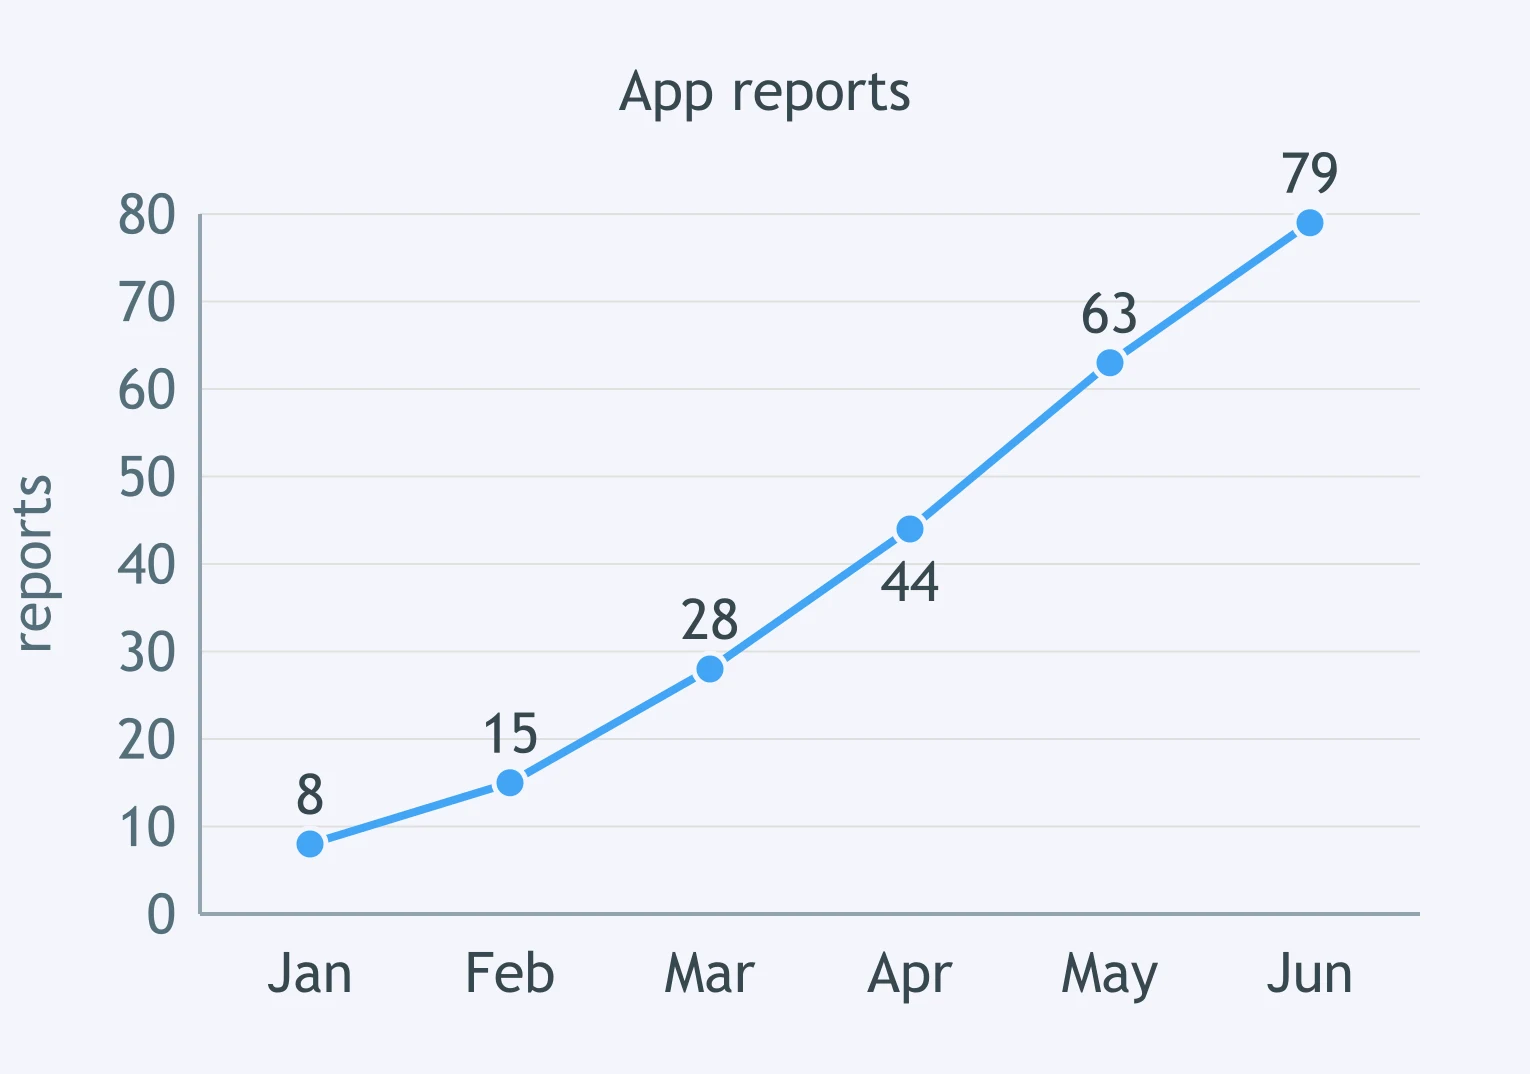
The line graph shows app reports of complaints rising sharply from January to June. Which detail should not appear in a summary?
The pie chart divides tourism spending into nine categories; five slices are each below 5%. How should those small slices be handled?
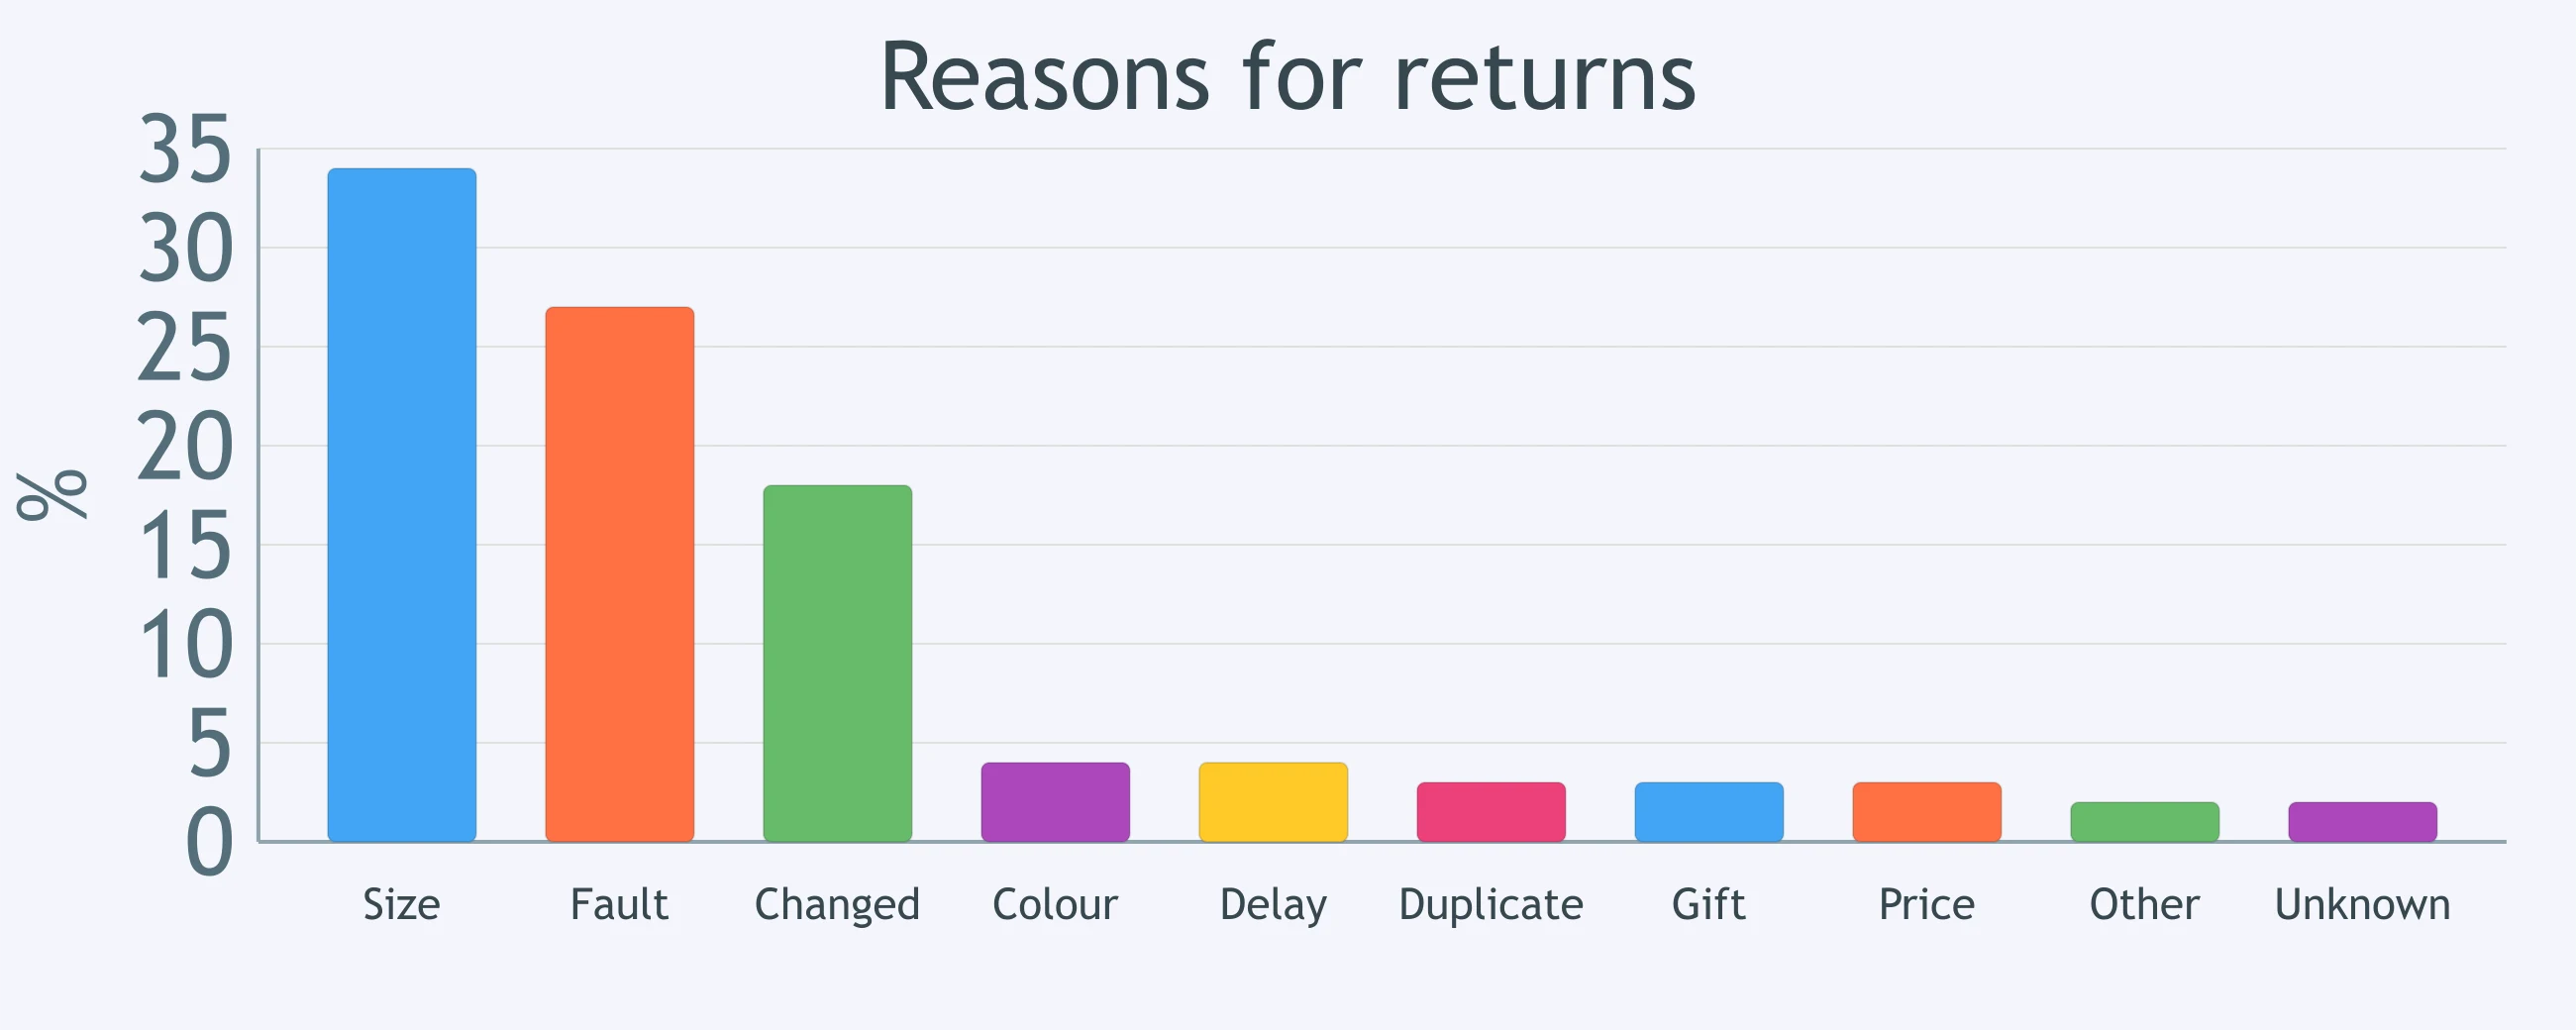
The bar chart shows ten product returns; three reasons account for most returns and the remaining seven are minor. What is the best reporting strategy?
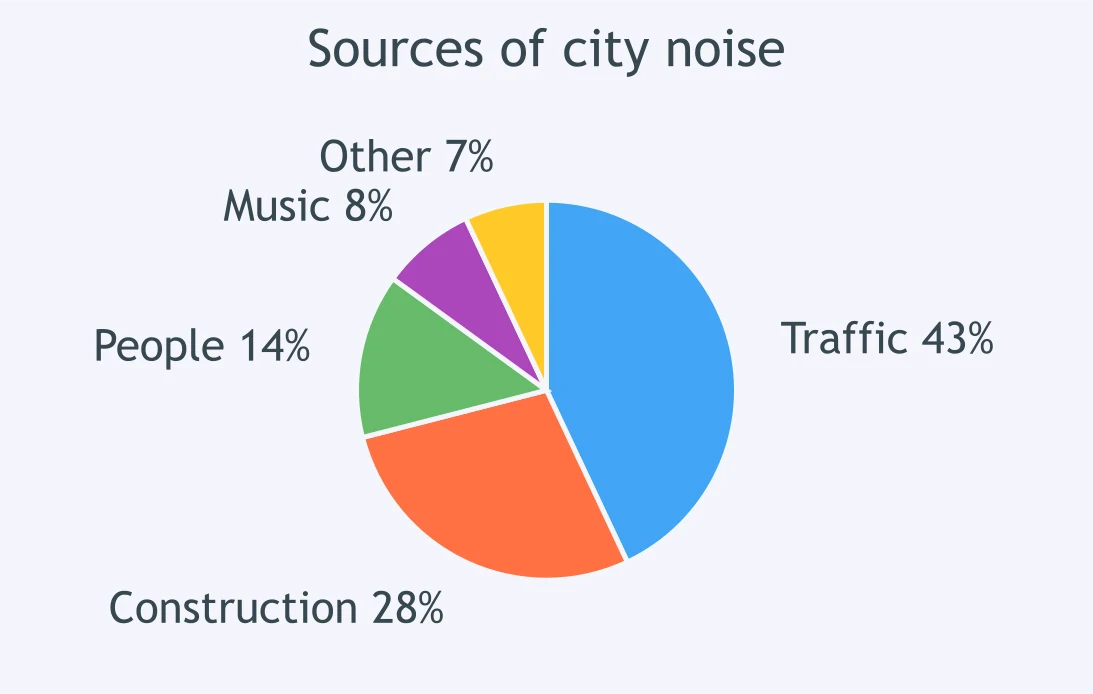
The pie chart shows five sources of city noise; traffic and construction dominate, while the three remaining sources are each under 15%. What should the writer do with the tail?
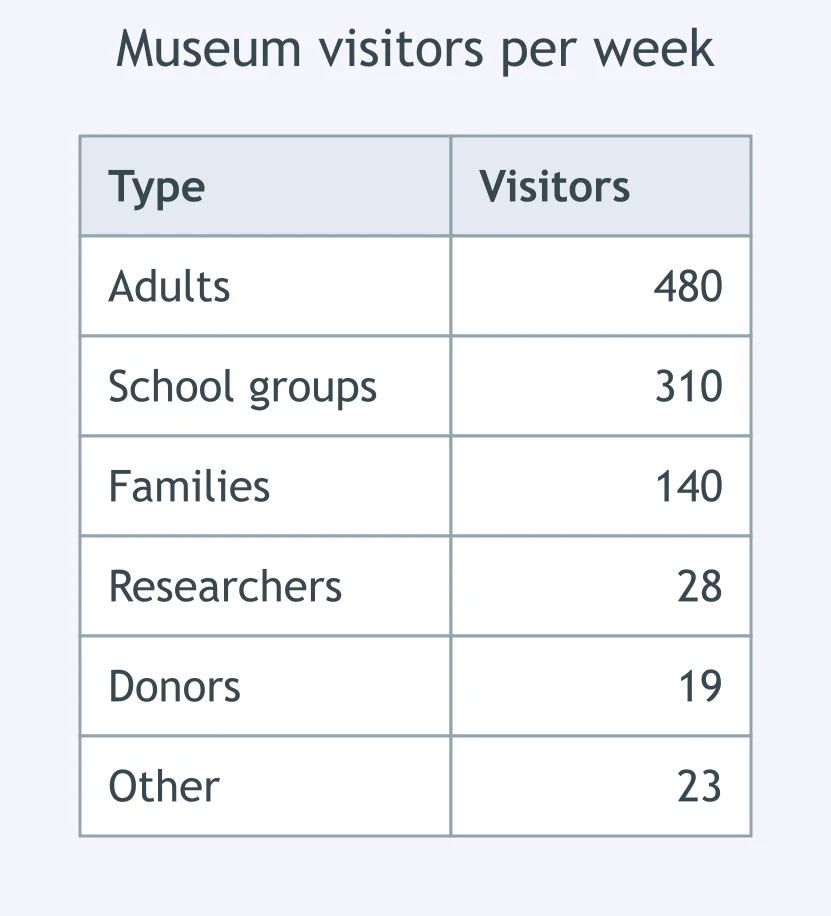
The table gives six types of museum visitor; adults and school groups dominate, while three types are tiny. How should the small groups be reported?
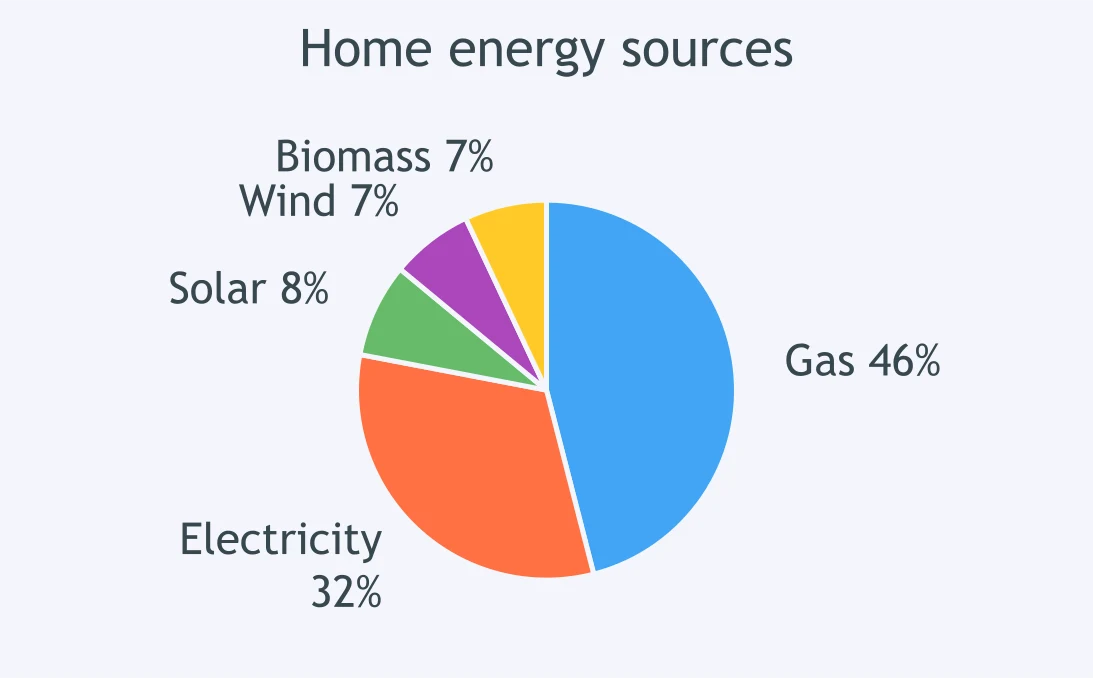
The pie chart shows energy sources: gas and electricity form most use; three renewable sources are small individually. Which plan is best?
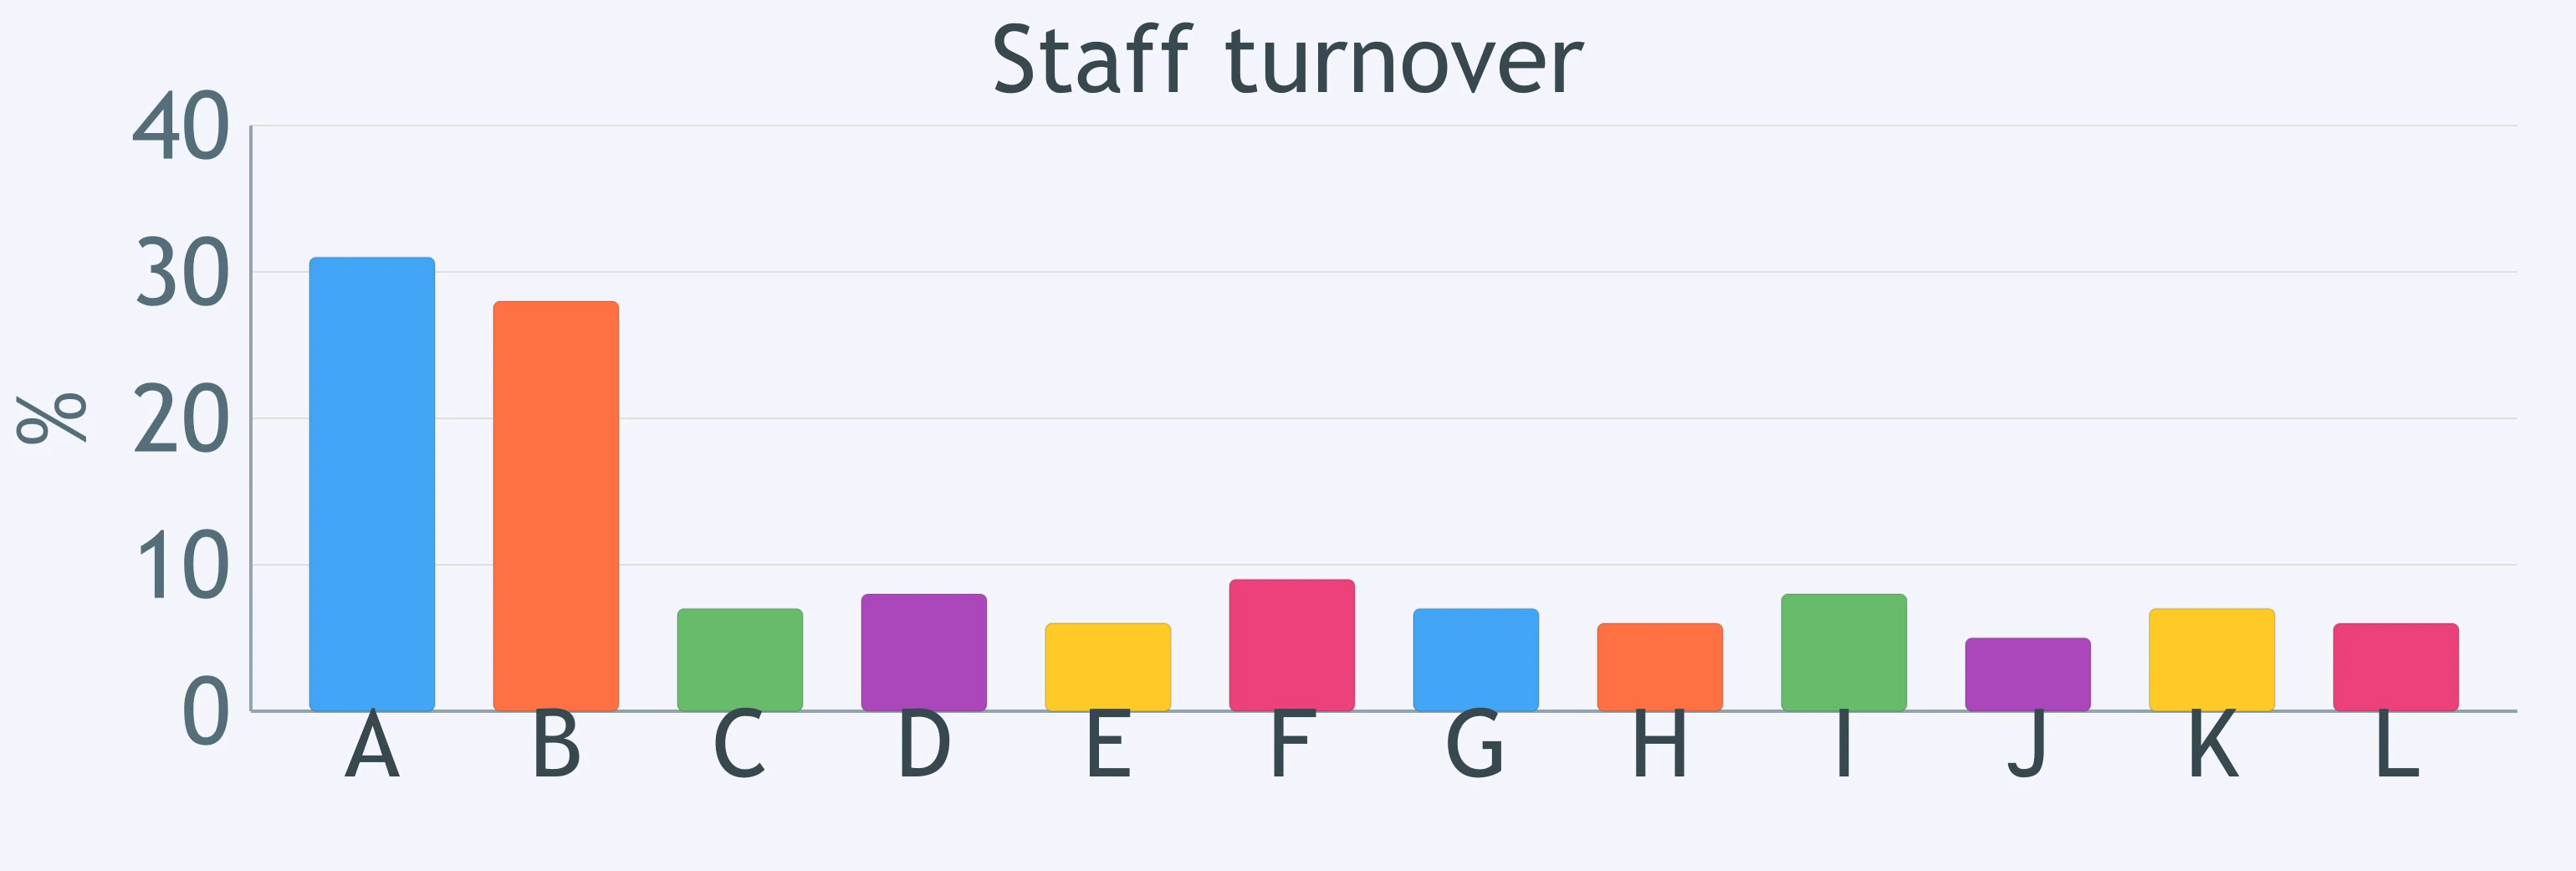
The bar chart has twelve departments: two have very high staff turnover and the rest are low. How should the lower tail be treated?
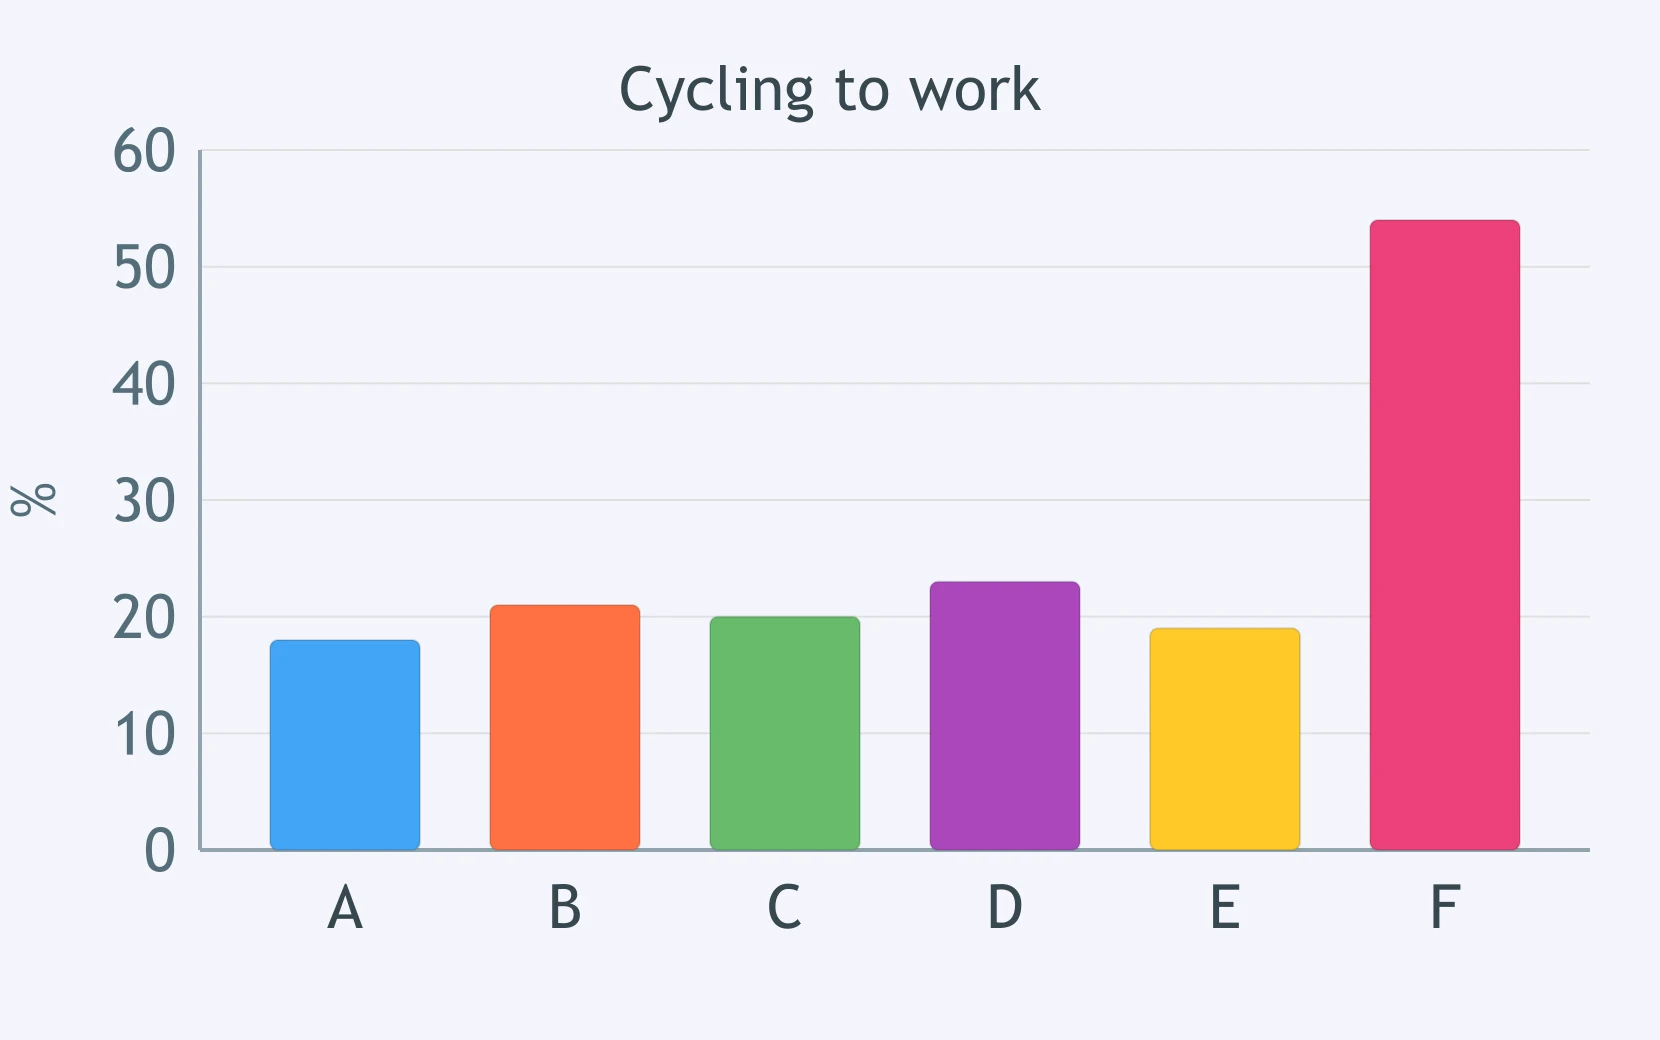
The bar chart compares cycling rates across six towns. Which sentence reports the key feature?
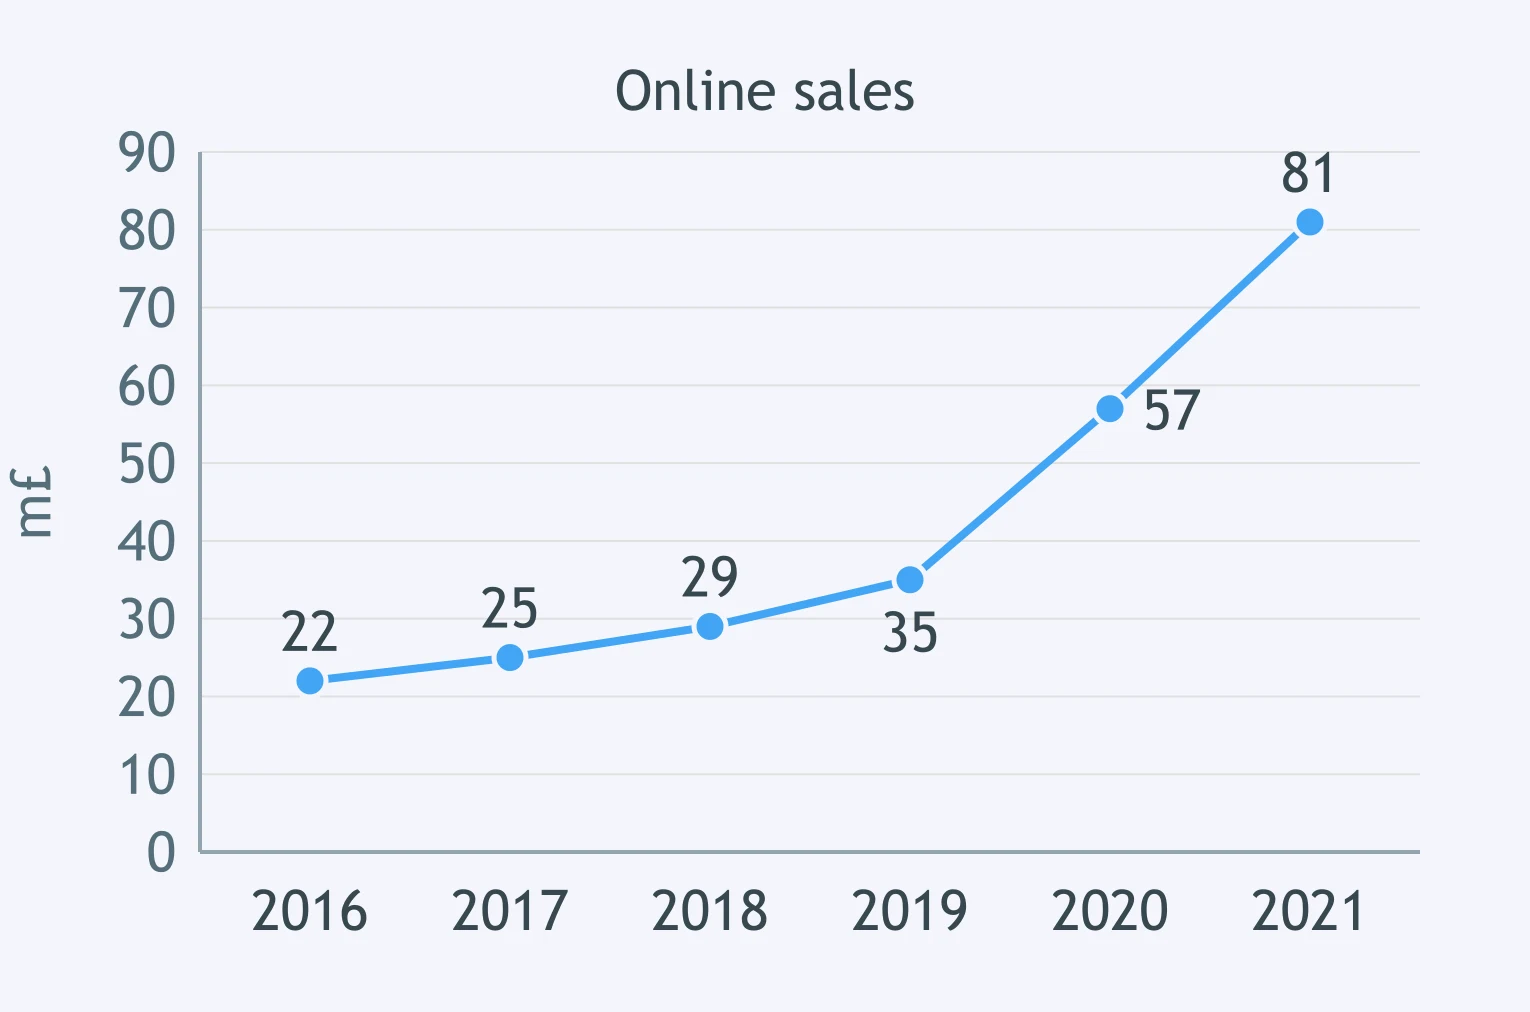
The line graph shows online sales rising from 2016 to 2021, with a particularly steep increase after 2019. Which sentence is best?
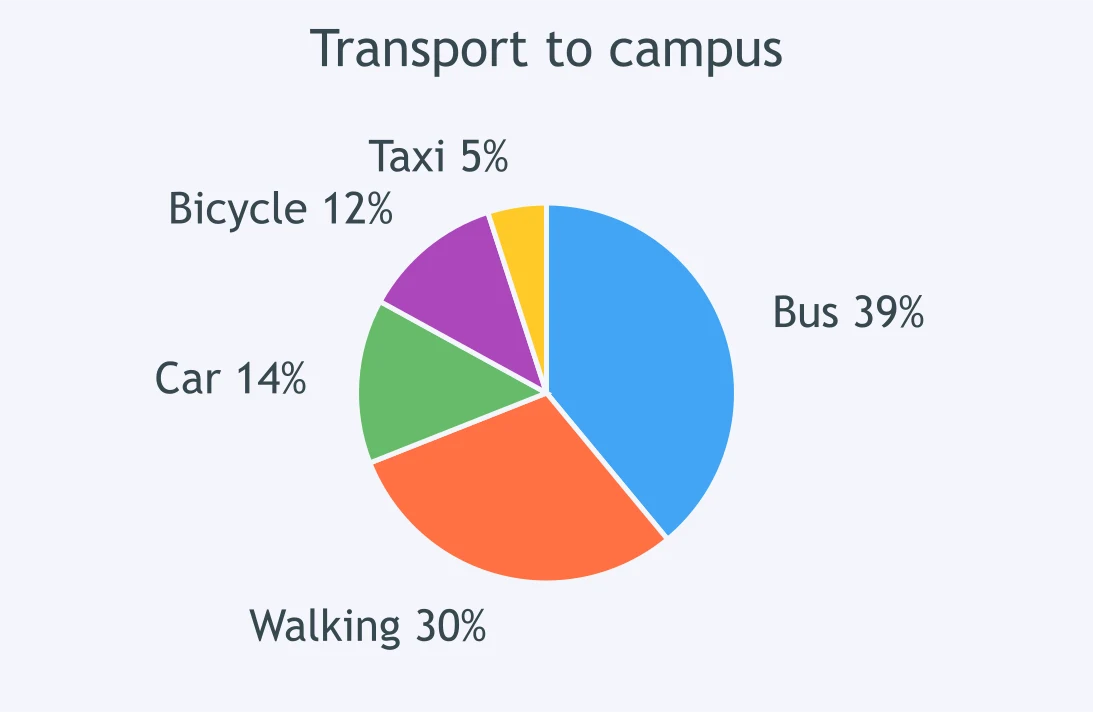
The pie chart shows transport to campus: bus and walking together dominate, while taxi is the smallest slice. Which sentence reports the main pattern?
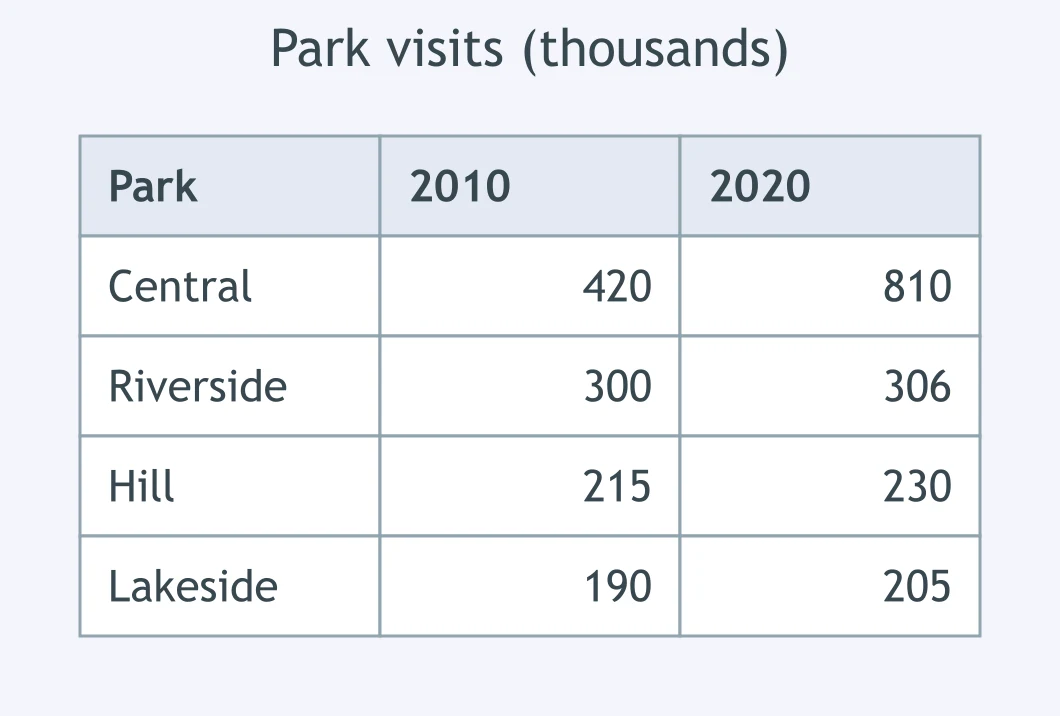
The table shows public park visits in 2010 and 2020: Central Park nearly doubles, while the other parks change only modestly. Which sentence works best?
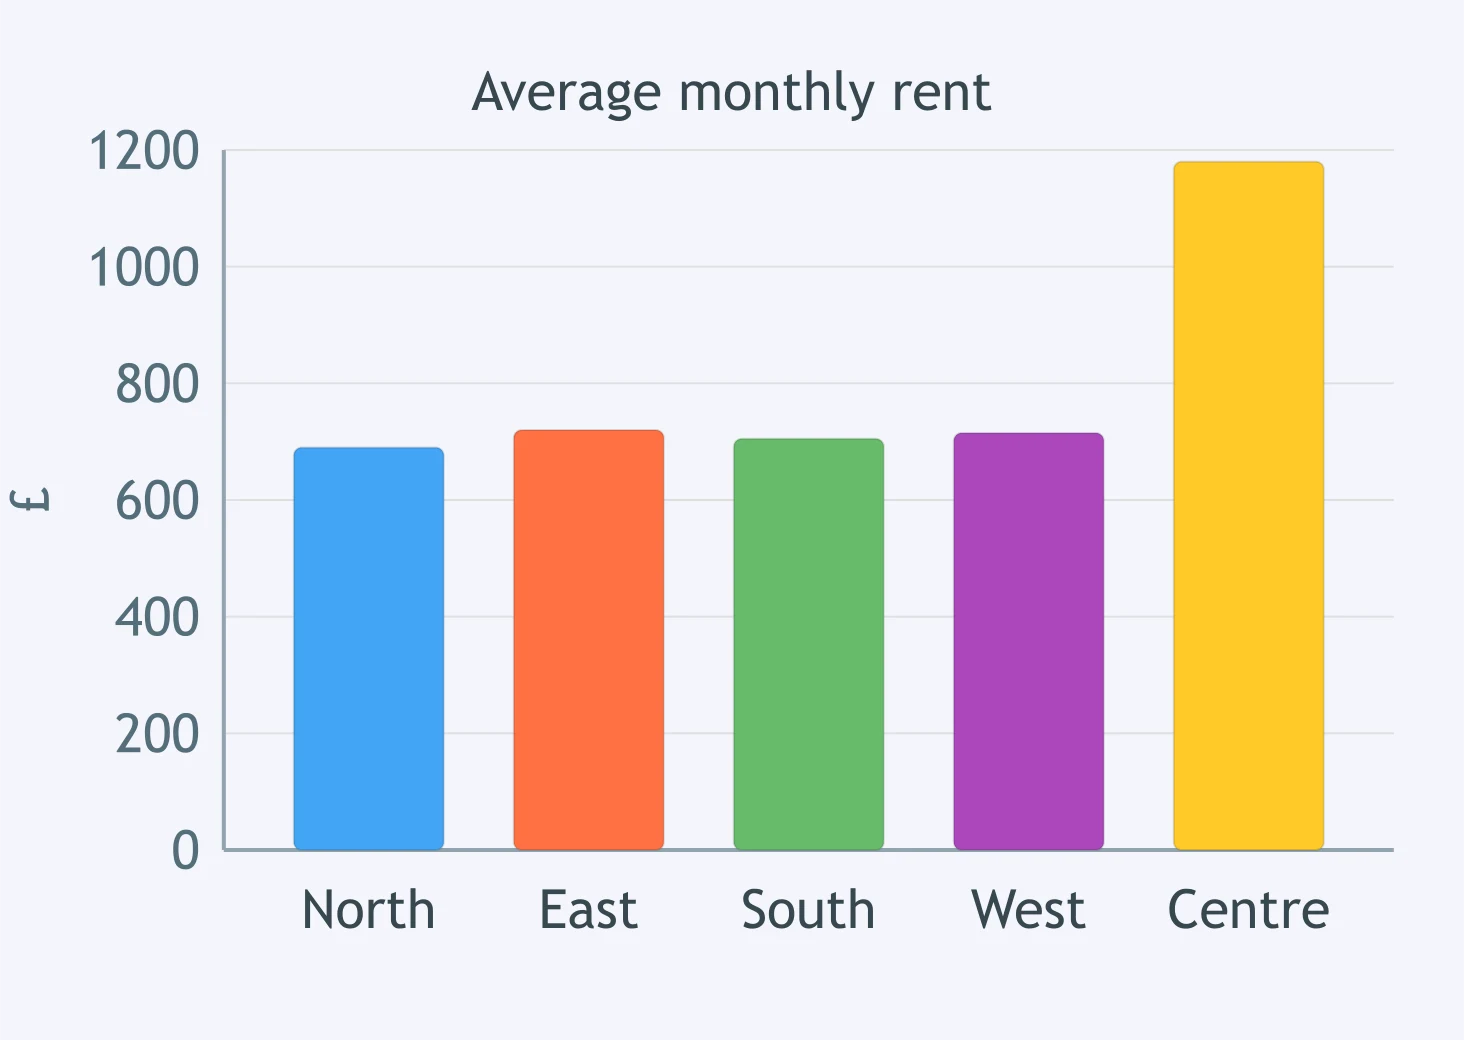
The bar chart compares average rent in five districts. Which sentence best reports the key feature?
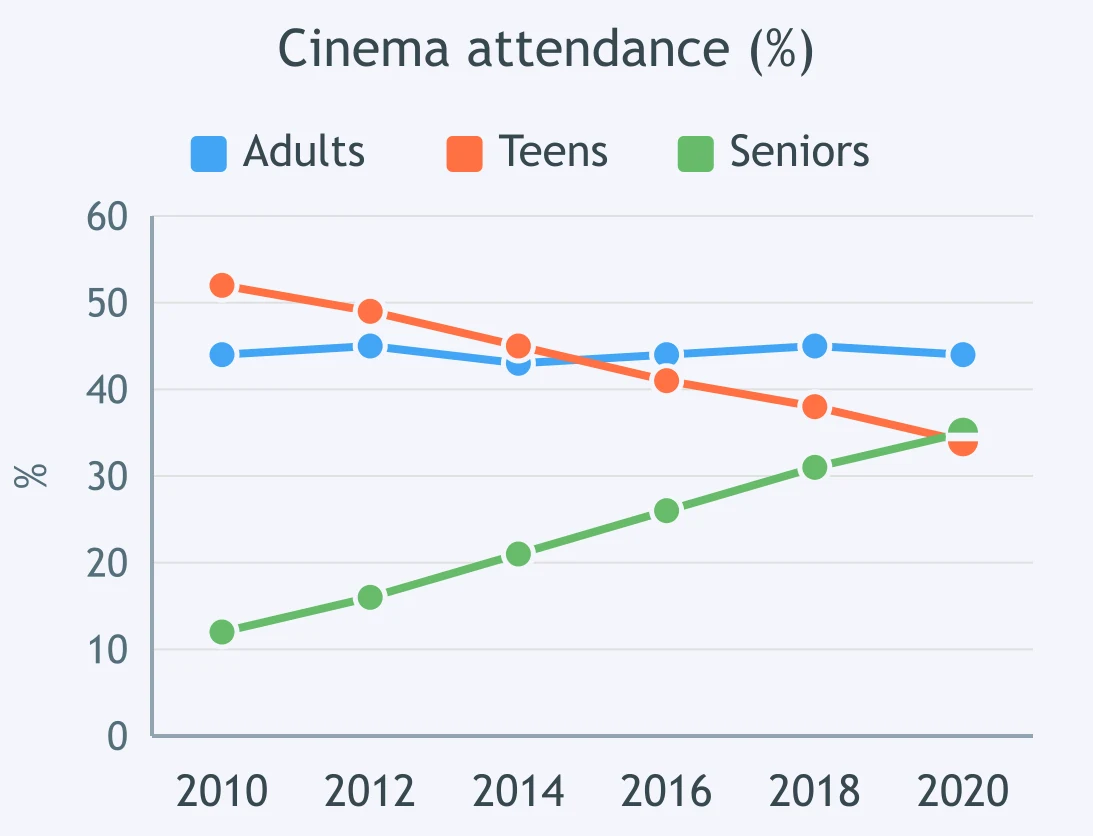
The line graph shows cinema attendance: adults stay stable, teens fall gradually, and seniors rise steadily. Which sentence gives the best overview?

Implication: What Is Not Said Directly - IELTS 7.0 L
15 questions

Rapid Detail in Academic Contexts - IELTS 7.0 L
15 questions

Hedged and Qualified Statements - IELTS 7.0 L
15 questions

Tone: Certain, Doubtful or Reluctant? - IELTS 7.0 L
15 questions

Precise Comparison and Complex Data Relations - IELTS 7.0 W T1
30 questions
Crack the passcode before the zombies get in.
Answer, then swat bugs for bonus points.
Race through questions at your own speed.
Same question on every screen. Fastest wins.

Pick a tile, answer, hit bonuses and steals.