Loading
by BlastRoom
Practise precise comparison, proportion and key-feature reporting for IELTS Writing Task 1.
#writing_task_1#ielts_7_0

30 questions
One question set, multiple game modes. Tap any game to see it in action. Not sure which to pick?
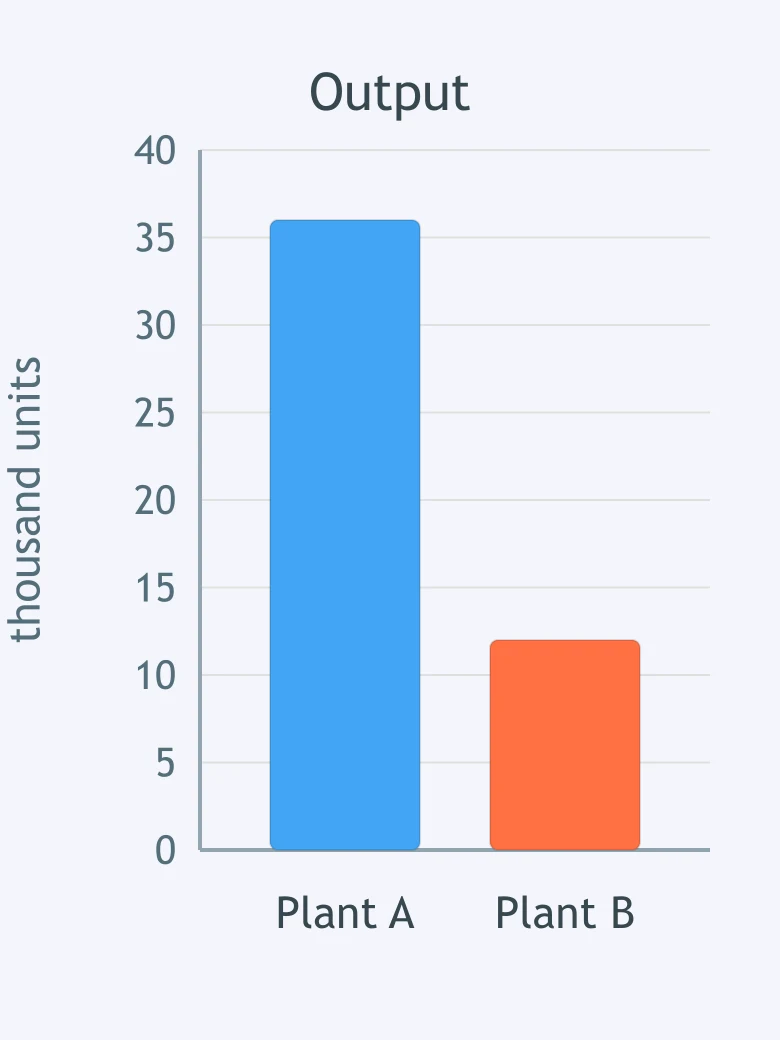
The bar chart compares output at two plants. Which comparison is accurate?
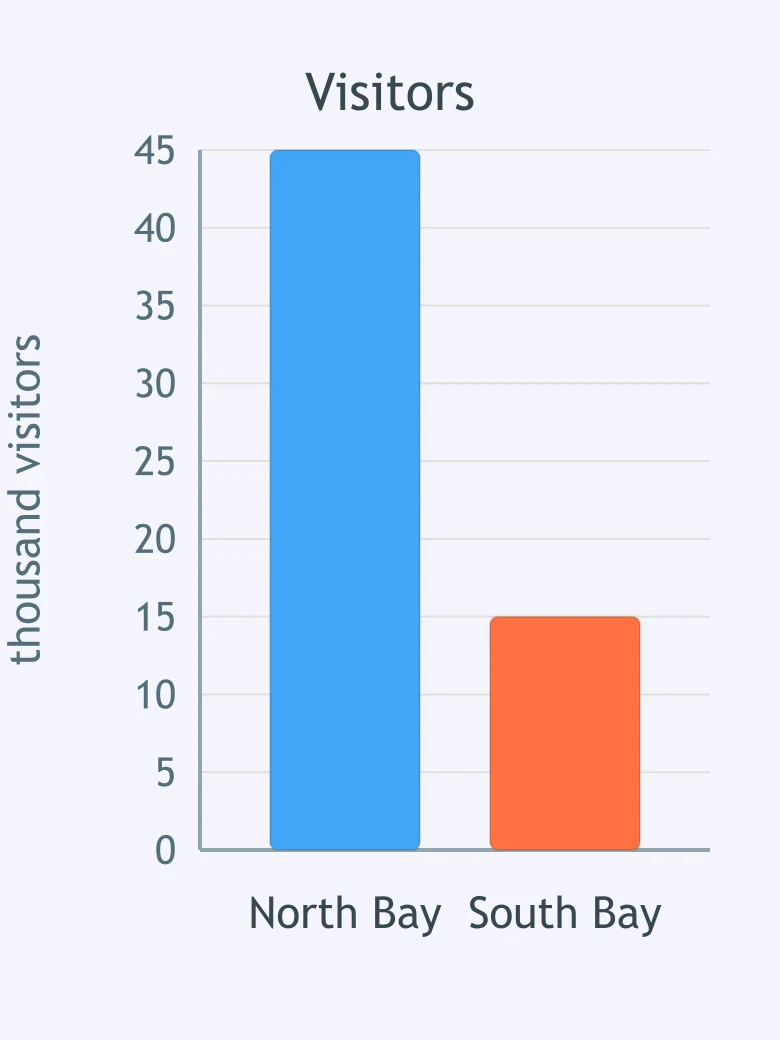
The tourism chart compares visitor numbers at two bays. Choose the precise Task 1 sentence.
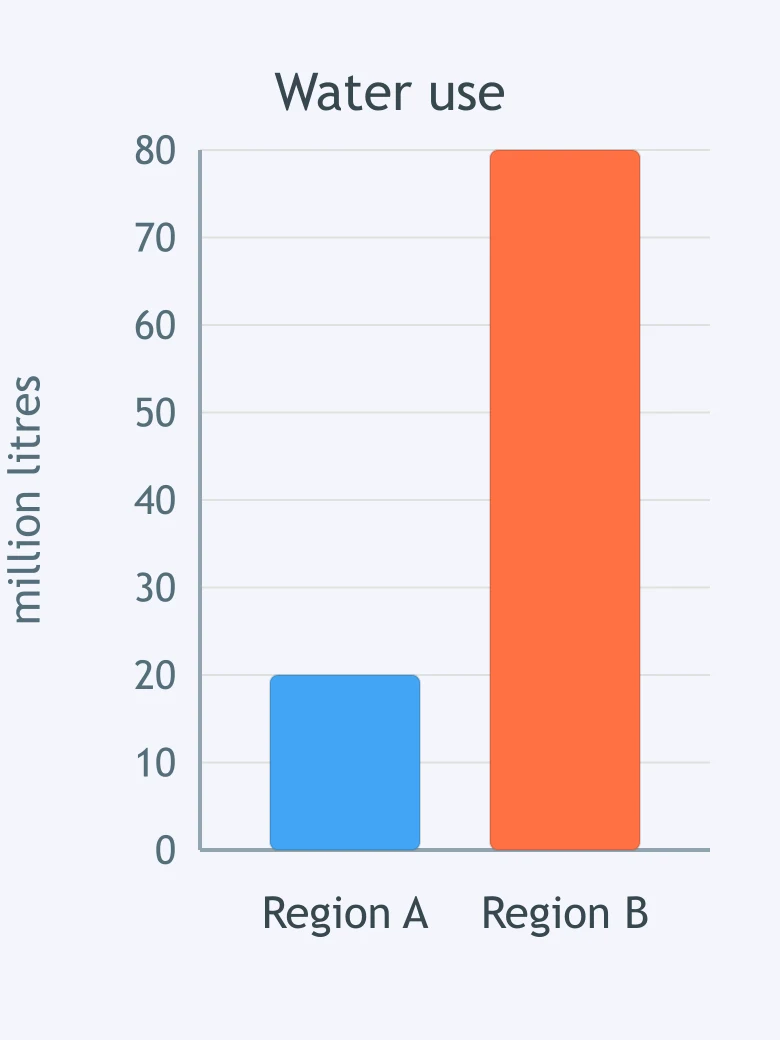
The chart compares water use in two regions. Which sentence states the relation correctly?
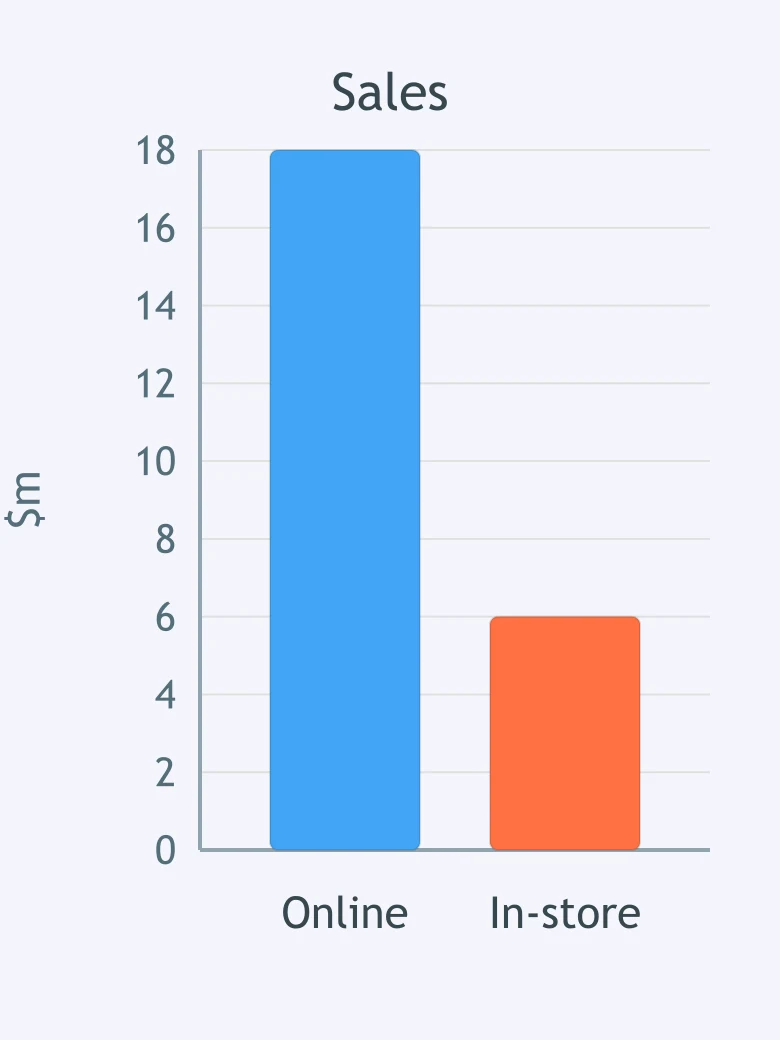
The chart compares online and in-store sales. Which comparison would be accurate in a report?
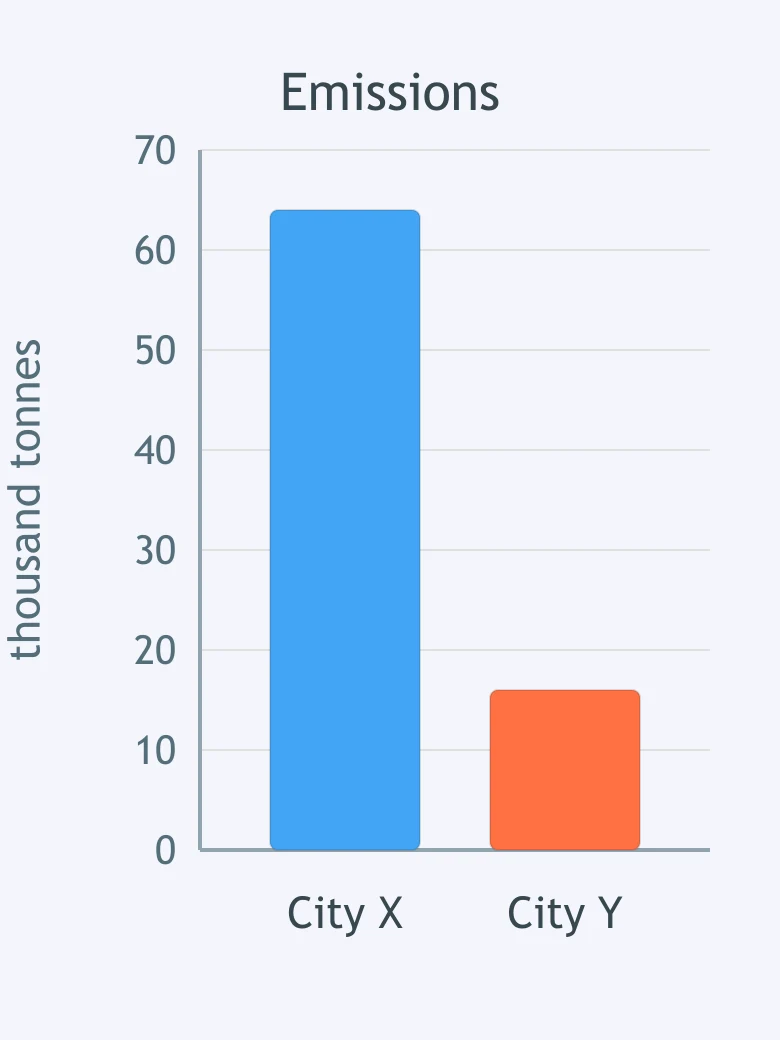
The emissions chart compares two cities. Which statement is accurate?
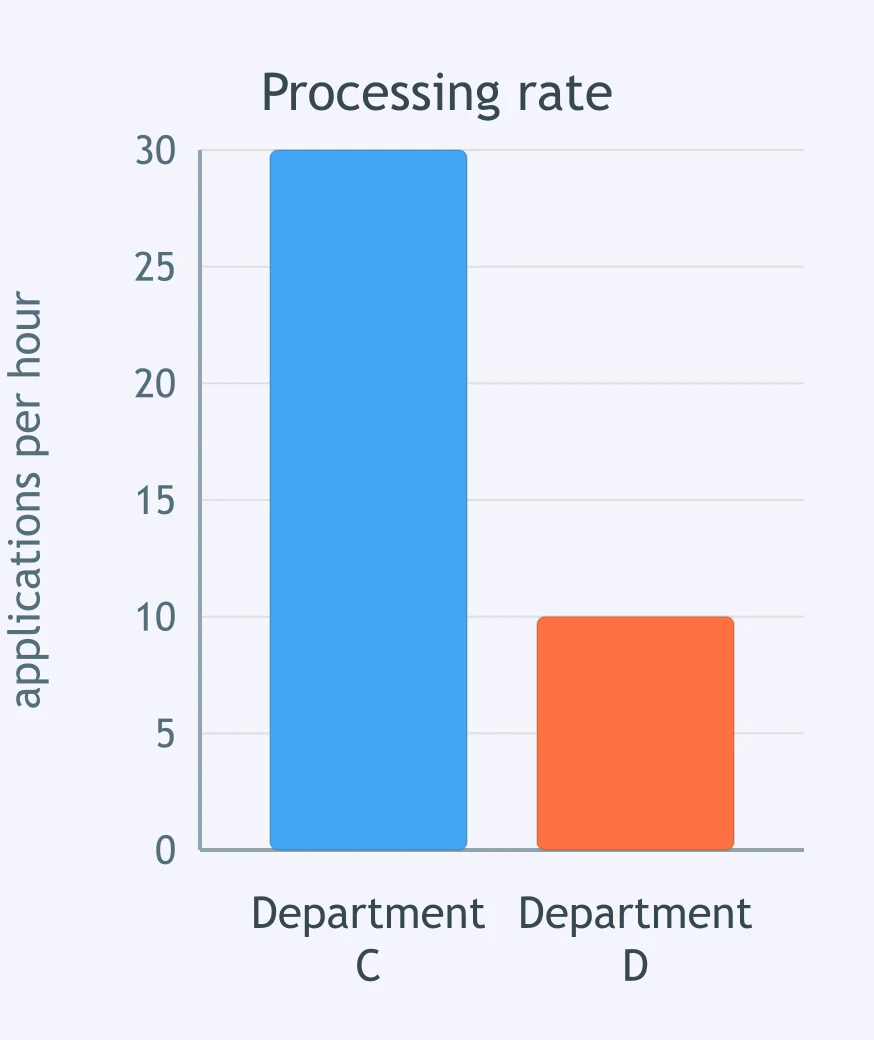
The processing chart compares two departments. Which sentence is mathematically precise?
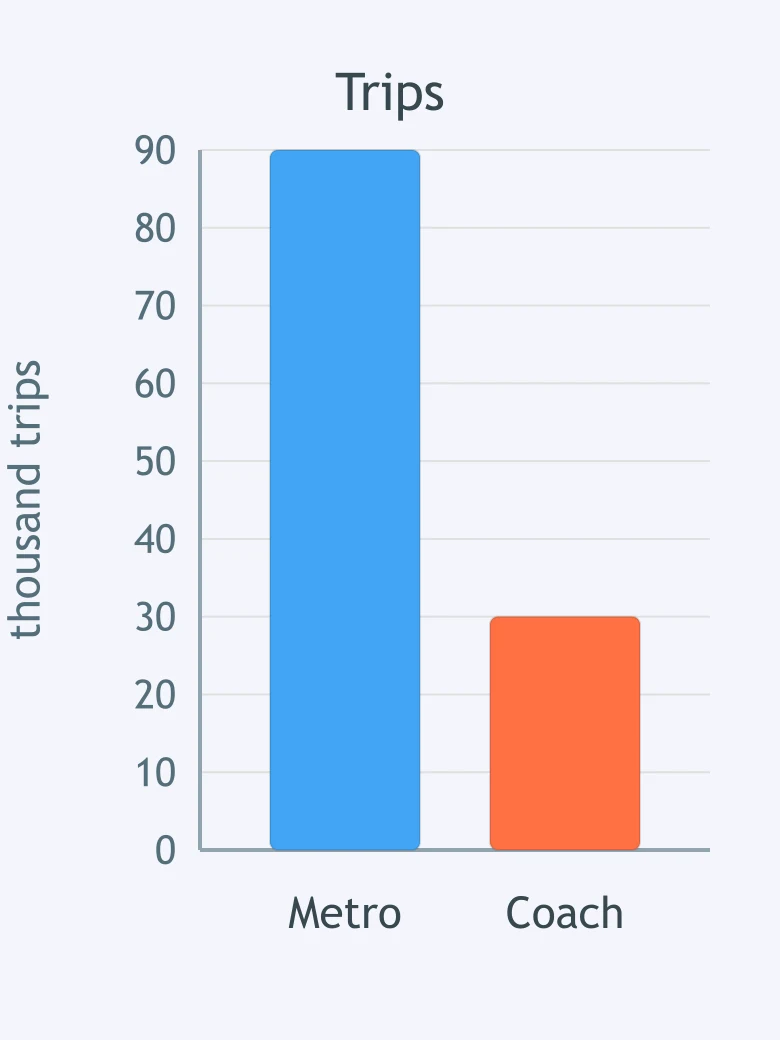
The chart compares metro and coach trips. Which overview sentence is correct?
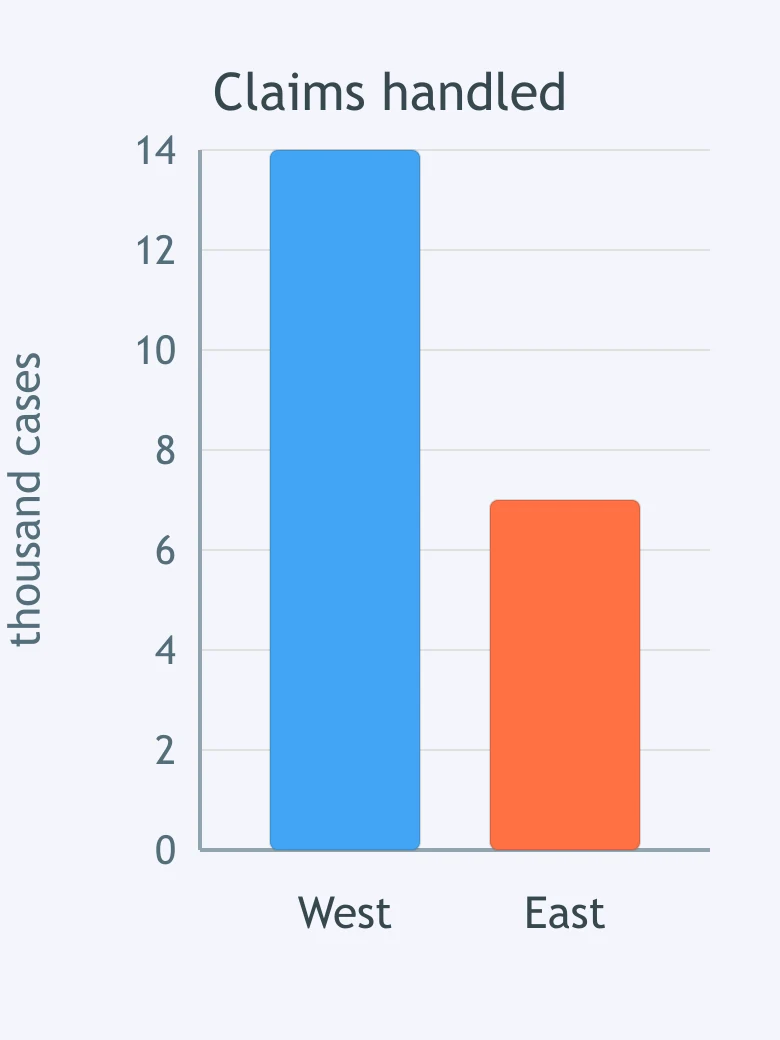
The claims chart compares the West and East branches. Which comparison fits the data?
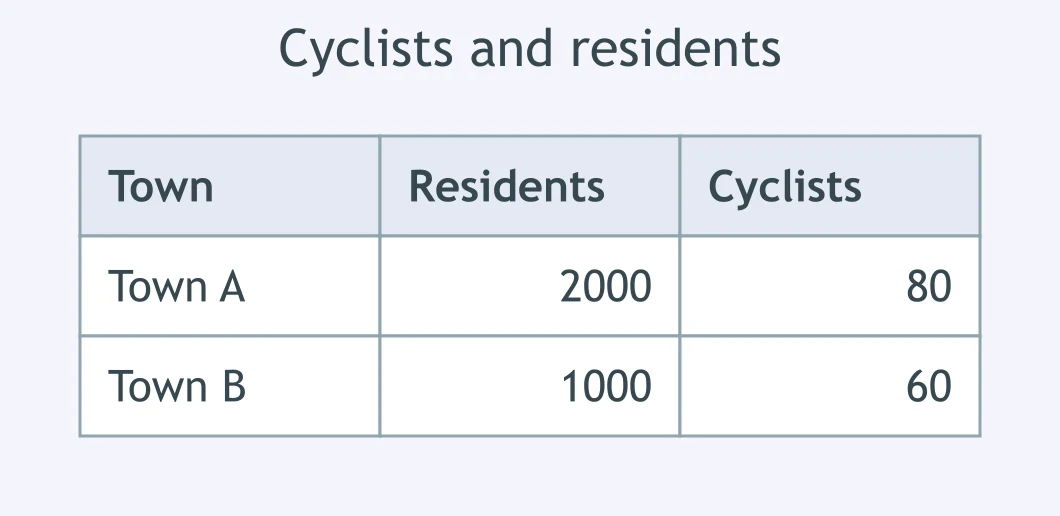
The table shows cyclists against residents in two towns. Which statement reports the key proportion?
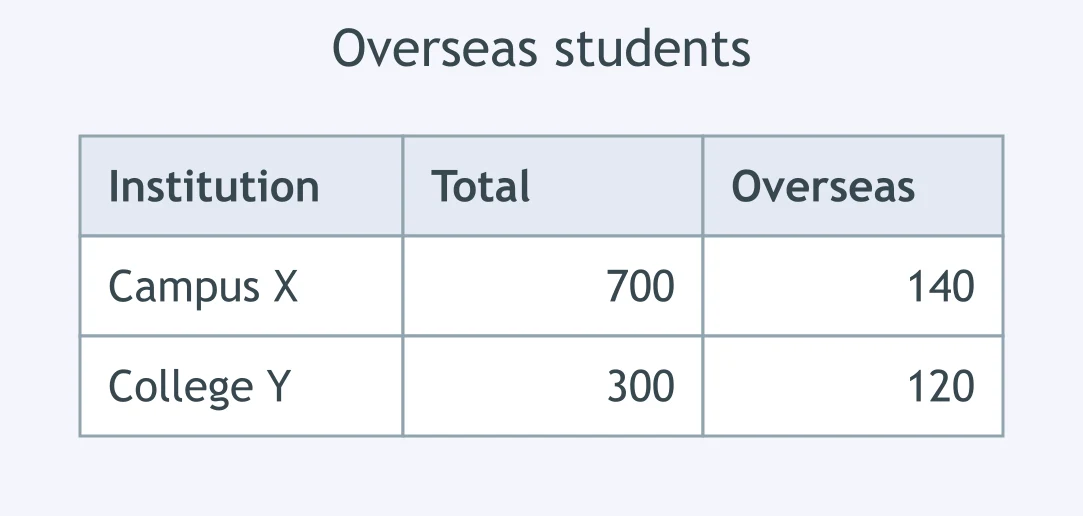
The table shows overseas students against total enrolment at Campus X and College Y. Which comparison should be highlighted?
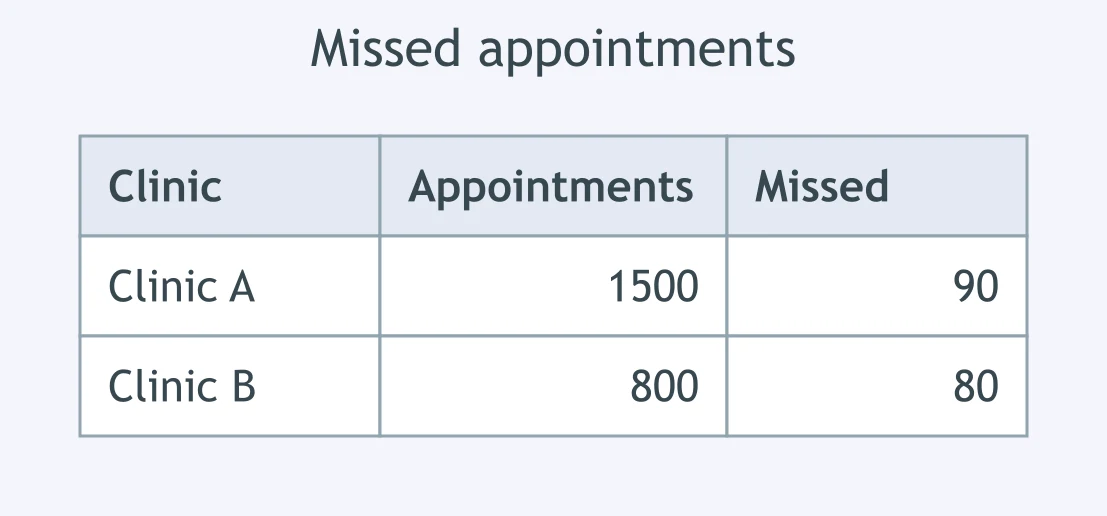
The table shows missed appointments against total appointments at two clinics. Which sentence captures the rate accurately?
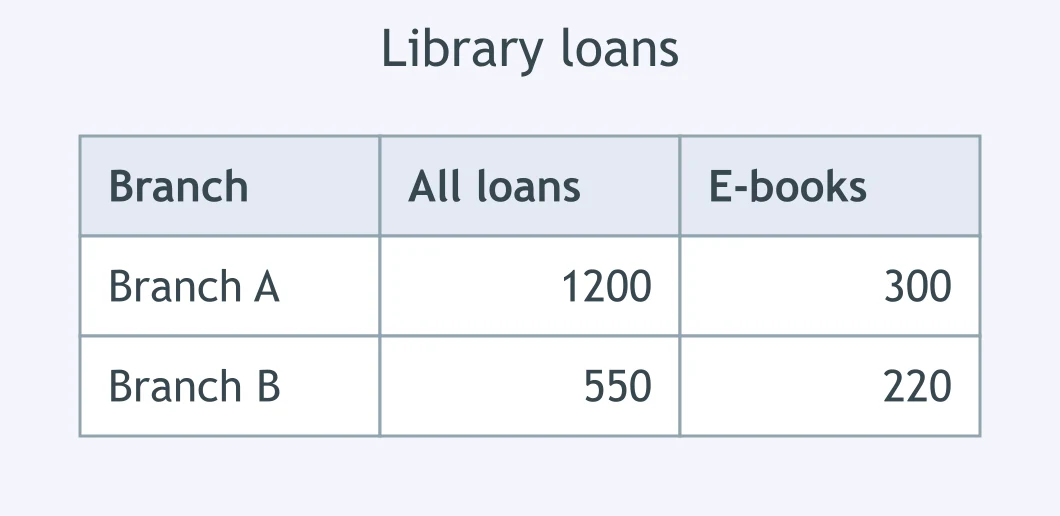
The table shows e-book loans against all loans at two branches. Which Task 1 statement is accurate?
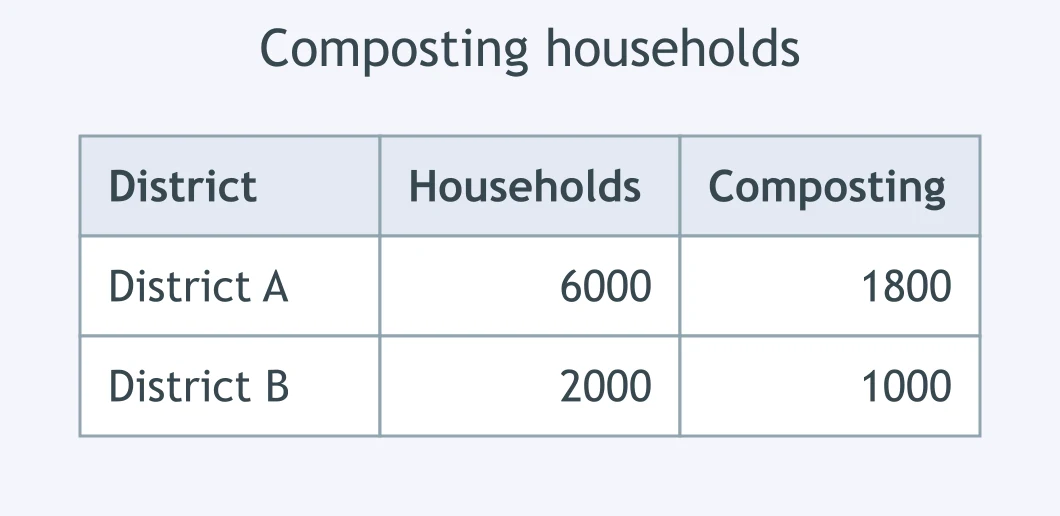
The table shows composting households against all households in two districts. Which overview is correct?
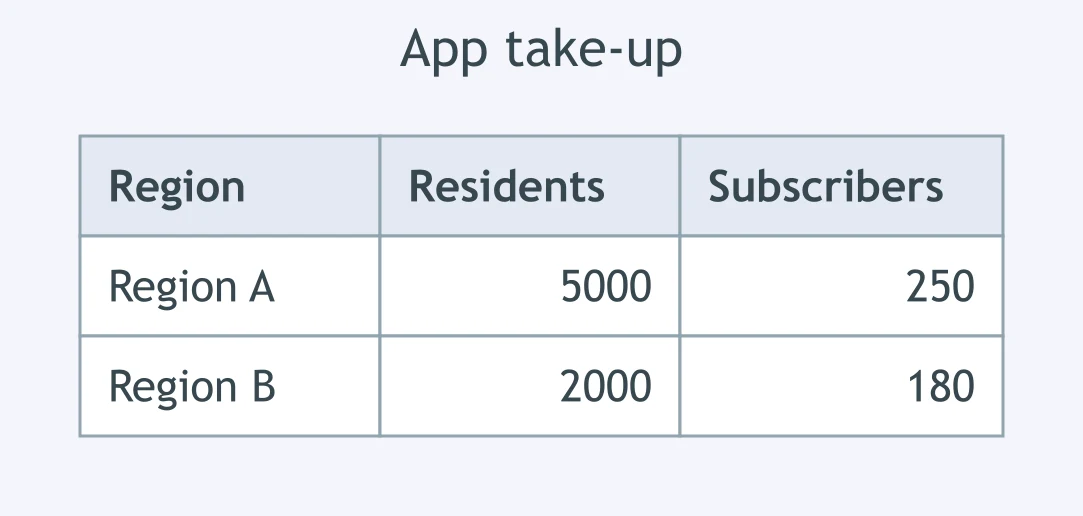
The table shows app subscribers against residents in two regions. Which sentence is precise?
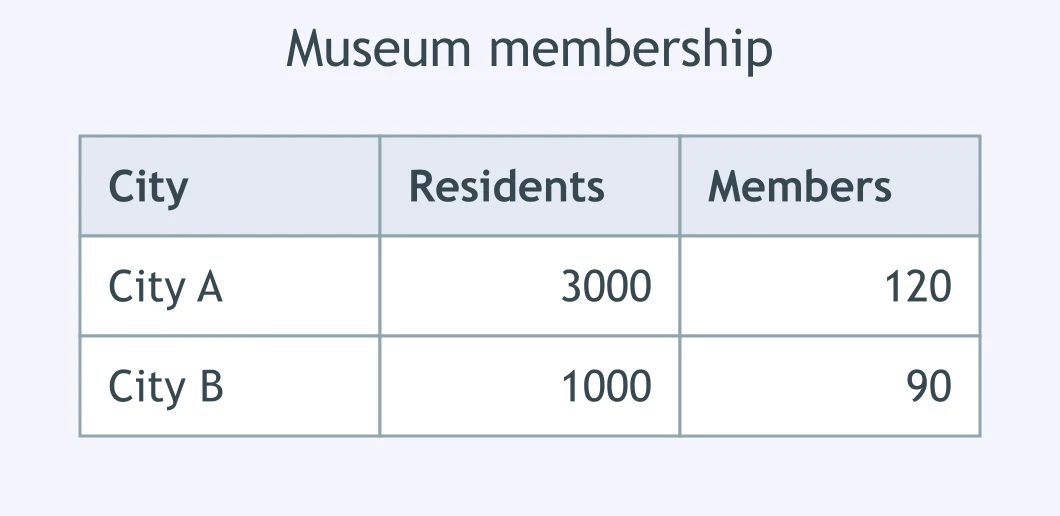
The table shows museum members against residents in two cities. Which comparison is accurate?
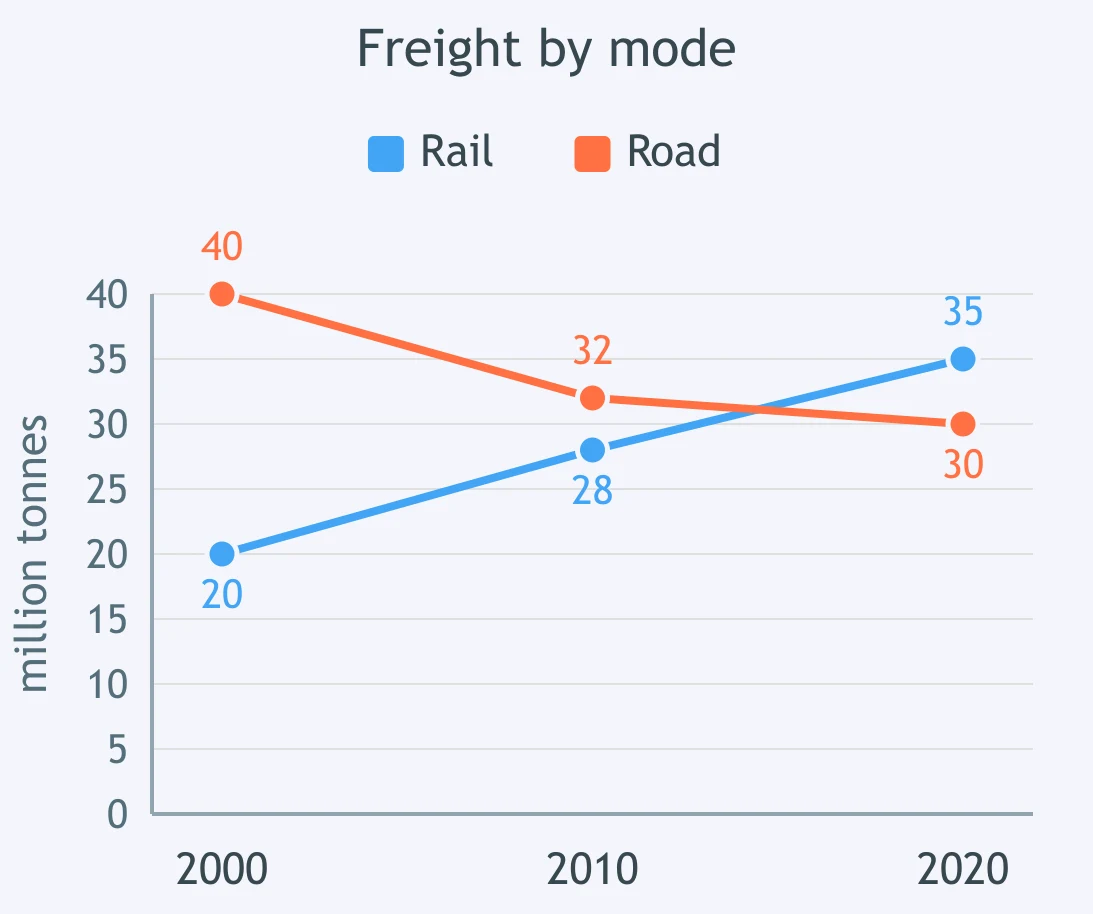
The line graph tracks rail and road freight between 2000 and 2020. What is the key feature?
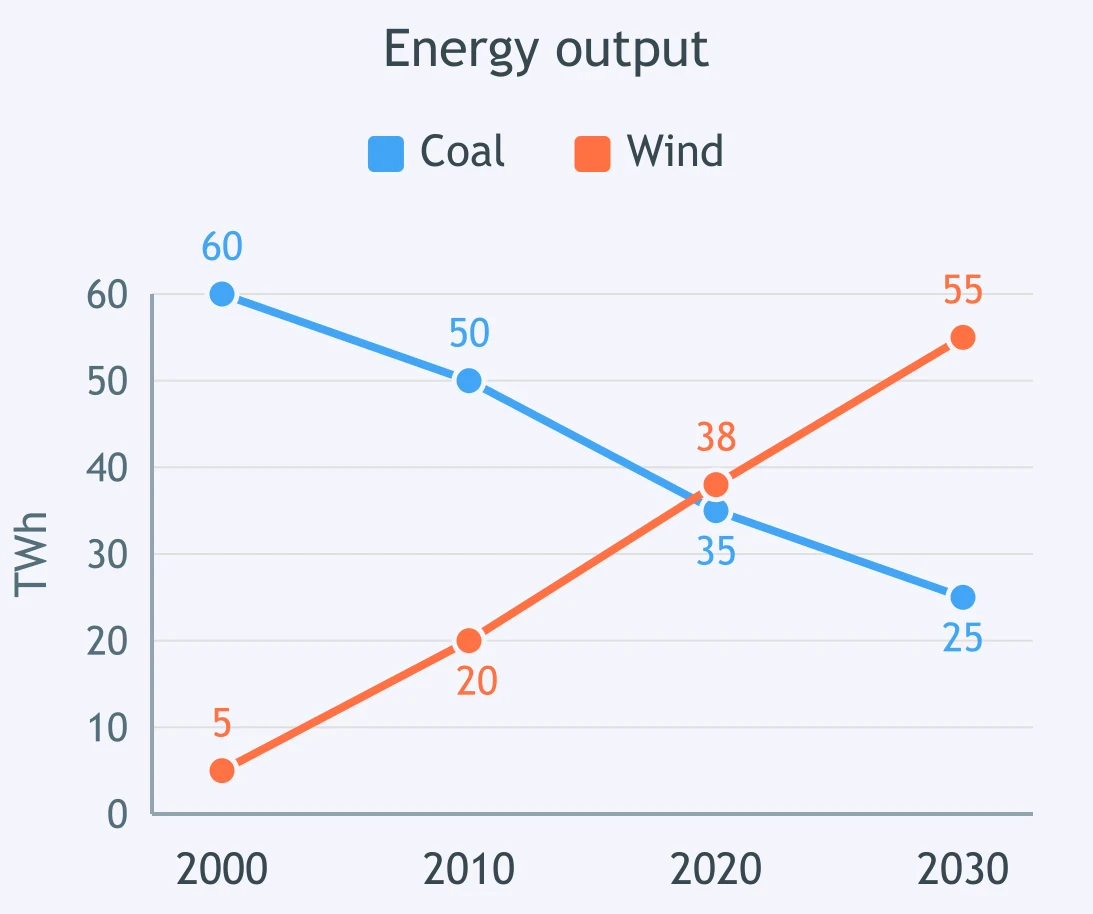
The line graph tracks coal and wind output from 2000 to 2030. Which sentence best summarises the relationship?
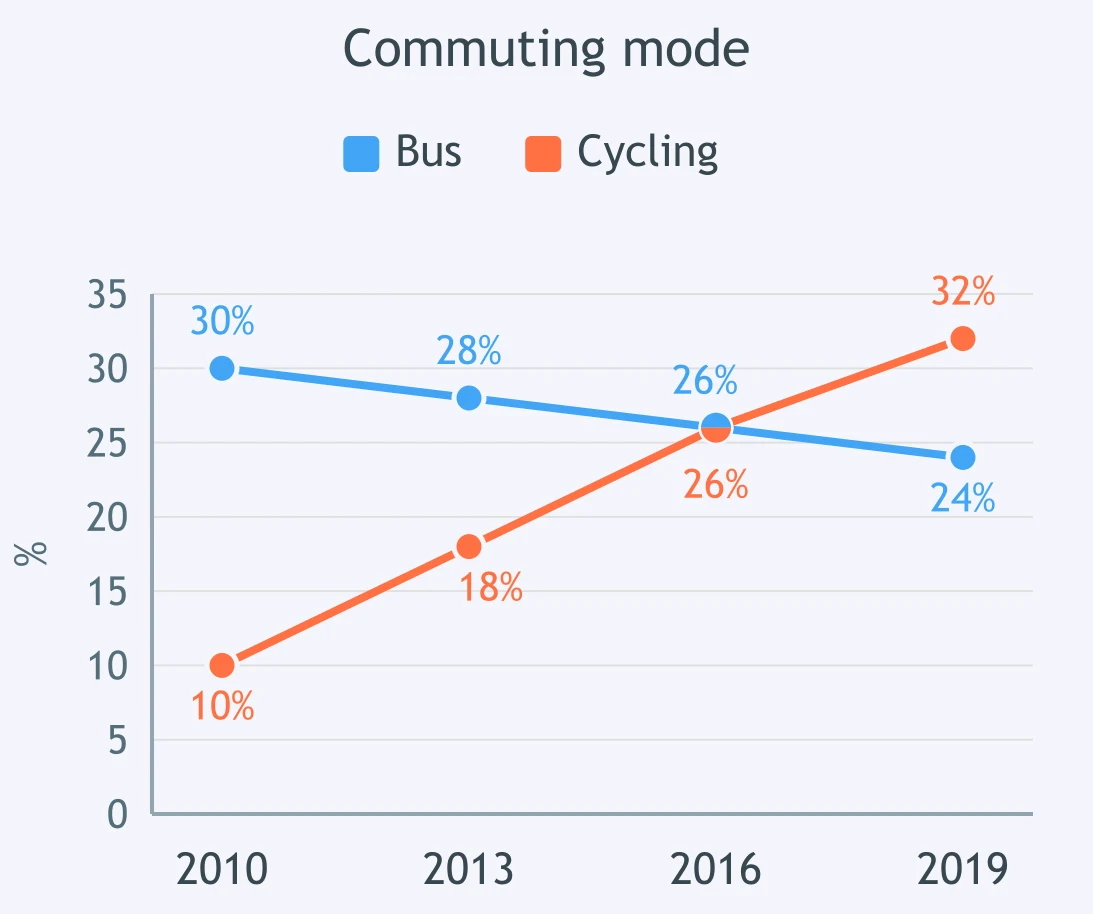
The line graph tracks bus commuting and cycling between 2010 and 2019. Which statement is accurate?
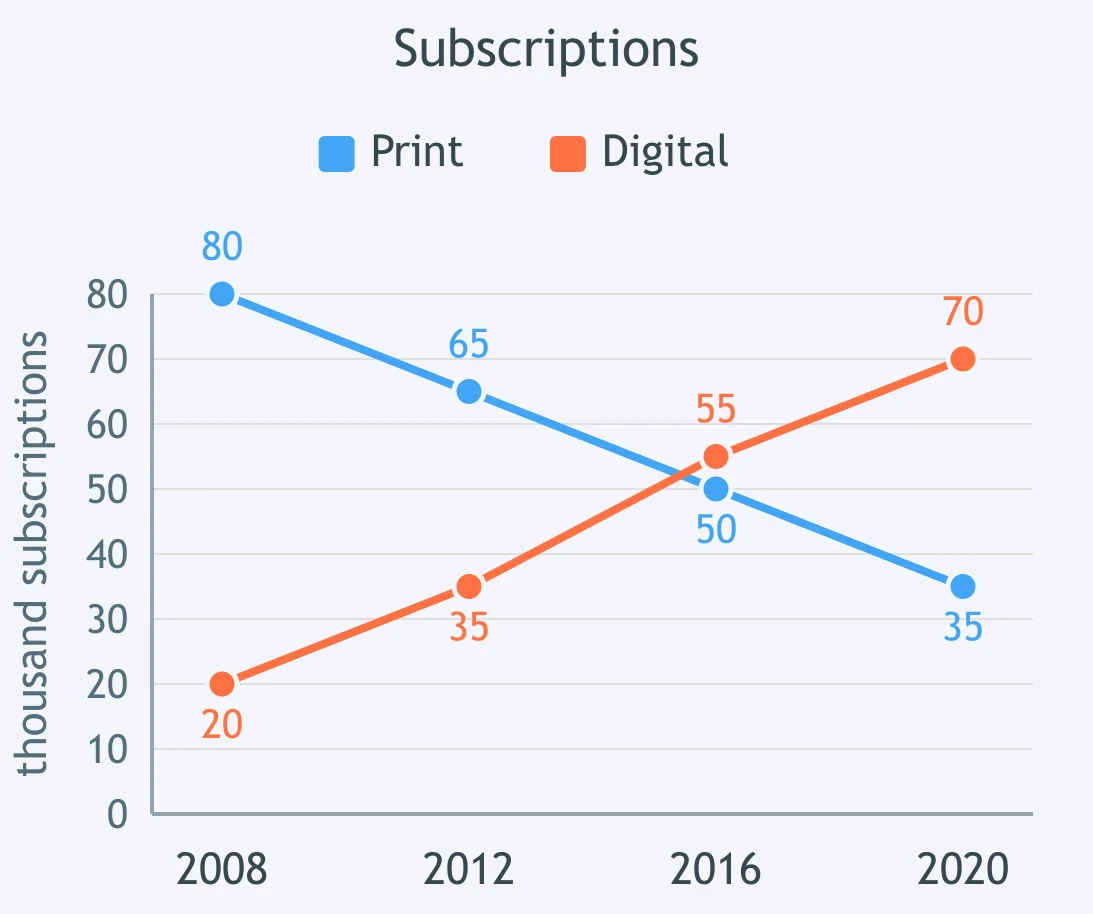
The line graph tracks print and digital subscriptions. Which overview is correct?
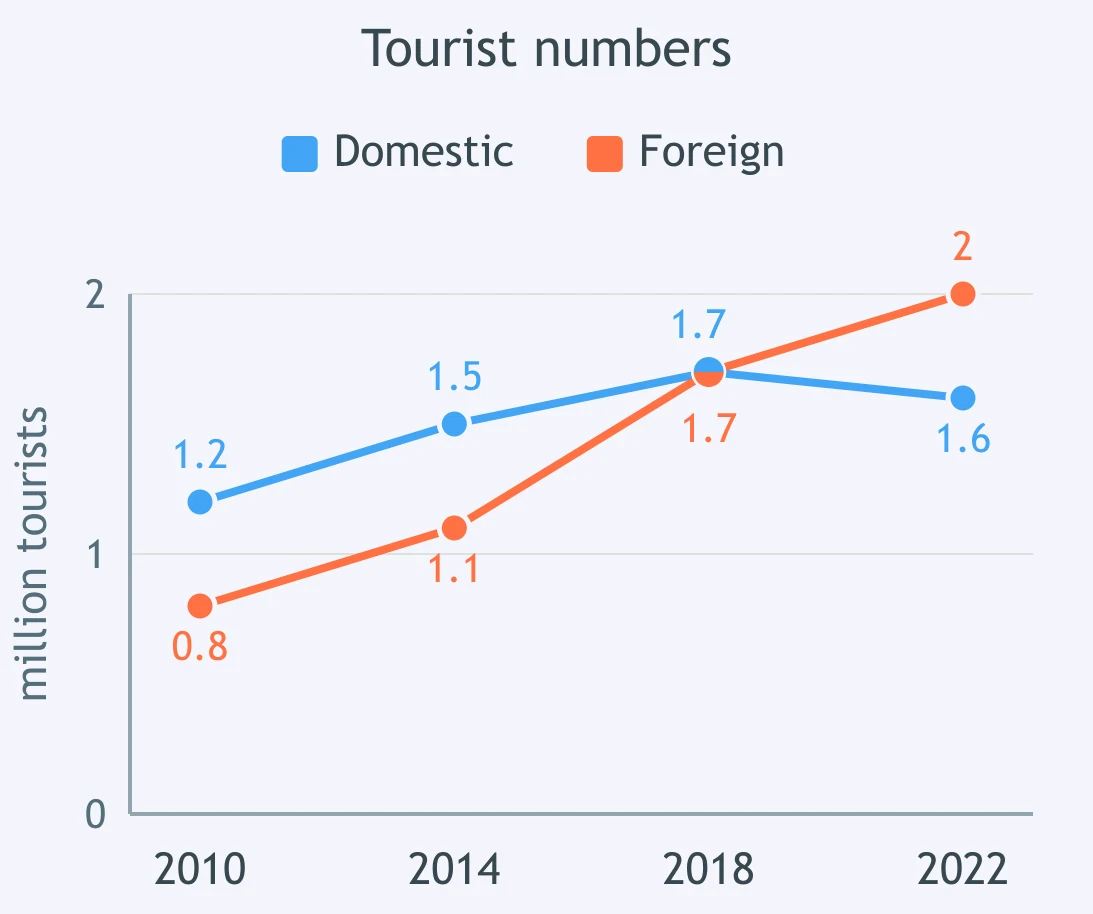
The line graph tracks domestic and foreign tourist numbers. Which key feature should be reported?
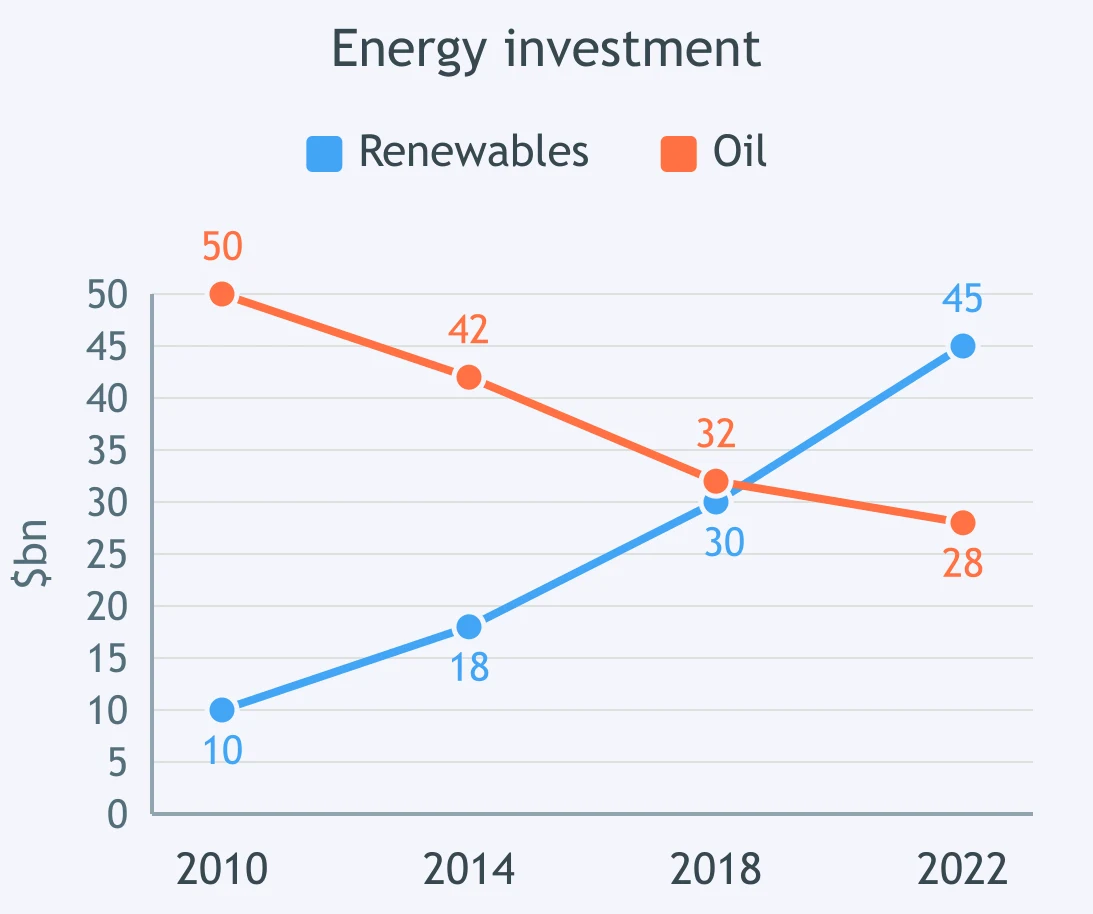
The line graph tracks renewable and oil investment. Which sentence is best?
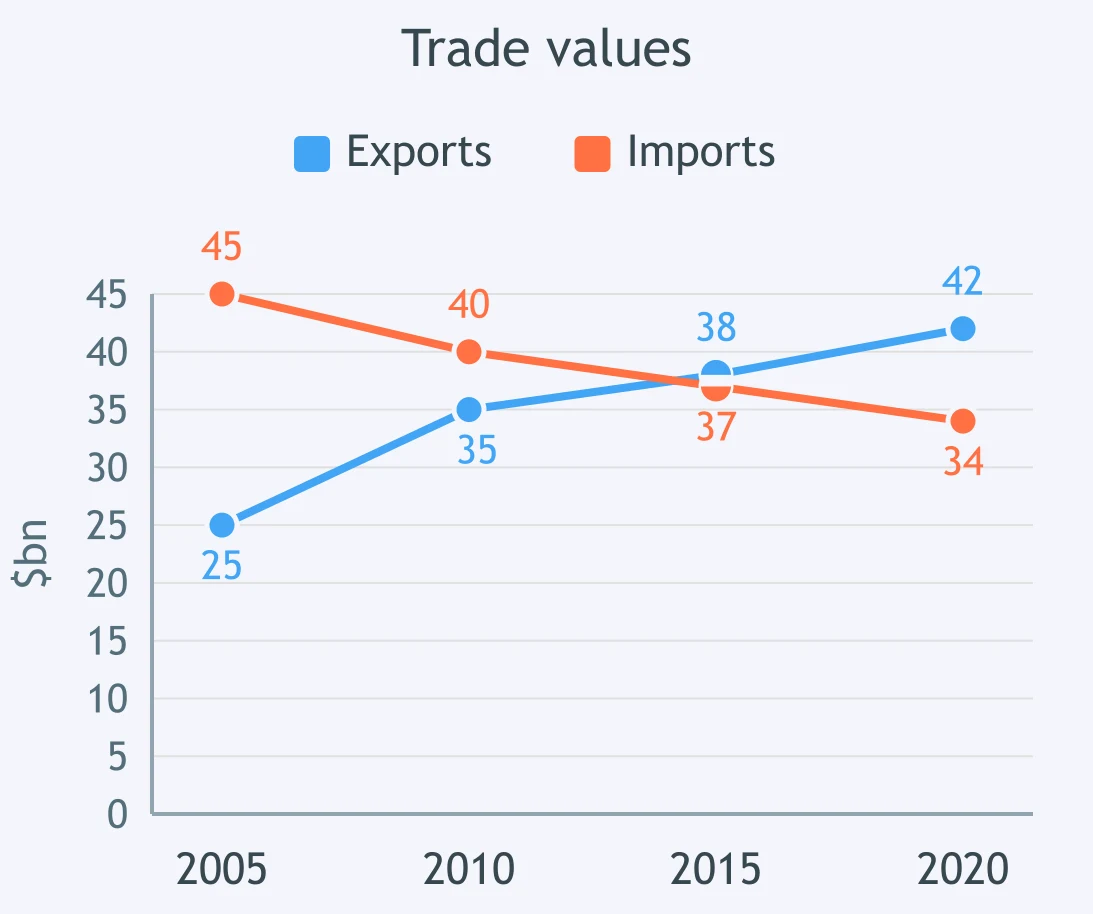
The line graph tracks exports and imports. Which relation is accurate?
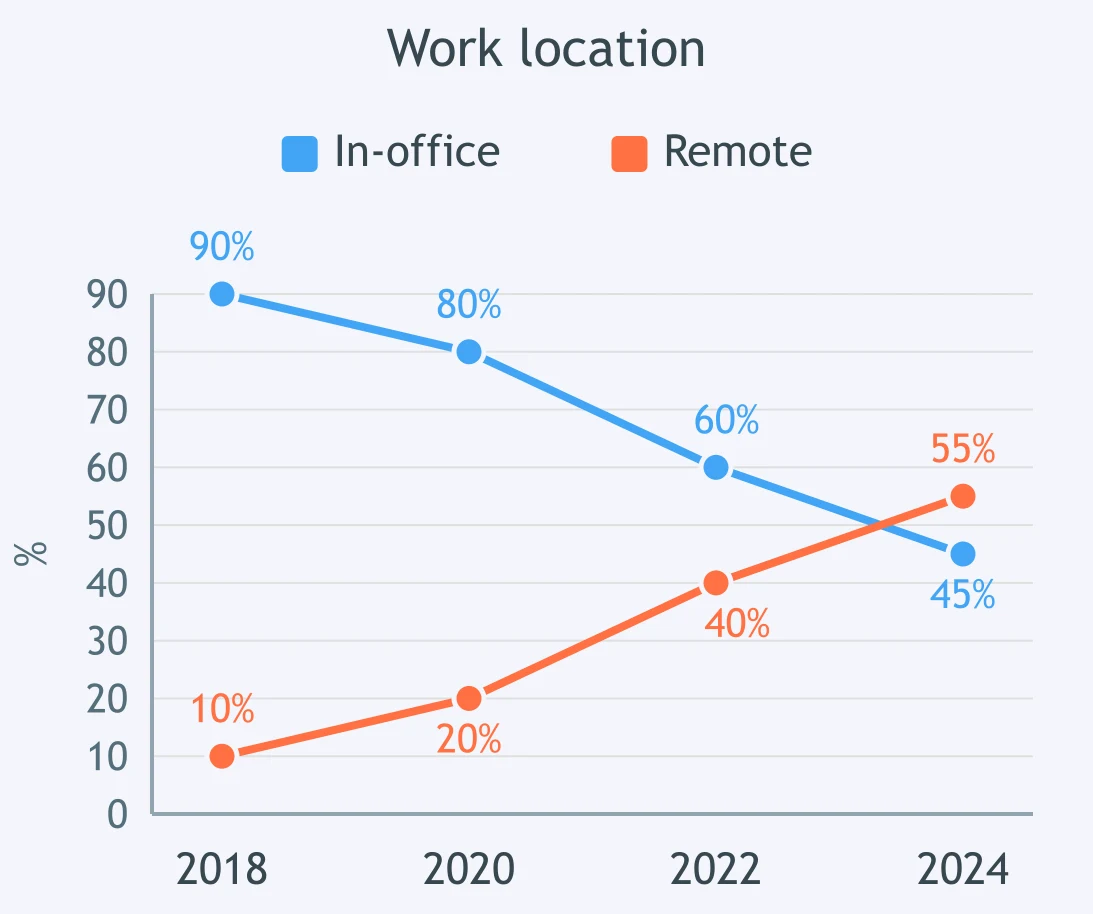
The line graph tracks in-office and remote working. Which statement captures the main change?
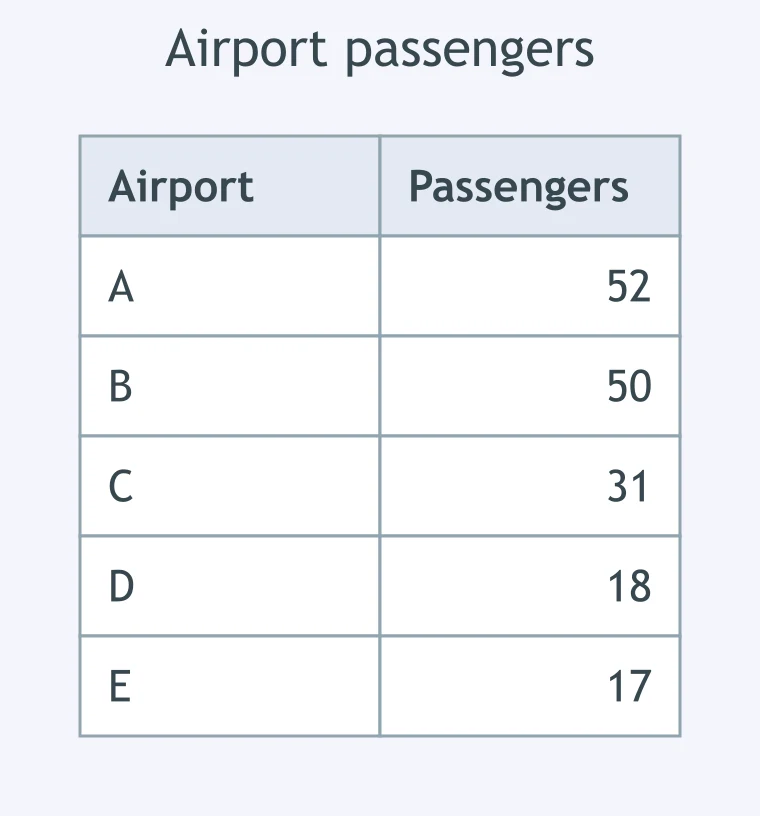
The table ranks five airports by passenger numbers. Which statement is accurate?
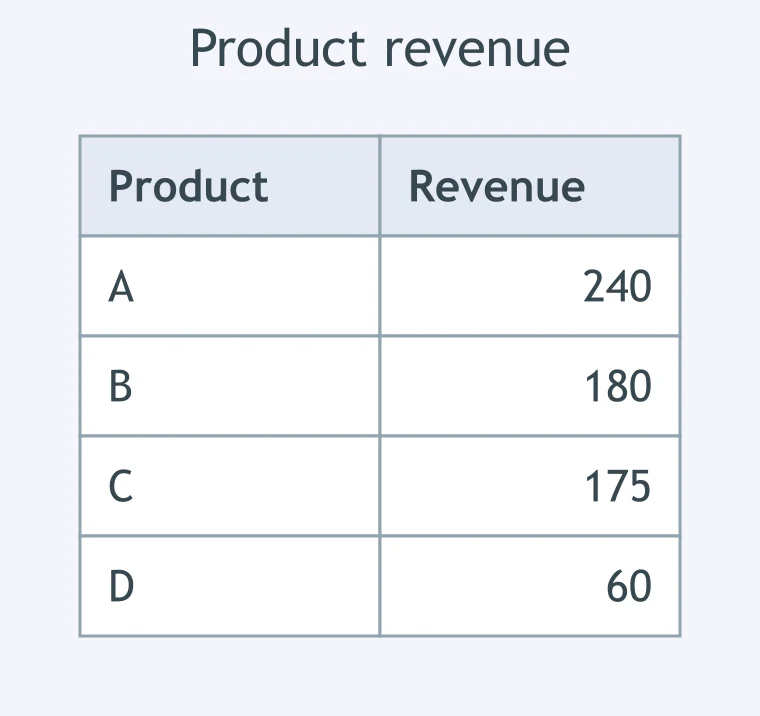
The table ranks four products by revenue. Which sentence gives a precise ranking comparison?
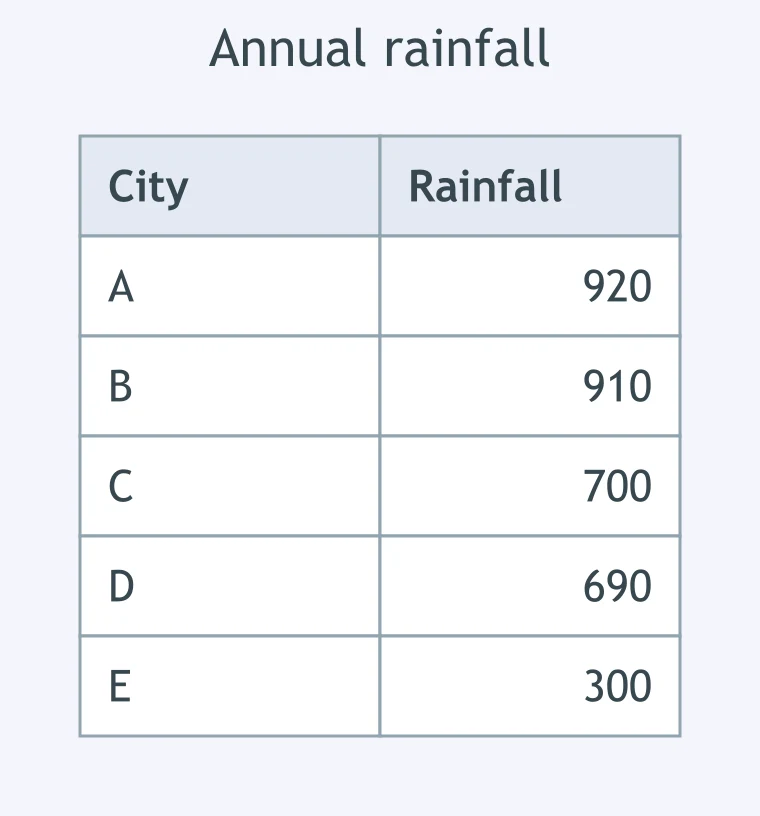
The table ranks five cities by annual rainfall. Which statement reports the ranking accurately?
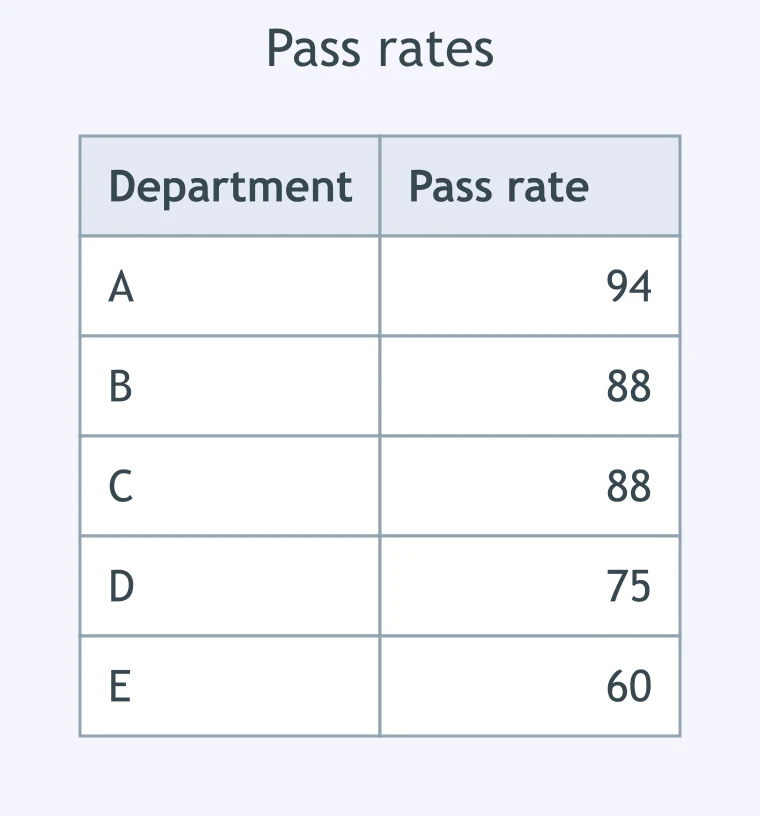
The table ranks five departments by pass rate. Which sentence identifies the key ranking feature?
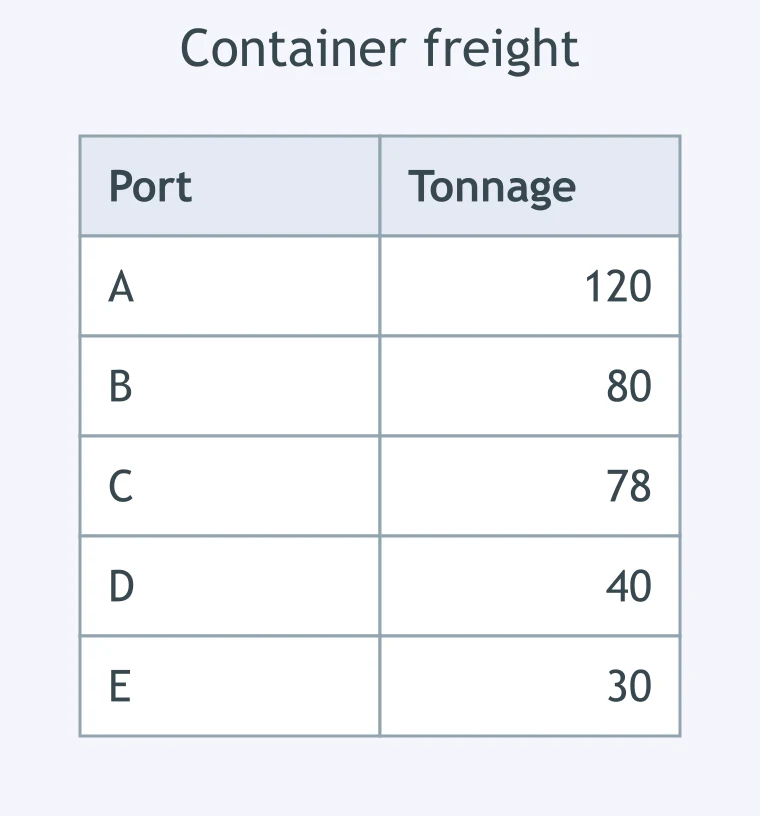
The table ranks five container ports by tonnage. Which comparison is accurate?
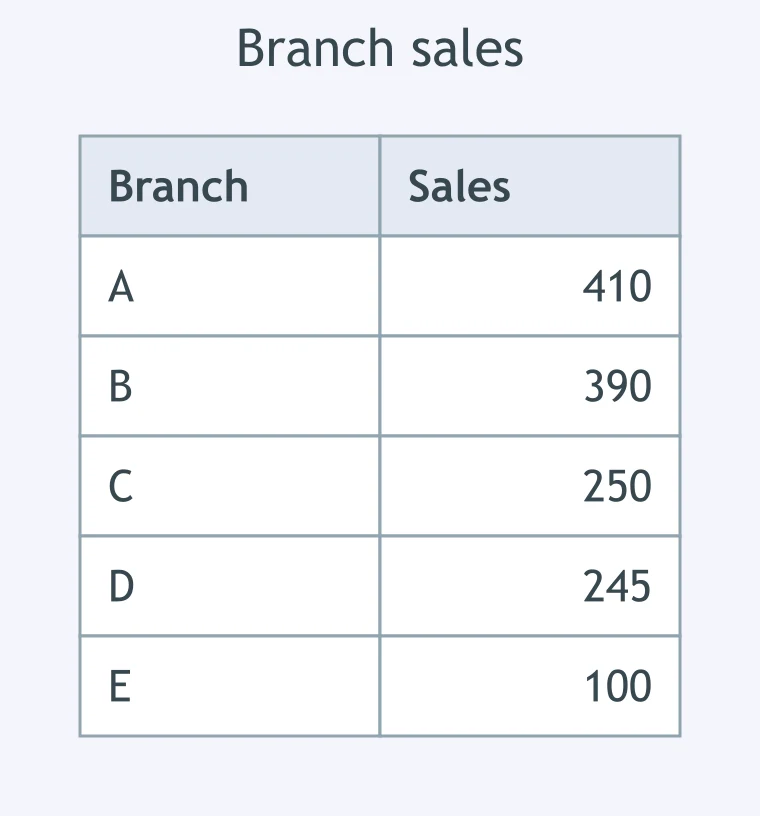
The table ranks five branches by sales. Which statement would suit an overview?
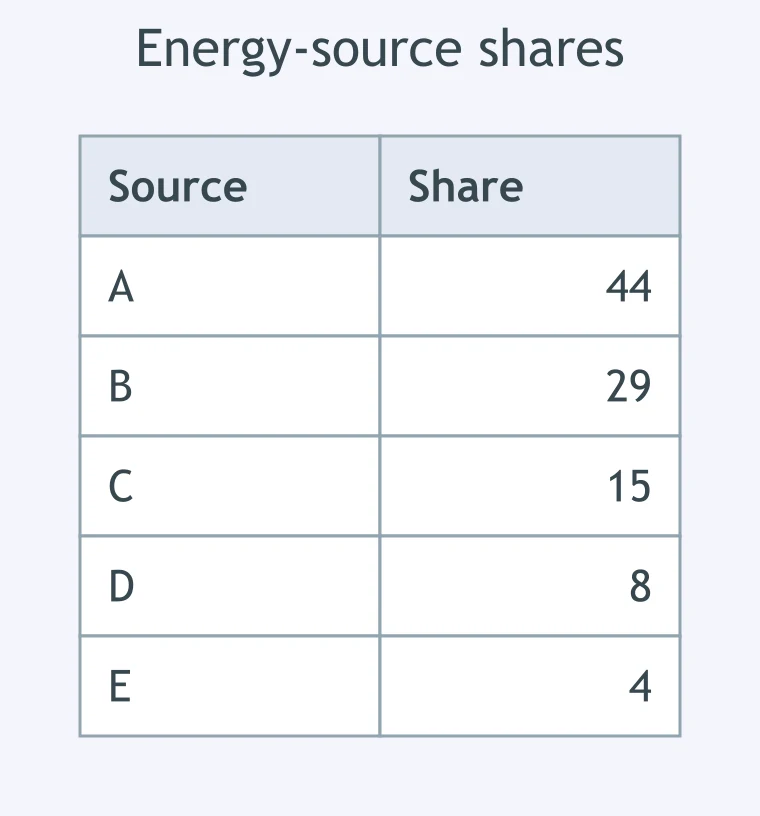
The table ranks five energy sources by share. Which statement is accurate?

Rapid Detail in Academic Contexts - IELTS 7.0 L
15 questions

Hedged and Qualified Statements - IELTS 7.0 L
15 questions

Tone: Certain, Doubtful or Reluctant? - IELTS 7.0 L
15 questions

Selecting Key Features: What to Leave Out - IELTS 7.0 W T1
25 questions

Overview Quality: Adequate versus Strong - IELTS 7.0 W T1
25 questions
Crack the passcode before the zombies get in.

Pick a tile, answer, hit bonuses and steals.