Loading
by BlastRoom
Practice using hazard data to forecast risks and reduce damage.
#us_grade_7_science
20 questions
One question set, multiple game modes. Tap any game to see it in action. Not sure which to pick?
Answer to place stones and capture territory.
Outrun the snow together.
Earn blasts, then hunt the other team.
Answer to earn energy, then climb.

The class blasts through walls together.
Bid on mystery lots. Most money wins.
Sell tours. Nice, standard, or a total scam.

Answer, restock, and serve the rush.
More correct answers pulls the rope your way.
Answer, then shoot down the alien wave.
Answer, then tap to leap the frozen ridge.
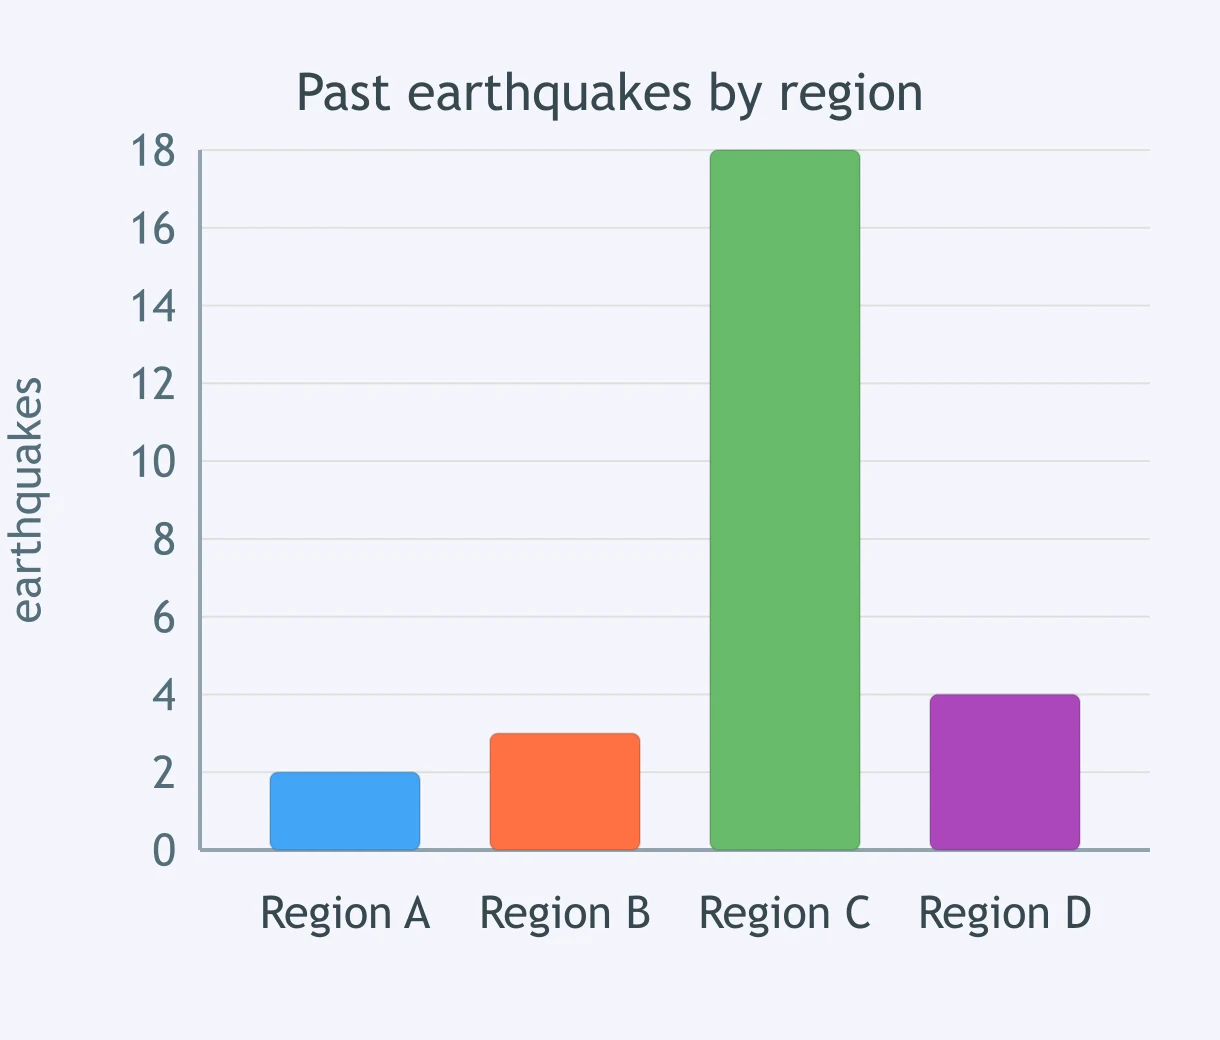
Use the bar graph of past earthquakes by region. Where is future earthquake risk highest?
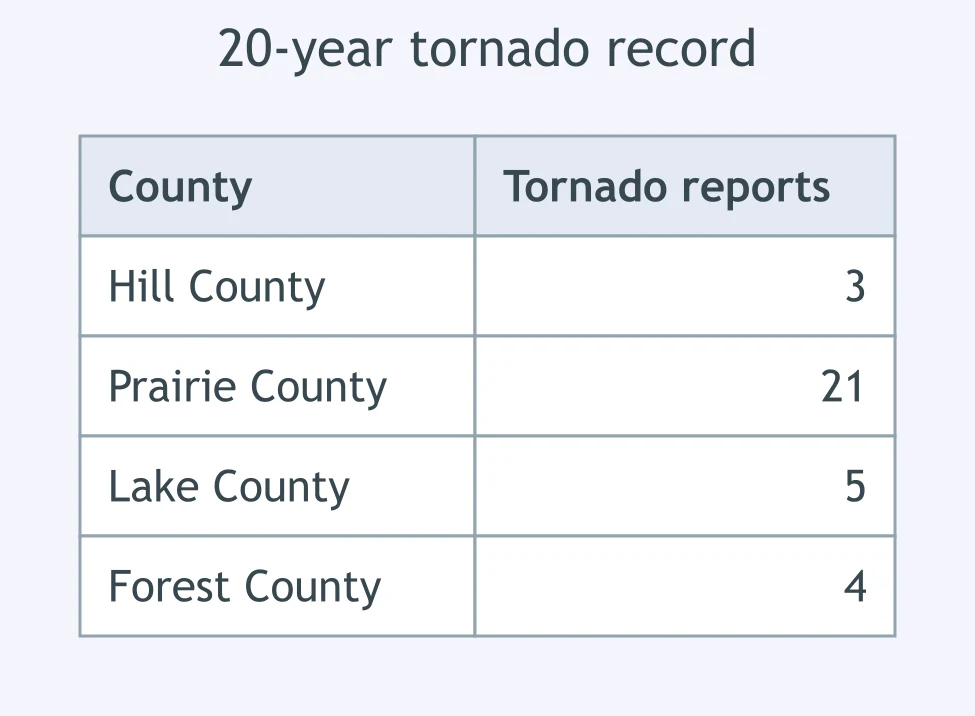
Use the tornado-record table. Which county has the highest future tornado risk based on past reports?
A volcano map shows young lava flows on the south and east flanks, and only ancient eroded flows on the north flank. Where is lava-flow risk higher?
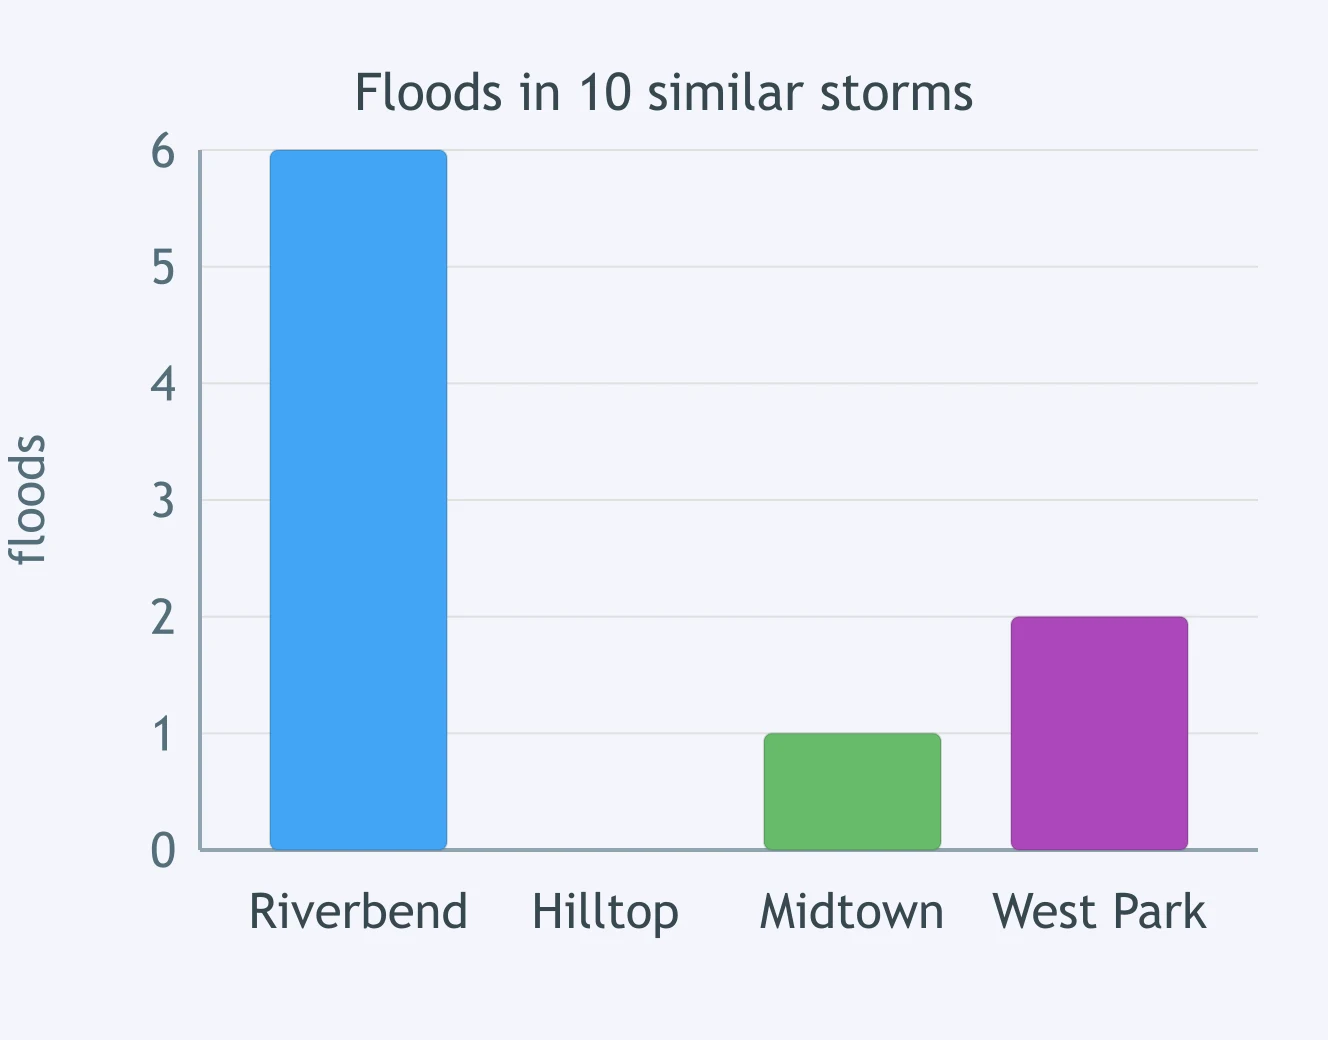
Use the flood-frequency graph. Which neighborhood is most likely to flood again during a similar storm?
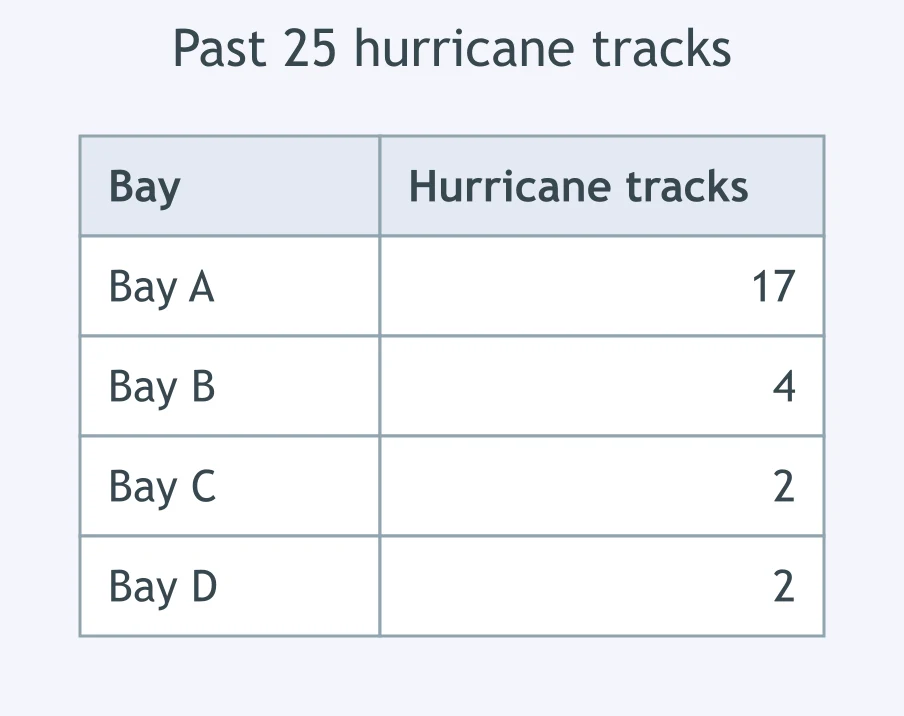
Use the hurricane-track table. Which bay has the greatest future hurricane exposure?
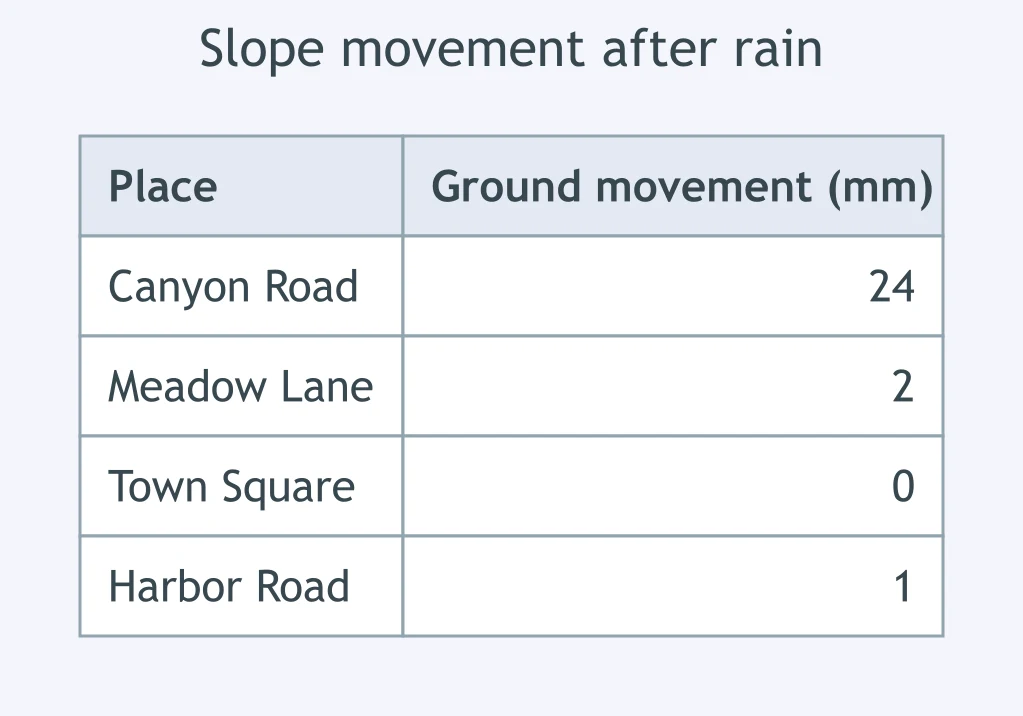
Use the slope-sensor table after heavy rain. Where is landslide risk highest?
A volcano erupted after gaps of 28, 35, 31, and 39 years. The last eruption was 34 years ago. What forecast is supported?
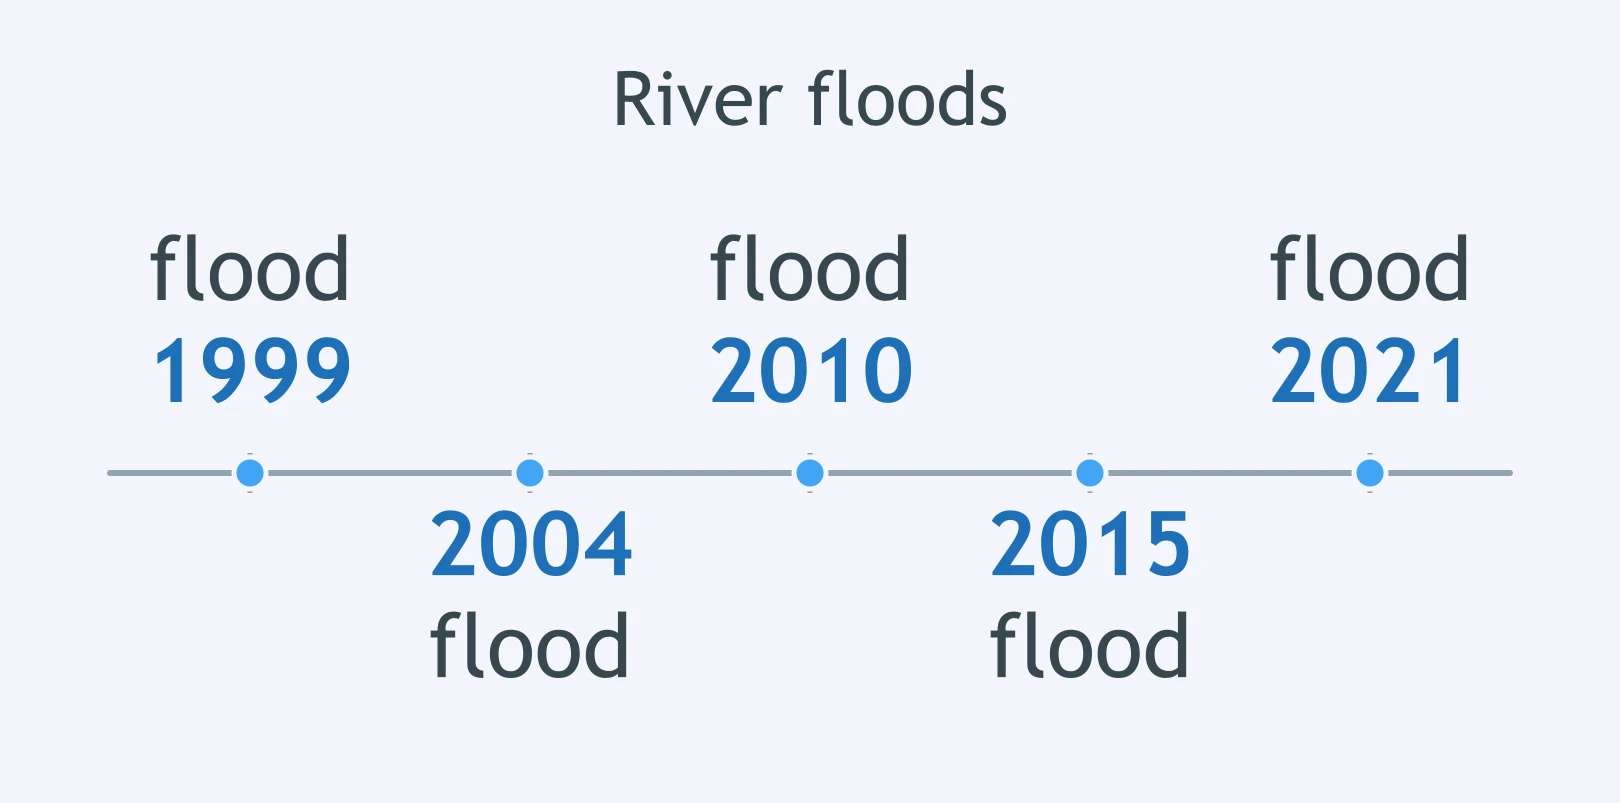
Use the river-flood timeline. What can scientists reasonably say about flood risk in 2026?
A fault has a 1% chance of a major earthquake each year. What does that probability mean for forecasting?
After 32 days with no rain and 18% humidity, forecasters issue a fire weather watch. What claim does the weather data support?
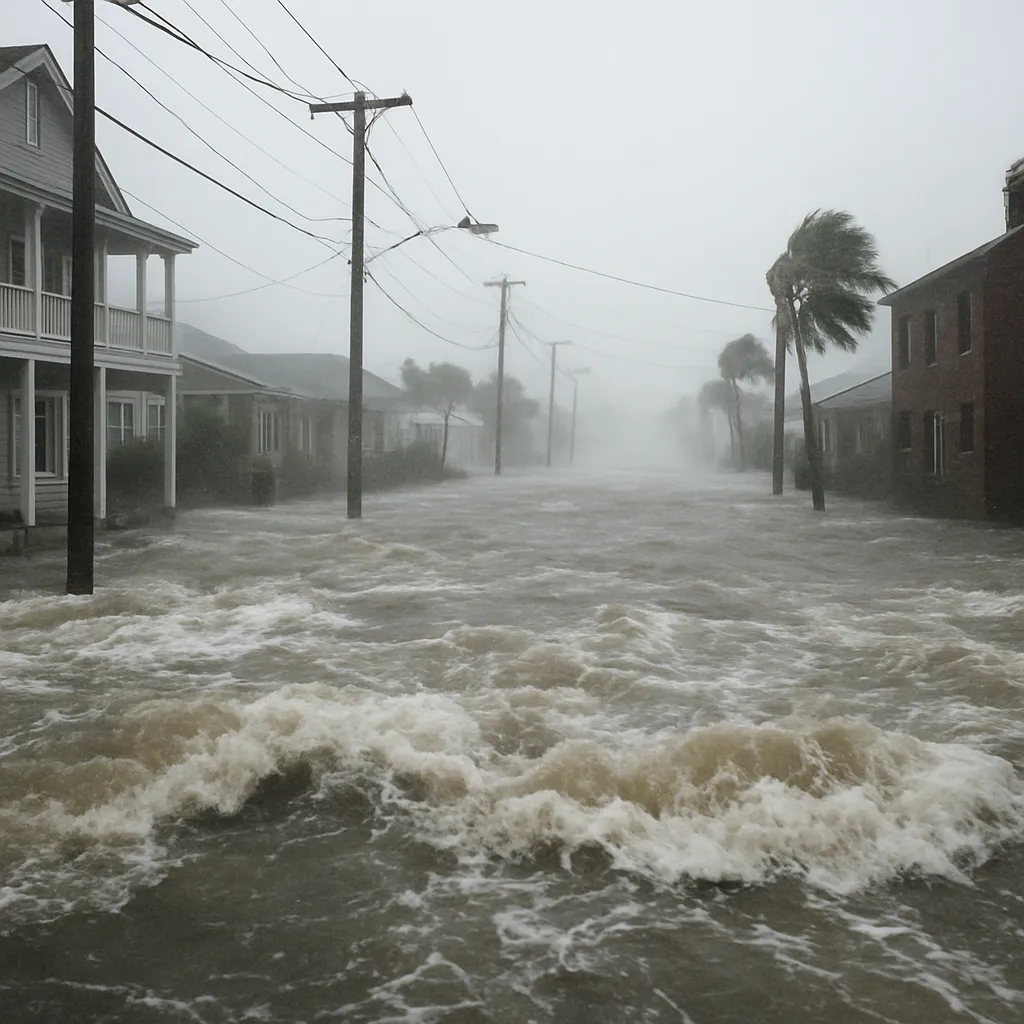
Flood maps show storm surge can reach 2 m on low coastal streets. What building change directly protects electrical systems?
Shaking maps place a school in a strong earthquake zone. What should engineers do to make the school safer?
A wildfire map shows homes touching dry brush at the edge of a canyon. What should homeowners do first to lower the chance that a fire reaches the homes?
A city's floodplain maps show the river often covers downtown blocks during spring floods. Where should a new emergency operations center be built?
Tsunami maps show that the low shore and the river valley are inside the inundation zone. Where should residents practice evacuating to?
Meteorologists show a hurricane forecast cone on a weather map. What does the cone communicate?
An earthquake hazard map shades a region as high risk for the next 50 years. What can the map not predict?
Radar detects rotation inside a severe thunderstorm, and a tornado warning is issued. What does the warning mean?
A volcano alert rises after more gas emissions and small earthquakes are measured under the volcano. What forecast statement fits the evidence?
A river crest forecast is lowered after the heaviest rain falls north of the river basin instead of inside it. Why was the predicted crest lowered?
Crack the passcode before the zombies get in.
Answer, then swat bugs for bonus points.
Race through questions at your own speed.
Same question on every screen. Fastest wins.

Pick a tile, answer, hit bonuses and steals.
Renewable and Nonrenewable Resources
40 questions