Loading
by BlastRoom
Interpret environmental data displayed in graphs, charts, and tables.
#environmental_science

20 questions
One question set, multiple game modes. Tap any game to see it in action. Not sure which to pick?
Answer to place stones and capture territory.
Outrun the snow together.
Earn blasts, then hunt the other team.
Answer to earn energy, then climb.

The class blasts through walls together.
Bid on mystery lots. Most money wins.
Sell tours. Nice, standard, or a total scam.

Answer, restock, and serve the rush.
More correct answers pulls the rope your way.
Answer, then shoot down the alien wave.
Answer, then tap to leap the frozen ridge.
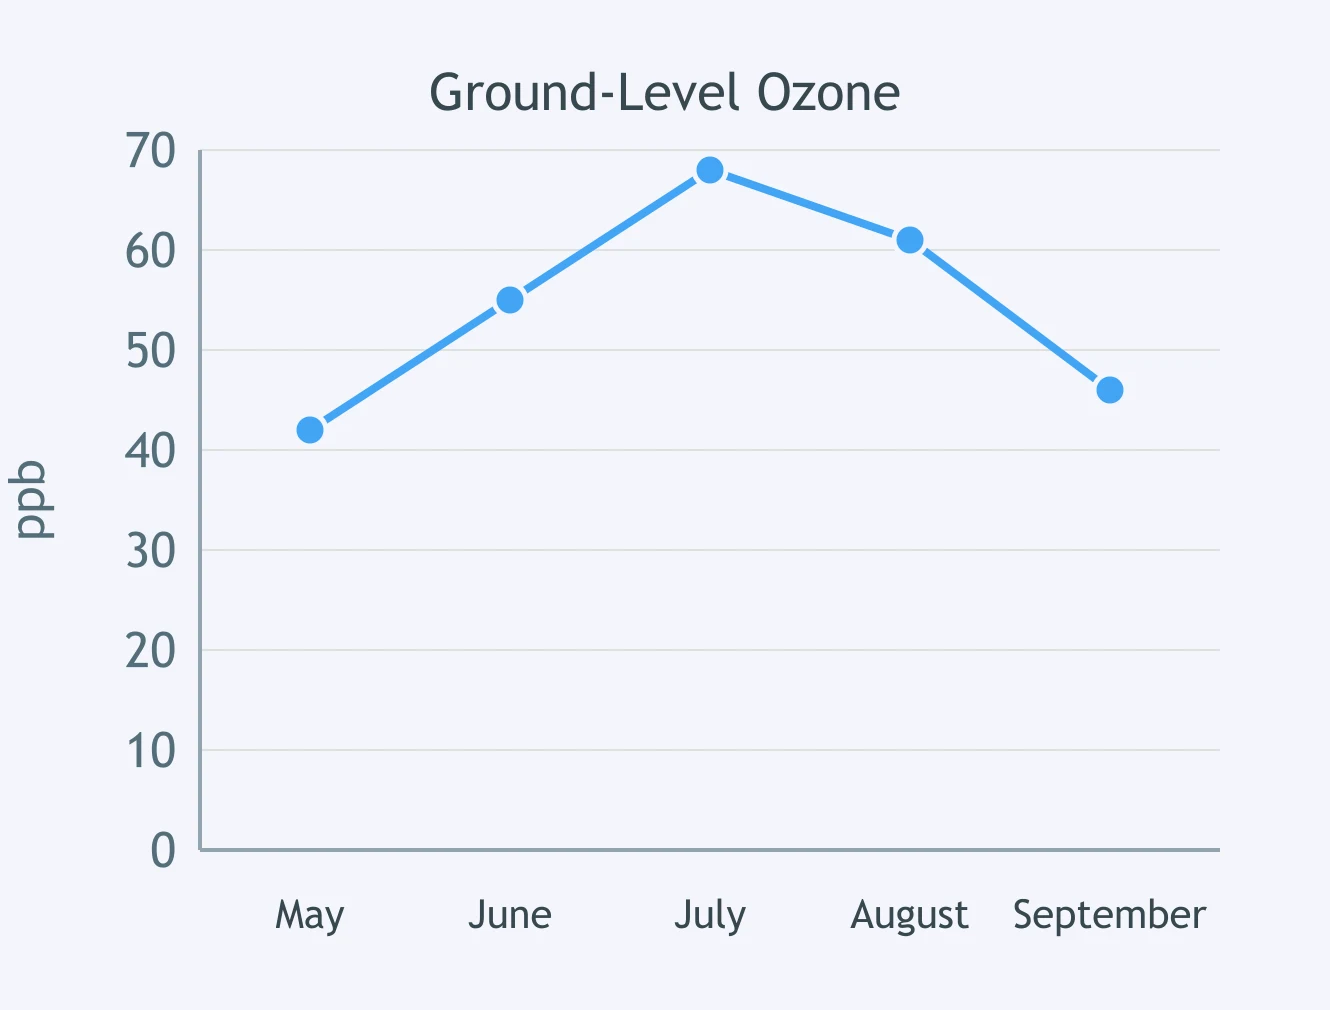
Use the line graph. In which month is the ozone concentration highest?
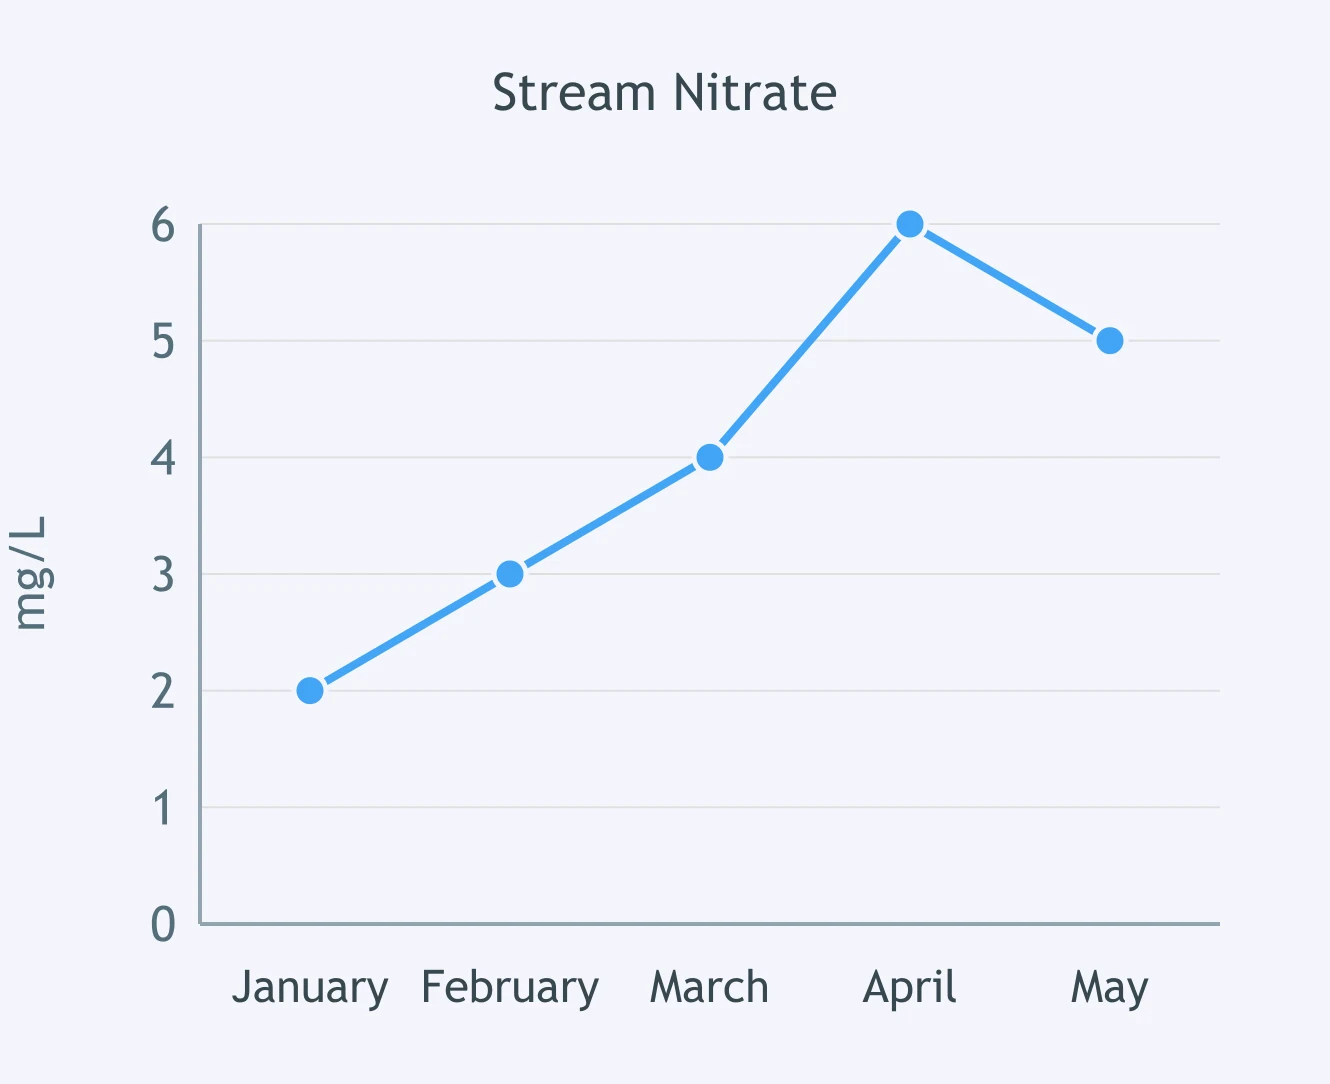
Use the line graph. What was the stream's nitrate concentration in April?
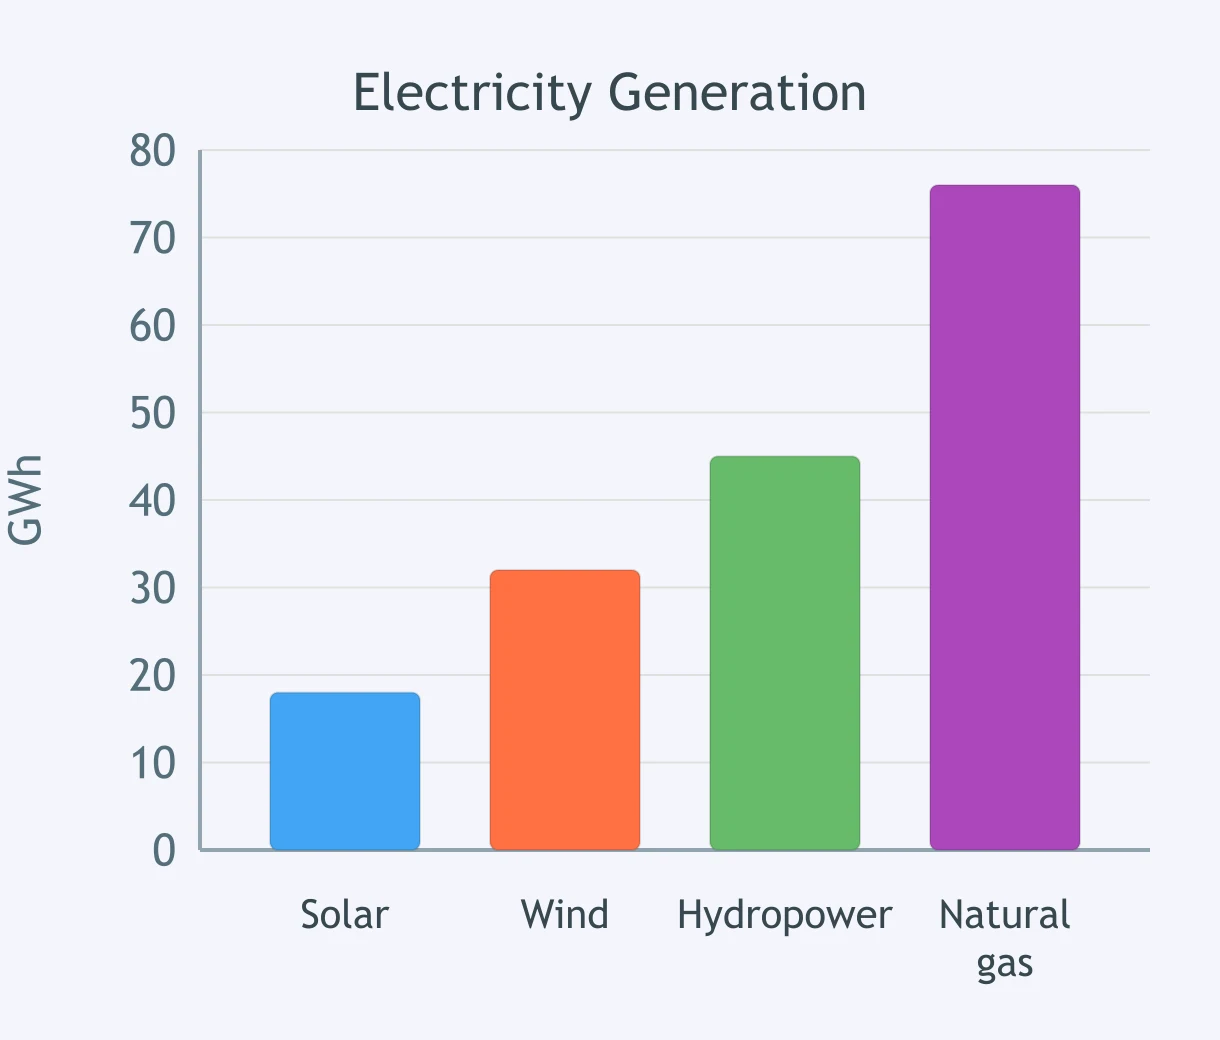
Use the bar graph. Which energy source generated the least electricity?
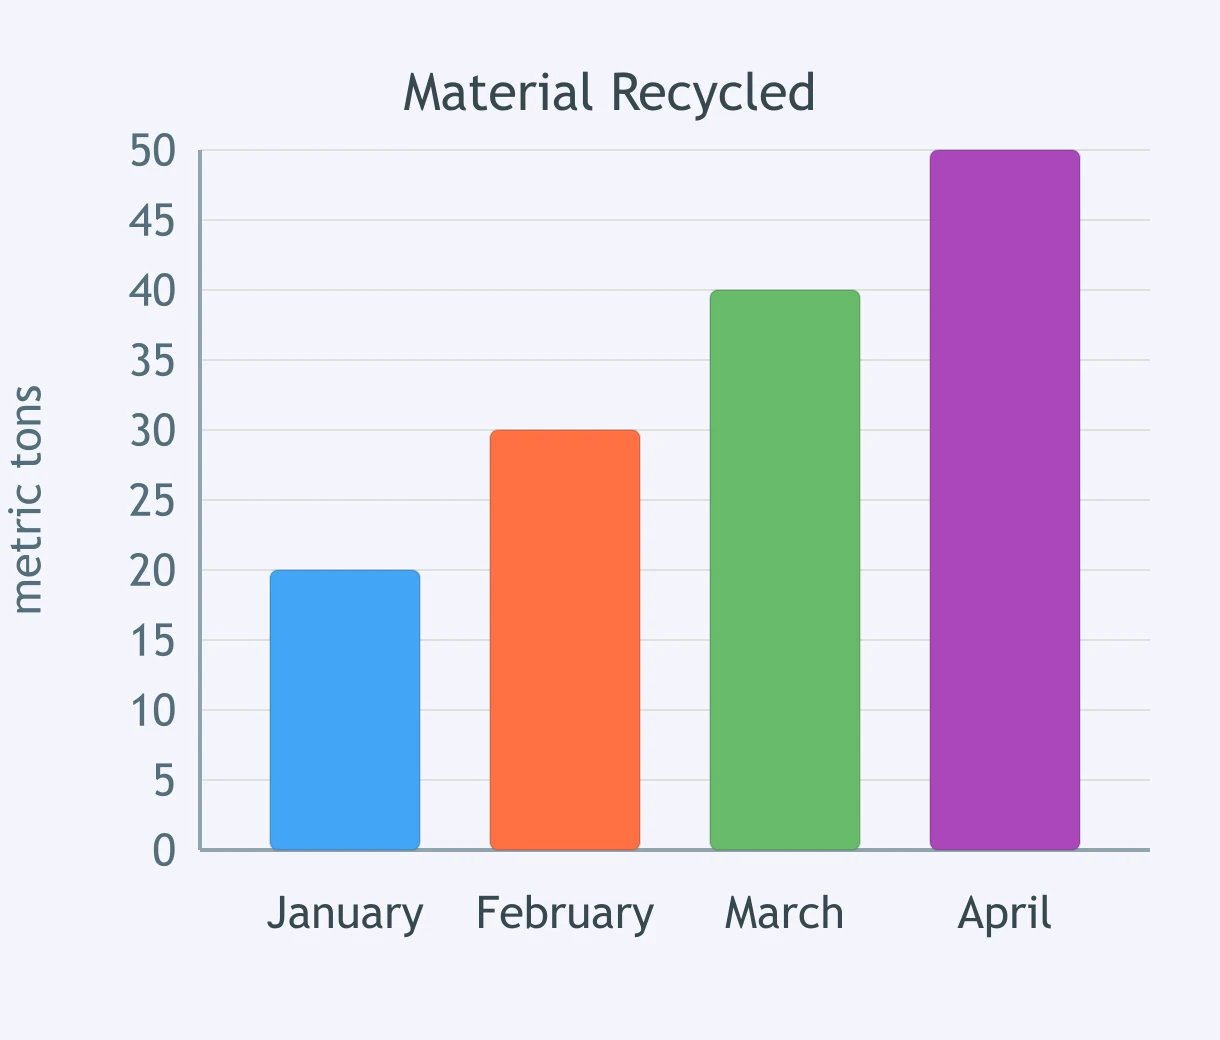
Use the bar graph. About how much municipal waste was recycled in March?
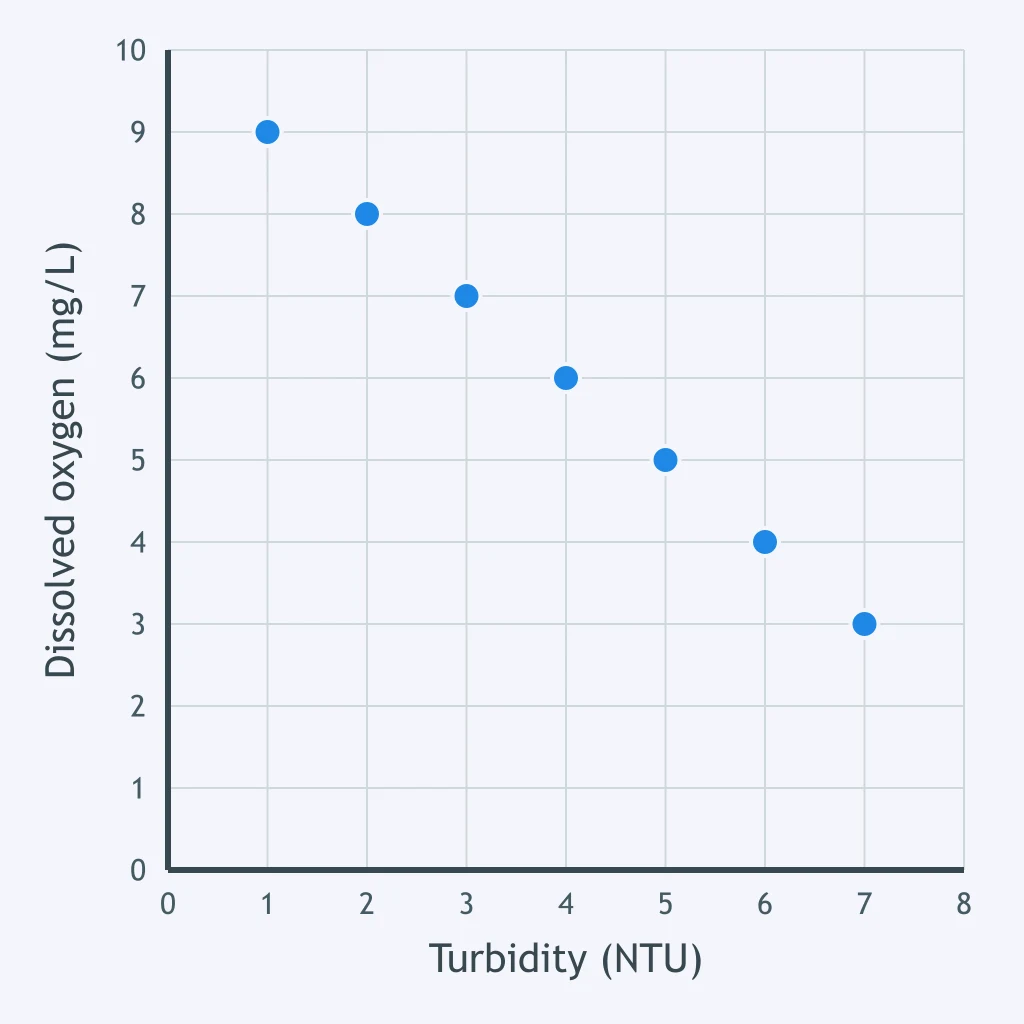
Use the scatterplot. At a turbidity of 6 NTU, what dissolved oxygen value is plotted?
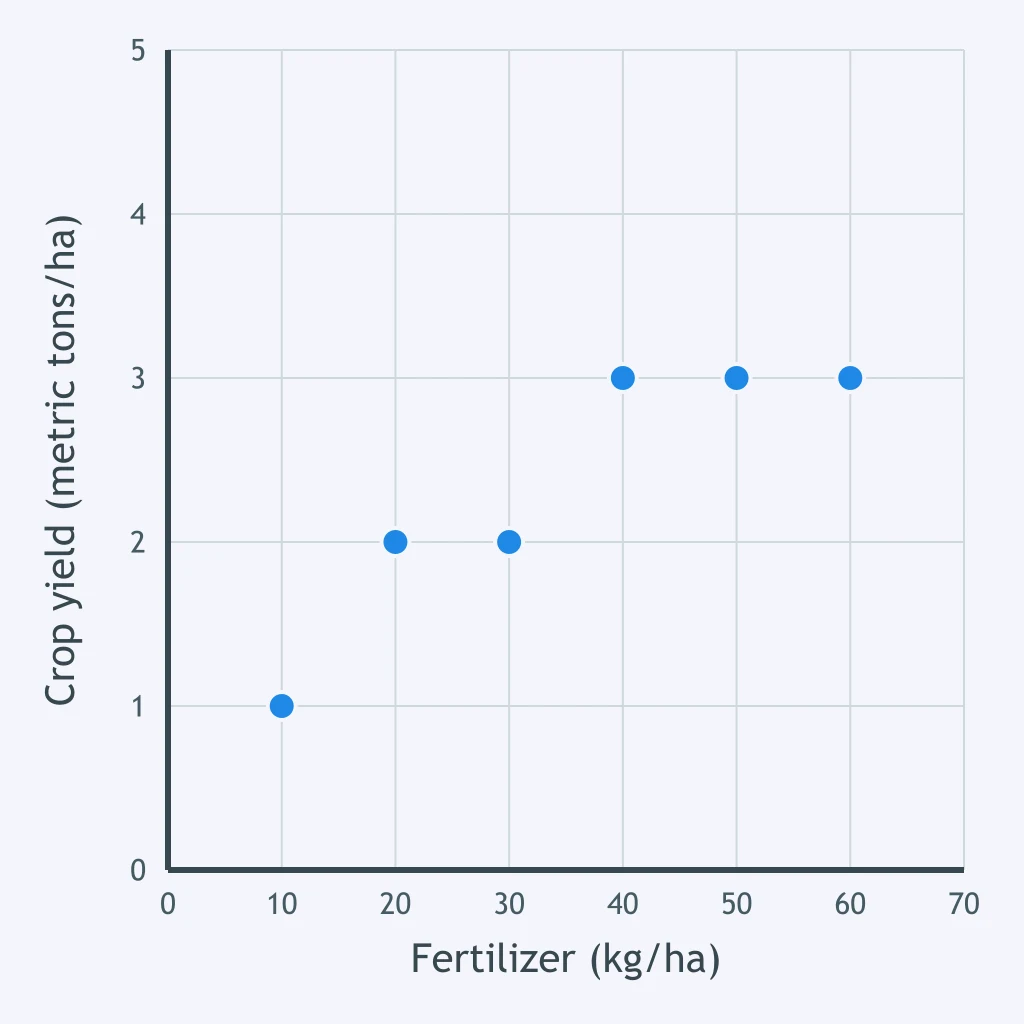
Use the scatterplot. At a fertilizer application rate of 40 kg/ha, which crop yield is shown?
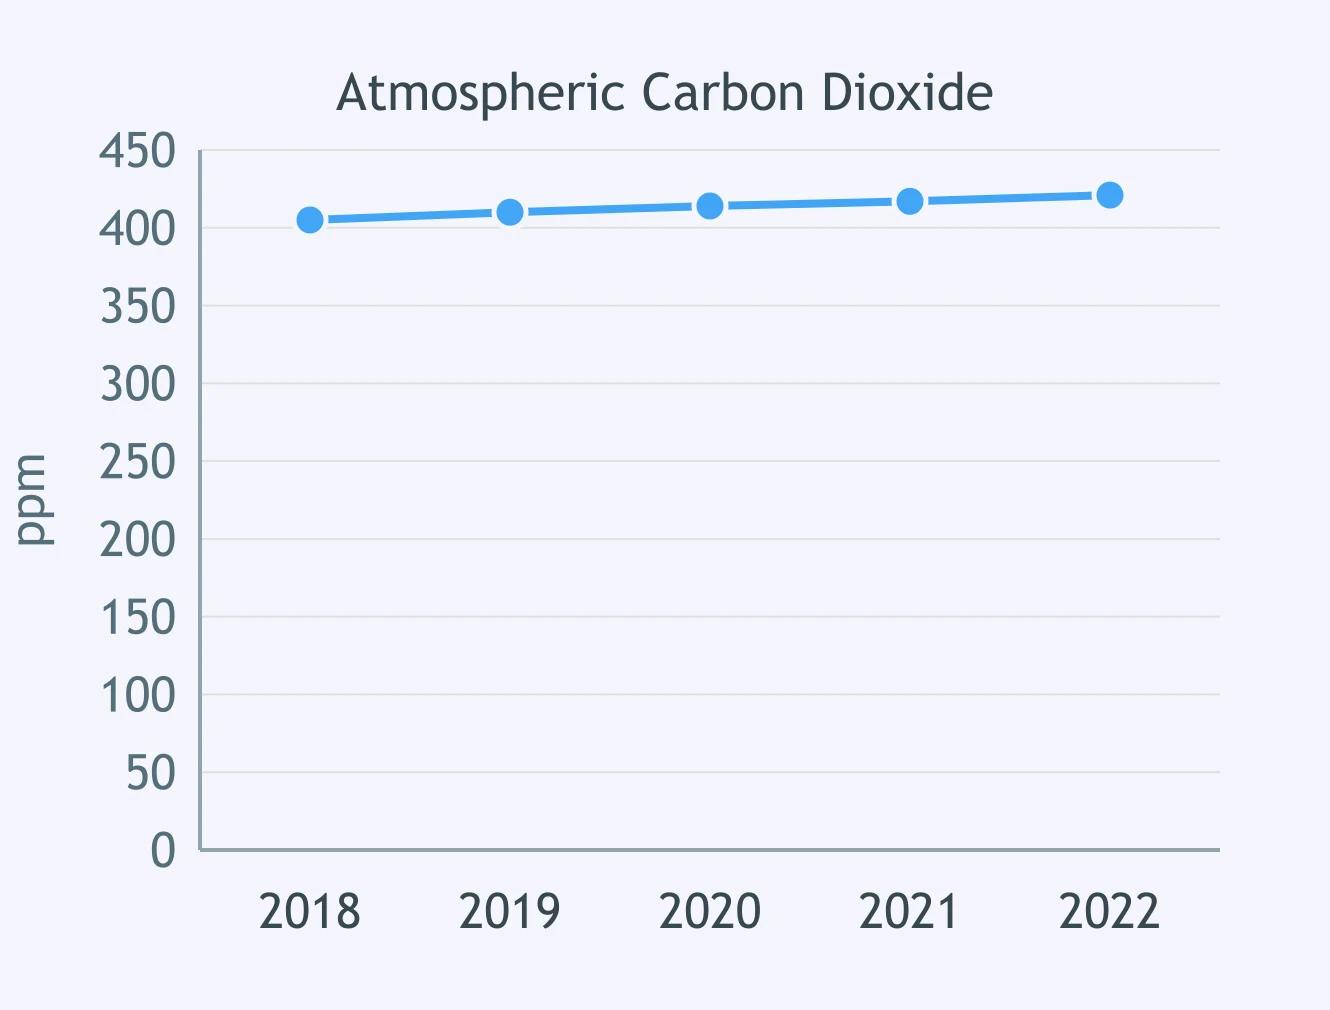
What overall pattern does the line graph show for atmospheric carbon dioxide during the years displayed?
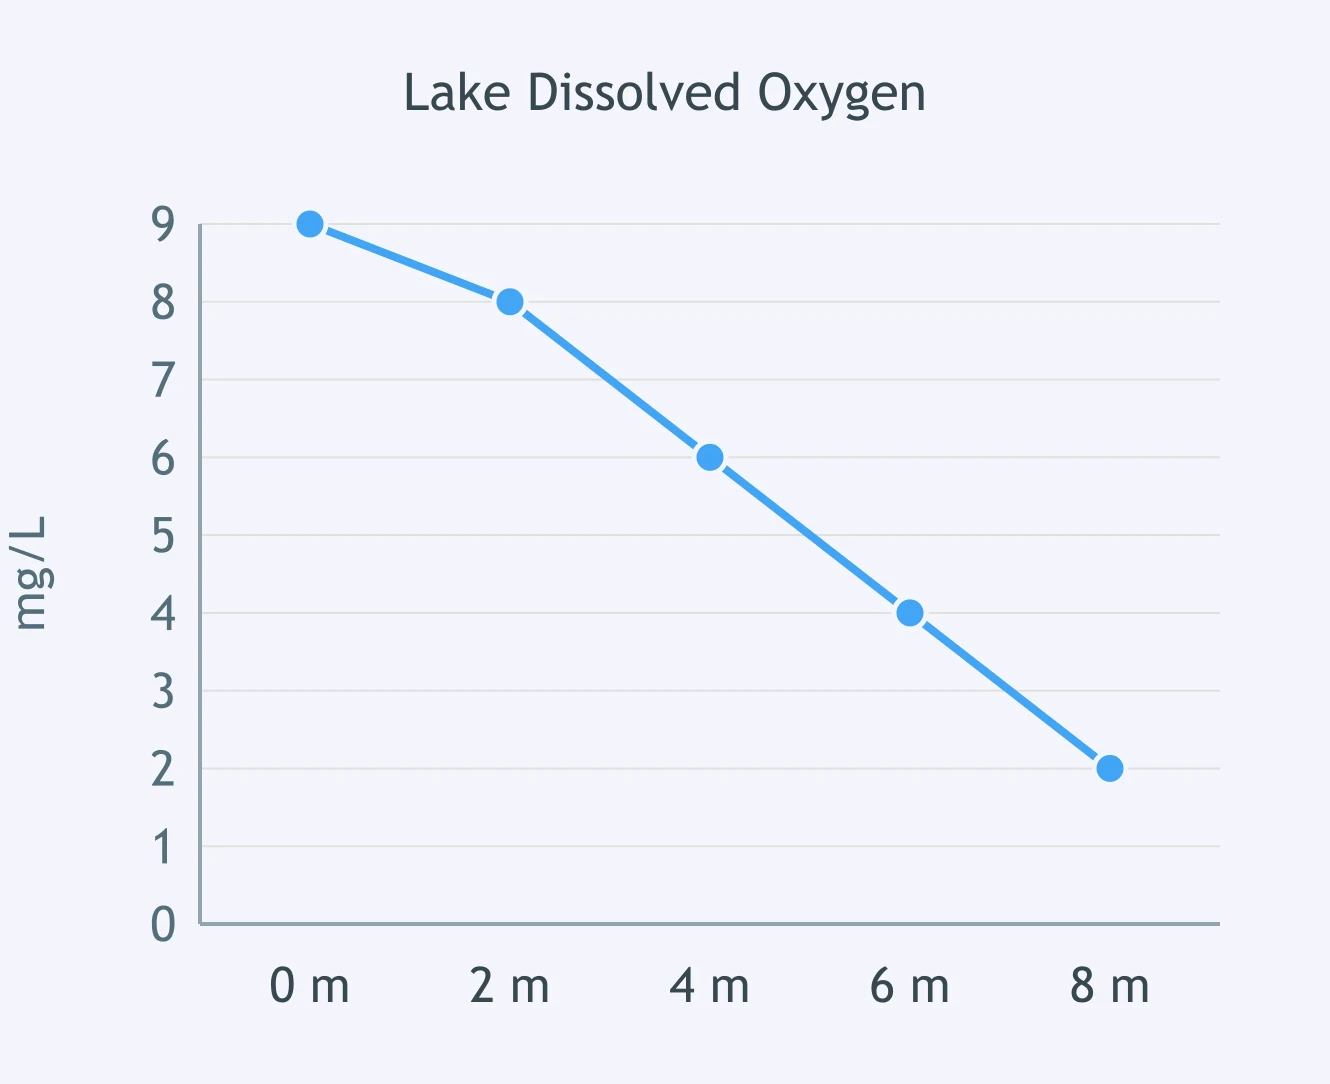
What trend is shown in this lake's dissolved oxygen readings as depth increases?
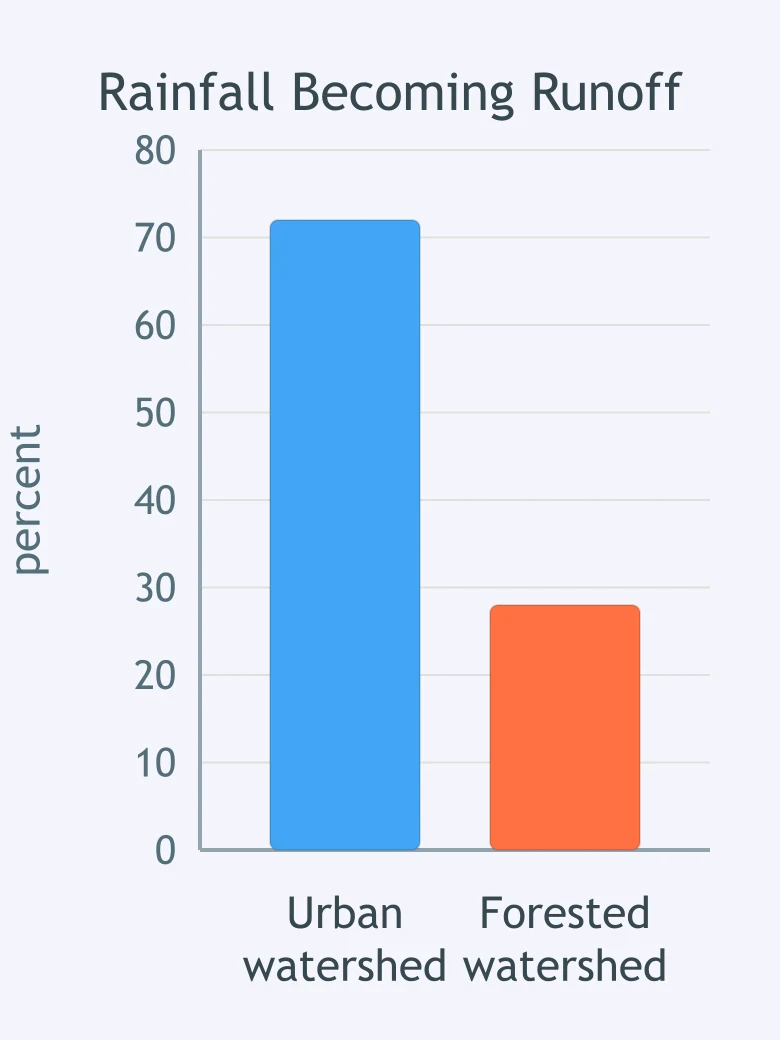
What comparison does the bar graph support about the two watersheds?
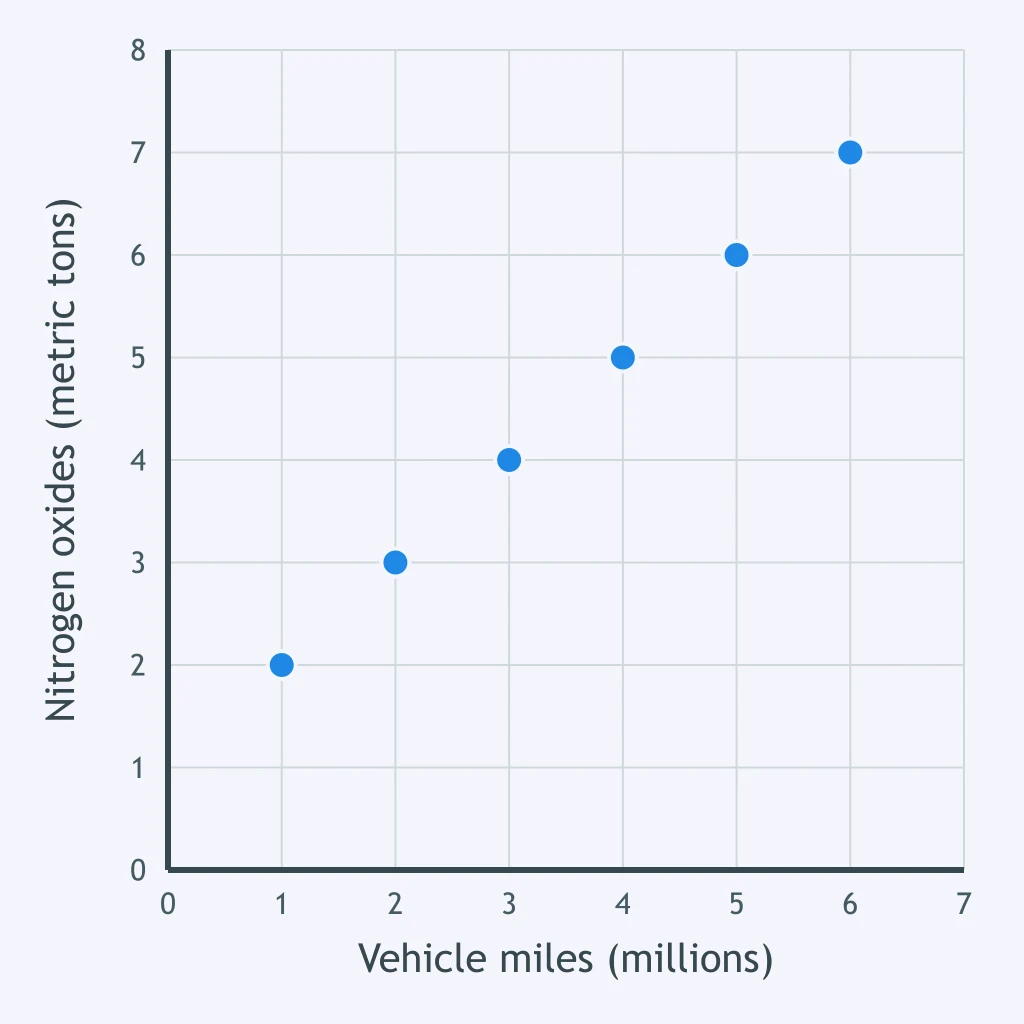
What relationship is suggested by the scatterplot of vehicle miles traveled and nitrogen oxide emissions?
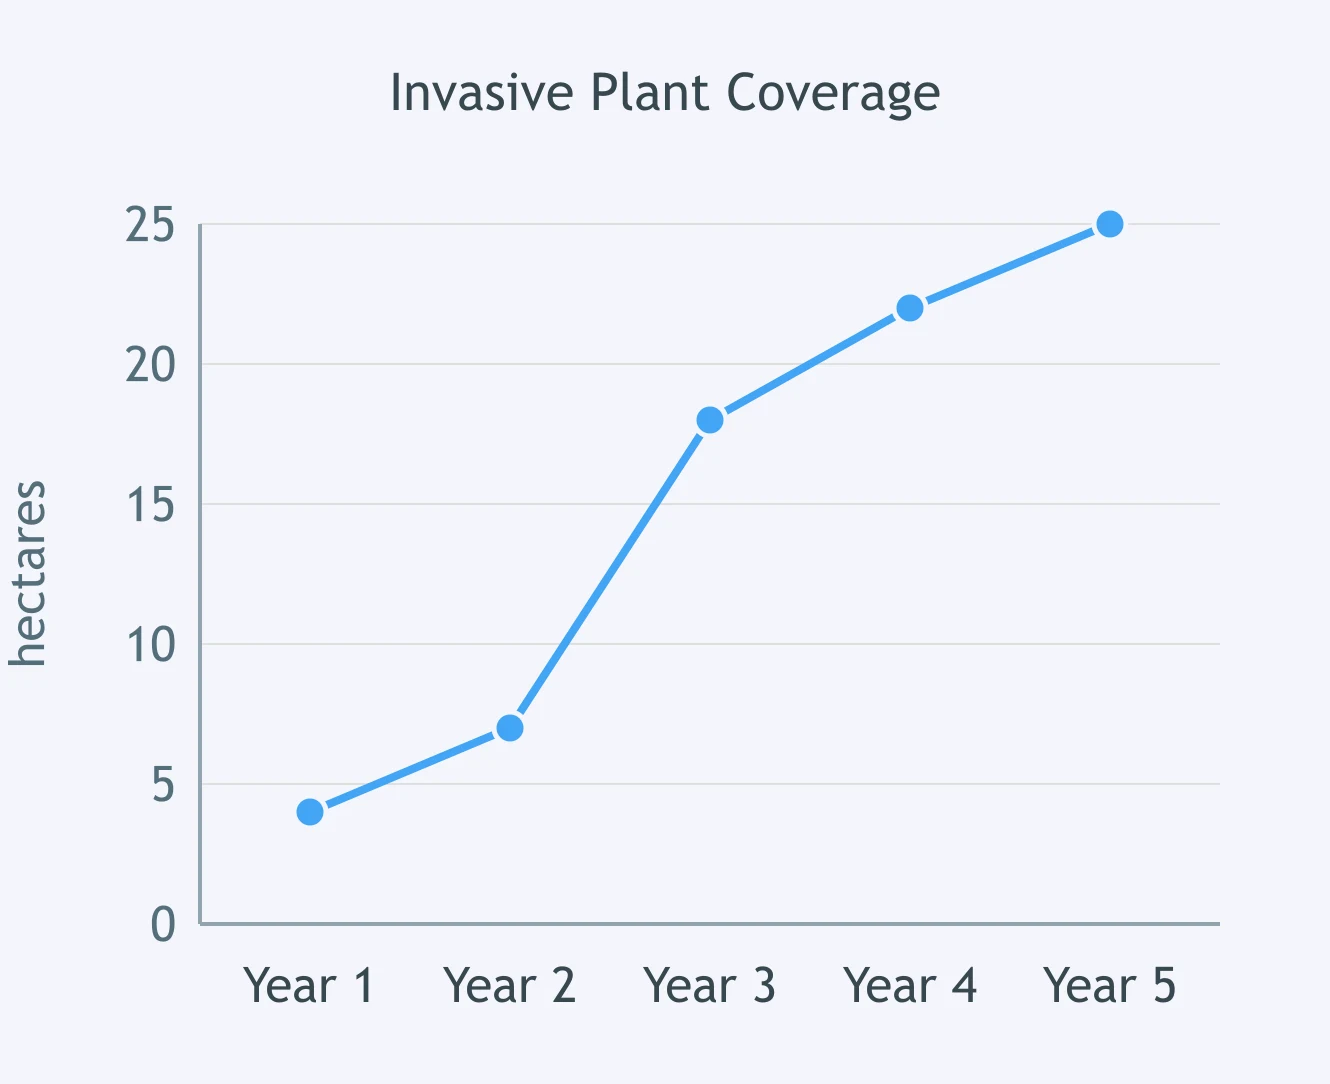
During which interval does the graph show the sharpest increase in the invasive plant's covered area?
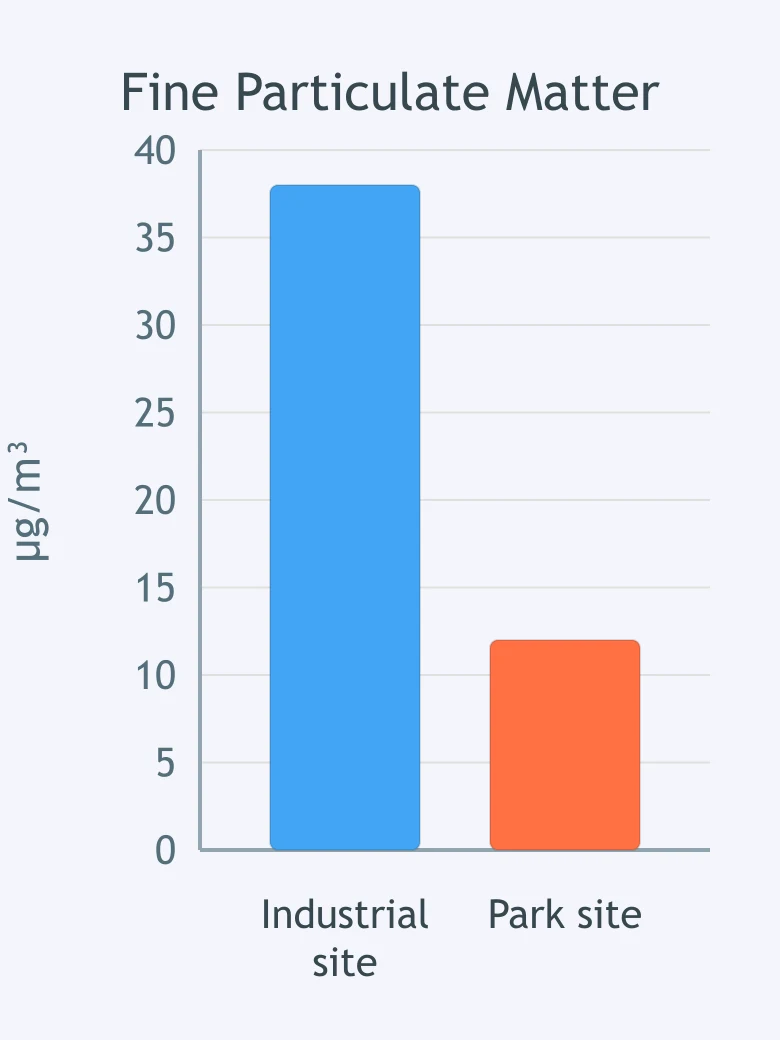
What does the bar graph indicate about particulate matter at the two monitoring sites?
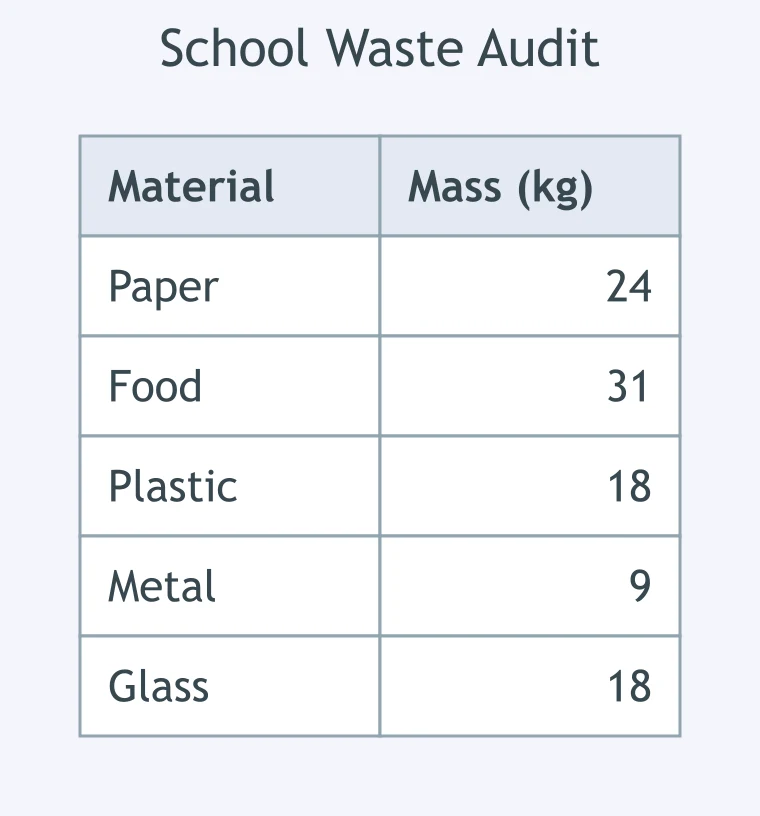
A class records the mass of paper, food, plastic, metal, and glass in a waste audit. Which display would best show each material's share of the total waste?
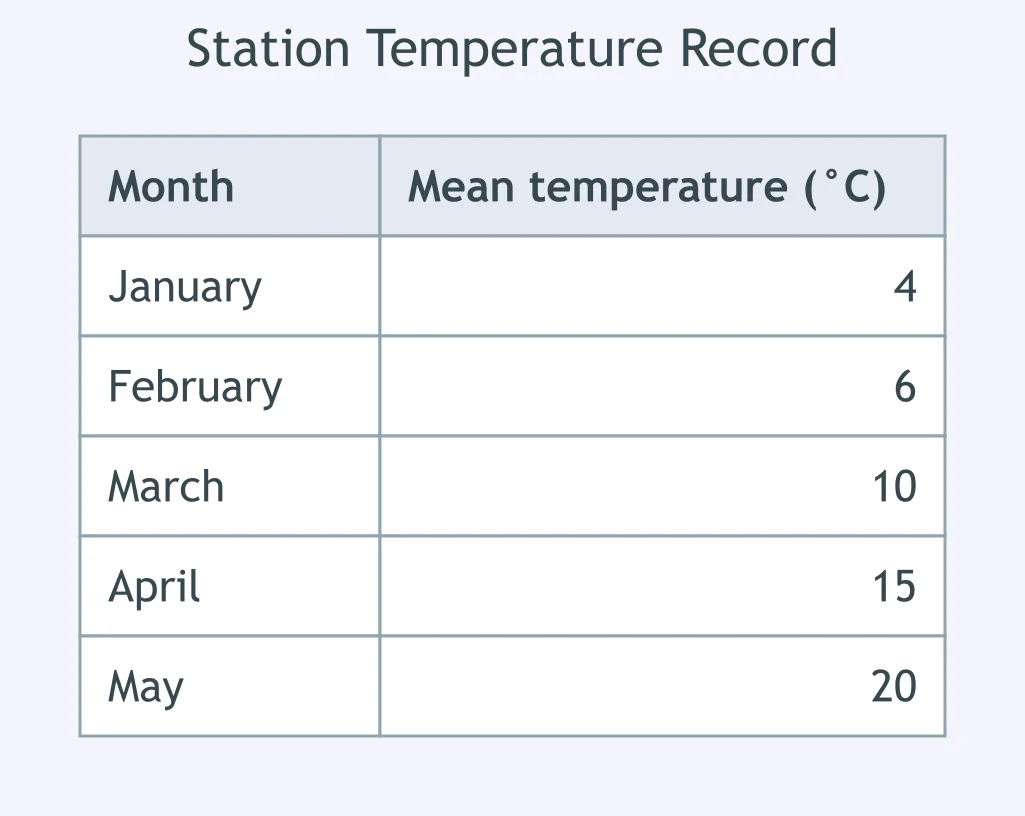
A researcher records monthly mean temperatures at one monitoring station. Which display would best show how temperature changes through the year?
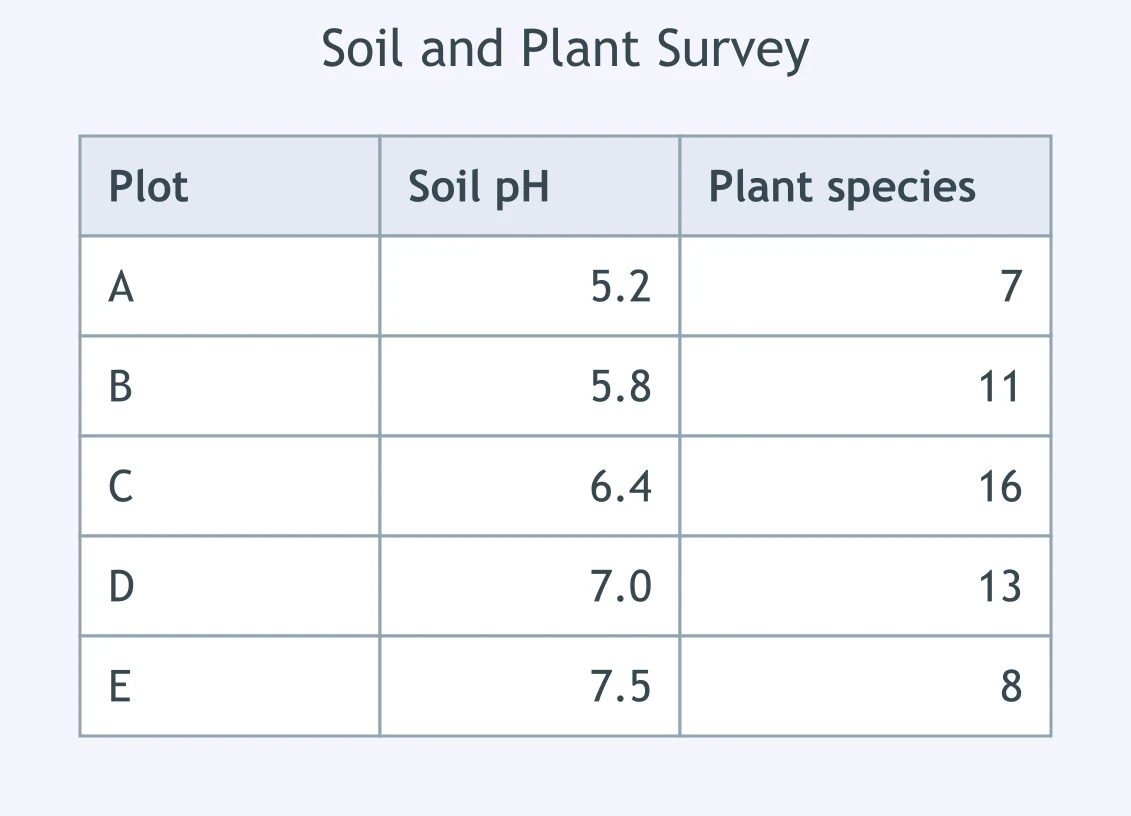
A field team measures soil pH and the number of plant species at several plots. Which display would best show their relationship?
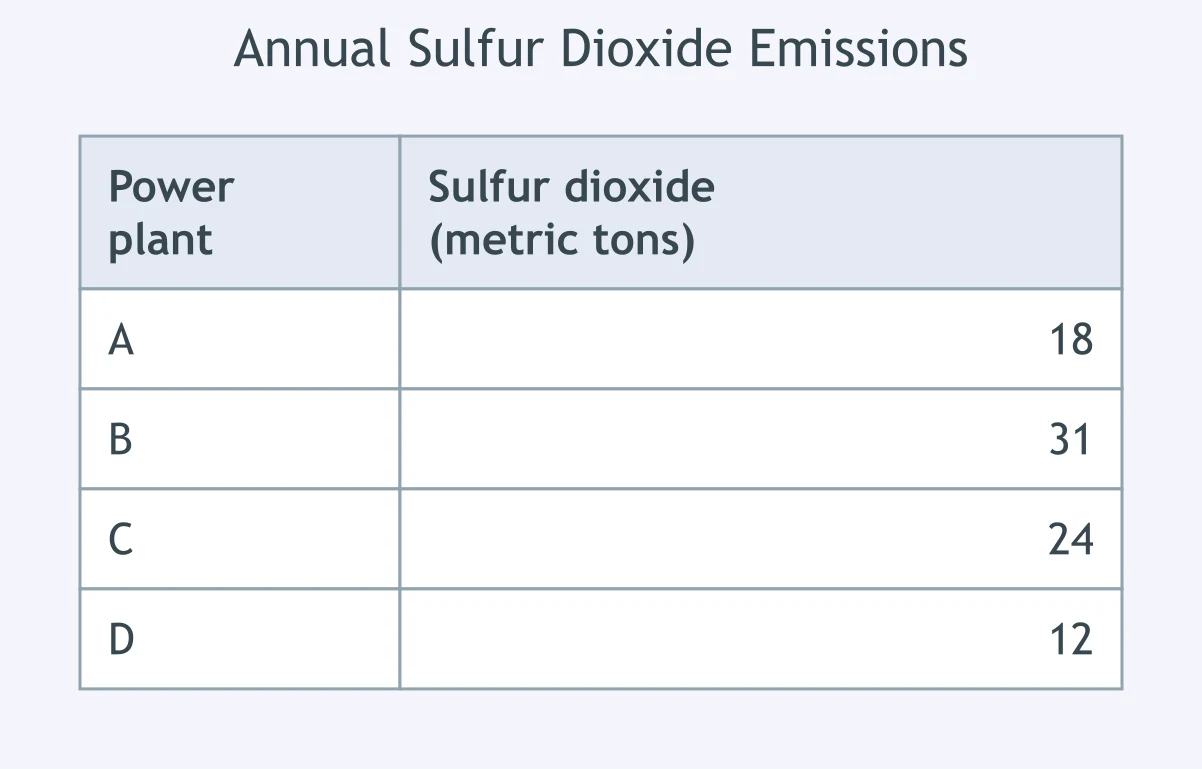
A county compares the amounts of sulfur dioxide released by four power plants in one year. Which display would best compare the plants?
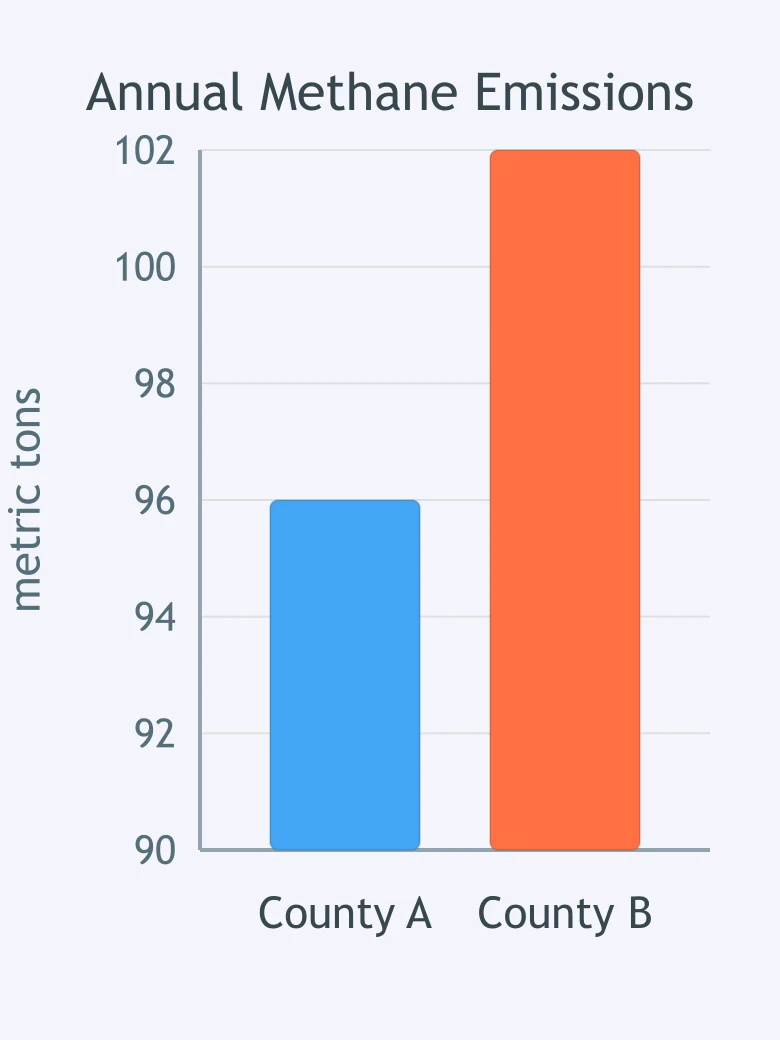
What is misleading about the bar graph's vertical axis?
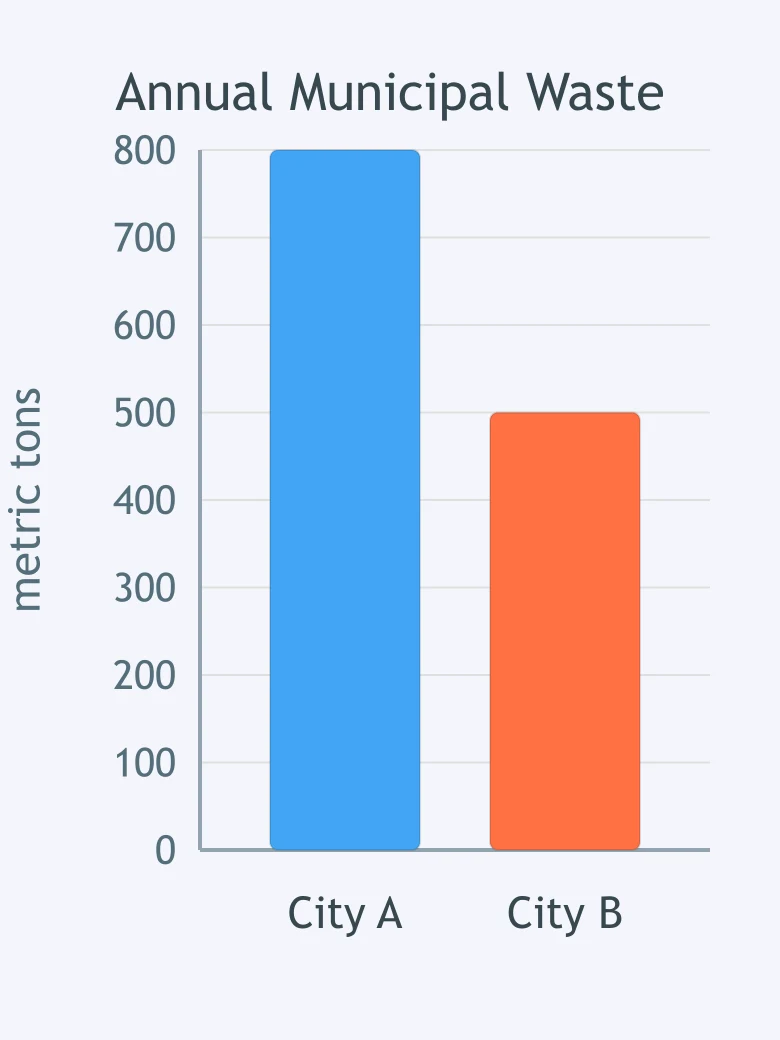
Why can this graph lead to an unfair comparison of the two cities' waste output?
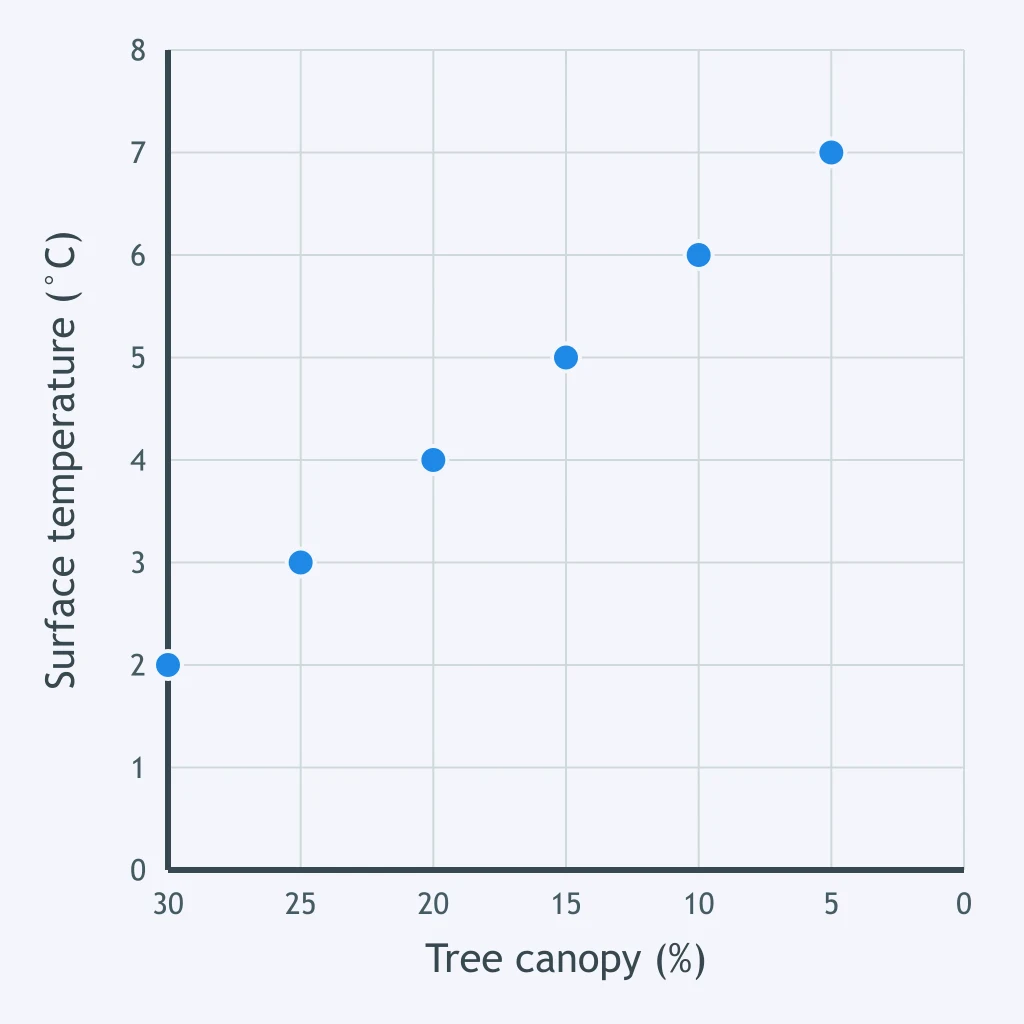
What feature of the scatterplot could cause a reader to misjudge the direction of the relationship if the axis labels are ignored?
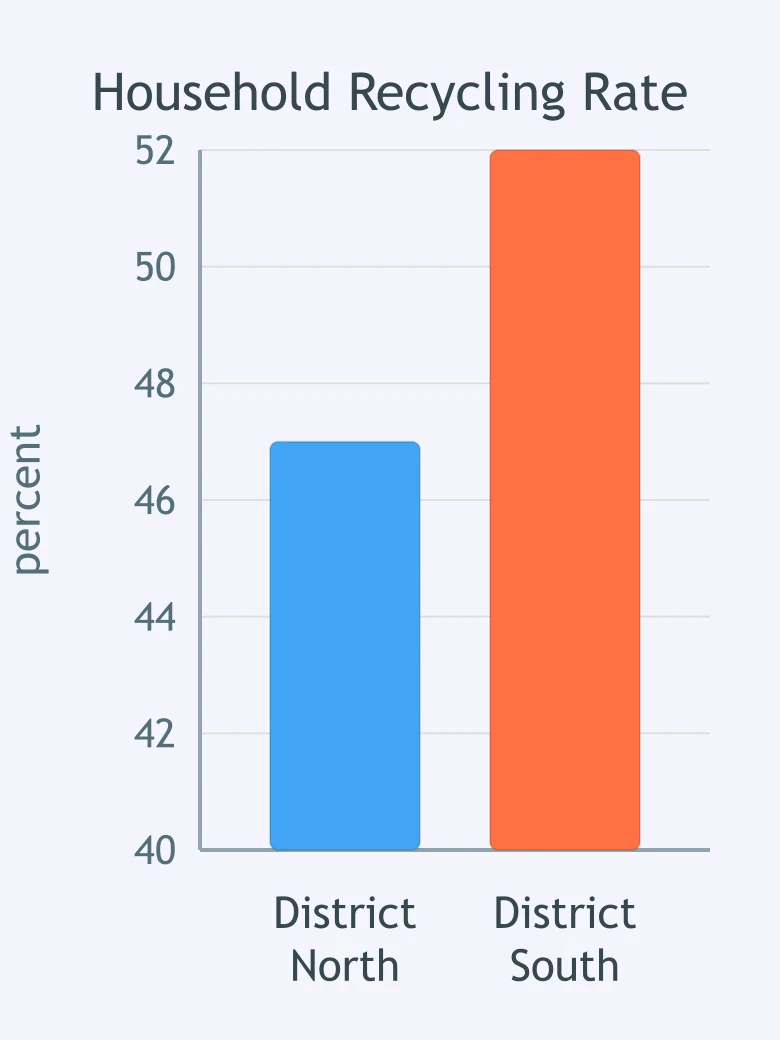
Why does the bar graph make the difference in recycling rates appear larger than it is?
Crack the passcode before the zombies get in.
Answer, then swat bugs for bonus points.
Race through questions at your own speed.
Same question on every screen. Fastest wins.

Pick a tile, answer, hit bonuses and steals.
Models, Uncertainty and Risk
20 questions