Loading
by BlastRoom
Evaluate environmental models, uncertainty statements, risk comparisons, and scientific claims.
#environmental_science
20 questions
One question set, multiple game modes. Tap any game to see it in action. Not sure which to pick?
Answer to place stones and capture territory.
Outrun the snow together.
Earn blasts, then hunt the other team.
Answer to earn energy, then climb.

The class blasts through walls together.
Bid on mystery lots. Most money wins.
Sell tours. Nice, standard, or a total scam.

Answer, restock, and serve the rush.
More correct answers pulls the rope your way.
Answer, then shoot down the alien wave.
Answer, then tap to leap the frozen ridge.
A watershed model uses rainfall, slope, and last year's land-cover map to predict flooding. A new parking lot is built after the map was made. What limits the model's prediction most?
An air-quality model combines factory emissions, wind direction, and valley topography. What can its output most directly support?
A population model projects a town's population using constant birth, death, and migration rates. Which conclusion is justified?
A lake model predicts 30% less phosphorus entering a lake if fertilizer application is reduced. What does this model result support?
A species-distribution model uses projected temperature and precipitation to map future suitable habitat. What claim can it support?
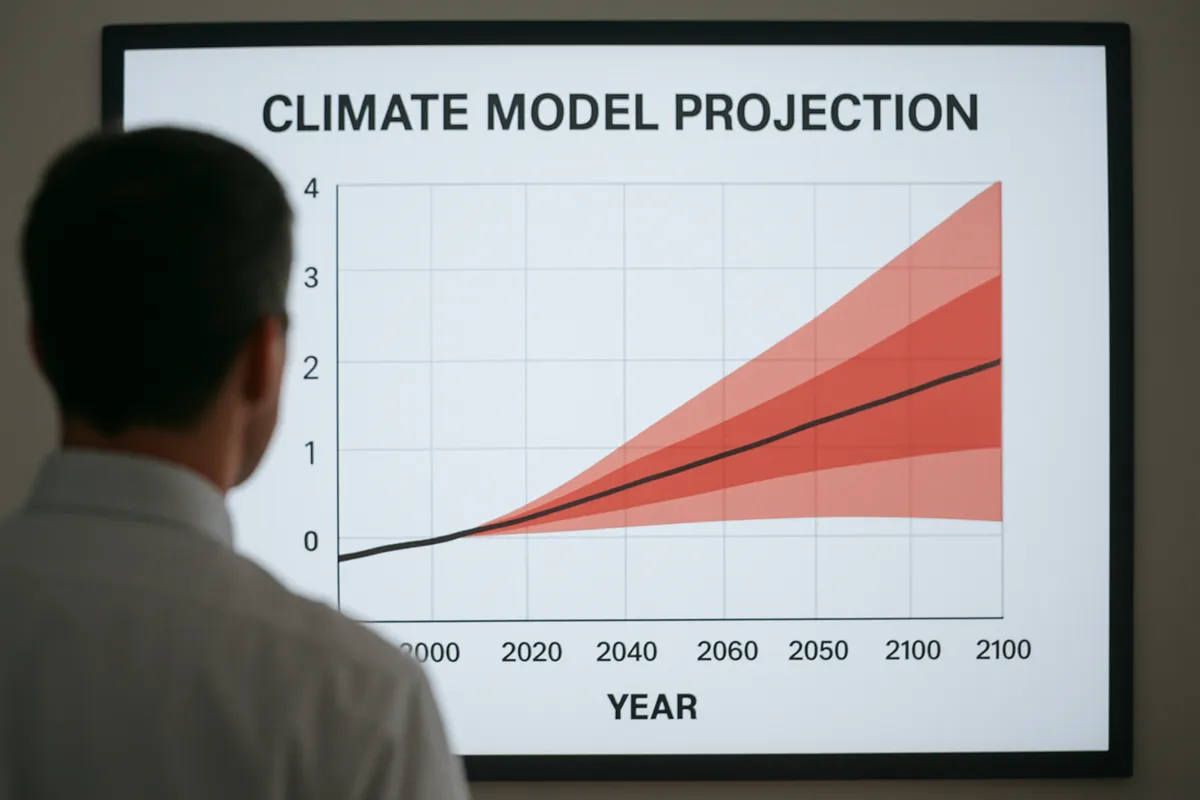
Climate models are run under several greenhouse-gas emissions pathways. What is an appropriate use of comparing their outputs?
A sea-level projection for one emissions pathway is 0.4 to 0.8 meters by 2100. What does this range express?
A laboratory reports a nitrate concentration of 12 ± 2 mg/L. How should this result be interpreted?
A drought model estimates a 10% to 25% chance of water restrictions next summer. What does the wide range indicate?
Two models using the same emissions pathway project warming of 1.5 to 2.1 °C. What is one reason their projections can differ?
A monitoring report gives a 95% confidence interval of 4 to 6 mg/L for Site A and 5 to 7 mg/L for Site B. What conclusion is supported by these intervals alone?
Hazard A is very likely but causes small harm each time; Hazard B is rare but can cause severe harm. How should their risks be compared?
Chemical A has an LD50 of 50 mg/kg, while Chemical B has an LD50 of 500 mg/kg. Chemical A is used at one-tenth the concentration of B. How should managers compare their risks?
Farm A has a 50% yearly chance of losing 1 metric ton of sediment. Farm B has a 5% yearly chance of losing 30 metric tons. Based on expected annual sediment loss, which farm has greater risk?
A pipeline rupture has a 2% annual chance and a $5 million cleanup cost. A recurring leak has a 40% annual chance and a $100,000 cleanup cost. Which has the larger expected annual cleanup cost?
A safety model estimates a 0.01 annual probability that a containment failure would kill 1,000 fish. What is the model's expected annual fish loss from this hazard?
A report says its flood-risk projection was peer-reviewed and includes its data, methods, and assumptions. A company summary gives a projection but shows no methods or data. Why is the first report more reliable?
A watershed model projects nitrogen runoff for 2035. What evidence would most directly strengthen confidence that the model is reliable?
A website claims a river is safe for the entire year based on two water samples collected in July. What is the main reliability problem with this claim?
Two groups publish wildfire-risk projections. One releases its raw data and analysis code, and the other releases only its conclusion. What makes the first projection more trustworthy?
Crack the passcode before the zombies get in.
Answer, then swat bugs for bonus points.
Race through questions at your own speed.
Same question on every screen. Fastest wins.

Pick a tile, answer, hit bonuses and steals.
Water Quality Testing
30 questions