Loading
by BlastRoom
Age Structure Diagrams for high school Environmental Science, on-level and AP. Covers AP Environmental Science Unit 3: Populations.
#environmental_science
20 questions
One question set, multiple game modes. Tap any game to see it in action. Not sure which to pick?
Answer to place stones and capture territory.
Outrun the snow together.
Earn blasts, then hunt the other team.
Answer to earn energy, then climb.

The class blasts through walls together.
Bid on mystery lots. Most money wins.
Sell tours. Nice, standard, or a total scam.

Answer, restock, and serve the rush.
More correct answers pulls the rope your way.
Answer, then shoot down the alien wave.
Answer, then tap to leap the frozen ridge.
Use the diagram. What does this age structure imply about population size in coming decades?
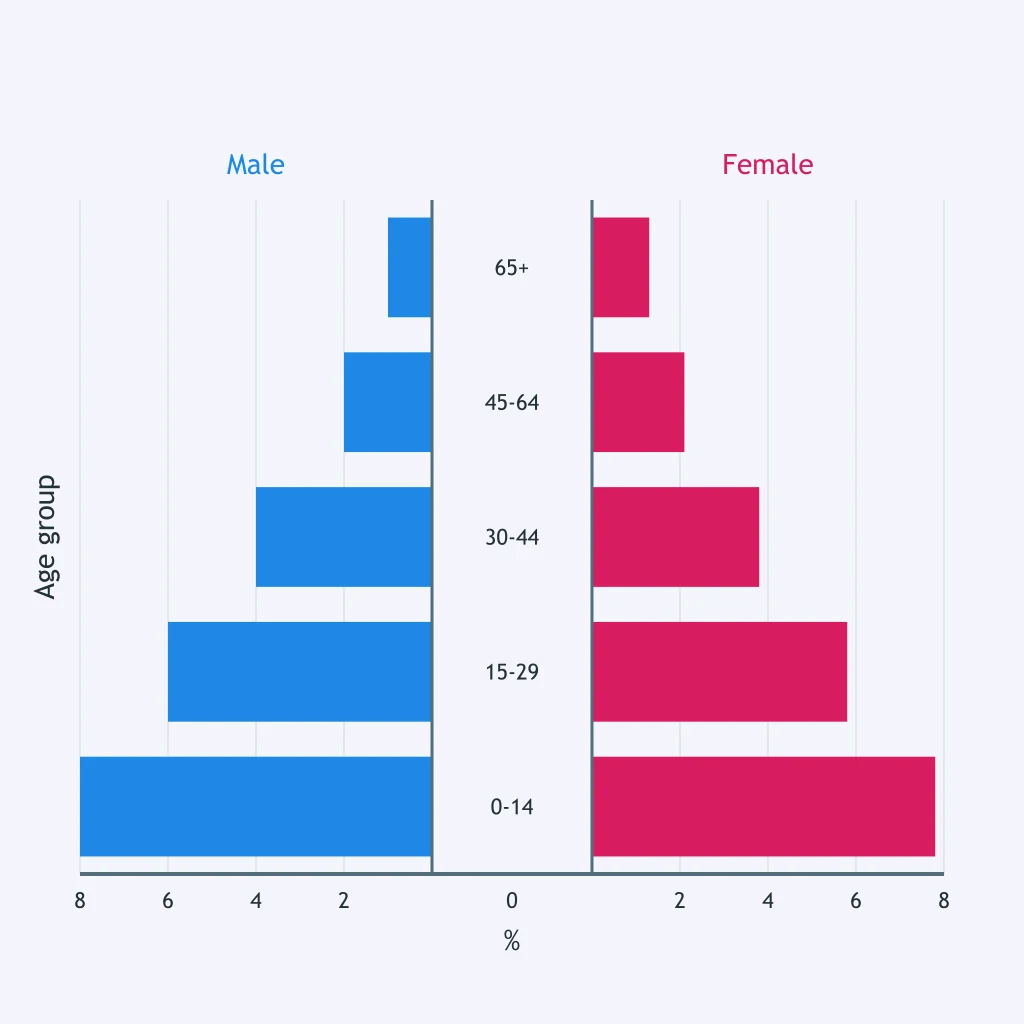
Use the diagram. Which growth pattern is most likely if fertility and mortality remain similar?
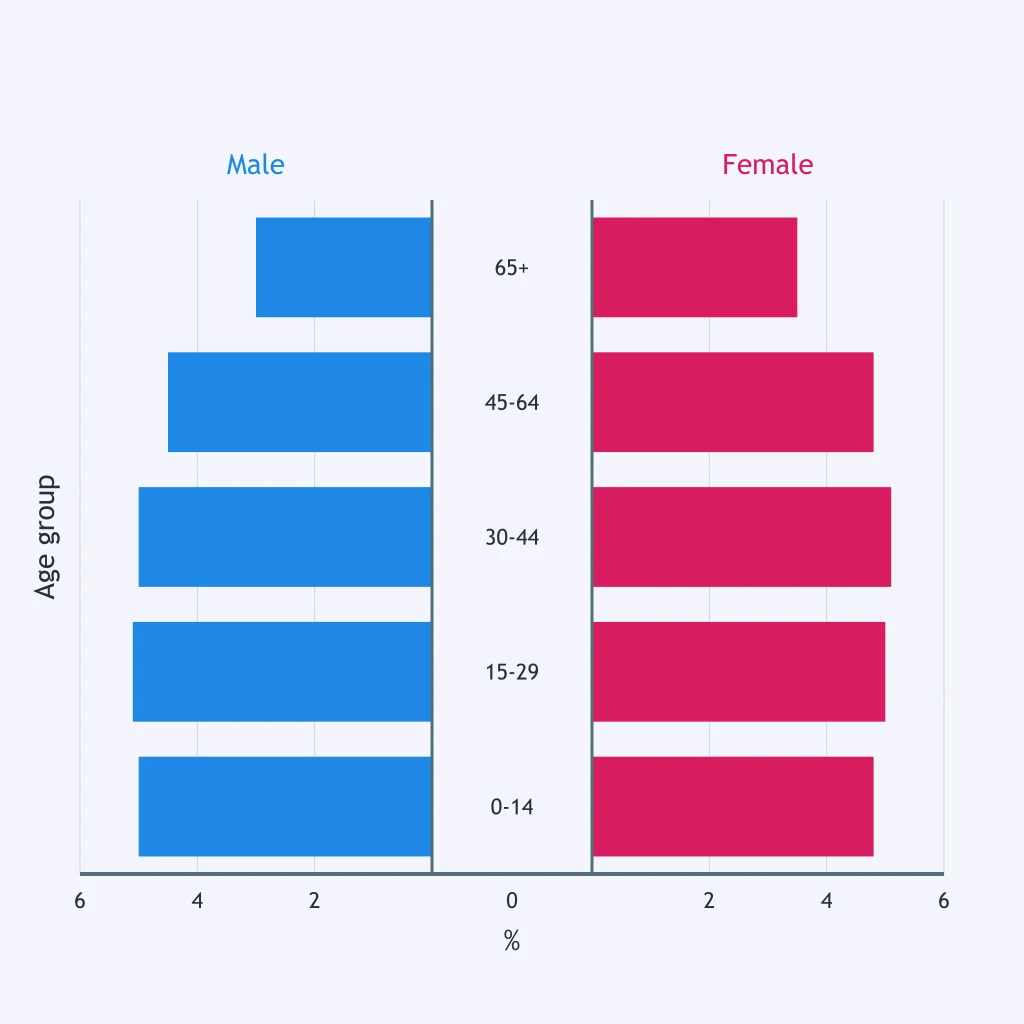
Use the diagram. Without enough immigration, what is the likely long-term population trend?
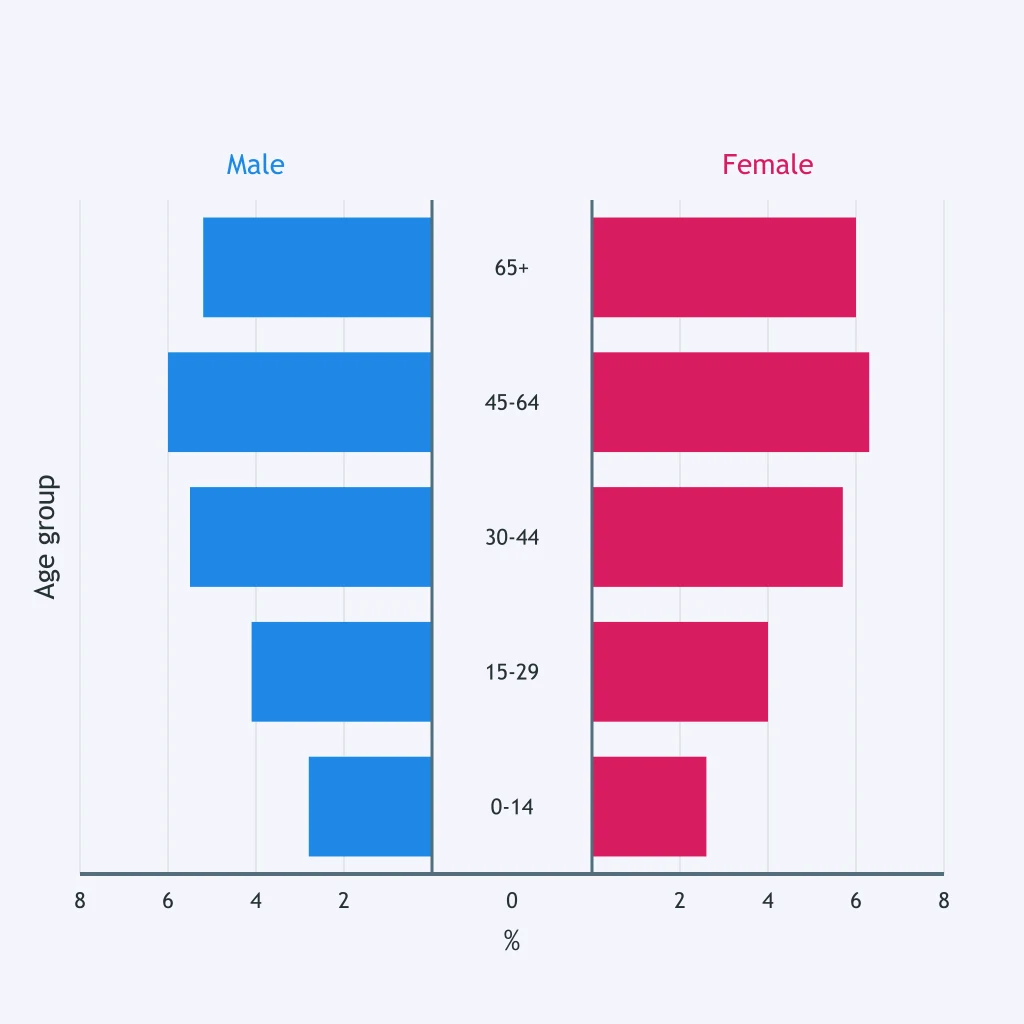
Use the diagram. Which demographic pattern does this age structure most strongly indicate?
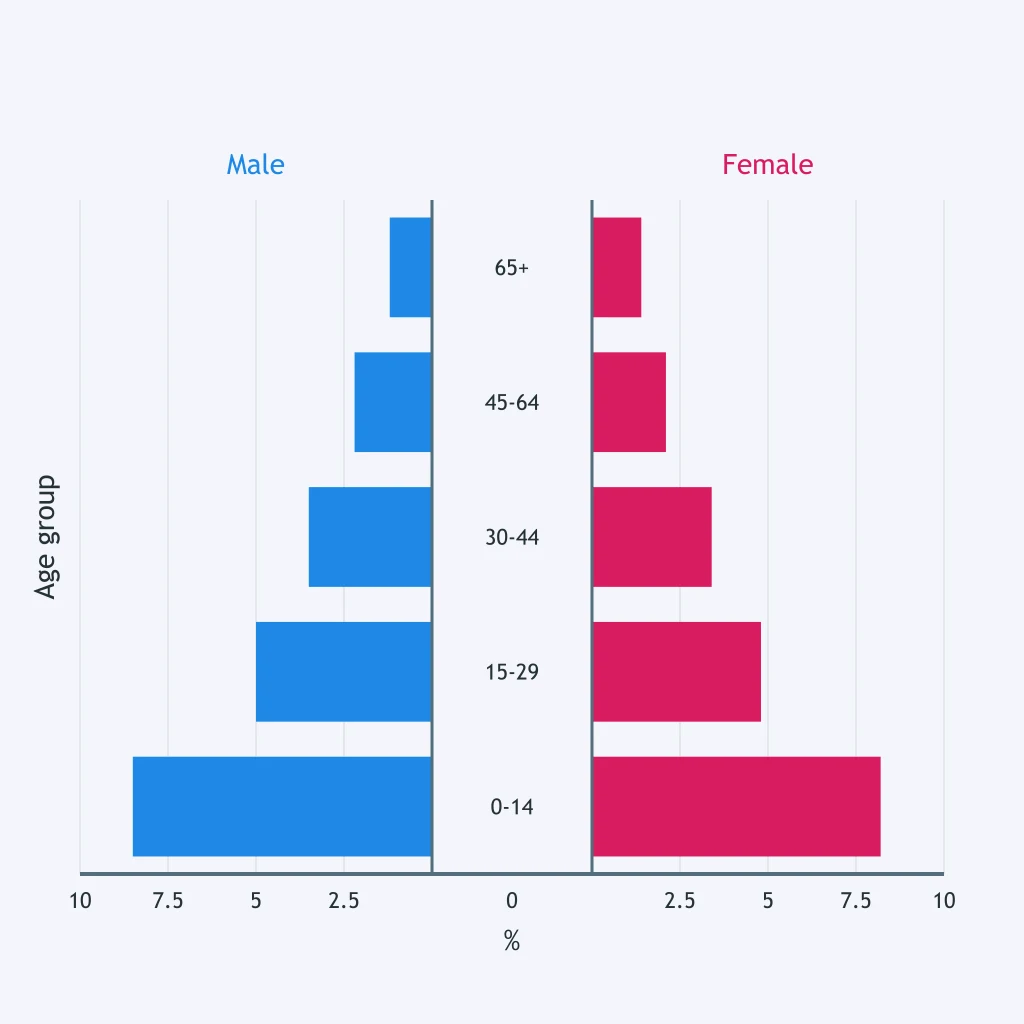
Use the diagram. What does its shape suggest about total fertility relative to replacement fertility?
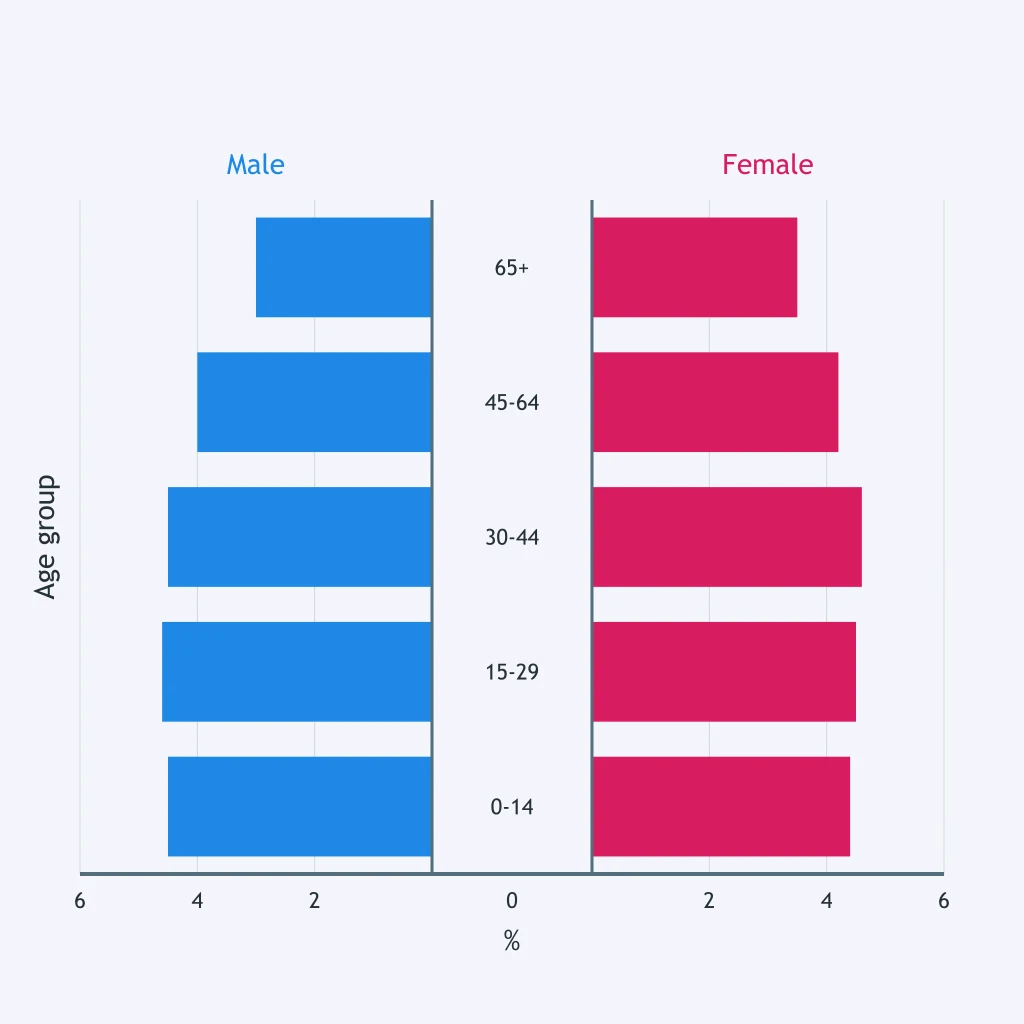
Use the diagram. Which statement best describes the age distribution?
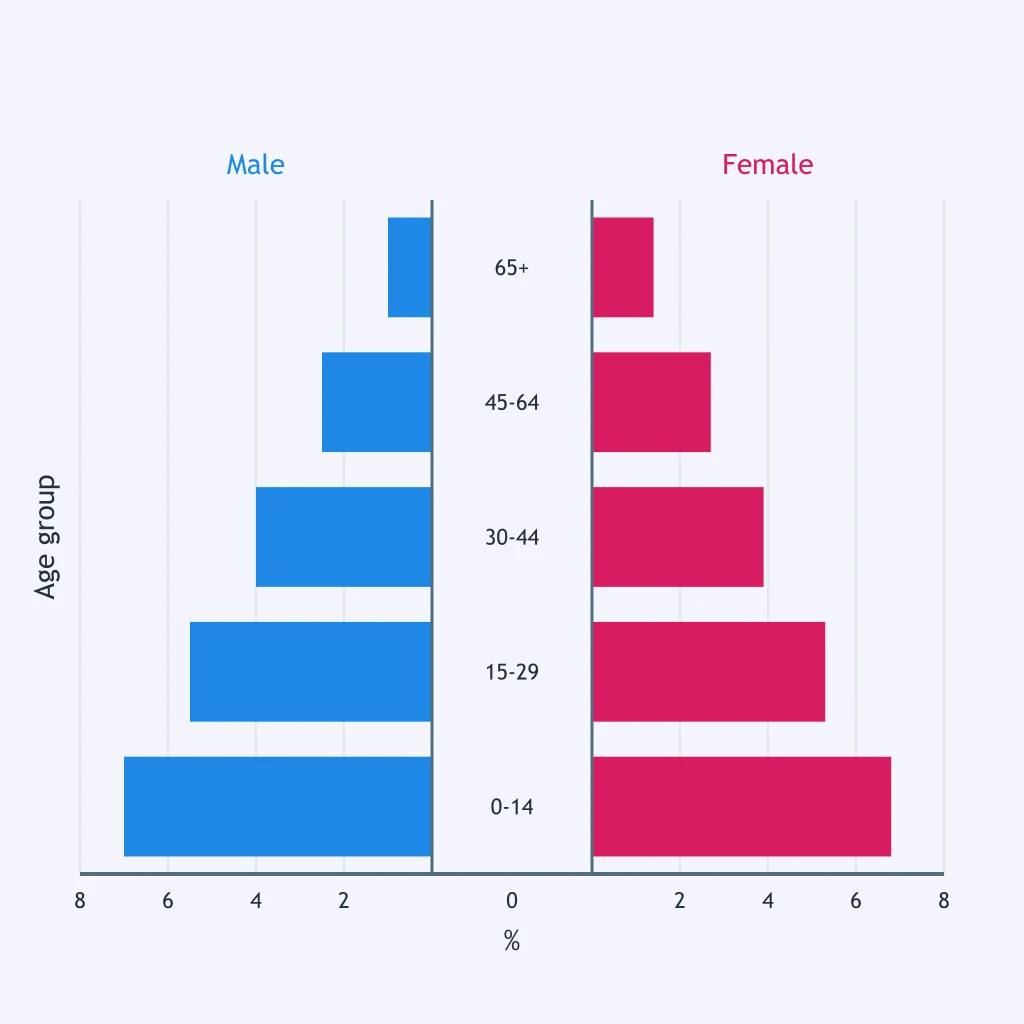
Use the diagram. Which statement is most consistent with this age structure?
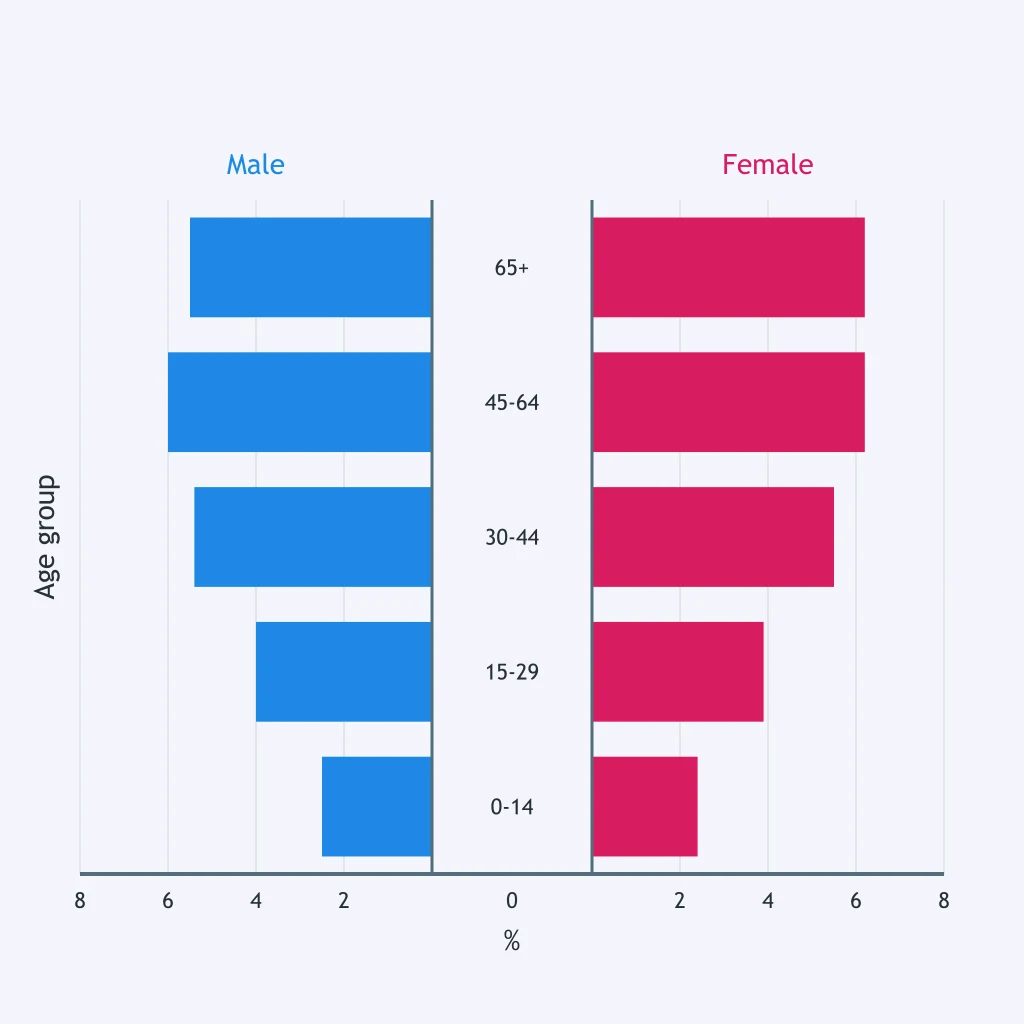
Using the total width of the bars on both sides, which age group is the largest share of this population?
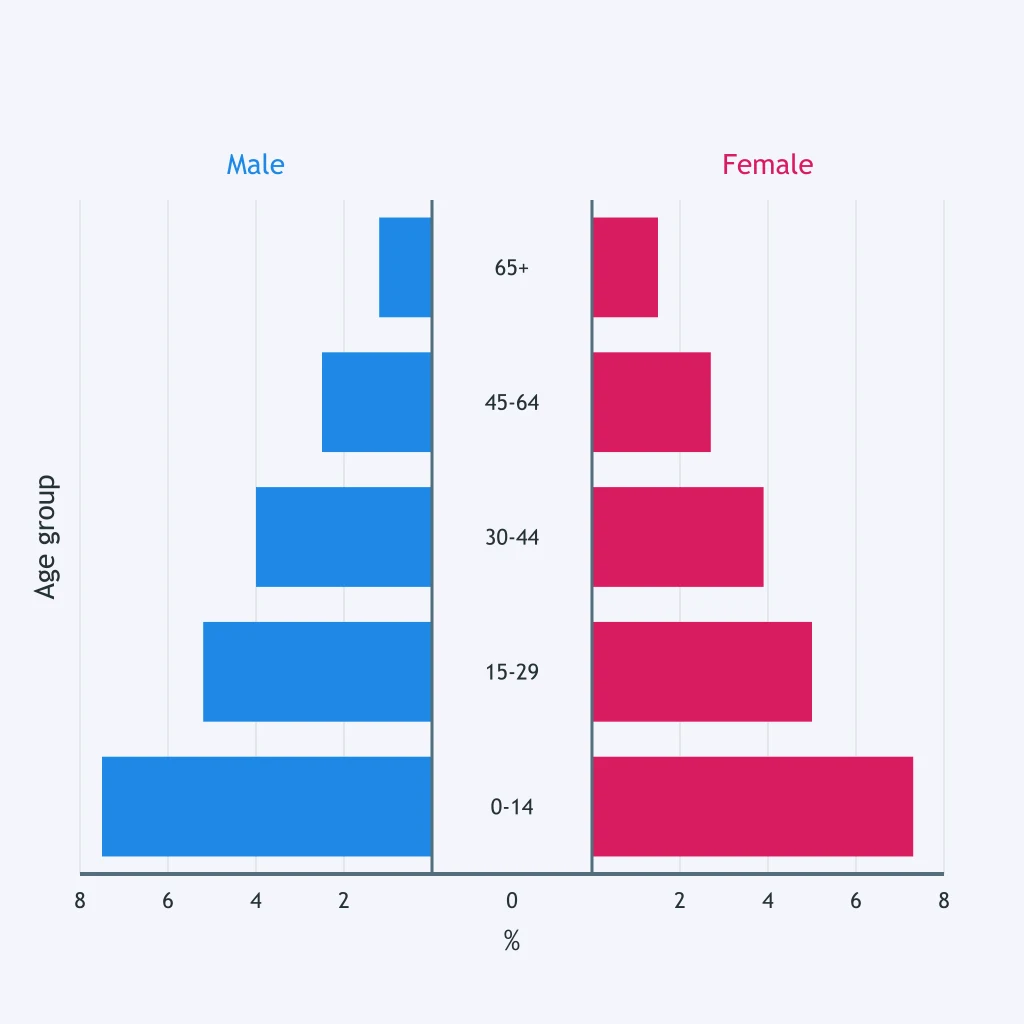
Which single sex-and-age cohort has the widest bar in the diagram?
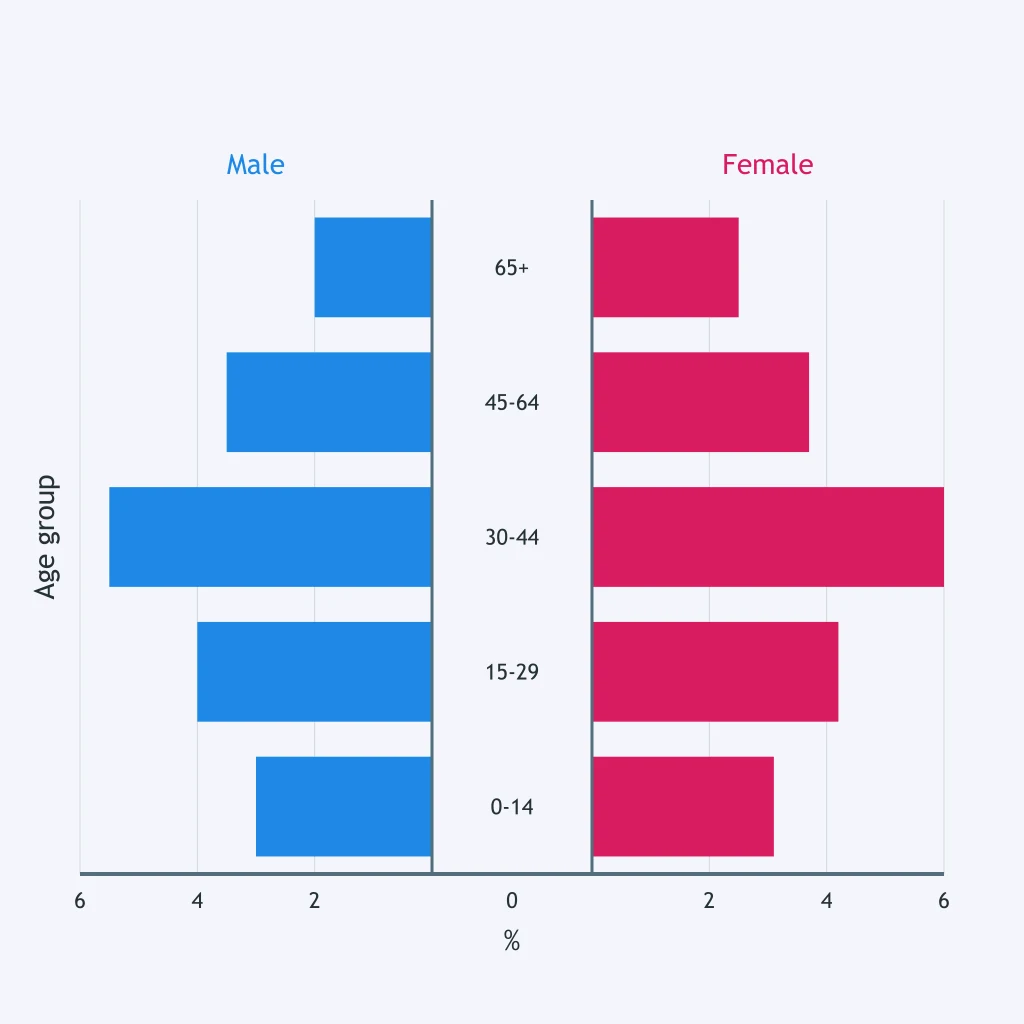
Based on the combined male and female bars, which age group is the largest share of this population?
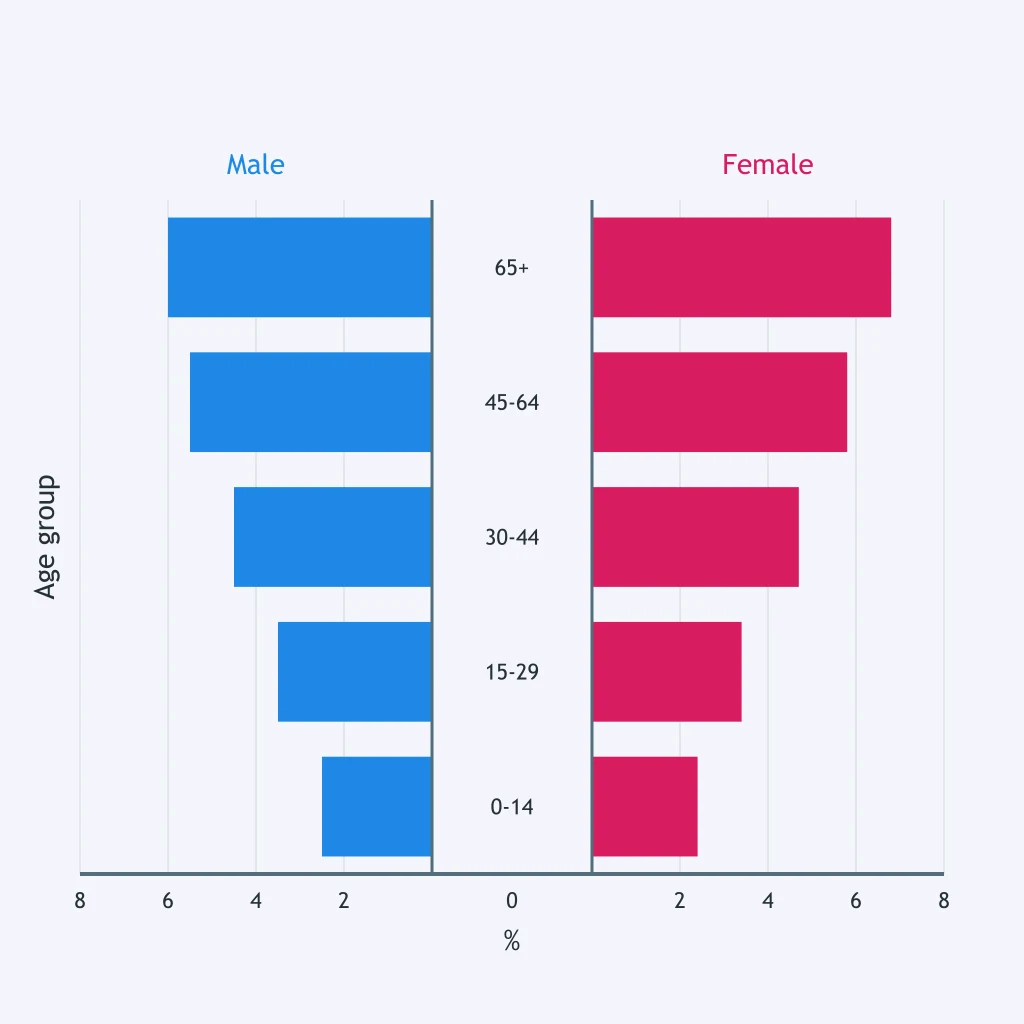
At ages 65 and older, what sex difference is shown by the diagram?
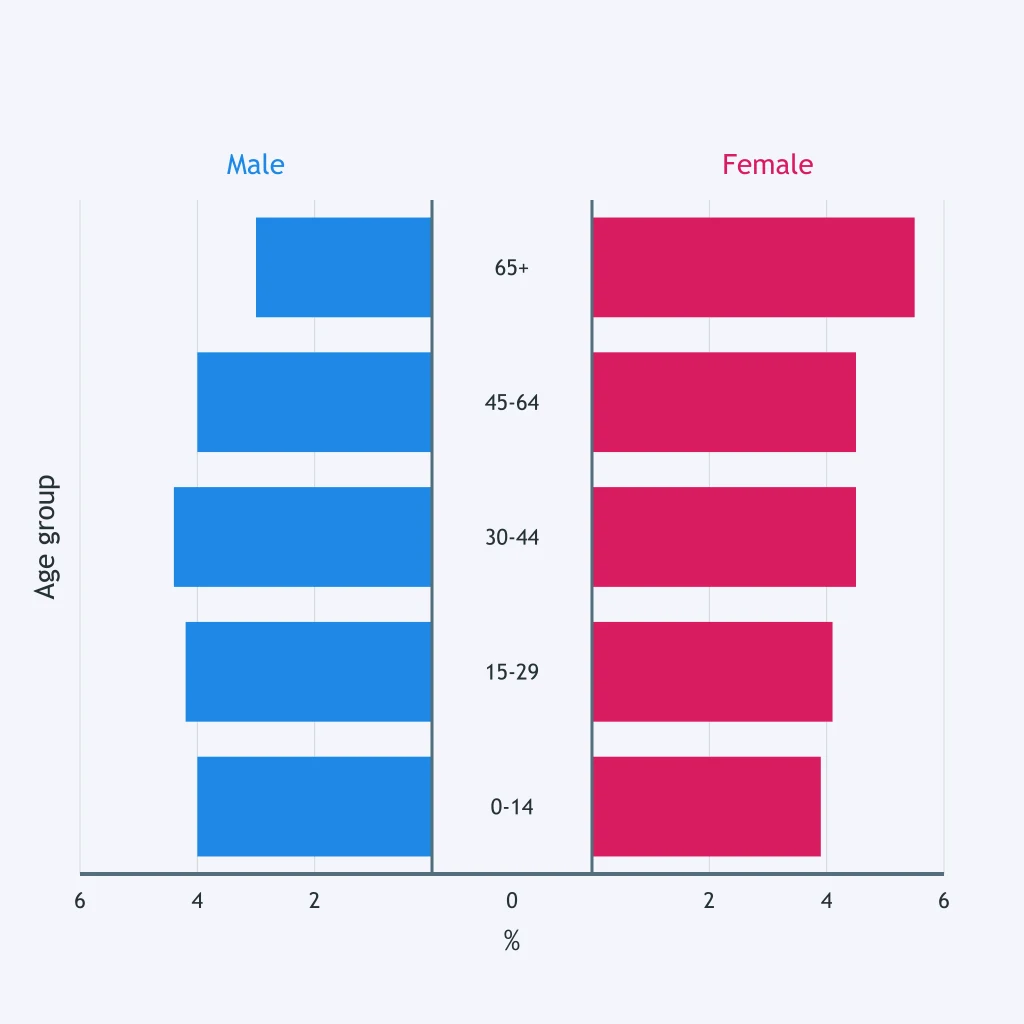
Which age group is least represented in this population when both sides of the pyramid are considered?
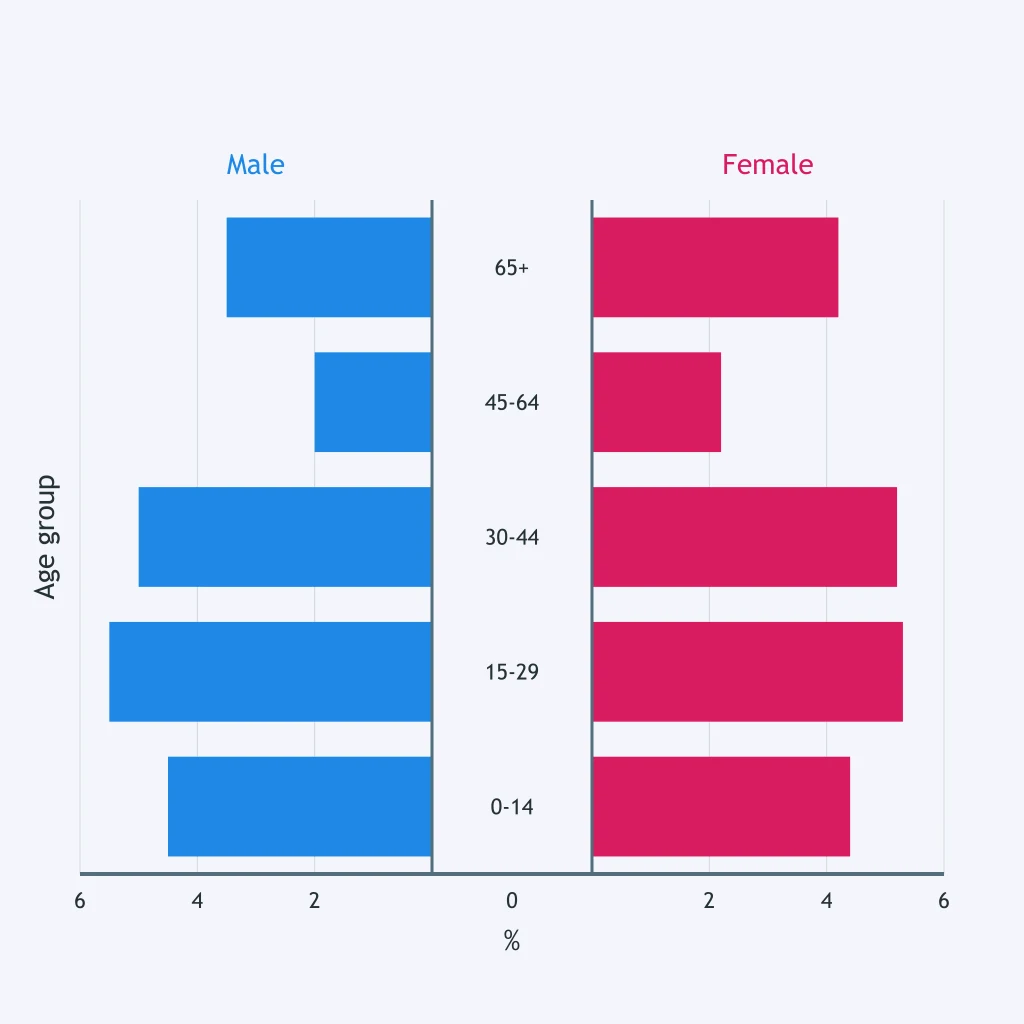
A country reaches replacement fertility today, but its pyramid still has a very broad base. What is the most likely result of population momentum?
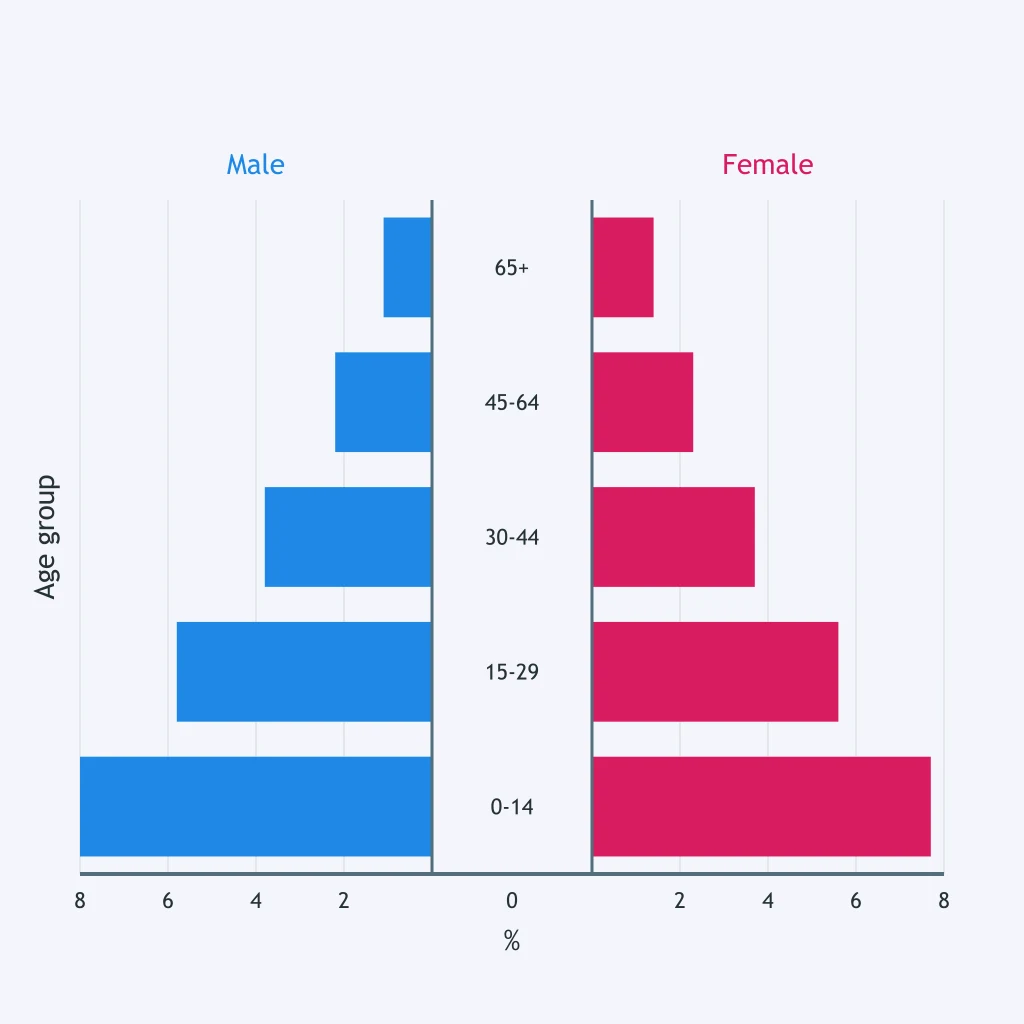
Why can the population represented by this broad-based pyramid keep increasing after total fertility falls to replacement level?
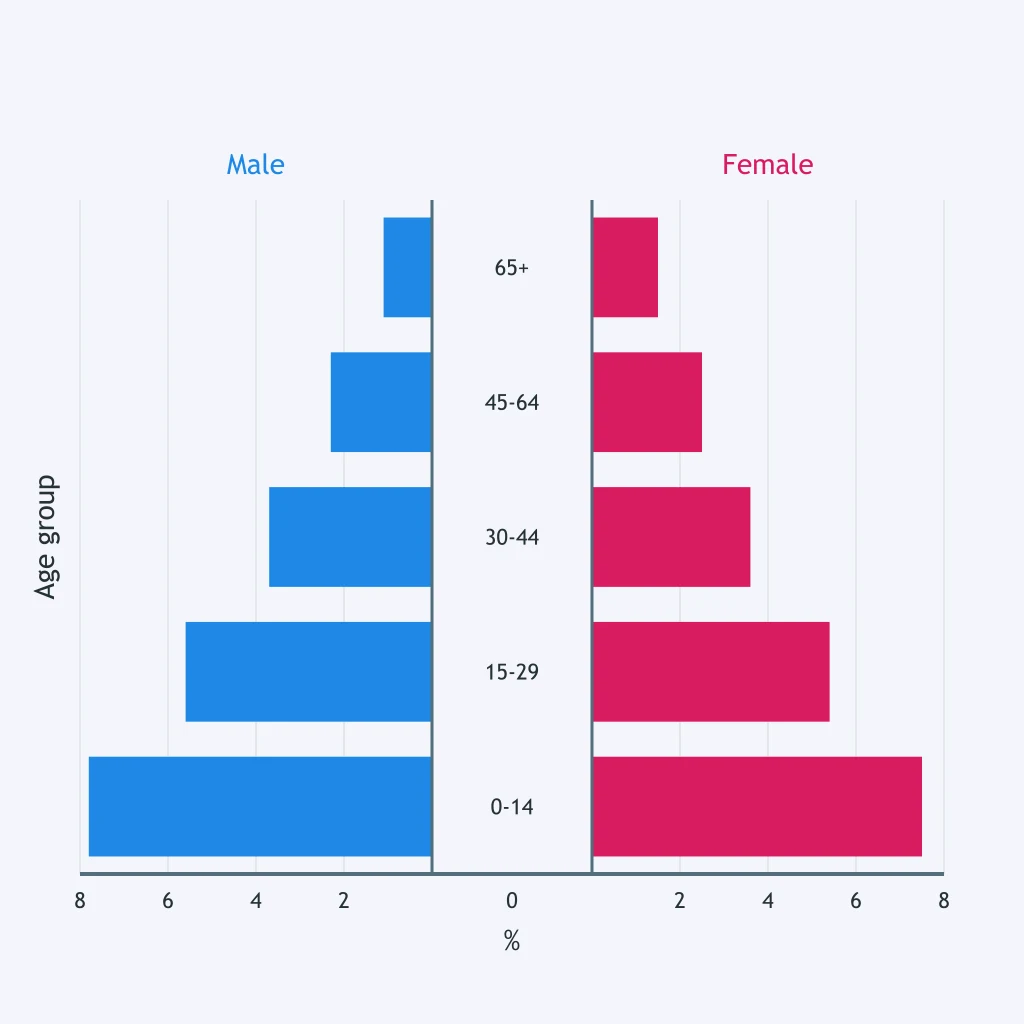
Use the diagram. If fertility is at replacement level, what feature can still sustain population growth?
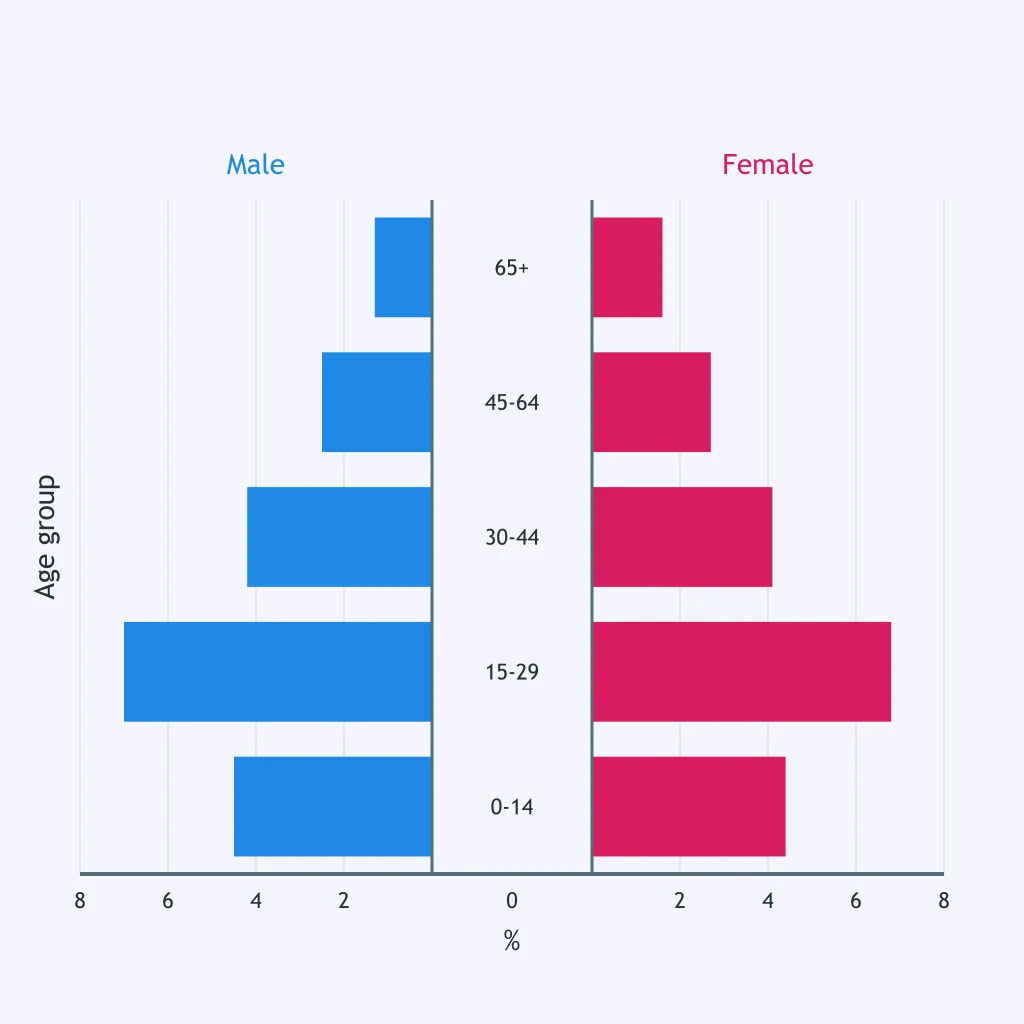
The figure has many children and adolescents relative to older adults. Even after a family-planning program lowers fertility, which outcome is most likely first?
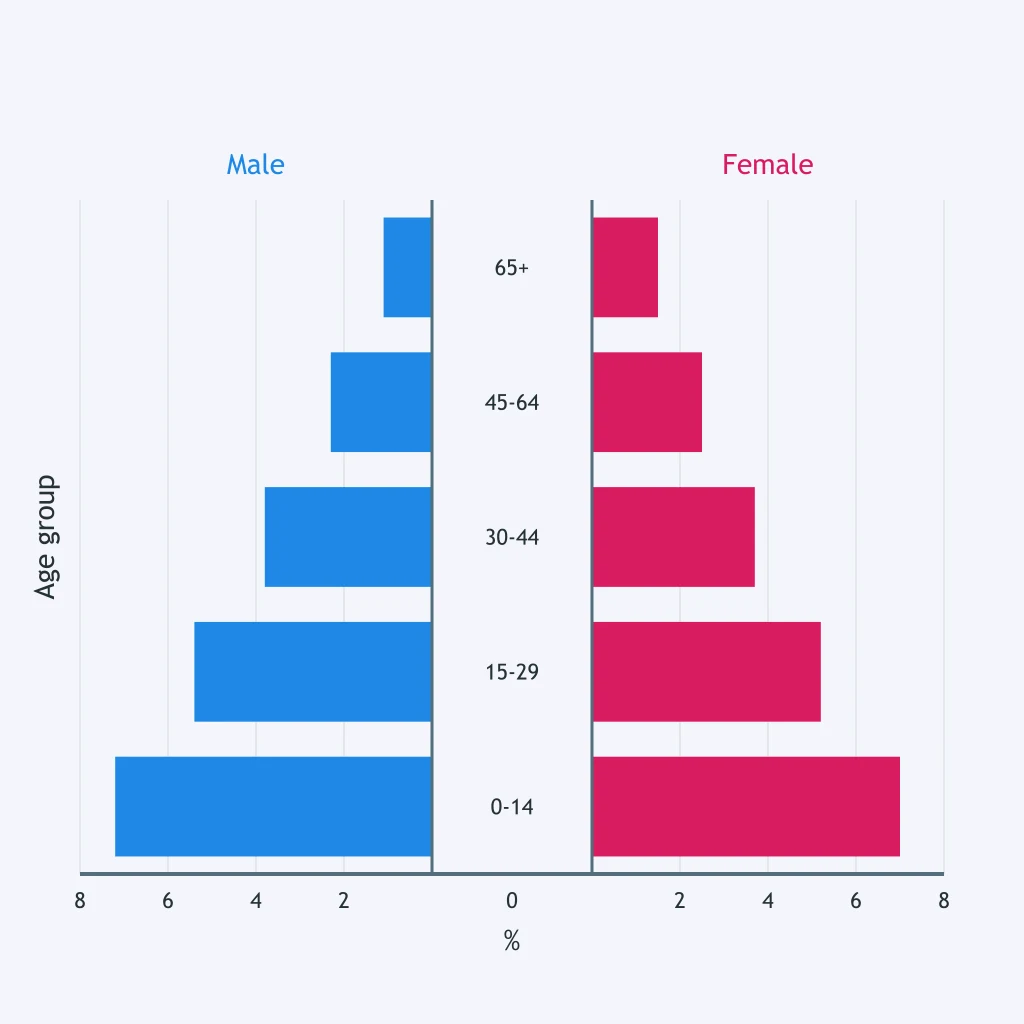
The diagram has a wide base. Which public service is most likely to need expanded capacity soon as the youngest cohort ages?
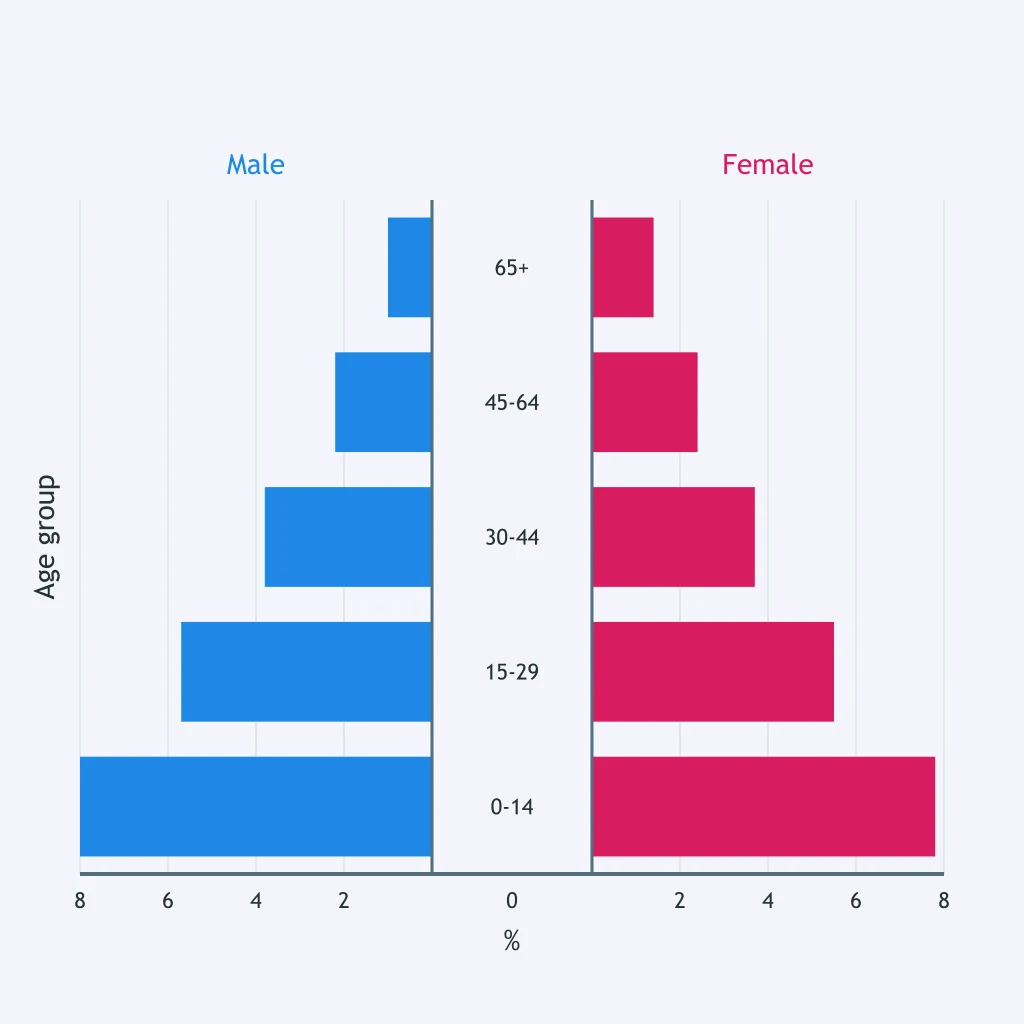
Use the diagram. Which service pressure does this age structure most strongly indicate?
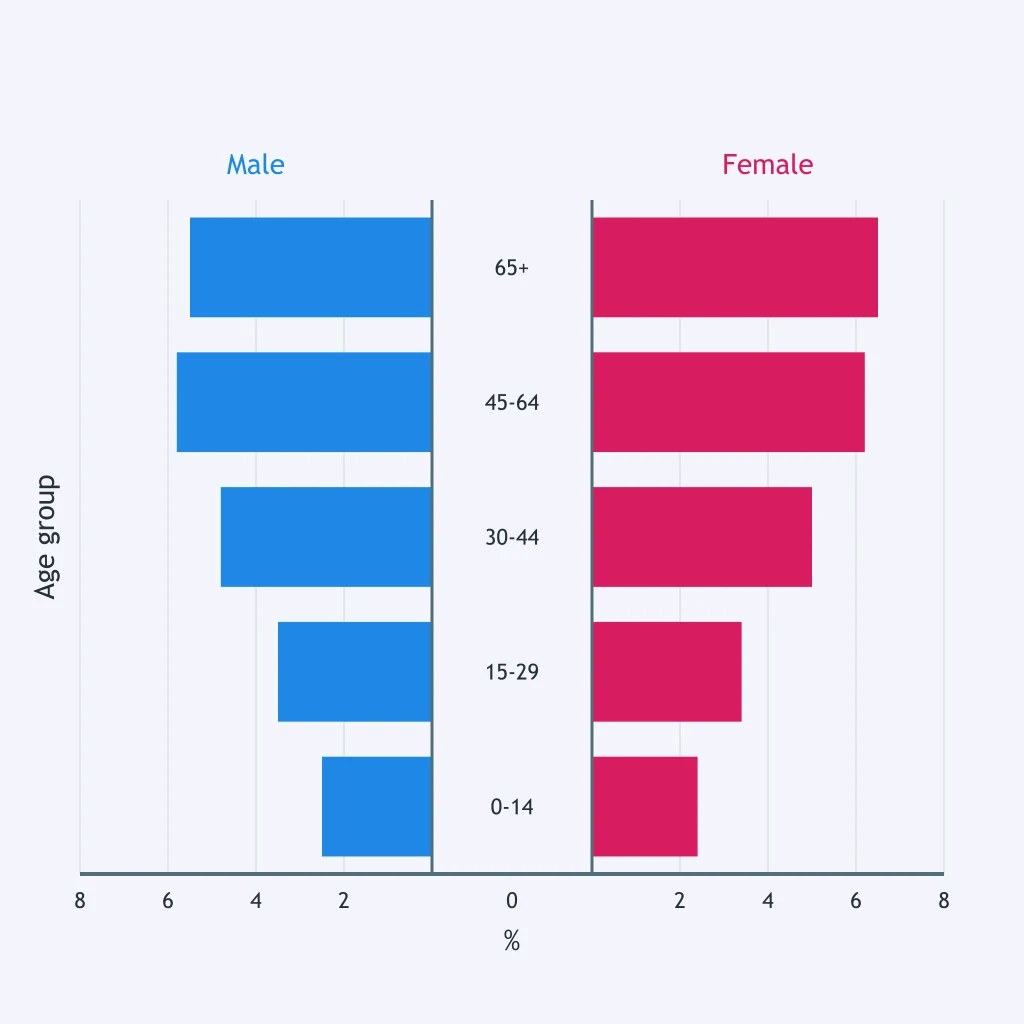
Use the diagram. As its largest cohort seeks employment, which resource demand is likely to increase?
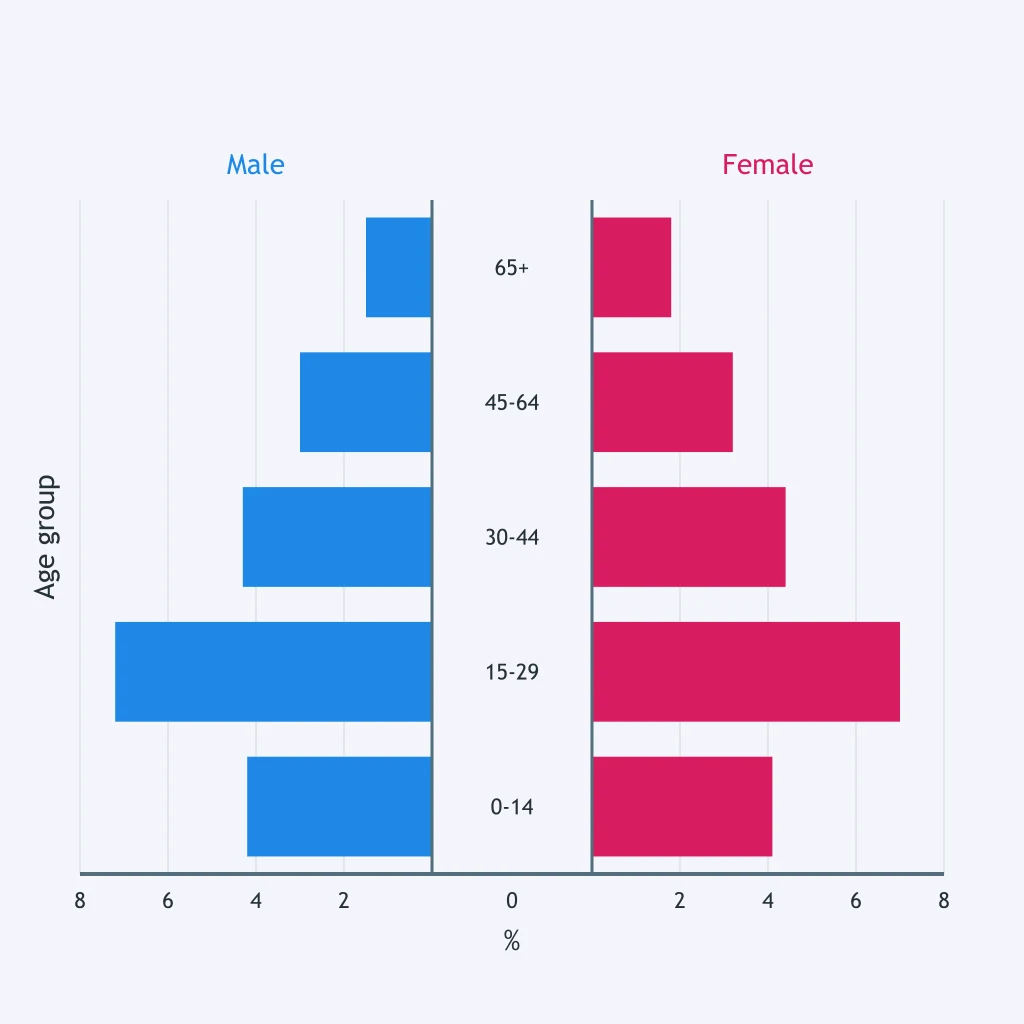
Use the diagram. Which planning consequence is most consistent with this population?
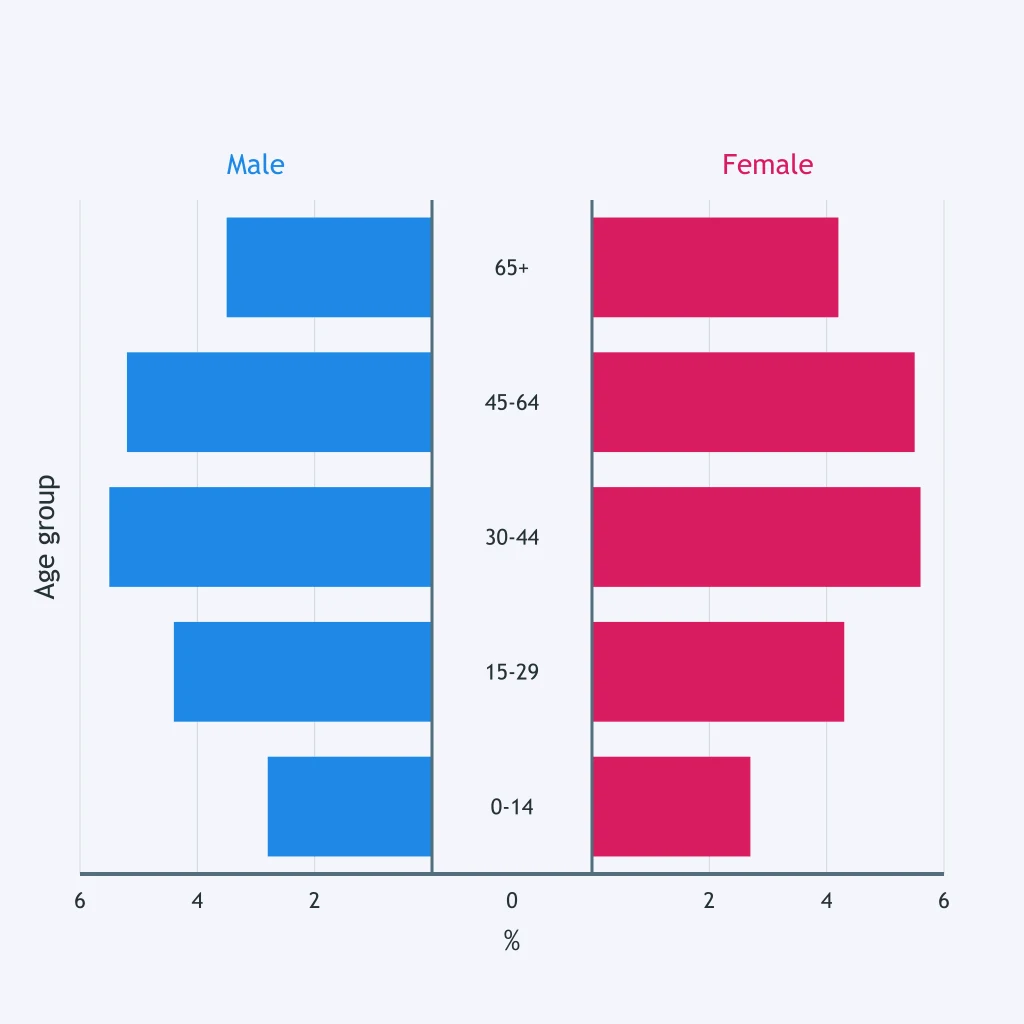
Crack the passcode before the zombies get in.
Answer, then swat bugs for bonus points.
Race through questions at your own speed.
Same question on every screen. Fastest wins.

Pick a tile, answer, hit bonuses and steals.

Types and Measures of Biodiversity
30 questions