Loading
by BlastRoom
Read temperature and carbon dioxide records and weigh the evidence linking the past century of warming to human activity.
#us_grade_8_science
40 questions
One question set, multiple game modes. Tap any game to see it in action. Not sure which to pick?
Answer to place stones and capture territory.
Outrun the snow together.
Earn blasts, then hunt the other team.
Answer to earn energy, then climb.

The class blasts through walls together.
Bid on mystery lots. Most money wins.
Sell tours. Nice, standard, or a total scam.

Answer, restock, and serve the rush.
More correct answers pulls the rope your way.
Answer, then shoot down the alien wave.
Answer, then tap to leap the frozen ridge.
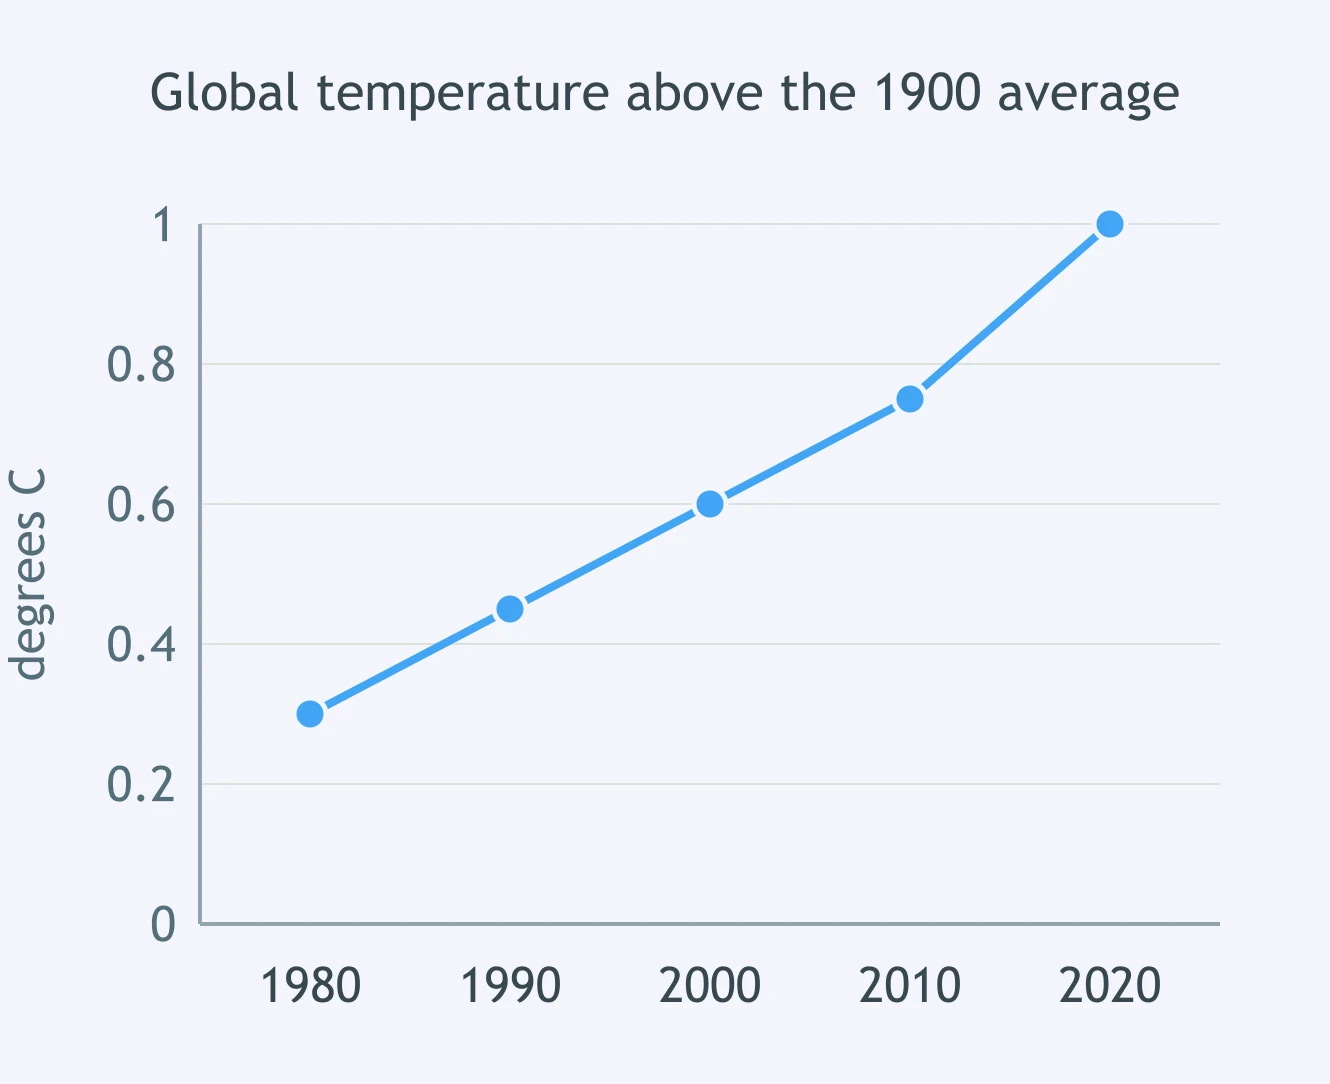
Look at the graph of global average temperature. Between which years shown does the line climb most steeply?
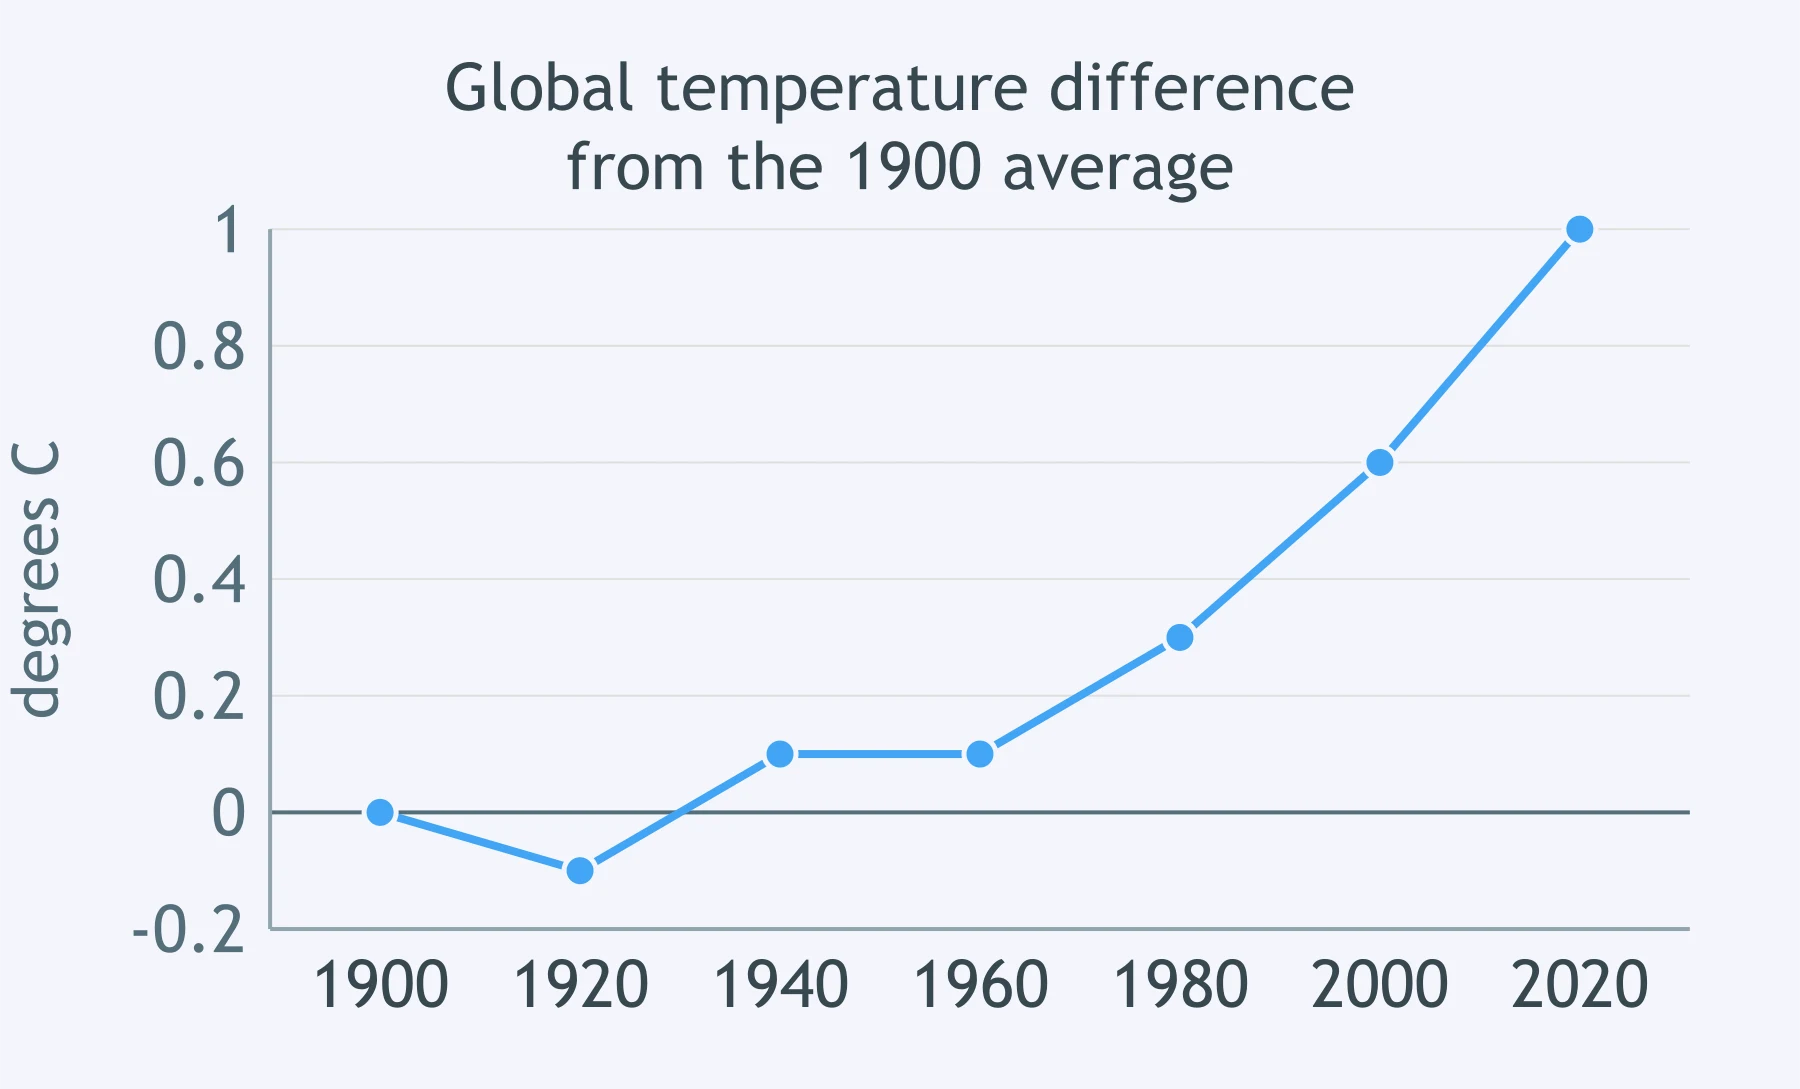
A global temperature graph shows degrees C above the 1901-2000 average. Its line sits at about -0.3 in the 1890s and about +1.0 in 2020. By this graph, how much warmer was 2020 than the 1890s?
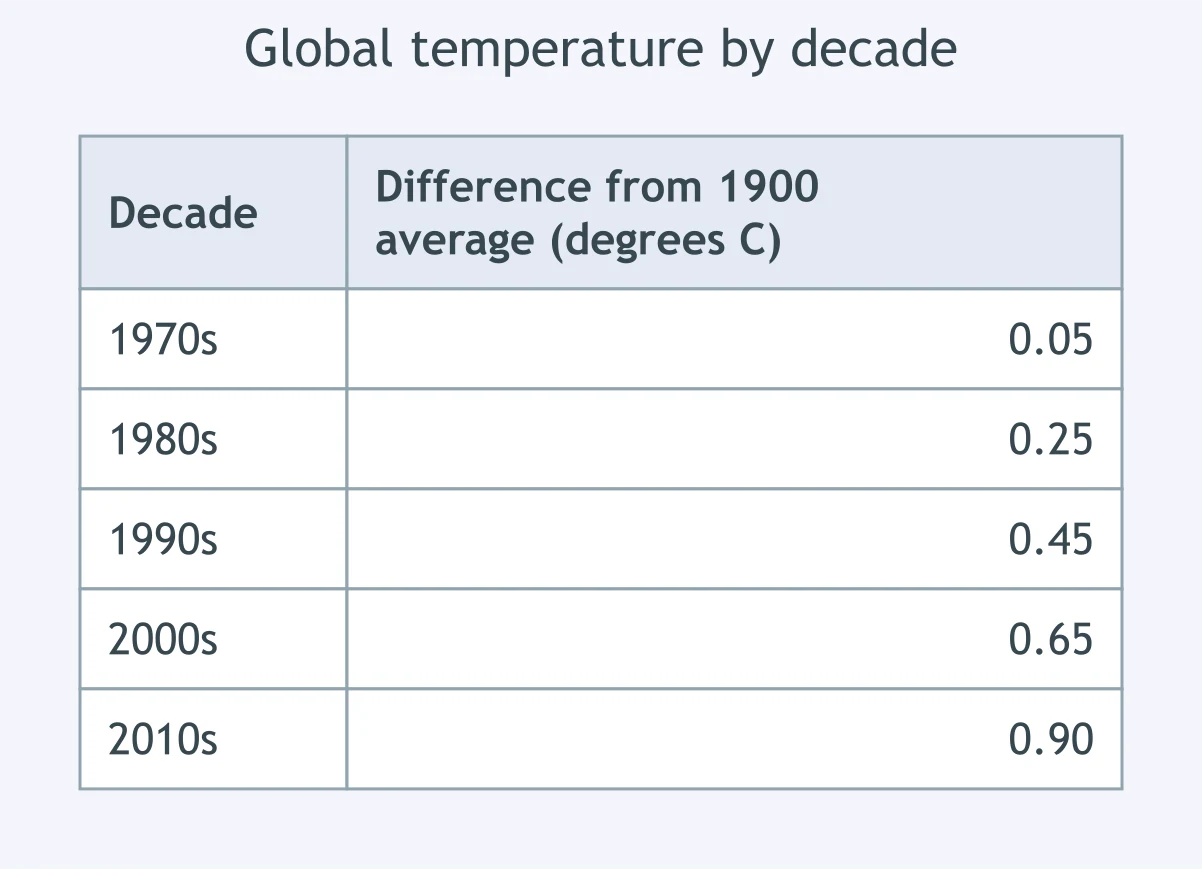
Use the table of decade average temperatures. How much warmer was the 2010s decade than the 1970s decade?
Global temperature records show a warming trend, yet single years still run warmer or cooler than the year before them.
A temperature record from 1880 to 2020 zigzags from year to year. Its values sit near -0.2 degrees C in the 1880s and near +0.9 in the 2010s. What should a reader report as the long-term trend?
A ranked list of the warmest years in the global record, which begins in 1880, shows that all ten of the warmest years occurred after 2000. What does that ranking show?
A yearly temperature record rises a little from 1910 to 1940, holds roughly flat for the next 35 years, then climbs steadily to 2020. In about which year does the steady climb begin?
Look at the graph. About how much did global average temperature rise between 1980 and 2020?
In the United States, daily record high temperatures have outnumbered record lows roughly two to one since 2000, after running about even in the 1960s. What does this shift show?
A graph is labeled "difference from the 1951-1980 average, in degrees C". Its point for 2016 sits at +1.0. What does that point mean?
Carbon dioxide measured at Mauna Loa rose from 315 parts per million in 1958 to 415 in 2020. By about what percent did it increase over those years?
Since 1960 ocean heat content has risen in nearly every year, while yearly air temperature zigzags up and down as it rises. Why does the ocean record rise more steadily?
From 1900 to 2020 global sea level rose about 20 centimeters while global temperature rose about 1 degree C. Which two effects of the warming mainly raised sea level?
September Arctic sea ice extent has shrunk about 13 percent per decade since 1979. Why do scientists track the Arctic ice in September in particular?
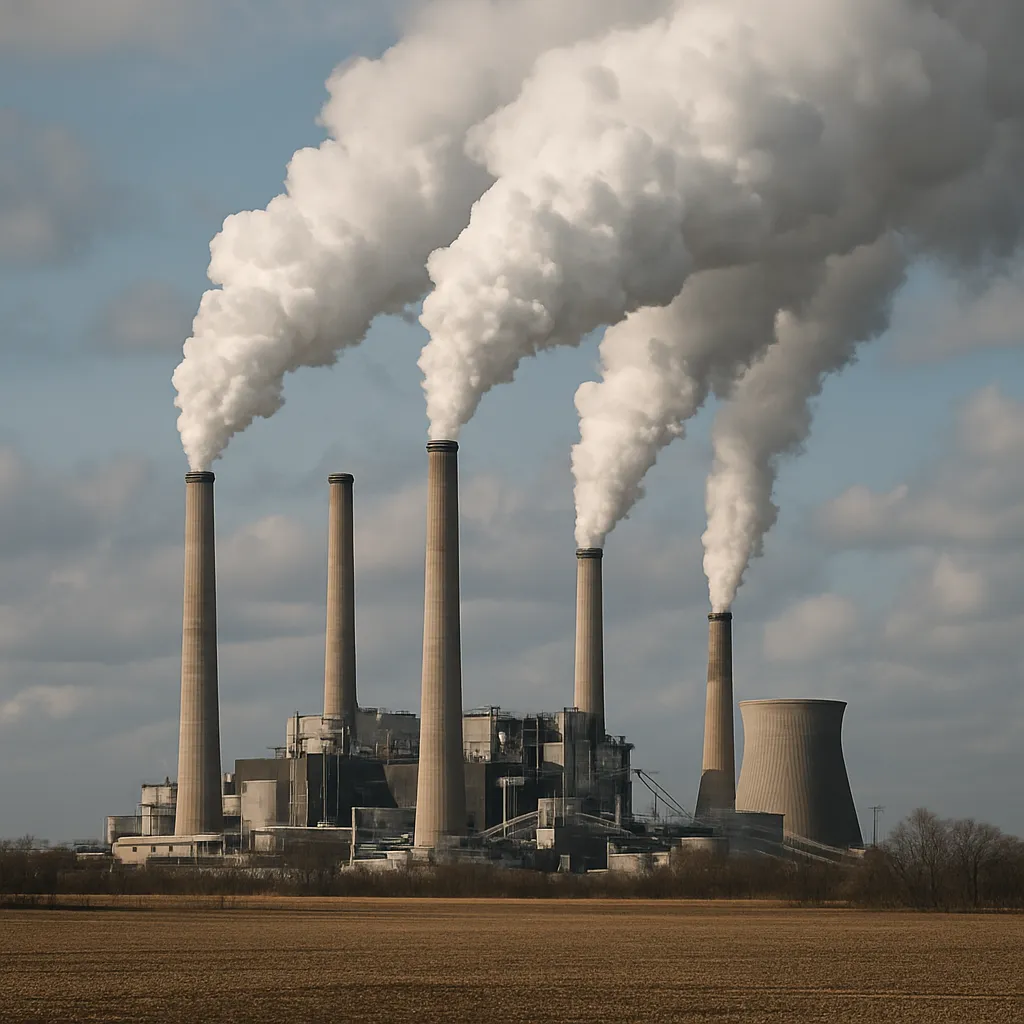
Carbon dioxide released by burning fossil fuels rose from about 9 to 35 billion tons per year between 1960 and 2020. For the same amount of energy, which fuel releases the most carbon dioxide?
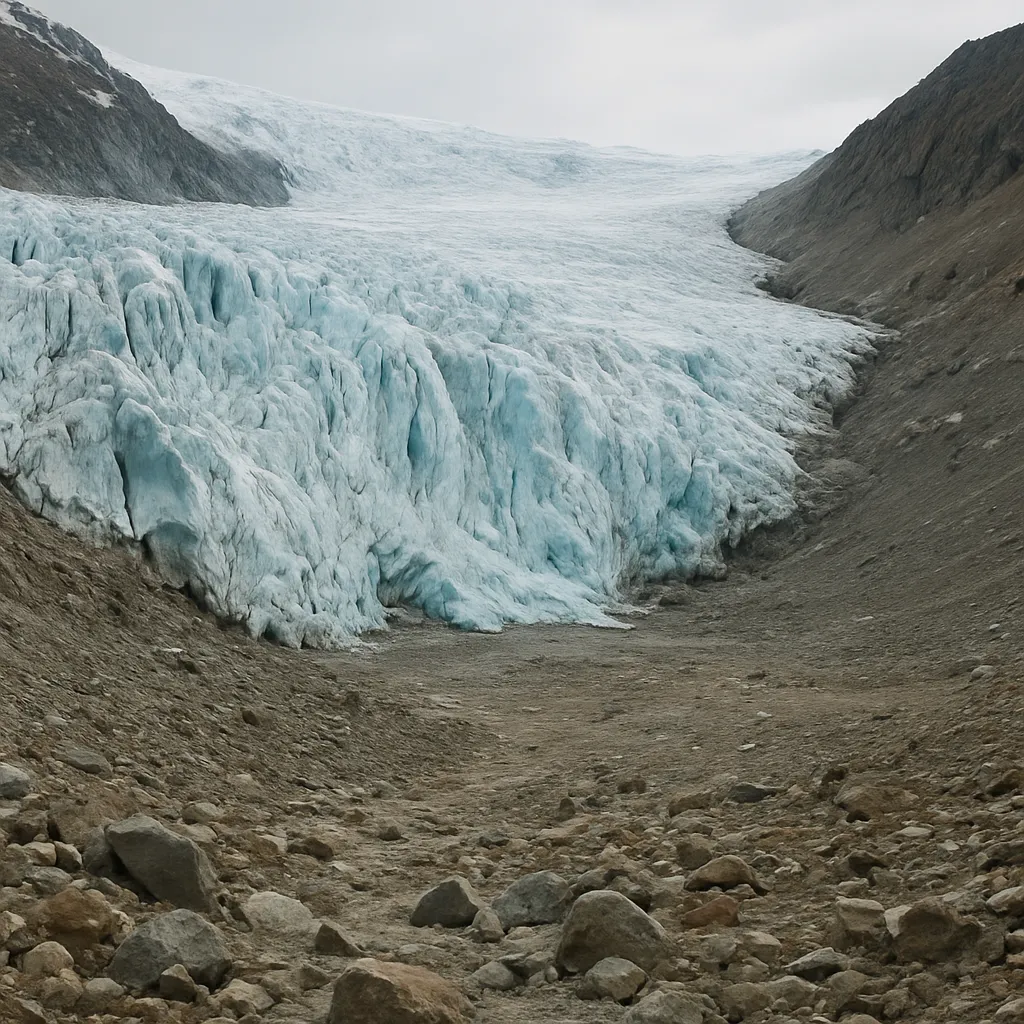
Reference glaciers around the world have lost mass in nearly every year since 1980. Which observation at a single glacier would show that kind of loss?
Carbon dioxide climbed steadily from 1998 to 2012 while surface temperature rose only slowly, then temperature rose quickly again after 2014. What do the full series show?
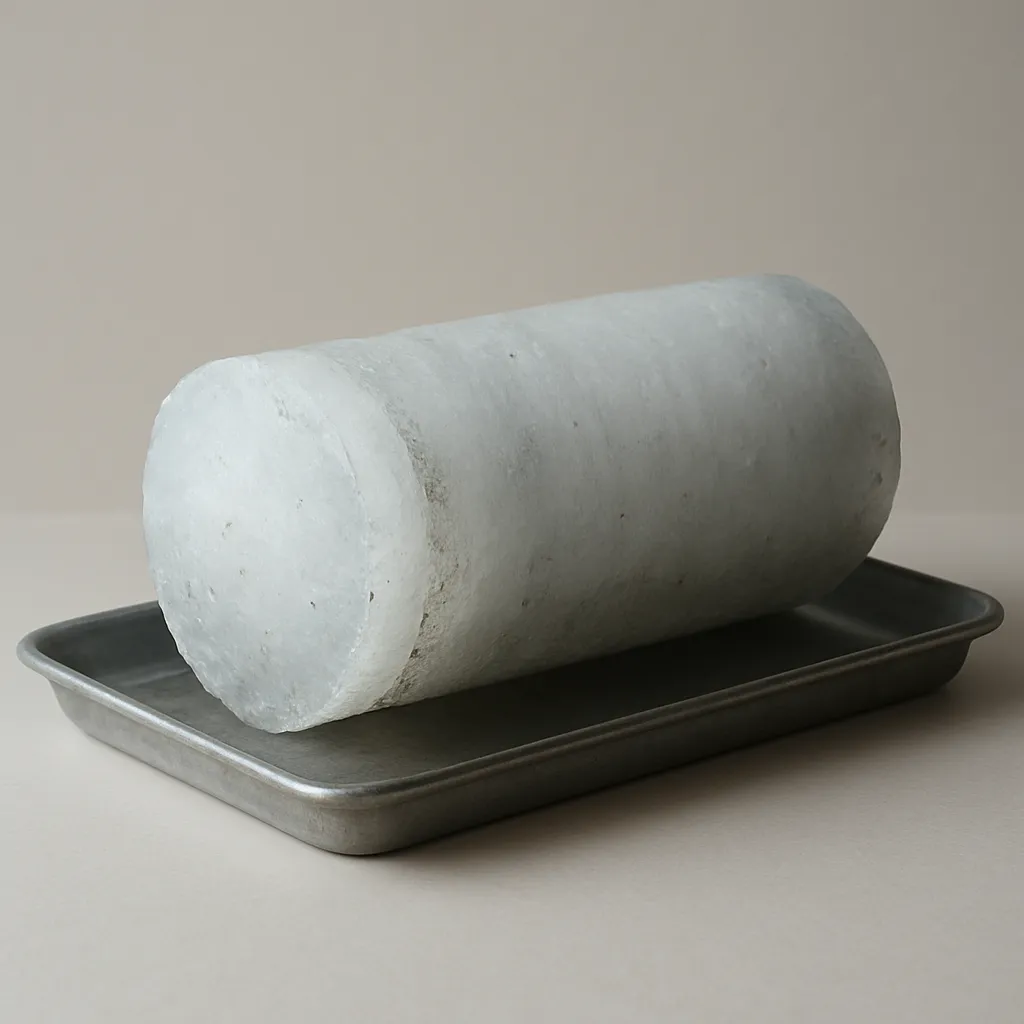
Ice cores from Antarctica show carbon dioxide staying between about 170 and 300 parts per million for 800,000 years. How does a column of ice hold a record of air from so long ago?
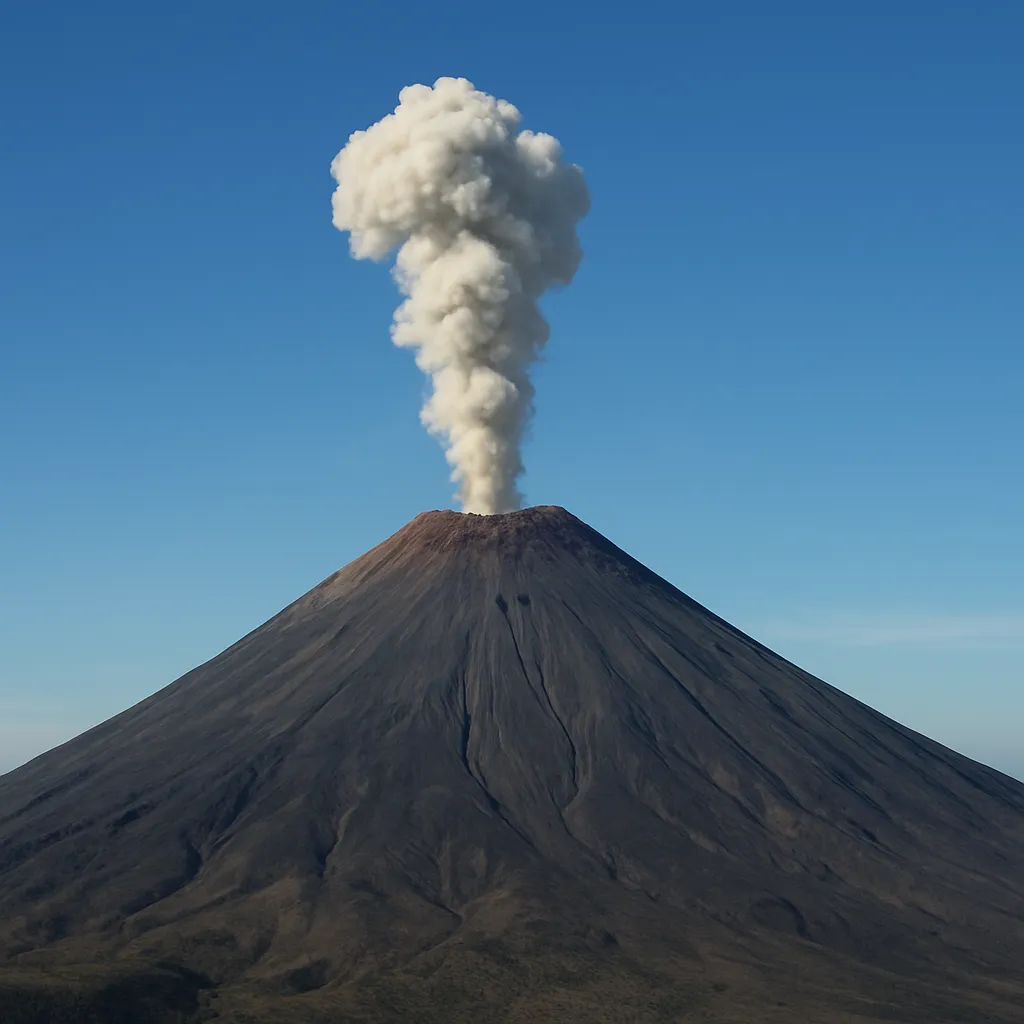
Some people blame volcanoes for the rise in carbon dioxide. How does the carbon dioxide volcanoes release each year compare with what fossil fuel burning releases?
Since 1980 the energy arriving from the Sun has held steady, with a slight dip, while global temperature rose by more than half a degree C. Which conclusion does this comparison support?
Fossil fuel carbon has no carbon-14 and less carbon-13 than the carbon dioxide already in the air. Air samples show the carbon-13 share falling as carbon dioxide rises. What does this support?
Satellite records show the lower atmosphere warming while the stratosphere above it cools. Which cause does this pattern point to?
Precise measurements show atmospheric oxygen slowly declining as carbon dioxide rises, in about the ratio expected when carbon-based fuels burn. Which conclusion does this best support?
Records since 1950 show nighttime low temperatures rising faster than daytime highs. Which cause does this night-heavy pattern fit best?
Changes in Earth's orbit have driven ice ages and warm periods in the past. Why can't they explain the 1 degree C of warming over roughly the past 100 years?
Each year, oceans and land plants take up part of the carbon dioxide people release. About what share of people's yearly release stays in the atmosphere?
Sunlight warms Earth's surface, which then gives off infrared energy upward. What happens to more of that infrared energy when carbon dioxide and methane increase?
Carbon dioxide is a gas in the air between the Sun and Earth's surface. Why does adding more of it warm the surface instead of shading it?
Methane traps more heat per molecule than carbon dioxide does. Why is carbon dioxide still the larger cause of warming?
Coal, oil, and natural gas hold carbon that stayed buried for millions of years. What happens to that carbon when the fuels burn in engines and power plants?
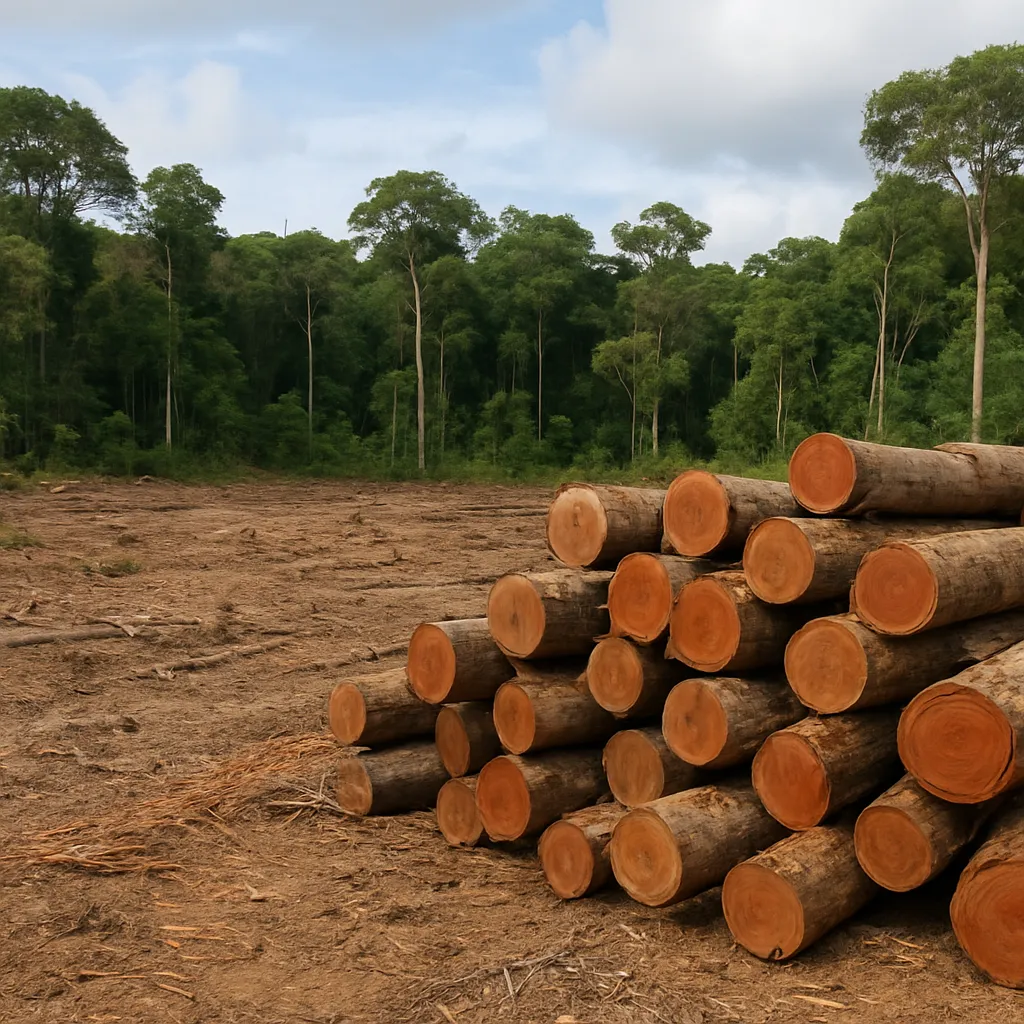
A patch of forest is cleared and the cut wood is burned. How does that clearing change the amount of carbon dioxide in the air?
The ocean has taken up roughly a quarter of the carbon dioxide people have released. What has that uptake done to seawater chemistry?
Bright sea ice reflects most of the sunlight that hits it. What happens to warming in a region where the summer sea ice melts away and leaves open ocean?
About what share of the extra heat that has built up in the Earth system since 1970 have the oceans absorbed?
A student points to a record snowstorm in their city as proof that global warming is not happening. What is the main problem with the reasoning?
A student argues that graphs of carbon dioxide and temperature only show the two rising together, so no link is proven. Which laboratory evidence answers that objection?
Someone claims warming has stopped because 2016 was warmer than the two years right after it. Why does that comparison not settle the question?
A graph shows global temperature rising about 0.9 degrees C since 1900. A student uses it alone to claim that crop yields will fall. What can this graph support?
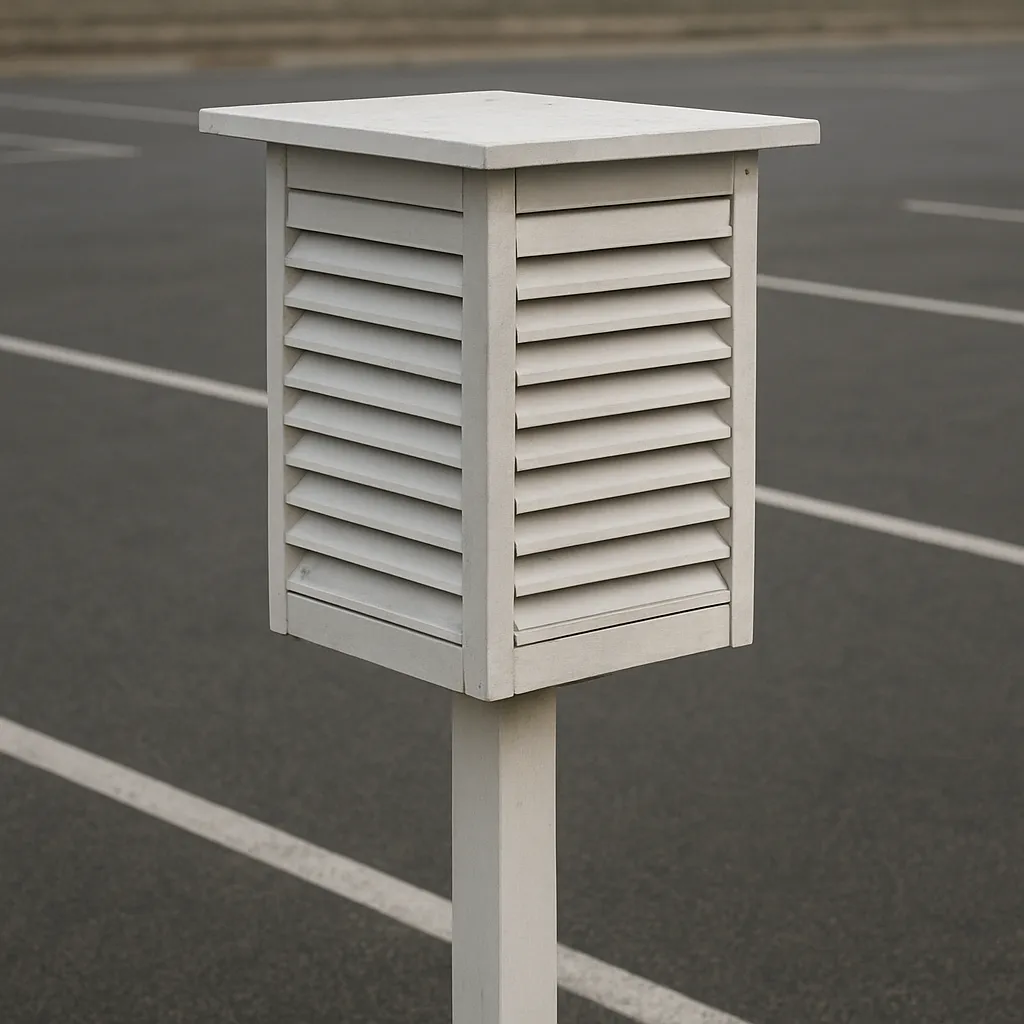
One weather station beside a newly paved parking lot records faster warming than nearby stations. Why is that station weak evidence about global temperature on its own?
Two lines on one graph show carbon dioxide and global temperature both rising from 1958 to 2020. What does this graph by itself establish?
Crack the passcode before the zombies get in.
Answer, then swat bugs for bonus points.
Race through questions at your own speed.
Same question on every screen. Fastest wins.

Pick a tile, answer, hit bonuses and steals.
Natural Events That Change Climate
20 questions