Loading
by BlastRoom
Compare shadow, daylight, and night-sky records to explain the daily and seasonal patterns behind them.
#sky_patterns#us_grade_5_science
20 questions
One question set, multiple game modes. Tap any game to see it in action. Not sure which to pick?
Answer to place stones and capture territory.
Outrun the snow together.
Earn blasts, then hunt the other team.
Answer to earn energy, then climb.

The class blasts through walls together.
Bid on mystery lots. Most money wins.
Sell tours. Nice, standard, or a total scam.

Answer, restock, and serve the rush.
More correct answers pulls the rope your way.
Answer, then shoot down the alien wave.
Answer, then tap to leap the frozen ridge.
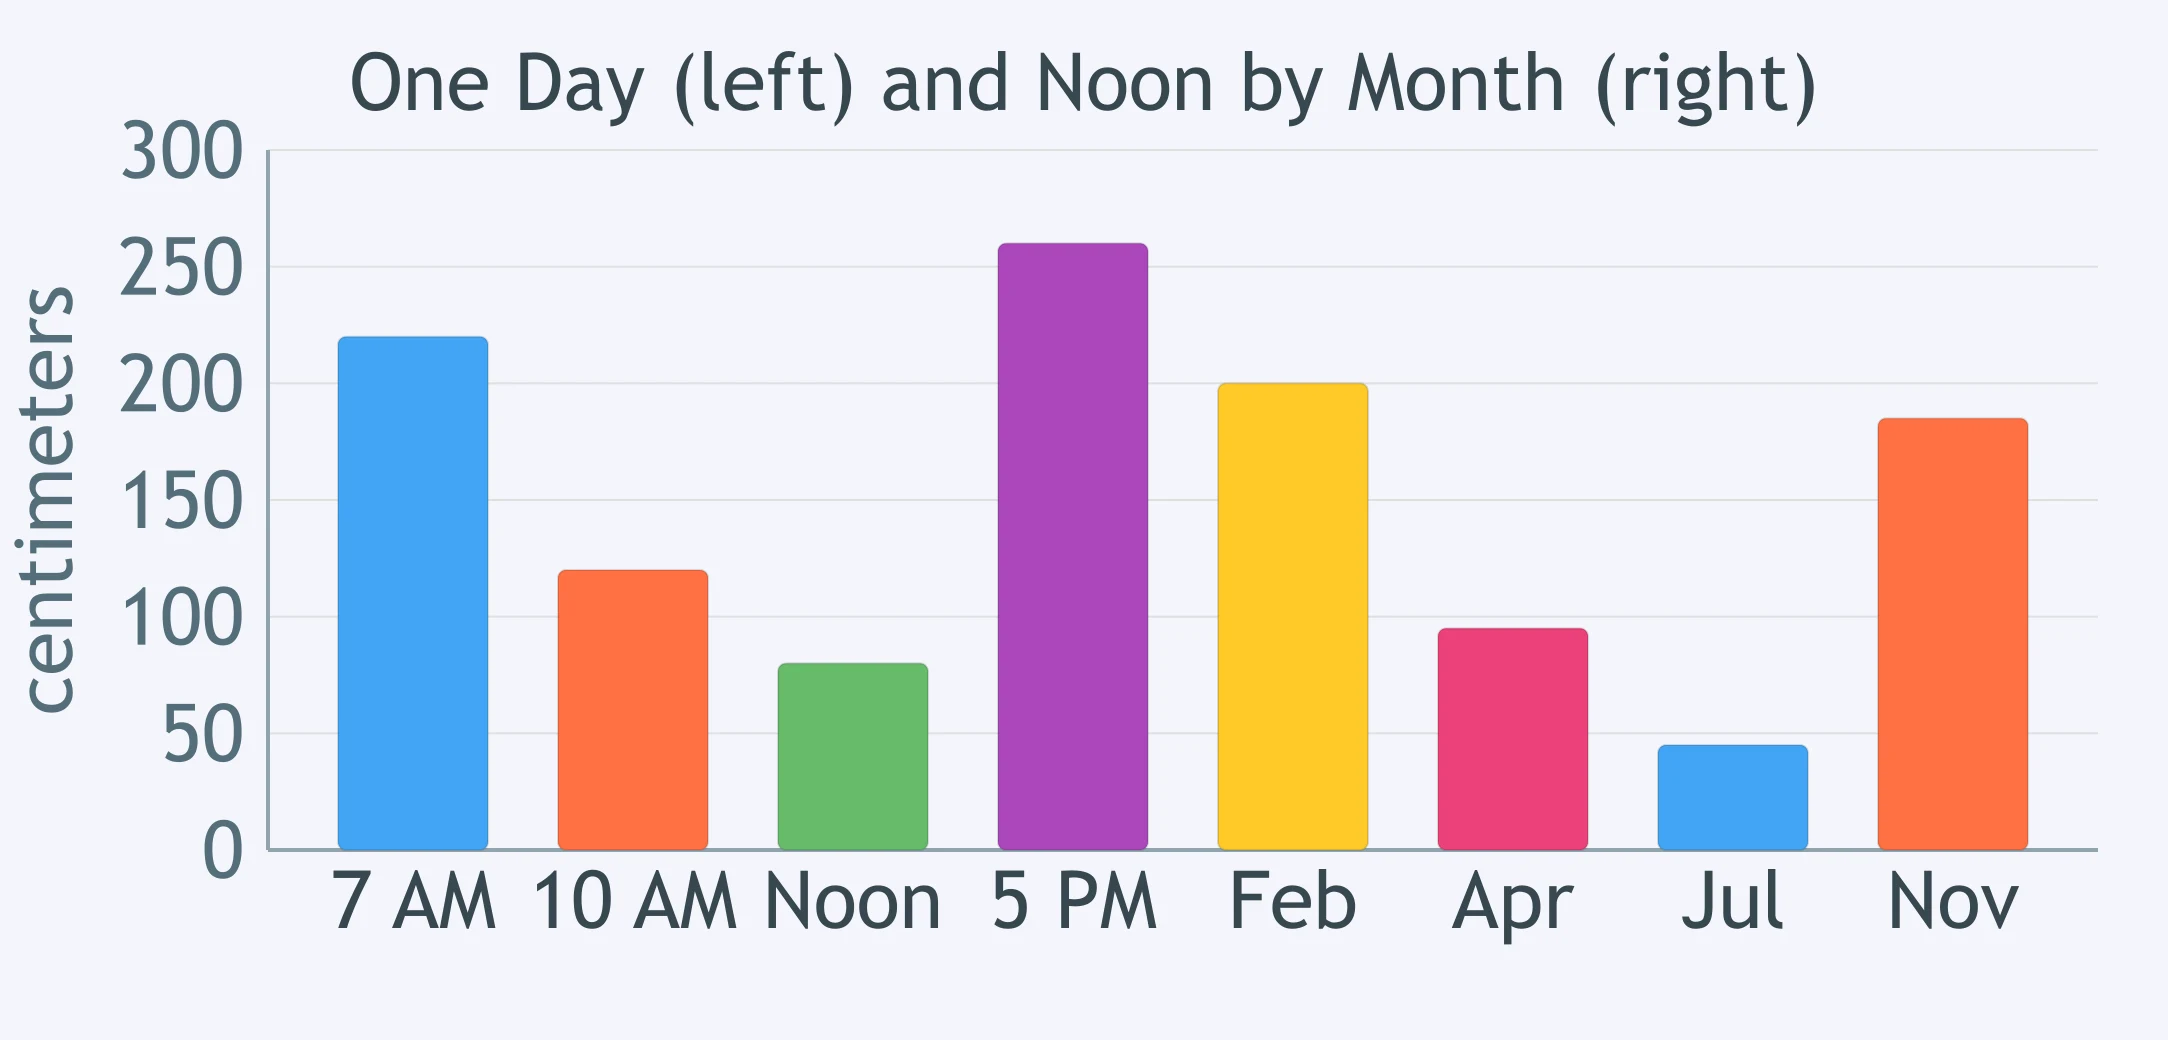
The bar graph shows one pole's shadow. The first four bars are four times on a single day. The last four bars are that same pole's noon shadow in four months. Which statement fits both sets of bars?
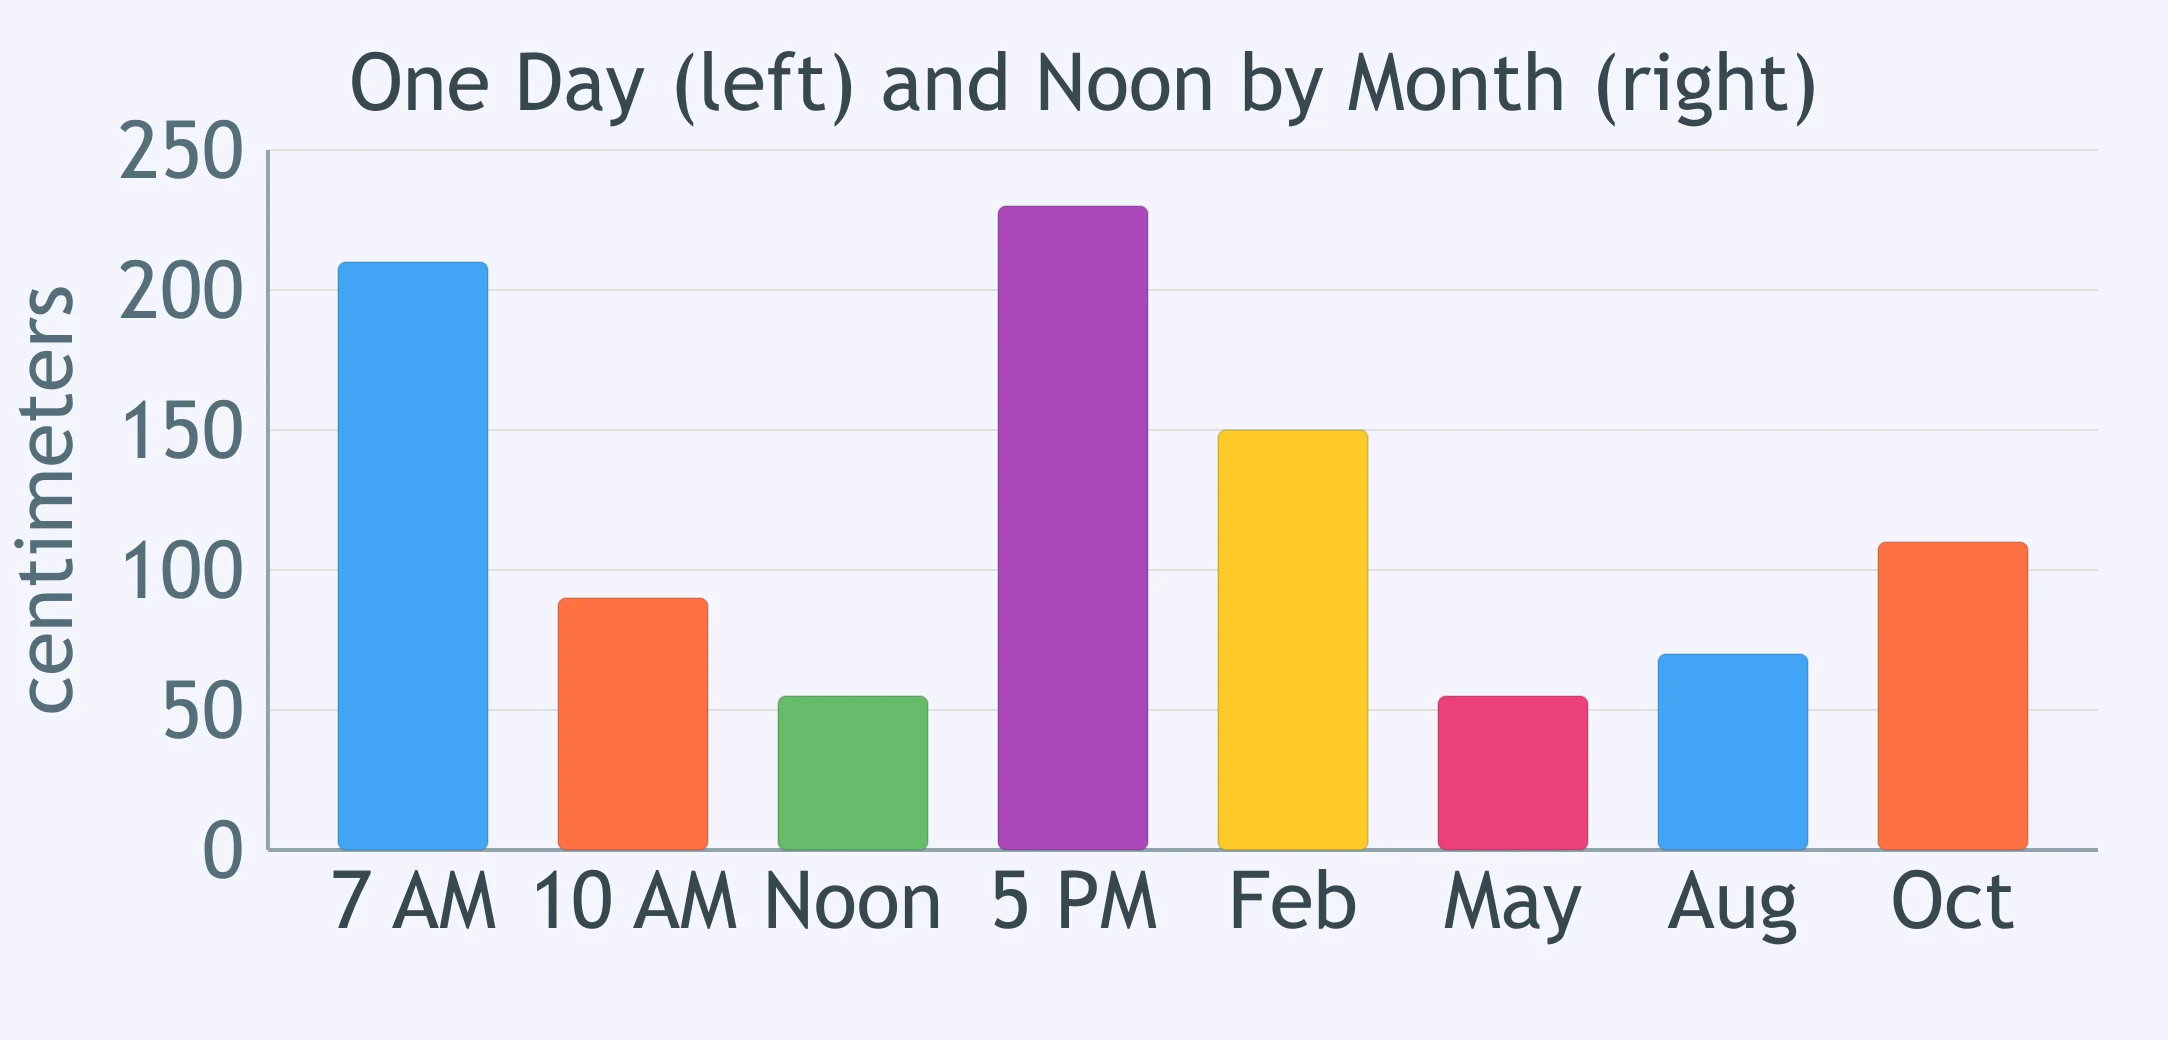
The bar graph shows one pole's shadow length in centimeters. The first four bars are four times on one clear July day. The last four bars are that pole's noon shadow in four months. Which pair, one day bar and one month bar, shows the same length?
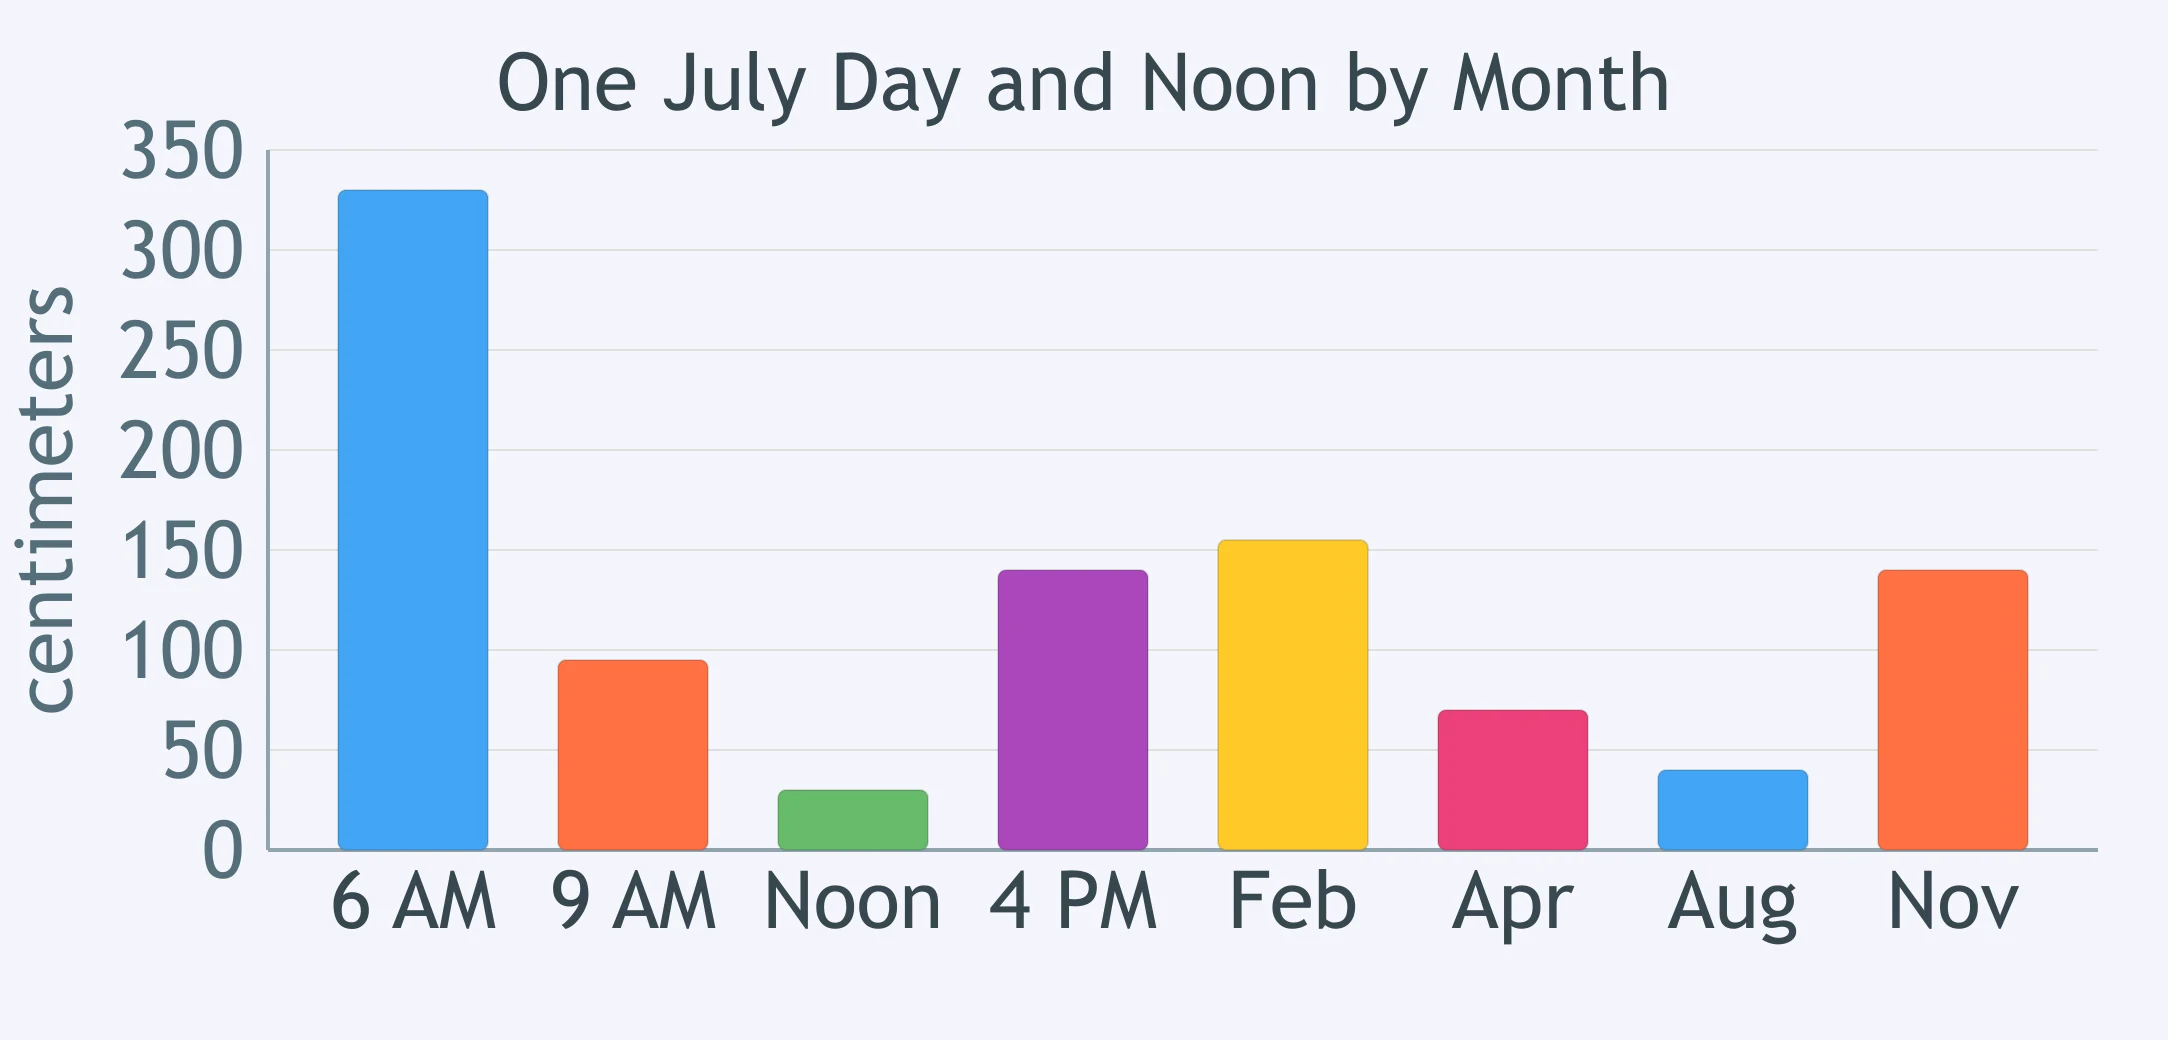
The bar graph shows one flagpole's shadow. The first four bars are four times on a single day. The last four bars are that flagpole's noon shadow in four months. How many of the four months had a noon shadow longer than the 10 AM shadow?
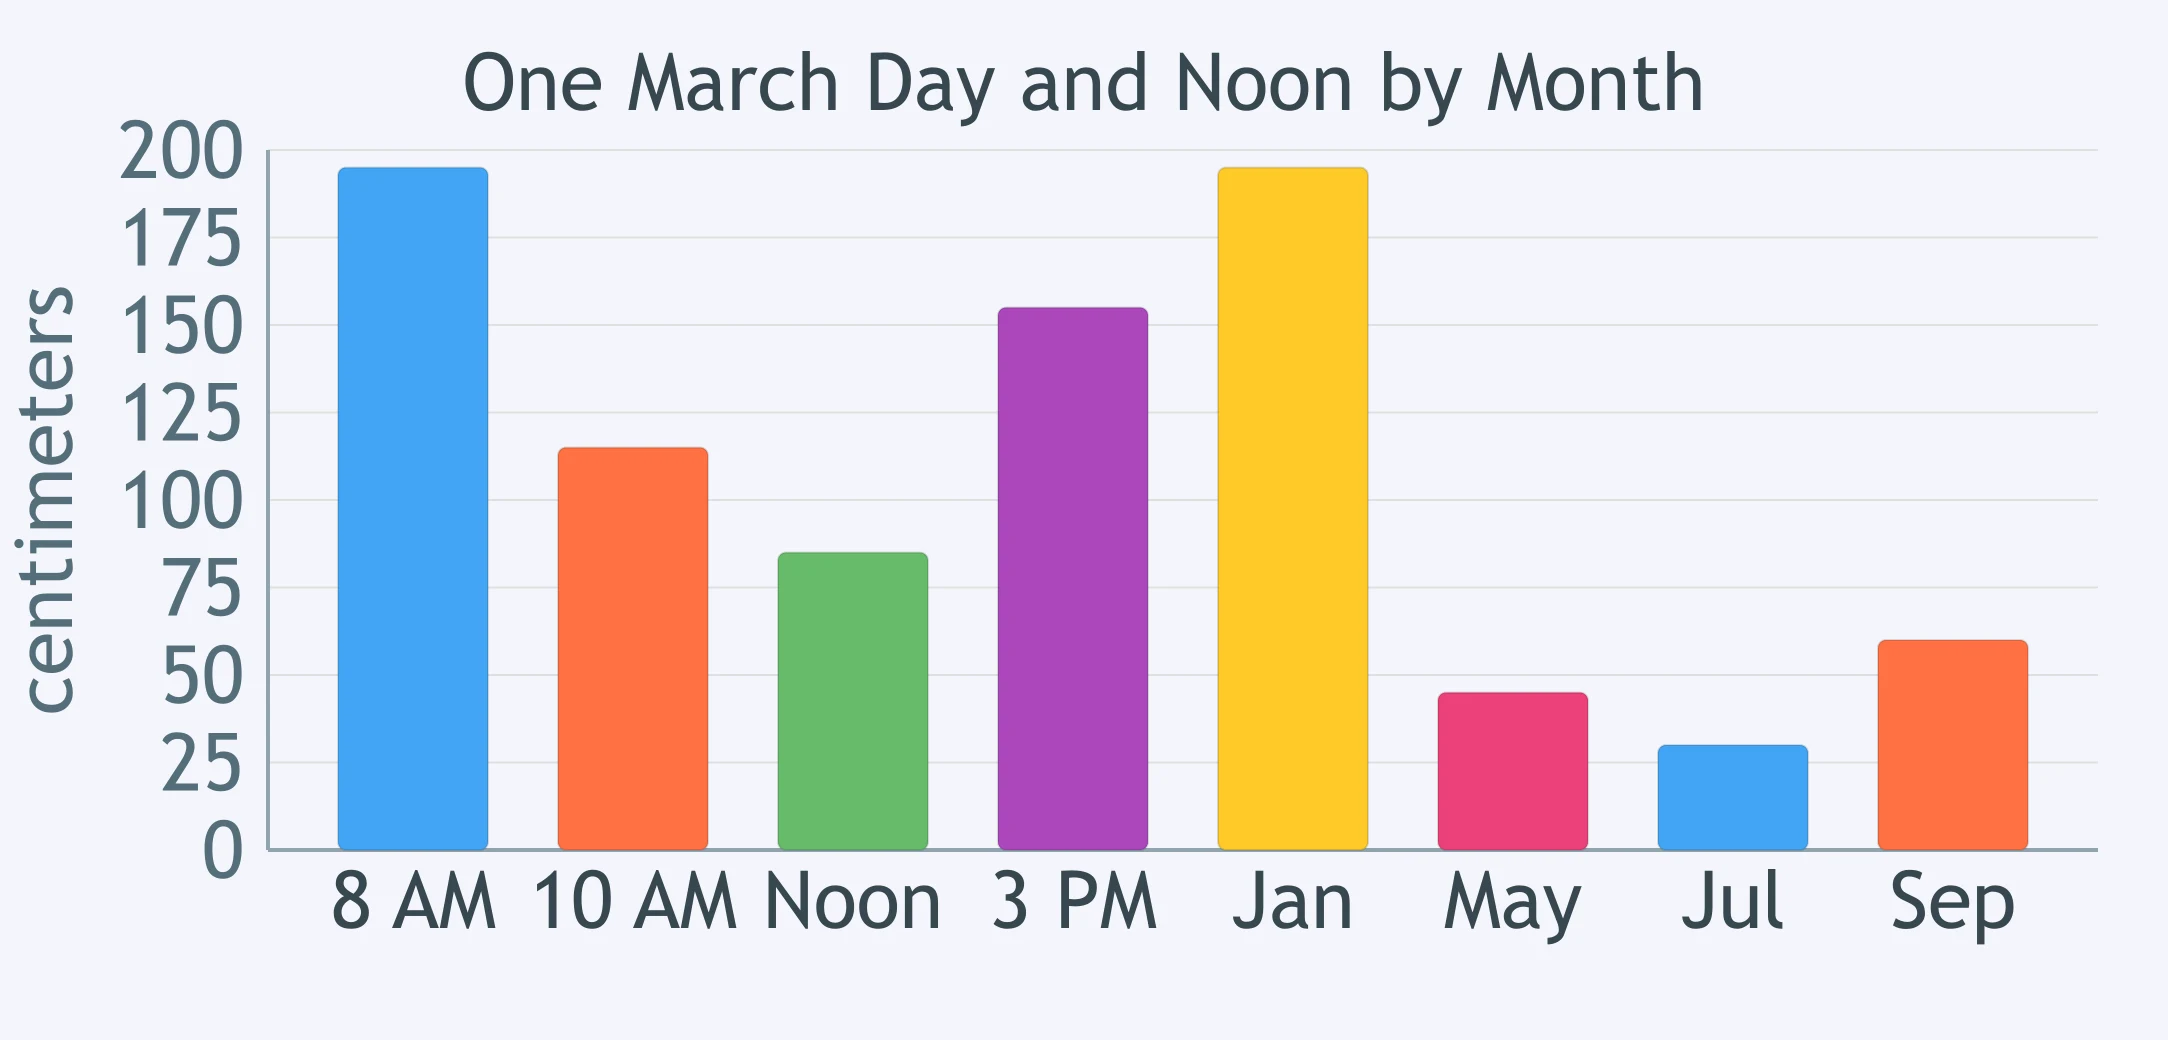
The bar graph shows one flagpole's shadow length in centimeters. The first four bars are four times on one clear day in March. The last four bars are that flagpole's noon shadow in four months. Which pair, one day bar and one month bar, is equal?
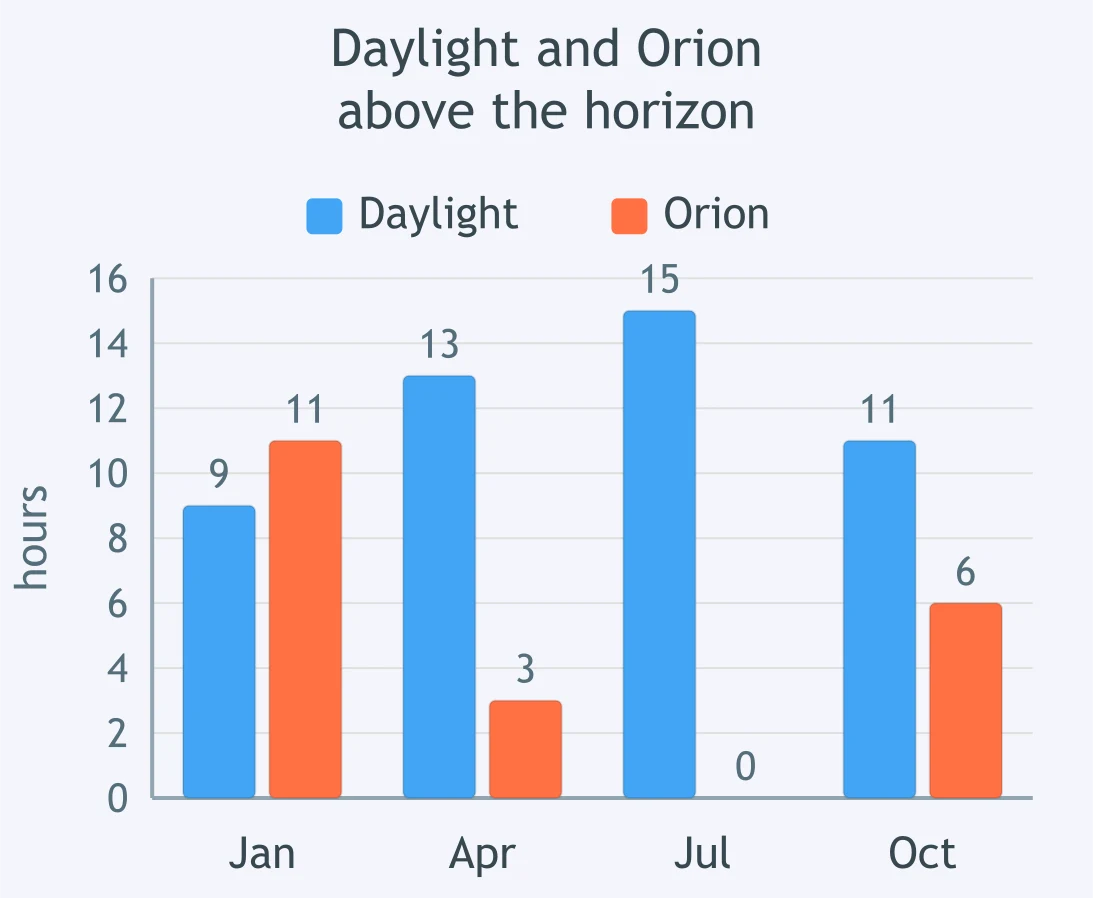
The bar graph shows two data sets for the same town, one bar of each color per month: hours of daylight, and hours the star pattern Orion stayed above the horizon at night. Which statement fits both data sets?
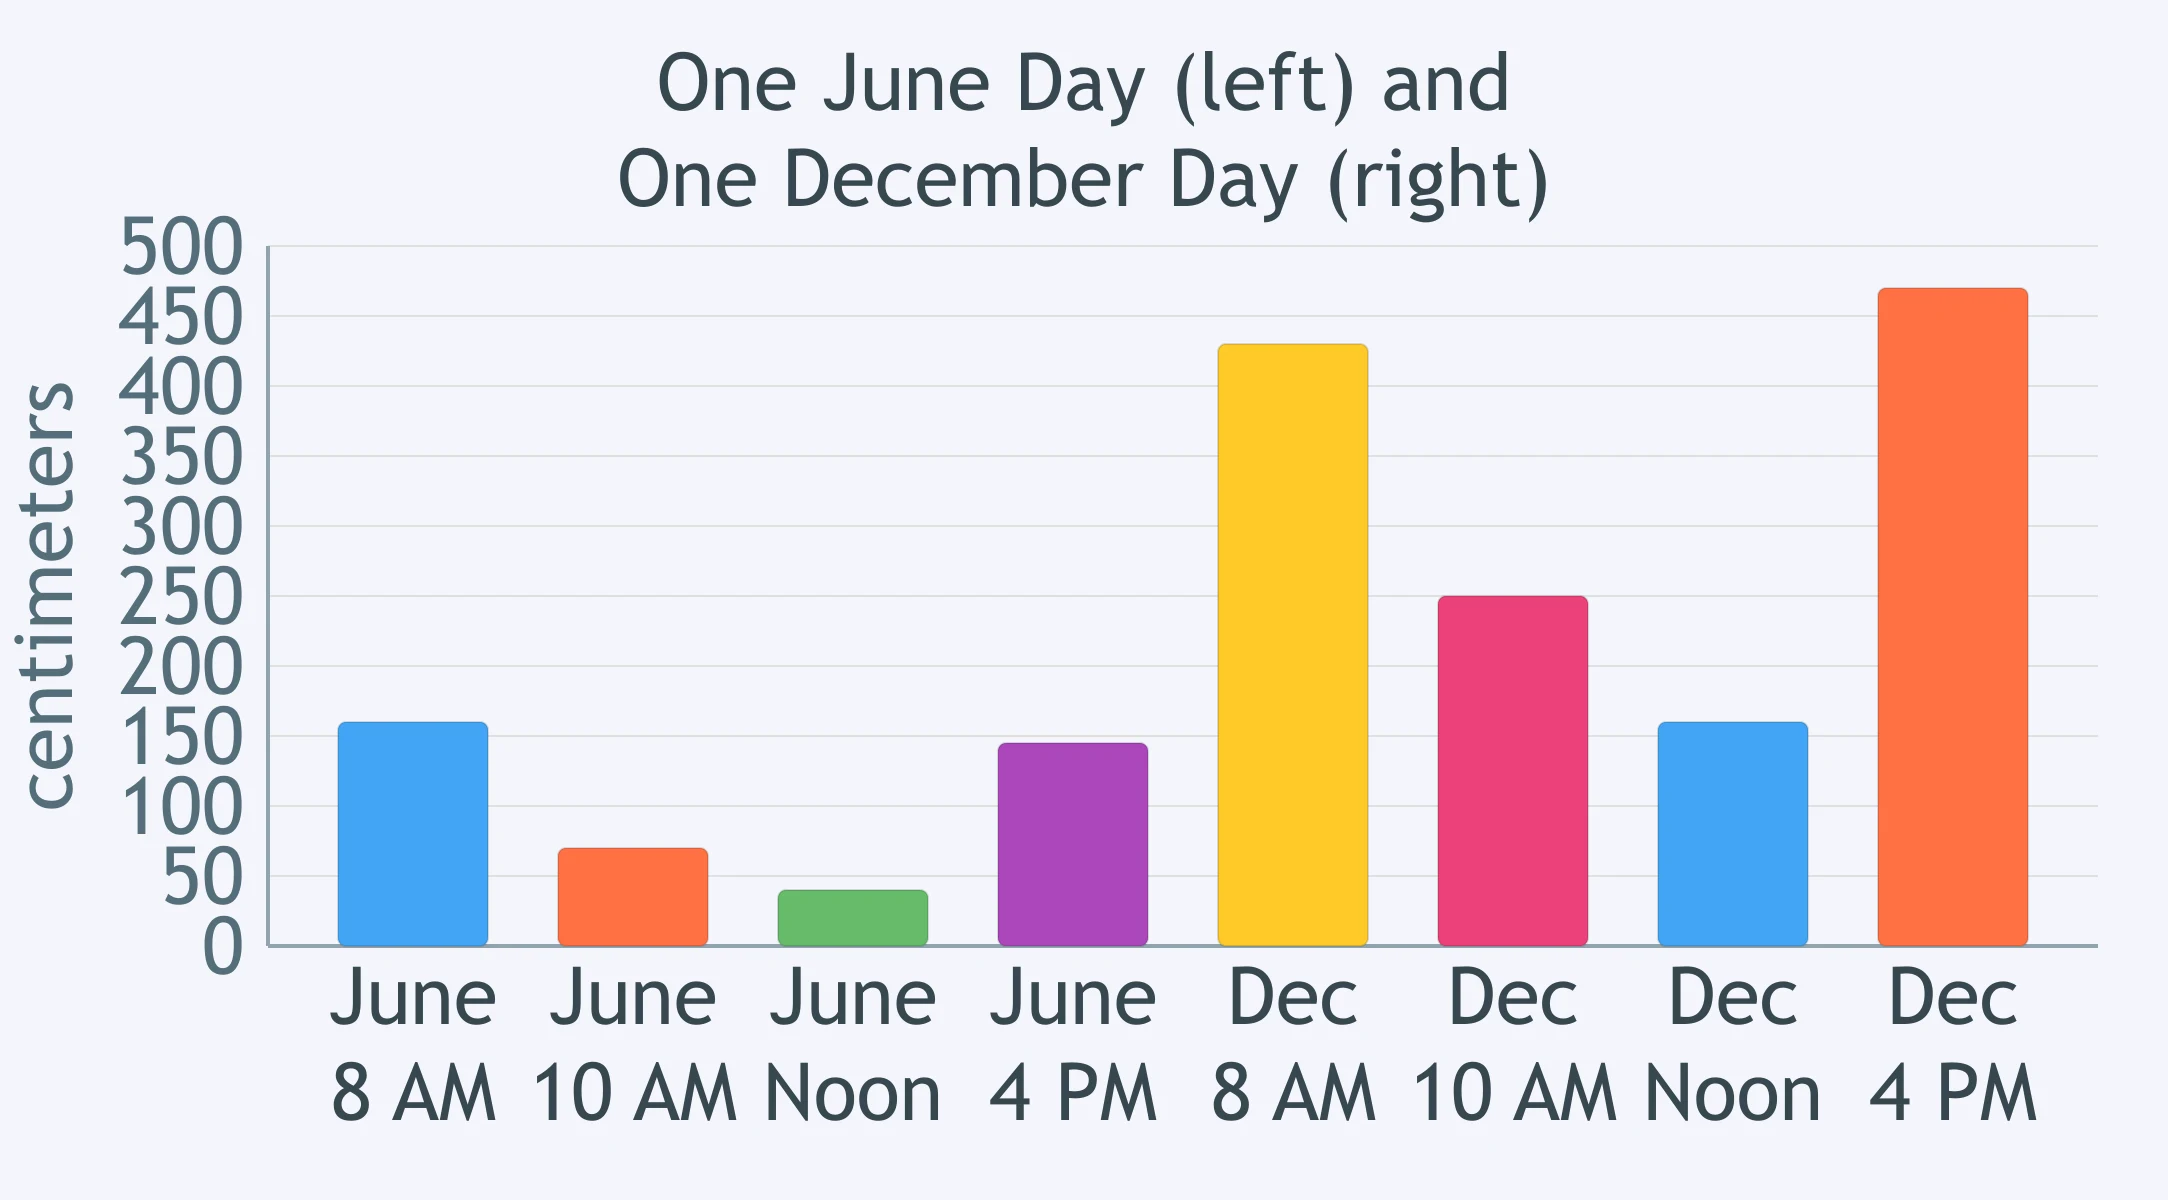
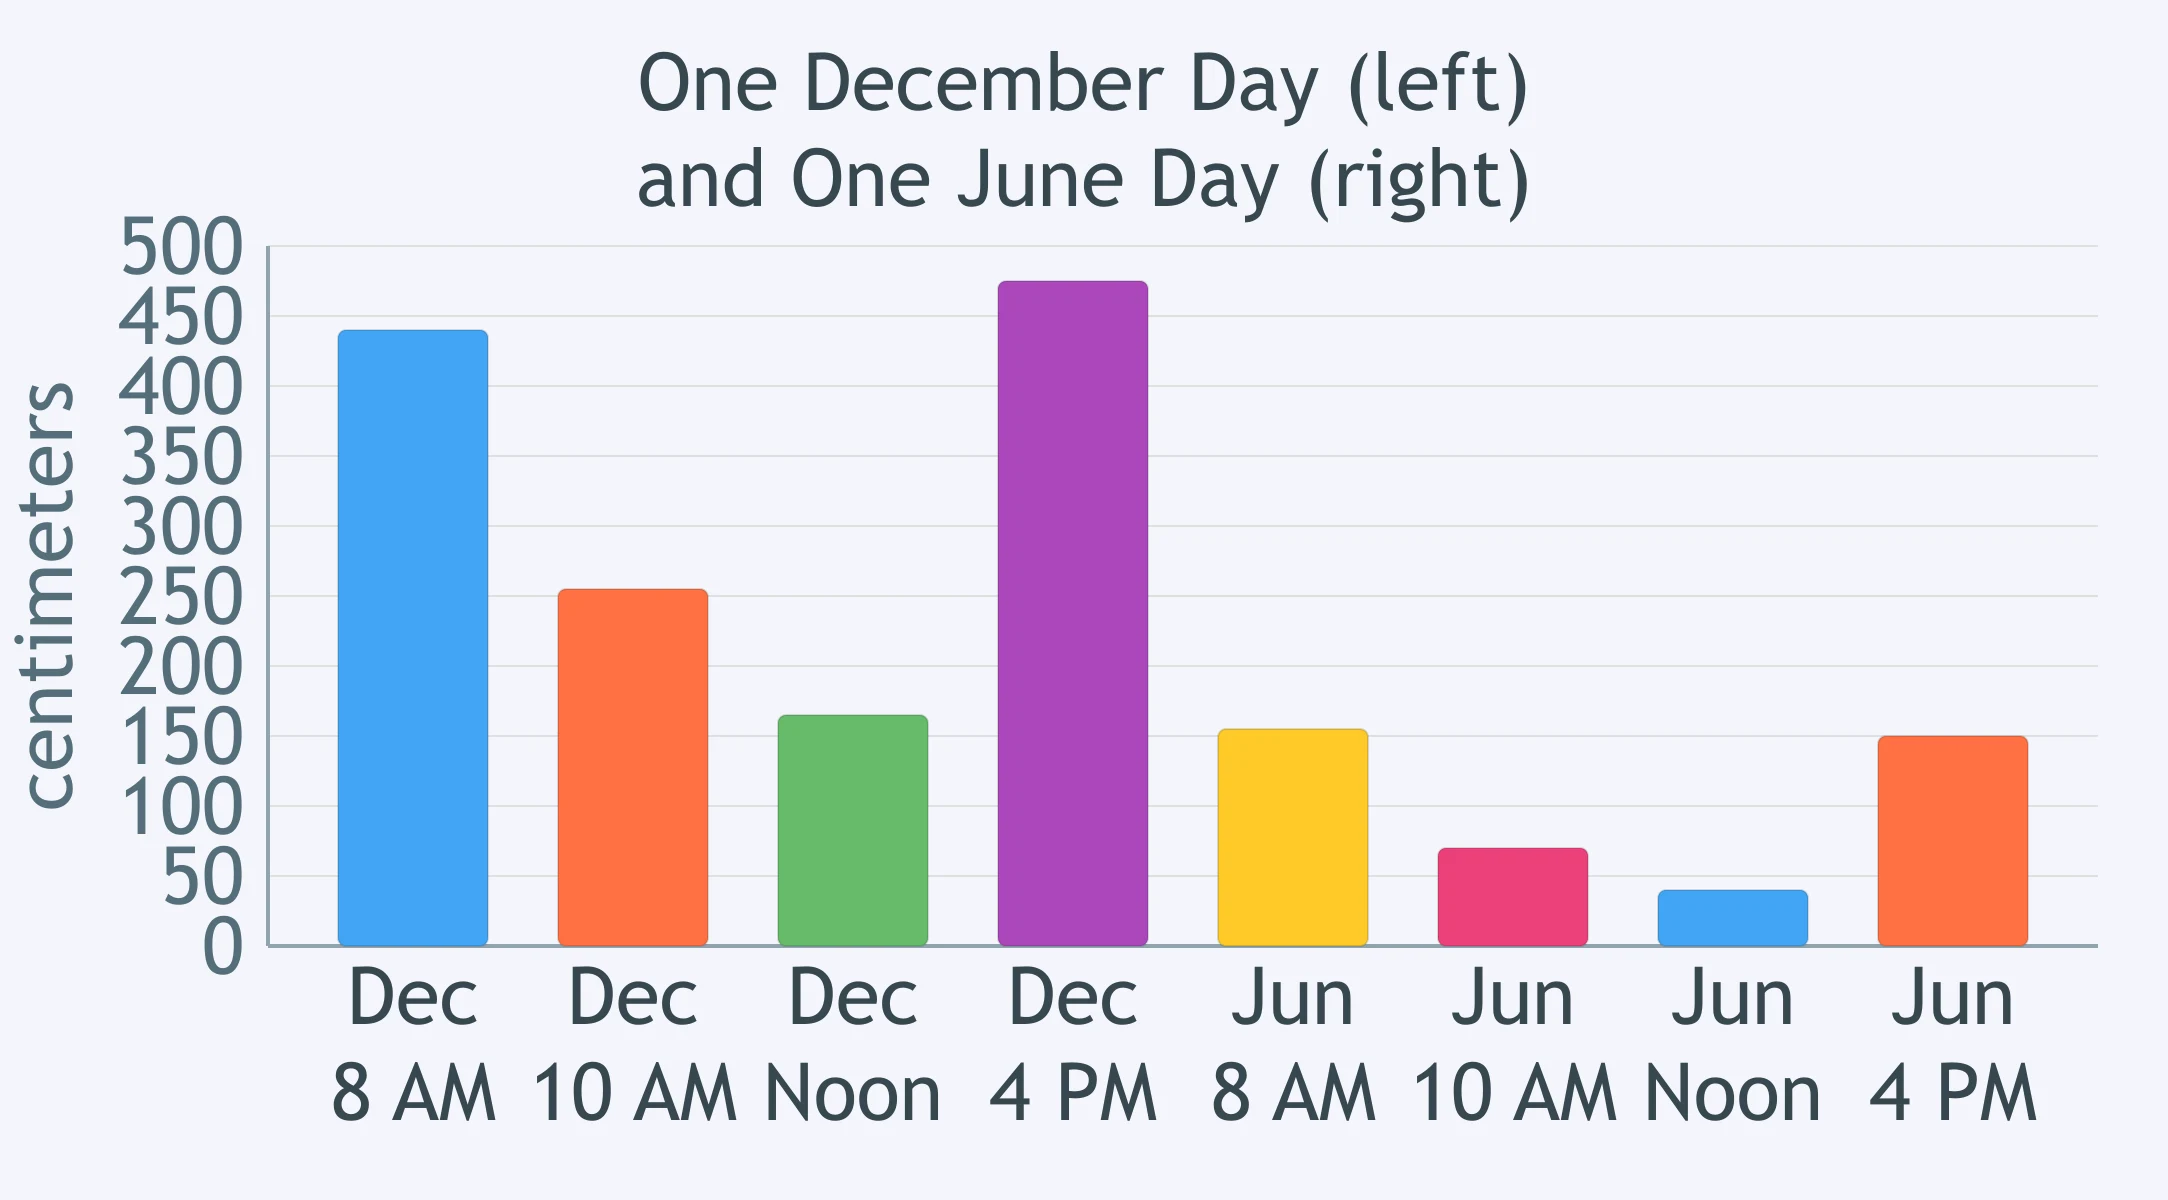
The bar graph shows one pole's shadow. The first four bars are four times on one day in June. The last four bars are the same four times on one day in December. Which statement fits both days?
Seattle has its longest day in June, while Sydney has its shortest day in June. What does comparing these two records show?
In one town, the month with the most daylight was also the month with the shortest noon shadow. What do these two data sets show together?
Over several weeks a town's sunrise came earlier each week and its sunset came later each week. What happened to the number of daylight hours?
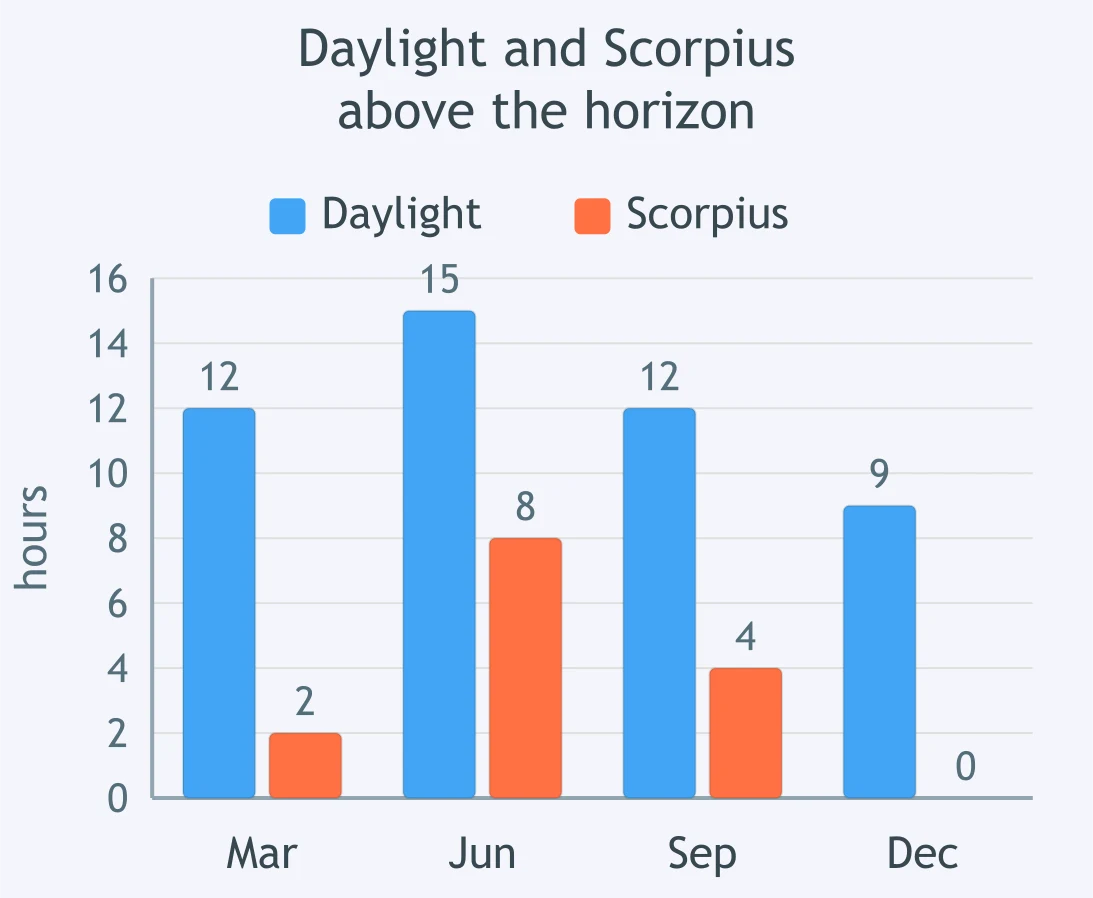
The bar graph shows two data sets for one town, one bar of each color per month: hours of daylight, and hours the star pattern Scorpius stayed above the horizon at night. In which month was daylight 12 hours and Scorpius 4 hours?
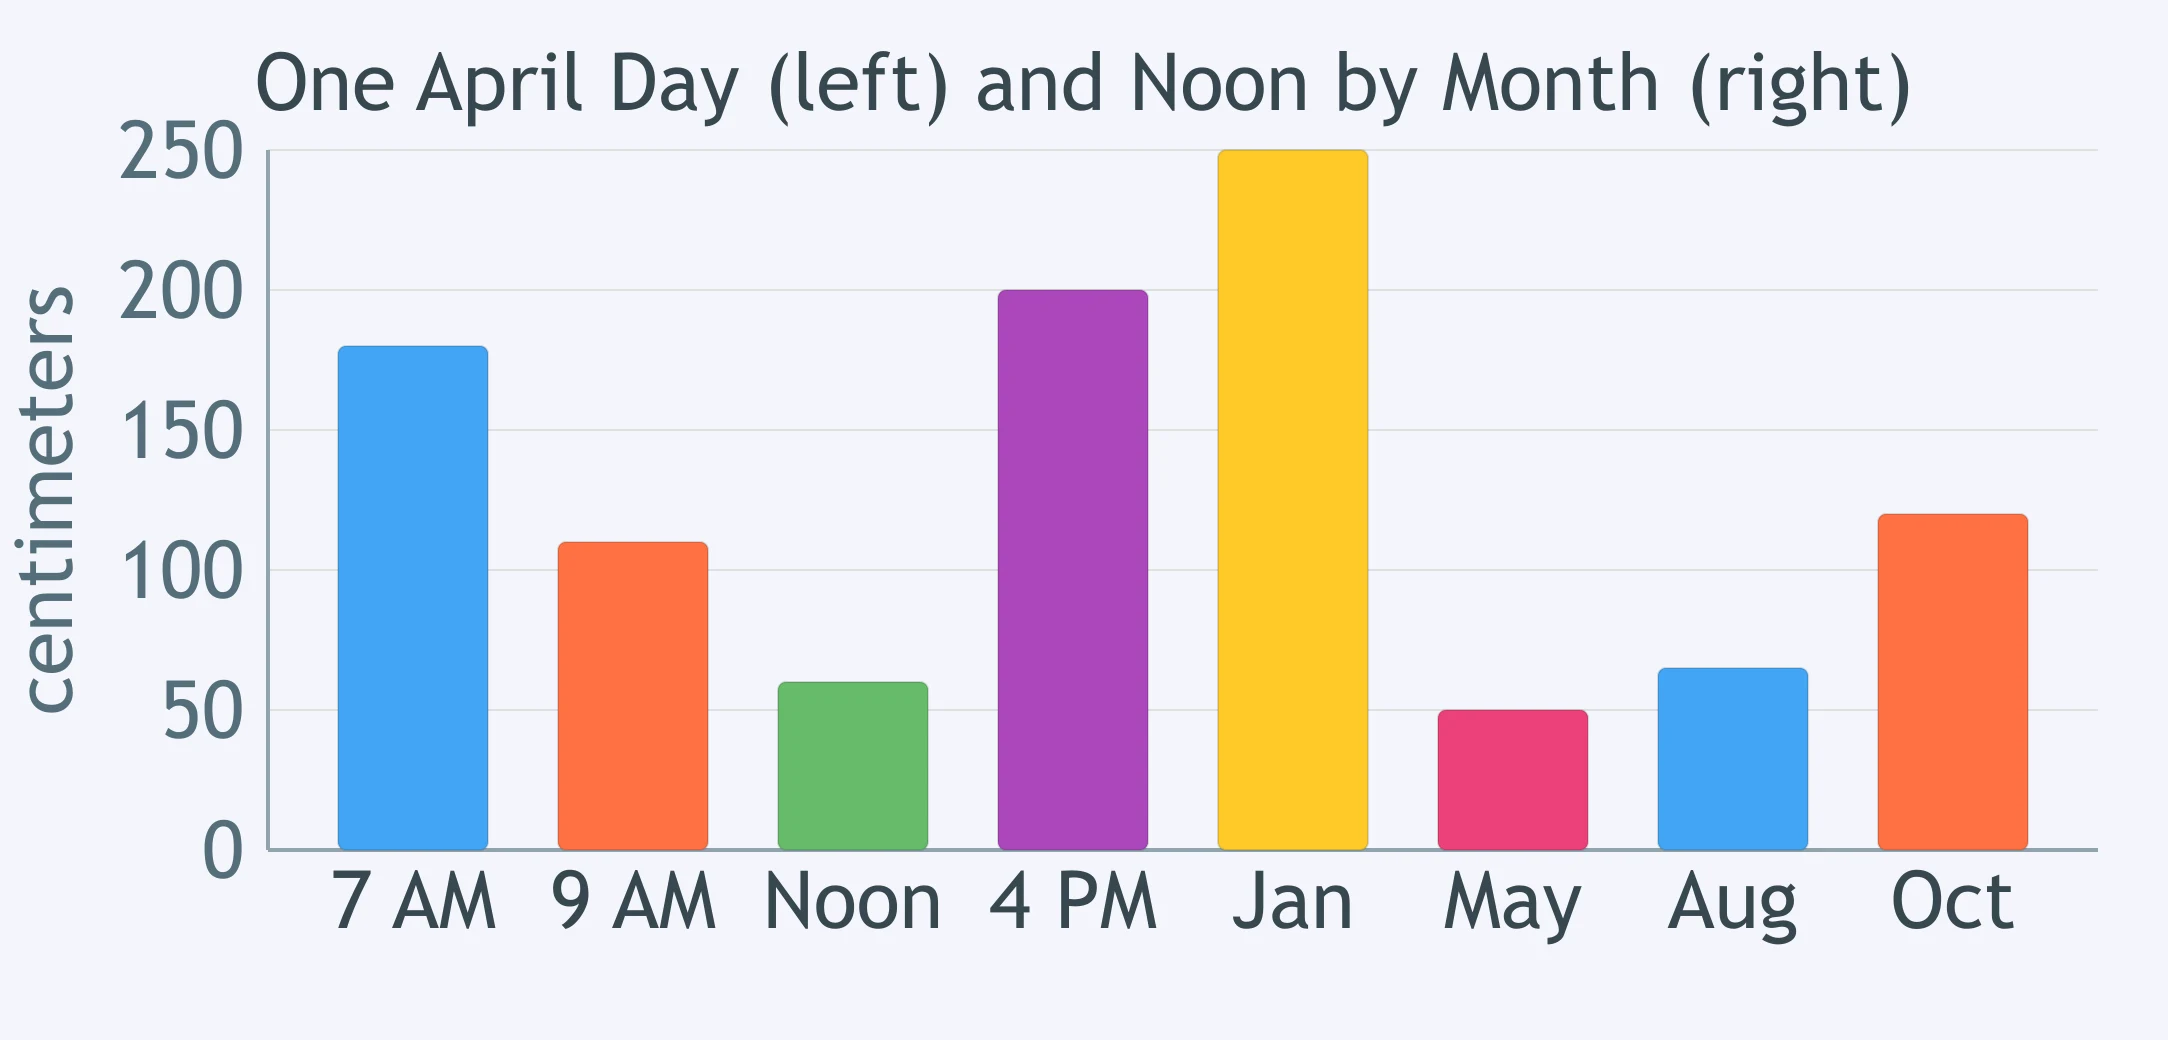
The bar graph shows one pole's shadow. The first four bars are four times on one day in April. The last four bars are that pole's noon shadow in four months. Which month's noon shadow is longer than every shadow on the April day?
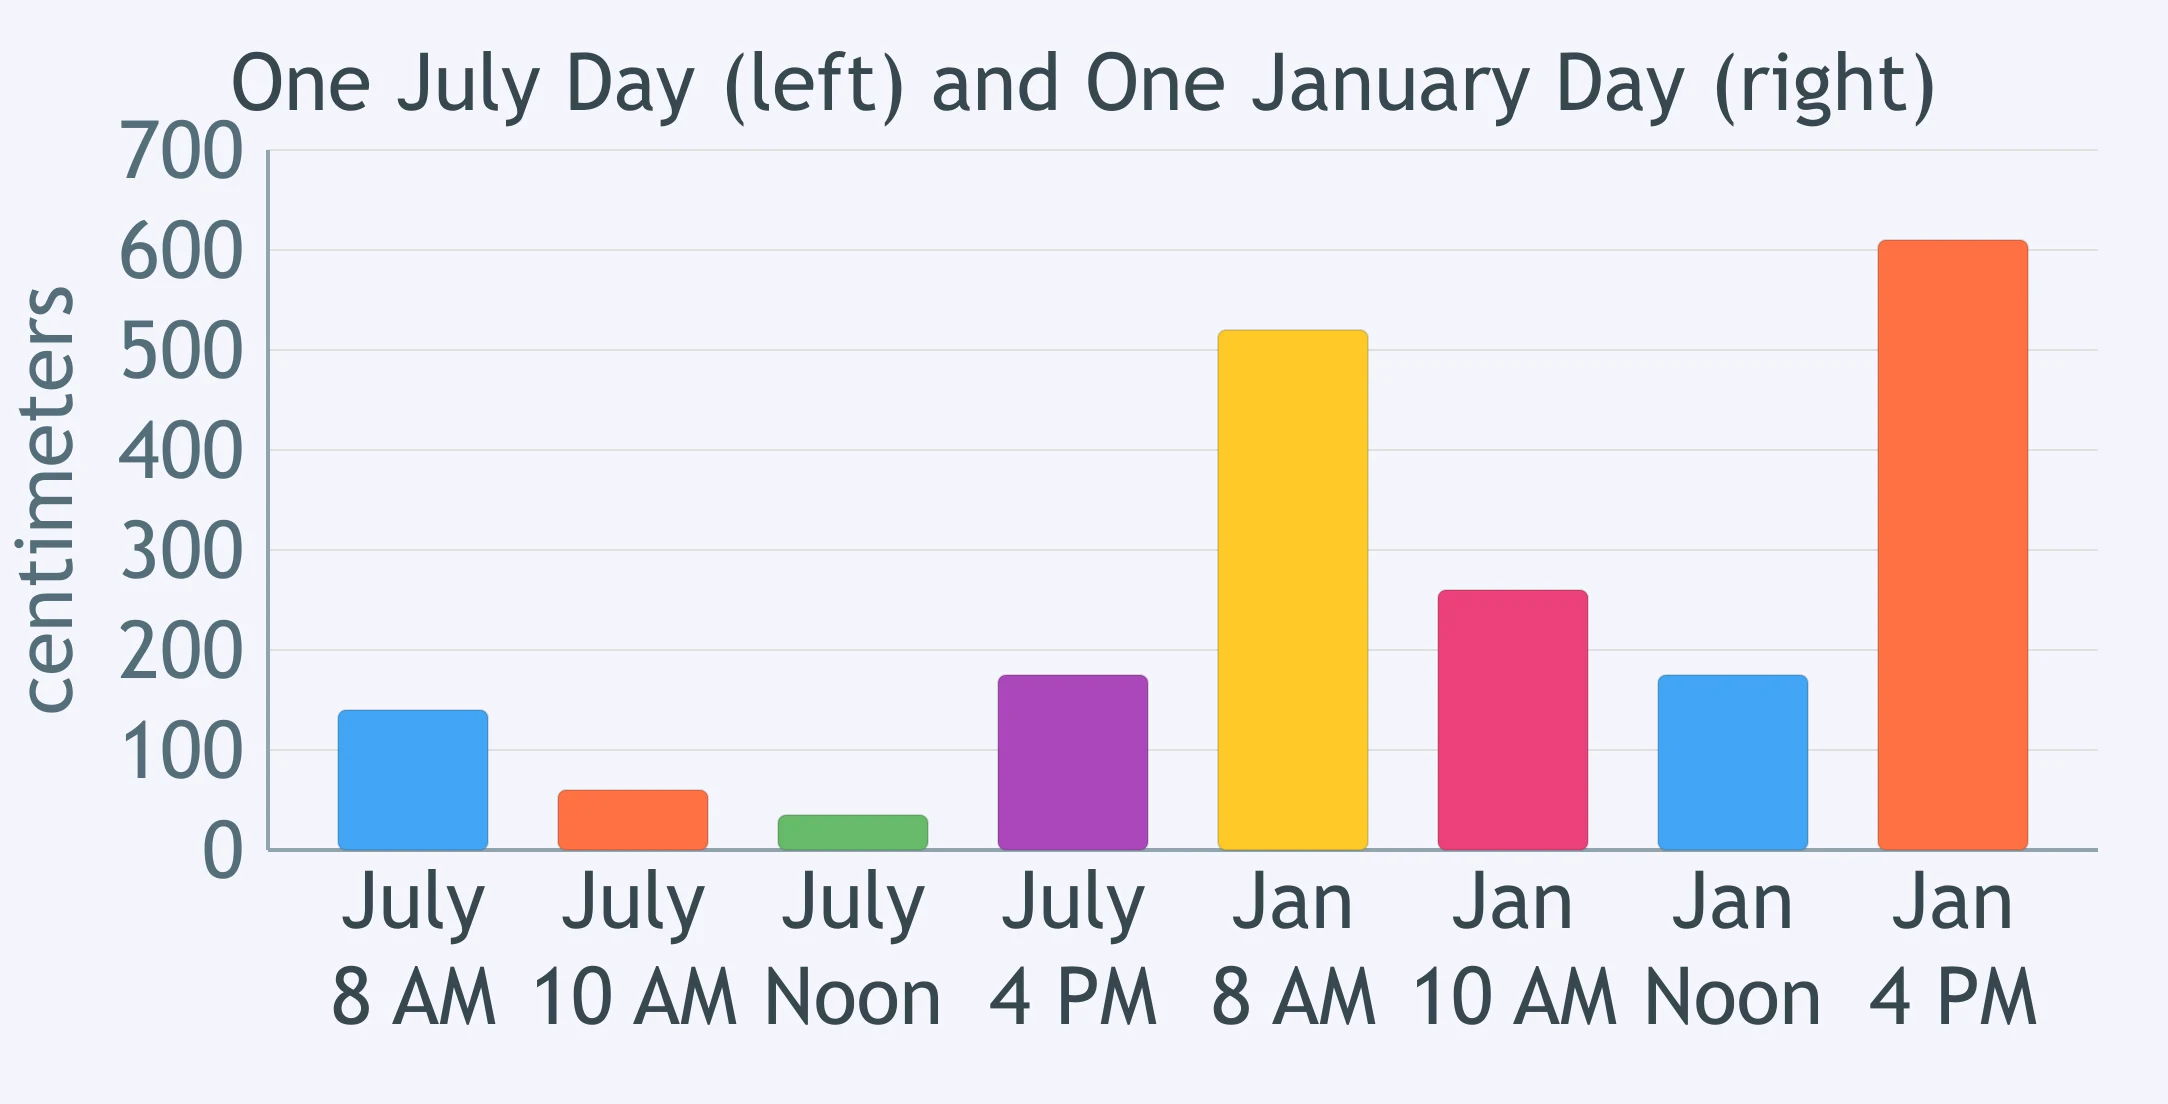
The bar graph shows one post's shadow. The first four bars are four times on one day in July. The last four bars are the same four times on one day in January. Which July time had a shadow as long as the January noon shadow?
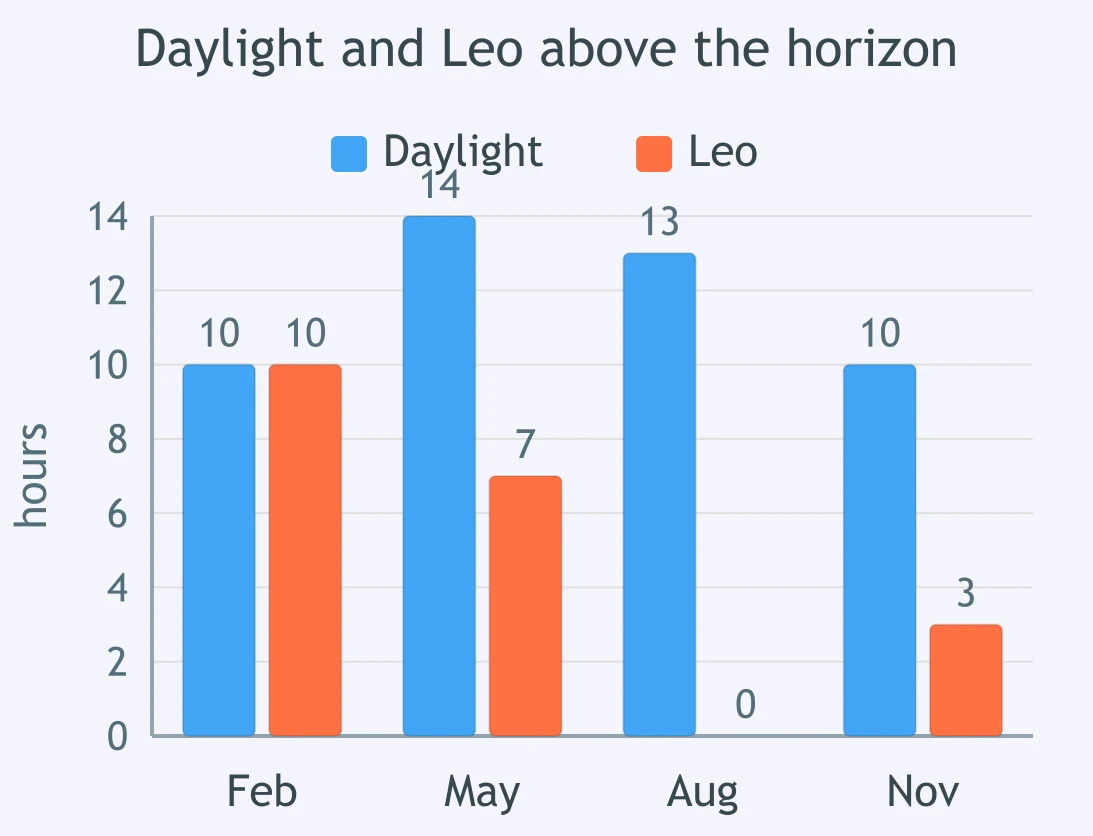
The bar graph shows two data sets for one town, one bar of each color per month: hours of daylight, and hours the star pattern Leo stayed above the horizon at night. In which month do the daylight hours equal the Leo hours?
In June, two towns recorded their daylight hours. The town farther north recorded more hours of daylight. What idea does this comparison support?
A class kept a table of sunset times and a table of noon shadow lengths for one year. Which question can the sunset table answer by itself?
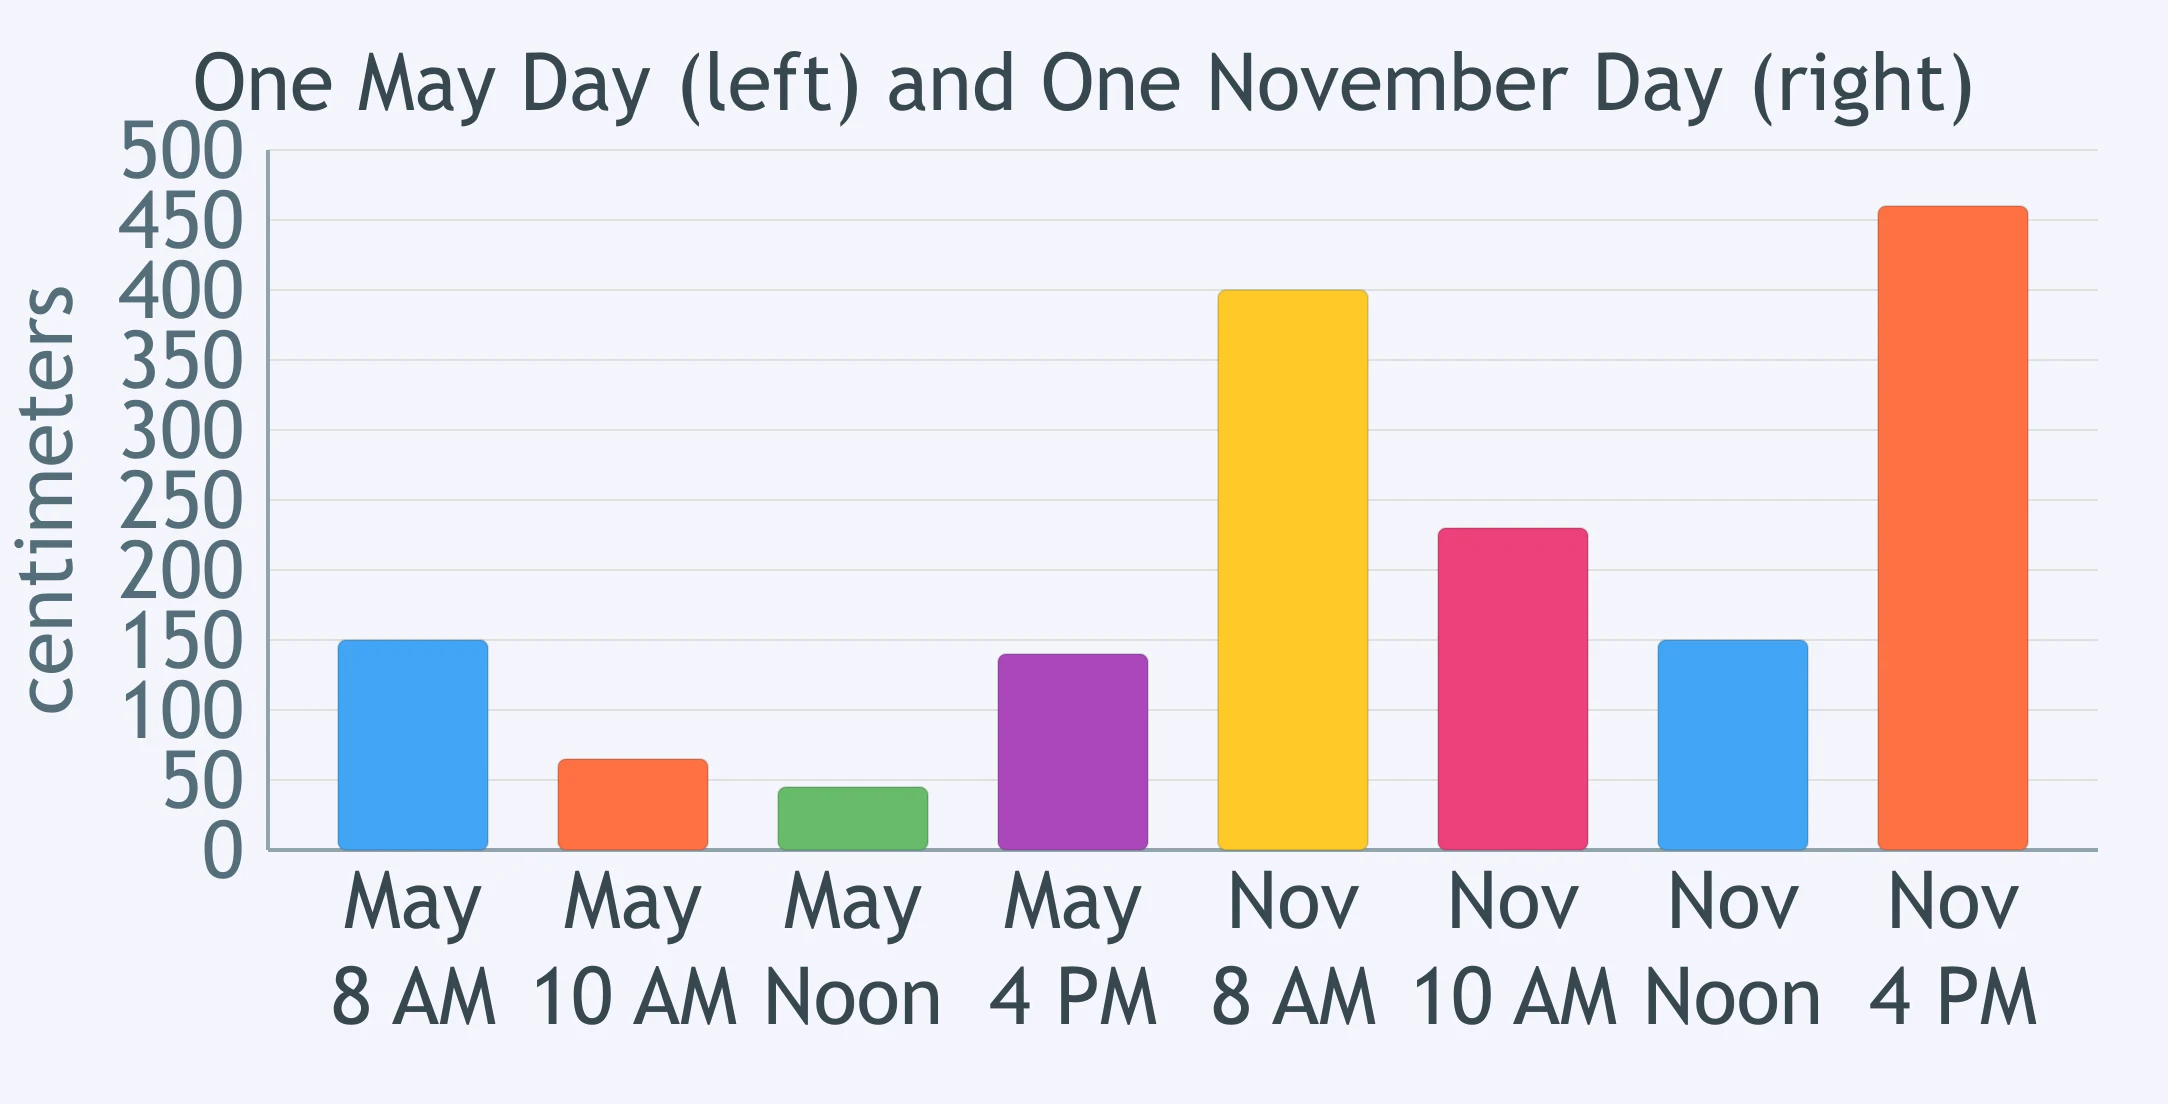
The bar graph shows one pole's shadow. The first four bars are four times on one day in May. The last four bars are the same four times on one day in November. At which time of day is the gap between the two days largest?
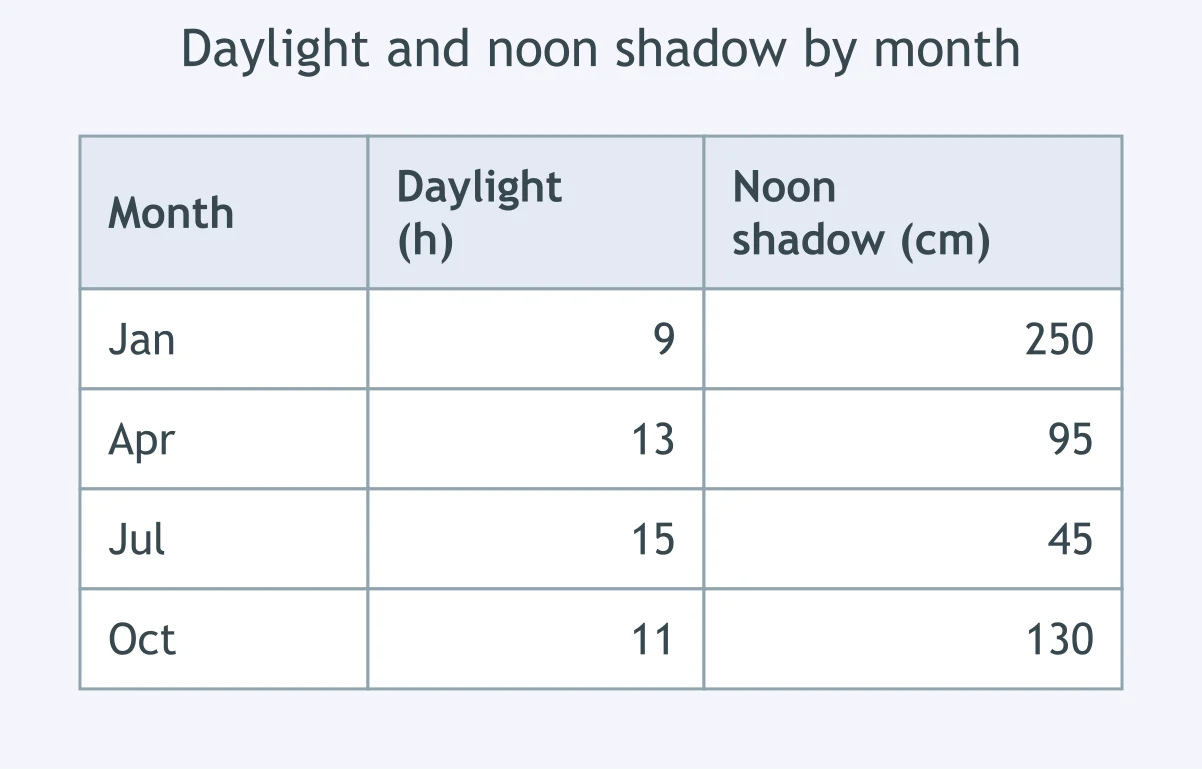
The table shows two measurements for one town in four months: hours of daylight, and the noon shadow of the same pole. Which statement fits both columns?
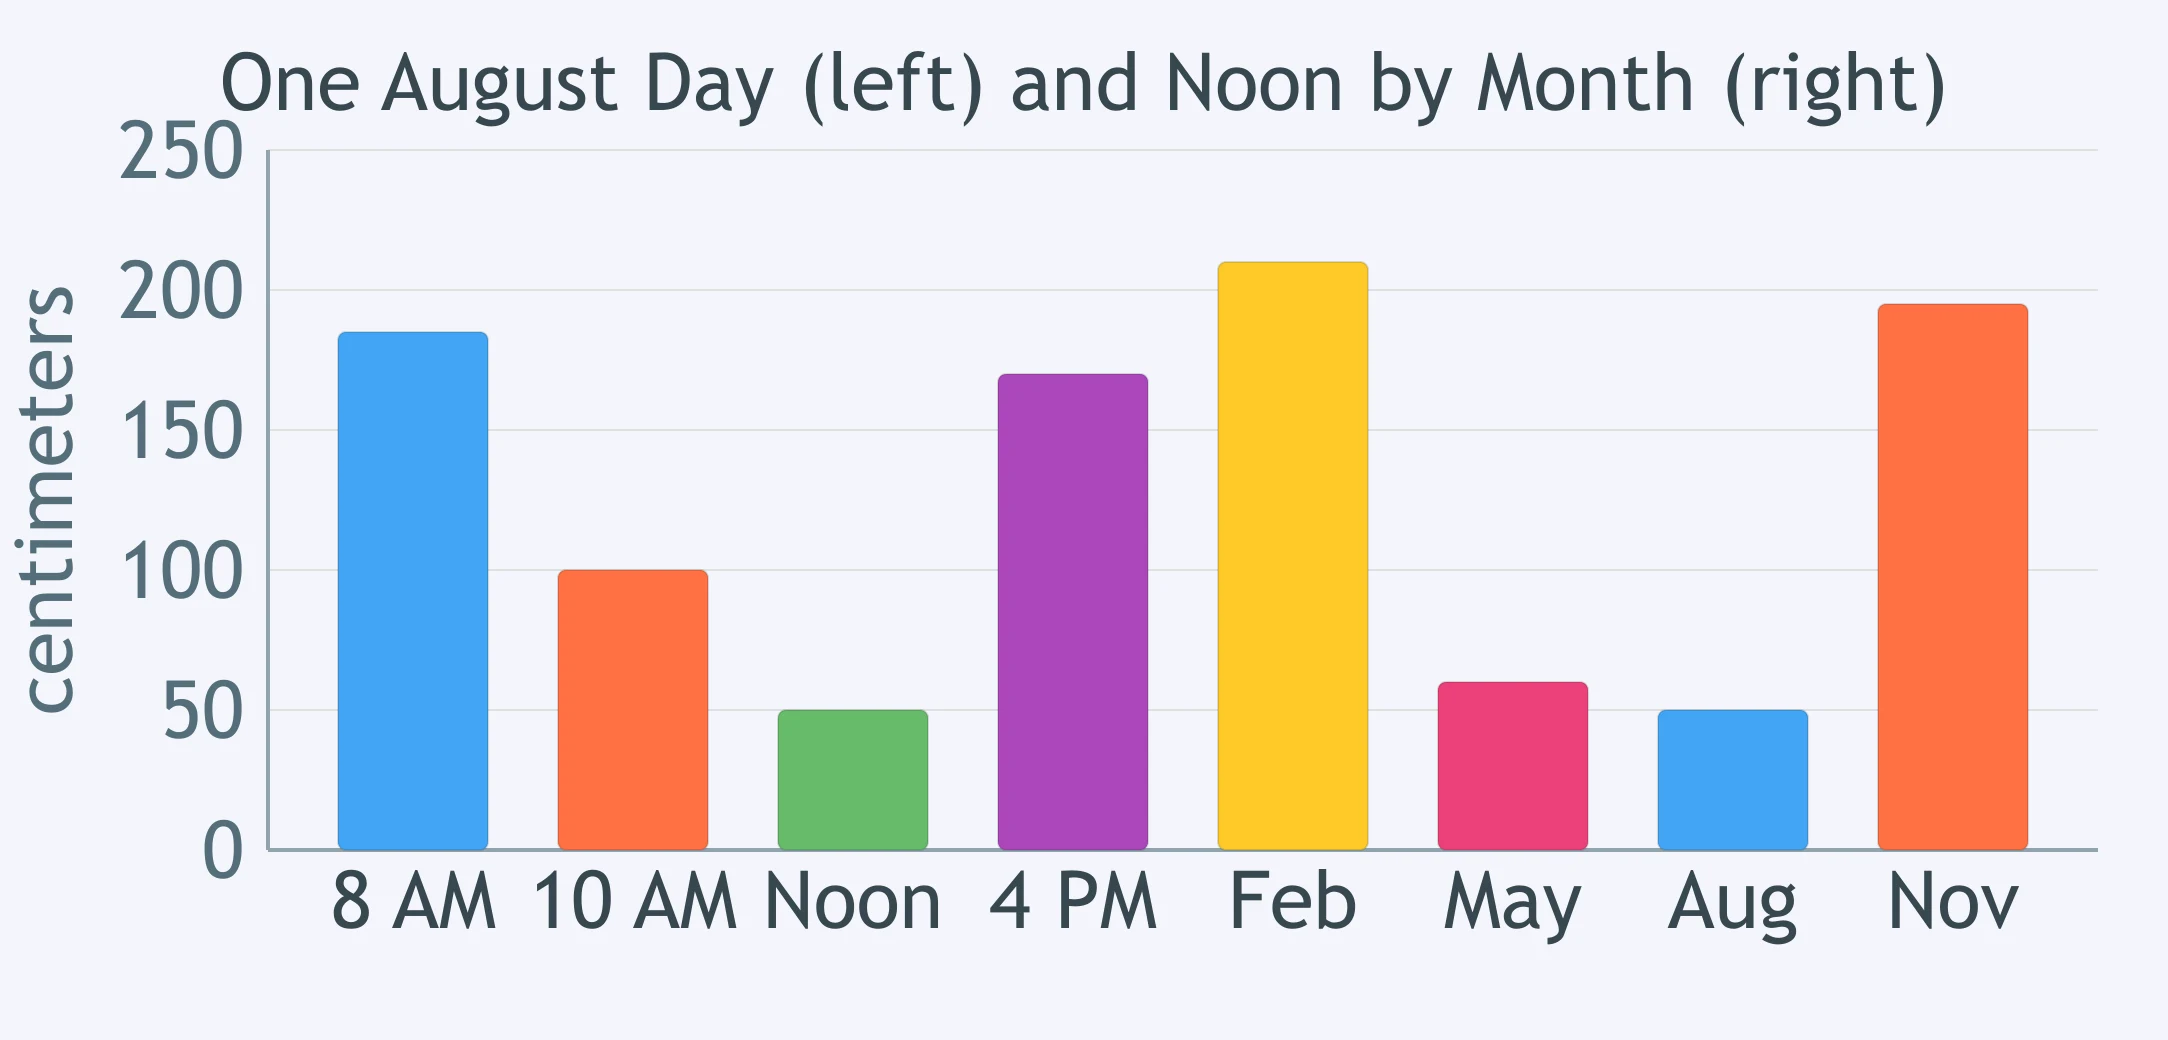
The bar graph shows one pole's shadow. The first four bars are four times on one day in August. The last four bars are that pole's noon shadow in four months. Which pattern do the two sets of bars share?
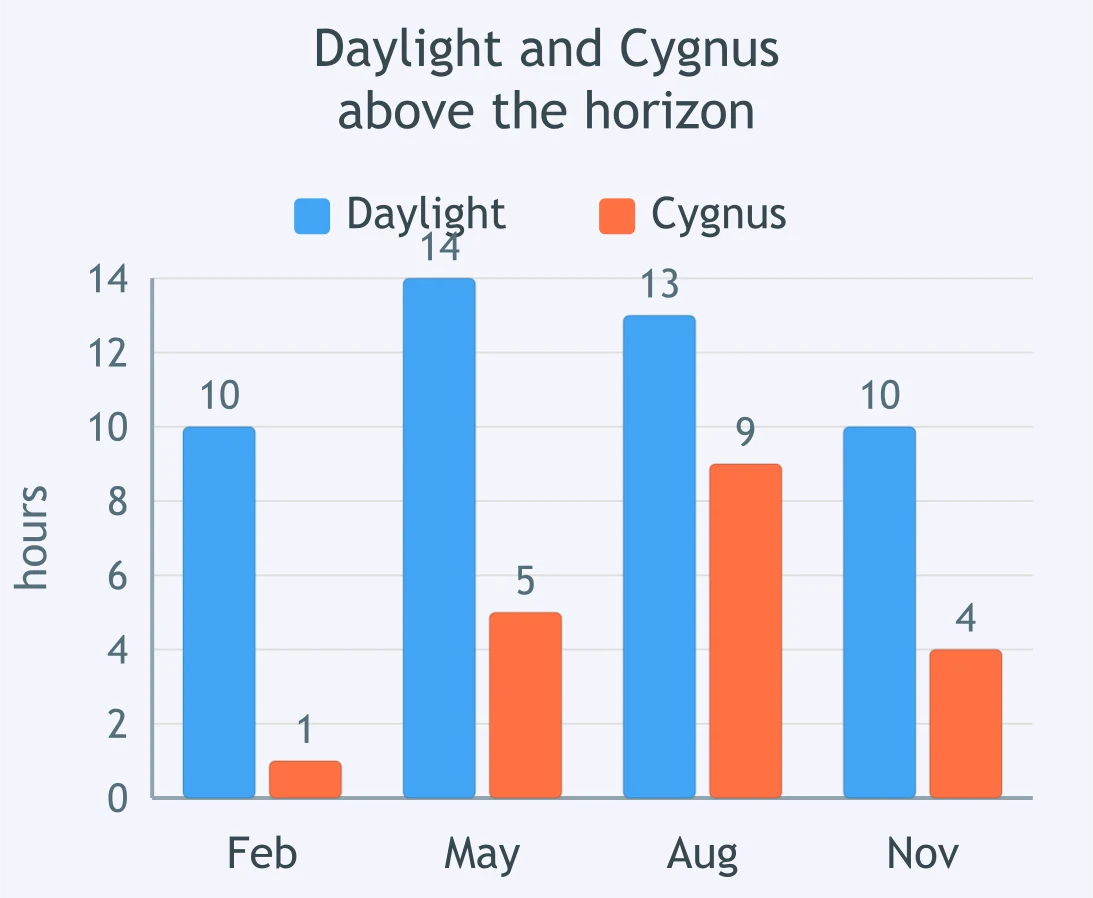
The bar graph shows two data sets for one town, one bar of each color per month: hours of daylight, and hours the star pattern Cygnus stayed above the horizon. Which claim do both data sets support?
The bar graph shows one pole's shadow. The first four bars are four times on one day in December. The last four bars are the same four times on one day in June. What do the two days show together?
Crack the passcode before the zombies get in.
Answer, then swat bugs for bonus points.
Race through questions at your own speed.
Same question on every screen. Fastest wins.

Pick a tile, answer, hit bonuses and steals.
Earth Systems: Living Things, Air, and Rock
20 questions