Loading
by BlastRoom
Read values and trends off tables and graphs, and spot sources of error and limits in the data.
#us_grade_8_science
40 questions
One question set, multiple game modes. Tap any game to see it in action. Not sure which to pick?
Answer to place stones and capture territory.
Outrun the snow together.
Earn blasts, then hunt the other team.
Answer to earn energy, then climb.

The class blasts through walls together.
Bid on mystery lots. Most money wins.
Sell tours. Nice, standard, or a total scam.

Answer, restock, and serve the rush.
More correct answers pulls the rope your way.
Answer, then shoot down the alien wave.
Answer, then tap to leap the frozen ridge.
A table records a river's flow rate: 6 a.m., 12 m3/s; 9 a.m., 18 m3/s; noon, 27 m3/s; 3 p.m., 33 m3/s. During which interval did the flow rate rise the most?
A speed-time graph for a toy car passes through these points: 0 s, 0 m/s; 2 s, 1.5 m/s; 4 s, 3.0 m/s; 6 s, 3.0 m/s; 8 s, 1.0 m/s. During which time span did the car move at a constant speed?
A table of densities lists aluminum, 2.7 g/cm3; iron, 7.9 g/cm3; copper, 8.9 g/cm3; lead, 11.3 g/cm3. A 10 cm3 block of one of these metals has a mass of 89 g. Which metal is it?
A bar graph shows litter collected by a school club: Monday, 12 kg; Tuesday, 7 kg; Wednesday, 15 kg; Thursday, 9 kg. On which day did the club collect the most litter?
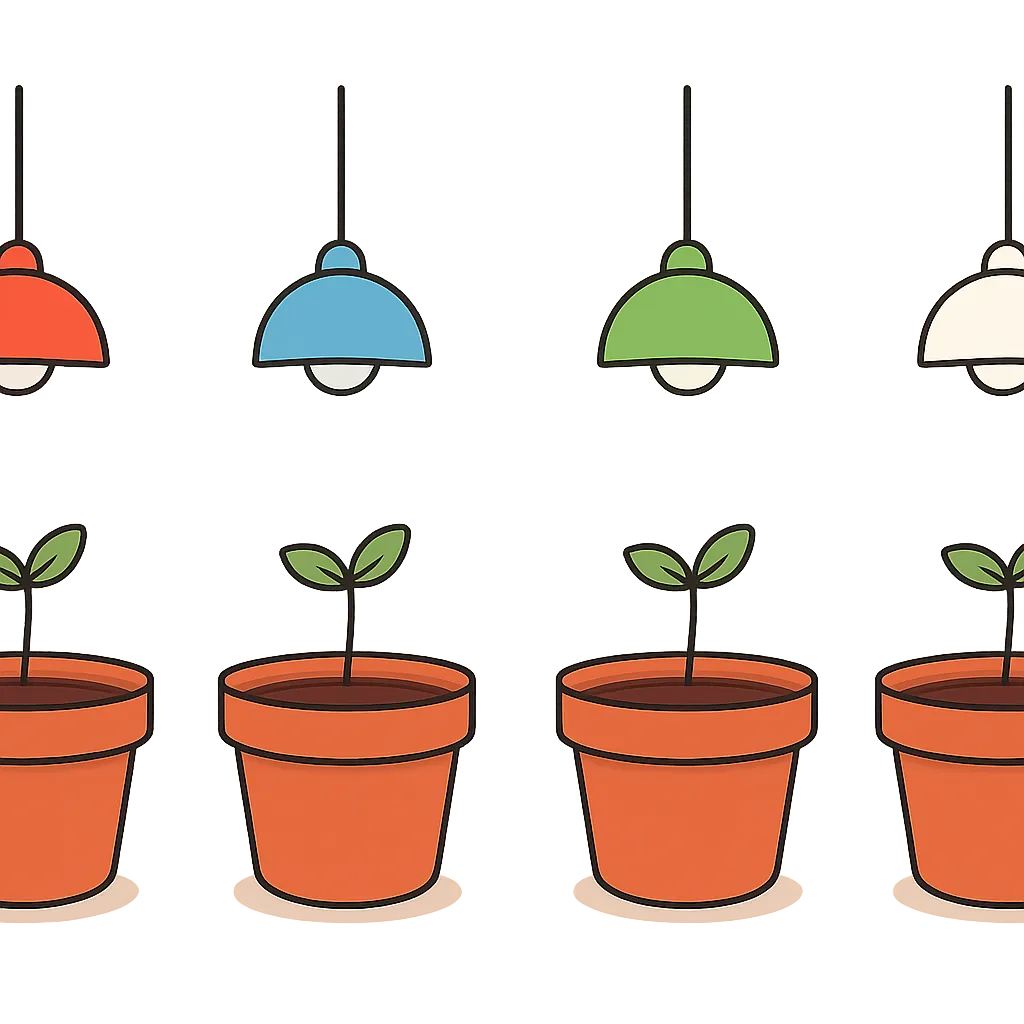
A table gives bean plant height after three weeks under colored light: red, 18 cm; blue, 24 cm; green, 9 cm; white, 27 cm. Which list orders the colors from tallest plants to shortest?
A pie chart divides a school's energy use: lighting, 40 percent; heating, 35 percent; computers, 15 percent; everything else, 10 percent. Which two uses together make up three quarters of the total?
A line graph plots deer counted in a reserve: 2015, 120; 2016, 165; 2017, 210; 2018, 245; 2019, 260. Between which two years did the count grow the least?
A table gives lake water temperature by depth: 0 m, 22 C; 5 m, 19 C; 10 m, 13 C; 15 m, 9 C. Between which two depths does the temperature drop the most?
A table records a runner's distance from the start: 10 s, 60 m; 20 s, 130 m; 30 s, 195 m. How much farther did the runner travel from 10 s to 20 s than before 10 s?
A table records a cart's position along a track: 2 s, 8 m; 4 s, 16 m; 6 s, 24 m; 8 s, 32 m. What is the cart's speed?
A weather table gives daily high temperatures: Monday, 14 C; Tuesday, 19 C; Wednesday, 11 C; Thursday, 17 C. How much warmer was Tuesday than Wednesday?
A student records an open cup of vinegar and baking soda: mass before, 96.5 g; mass after the bubbling stops, 92.1 g. How much mass did the open cup lose?
A table gives a sunflower's height: week 2, 14 cm; week 6, 62 cm. What is the average growth per week between these two readings?
Two cup designs each start at 80 C. After ten minutes, Design A has cooled to 58 C and Design B to 71 C. How much larger was Design A's temperature drop?
A table of daily water use reads: Monday, 40 L; Tuesday, 35 L; Wednesday, 55 L; Thursday, 30 L. How much more water was used on the two heaviest days than on the two lightest?
Four repeated trials time a ball's fall: 0.62 s, 0.64 s, 0.66 s, 0.64 s. What is the mean of these trials?
A graph plots water temperature while it is heated: 0 min, 20 C; 4 min, 50 C; 8 min, 80 C; 10 min, 100 C; 14 min, 100 C. Which statement describes the pattern?
A graph plots rabbits on an island: year 1, 40; year 2, 130; year 3, 310; year 4, 260; year 5, 90. Which statement describes the pattern?
A light meter is moved away from a lamp: 10 cm, 400 units; 20 cm, 100 units; 30 cm, 44 units; 40 cm, 25 units. Which statement describes the pattern?
A table gives wheat yield against fertilizer added: 0 kg, 2.0 t; 50 kg, 3.4 t; 100 kg, 4.3 t; 150 kg, 4.5 t; 200 kg, 4.5 t. Which statement describes the pattern?
A graph plots harbor water depth through one day: midnight, 4.2 m; 6 a.m., 1.2 m; noon, 4.1 m; 6 p.m., 1.3 m; midnight, 4.2 m. Which statement describes the pattern?
A graph plots a country's yearly mean temperature difference from average: 1980, +0.1 C; 1990, +0.3 C; 1995, +0.2 C; 2010, +0.6 C; 2020, +0.9 C. Which statement describes the pattern?
A table pairs pond temperature with dissolved oxygen: 8 C, 11.0 mg/L; 14 C, 9.8 mg/L; 20 C, 8.4 mg/L; 26 C, 7.4 mg/L. Which statement describes the pattern?
On a distance-time graph, a line that grows steeper shows an object that is speeding up.
A table gives a burning candle's height: 0 min, 20 cm; 10 min, 17 cm; 20 min, 14 cm; 30 min, 11 cm. If the pattern holds, how tall is the candle at 50 min?
A table counts bacteria in a dish: 0 h, 200; 1 h, 400; 2 h, 800; 3 h, 1600. If the pattern holds, how many will there be at 5 h?
A table shows how far a rolling ball travels: 1 s, 2.5 m; 2 s, 5.0 m; 3 s, 7.5 m; 4 s, 10.0 m. If the pattern holds, how far will it have rolled at 6 s?
Coffee cools from 90 C to 70 C in the first 10 minutes, to 58 C by 20 minutes, and to 51 C by 30 minutes. What temperature is most likely at 40 minutes?
A table records ice left in a warm room: 0 min, 200 g; 5 min, 160 g; 10 min, 120 g; 15 min, 80 g. If the pattern holds, when will no ice be left?
A town's recycling rate reads 32 percent in 2019, 36 percent in 2020, 40 percent in 2021 and 44 percent in 2022. If the pattern holds, what rate is expected in 2024?
A student measures how a school's daily water use divides among restrooms, kitchen, cleaning and irrigation, and wants each shown as a share of the whole. Which display fits this data best?
A class records pond temperature every hour for twelve hours and wants a display showing how the temperature changed through the day. Which display fits this data best?
A class measures leaf area and water loss for each of twenty-five plants, and wants a display showing whether the two measurements are related. Which display fits this data best?
Health workers record the home address of each of sixty people who fell ill and want to see whether the cases cluster in one part of town. Which display fits this data best?
A bar graph shows two class averages, 78 and 74, with its vertical axis starting at 70 instead of 0. What problem does this cause?
A group soaks one paper towel from each of four brands once, and concludes that Brand C absorbs the most water. What is the best reason to doubt that conclusion?

A student grows two plants. One gets a sunny window and daily fertilizer; the other gets a shaded shelf and no fertilizer. The sunny plant grows taller. Why is the cause unclear?
A town's records show that in weeks when ice cream sales are high, sunburn cases are also high. What is the strongest limit on what these data can show?

In a set of five measurements, one value that sits far outside the other four should be checked before it is averaged in.
Two weeks of June rainfall data are enough to show which of two towns receives more rain over a whole year.
Crack the passcode before the zombies get in.
Answer, then swat bugs for bonus points.
Race through questions at your own speed.
Same question on every screen. Fastest wins.

Pick a tile, answer, hit bonuses and steals.
Claim, Evidence and Reasoning
20 questions