Loading
by BlastRoom
Read J-curves and S-curves: identify the phase, find the carrying capacity and say what slowed the growth.
#biology
20 questions
One question set, multiple game modes. Tap any game to see it in action. Not sure which to pick?
Answer to place stones and capture territory.
Outrun the snow together.
Earn blasts, then hunt the other team.
Answer to earn energy, then climb.

The class blasts through walls together.
Bid on mystery lots. Most money wins.
Sell tours. Nice, standard, or a total scam.

Answer, restock, and serve the rush.
More correct answers pulls the rope your way.
Answer, then shoot down the alien wave.
Answer, then tap to leap the frozen ridge.
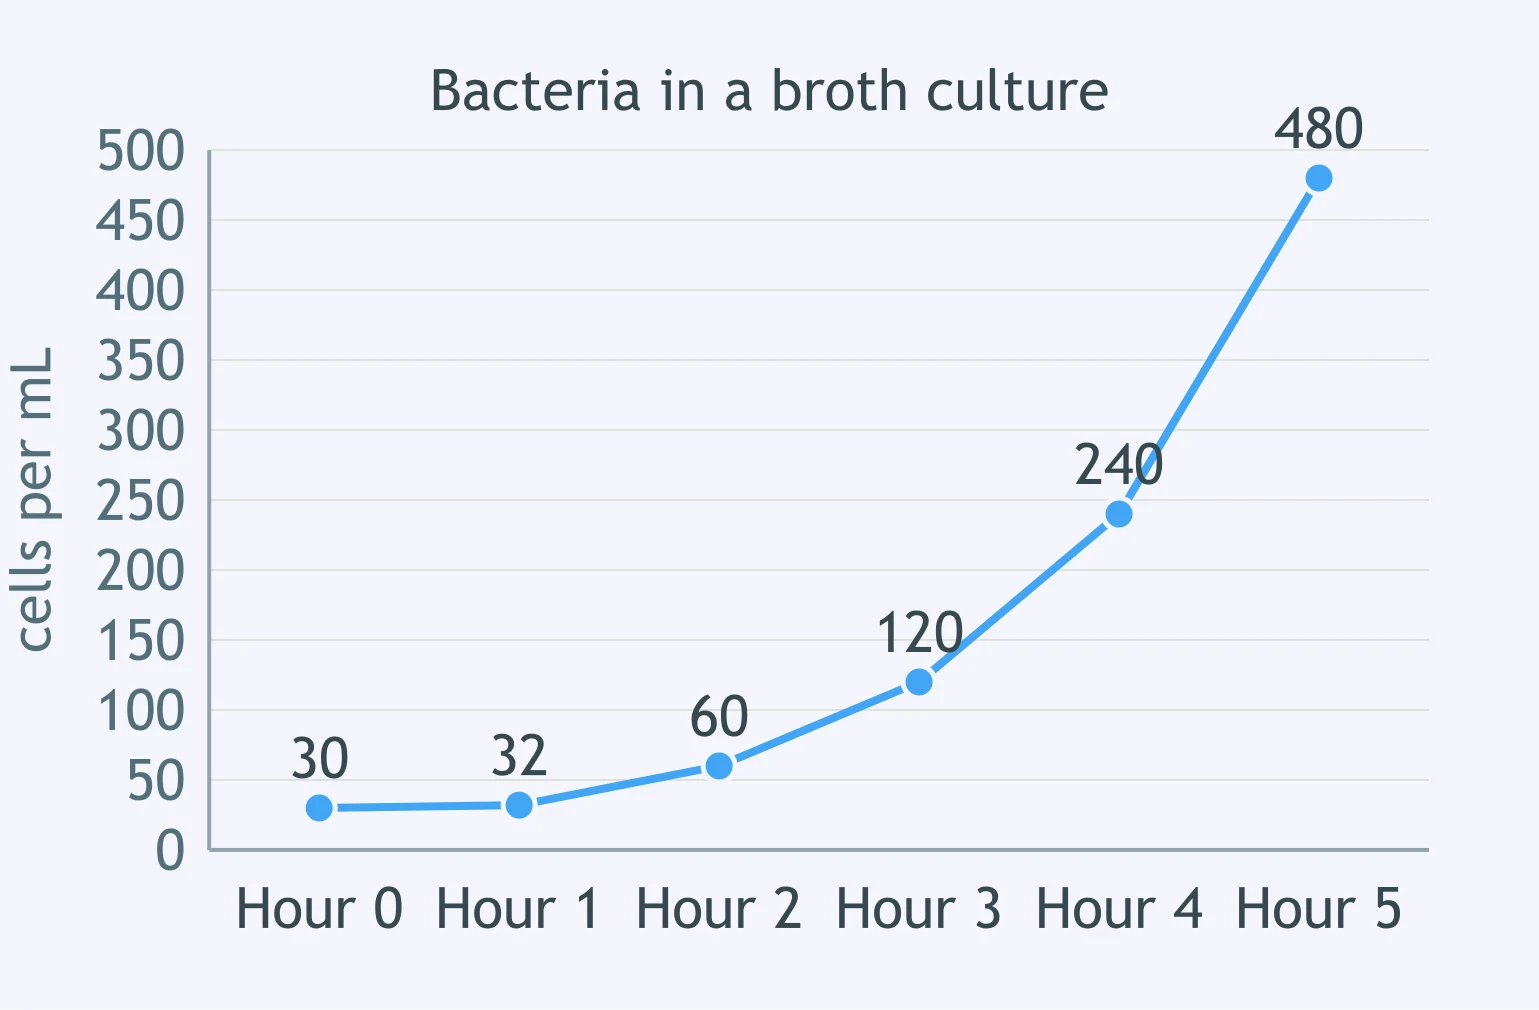
Look at the graph of the bacterial culture. Which phase is the population in at hour 5?
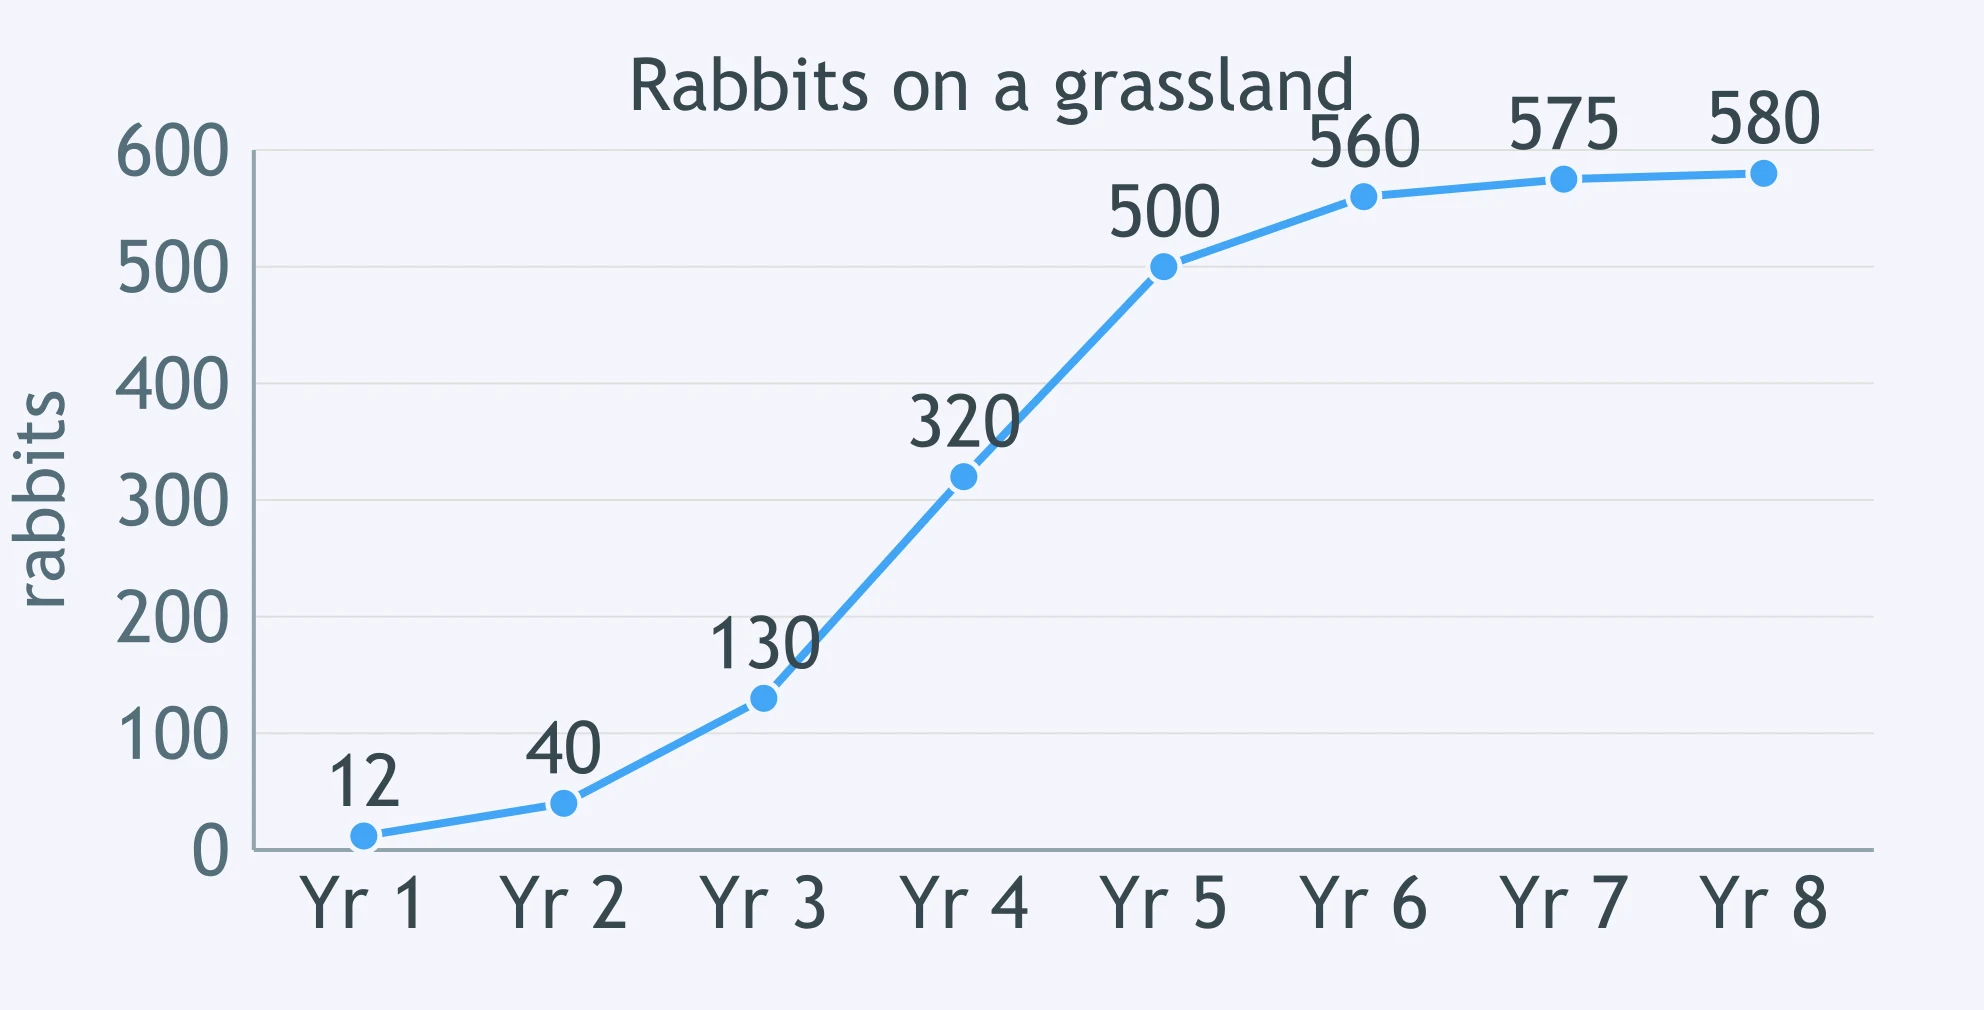
The graph shows a rabbit population on a fixed area of grassland. Which phase is the population in at year 8?
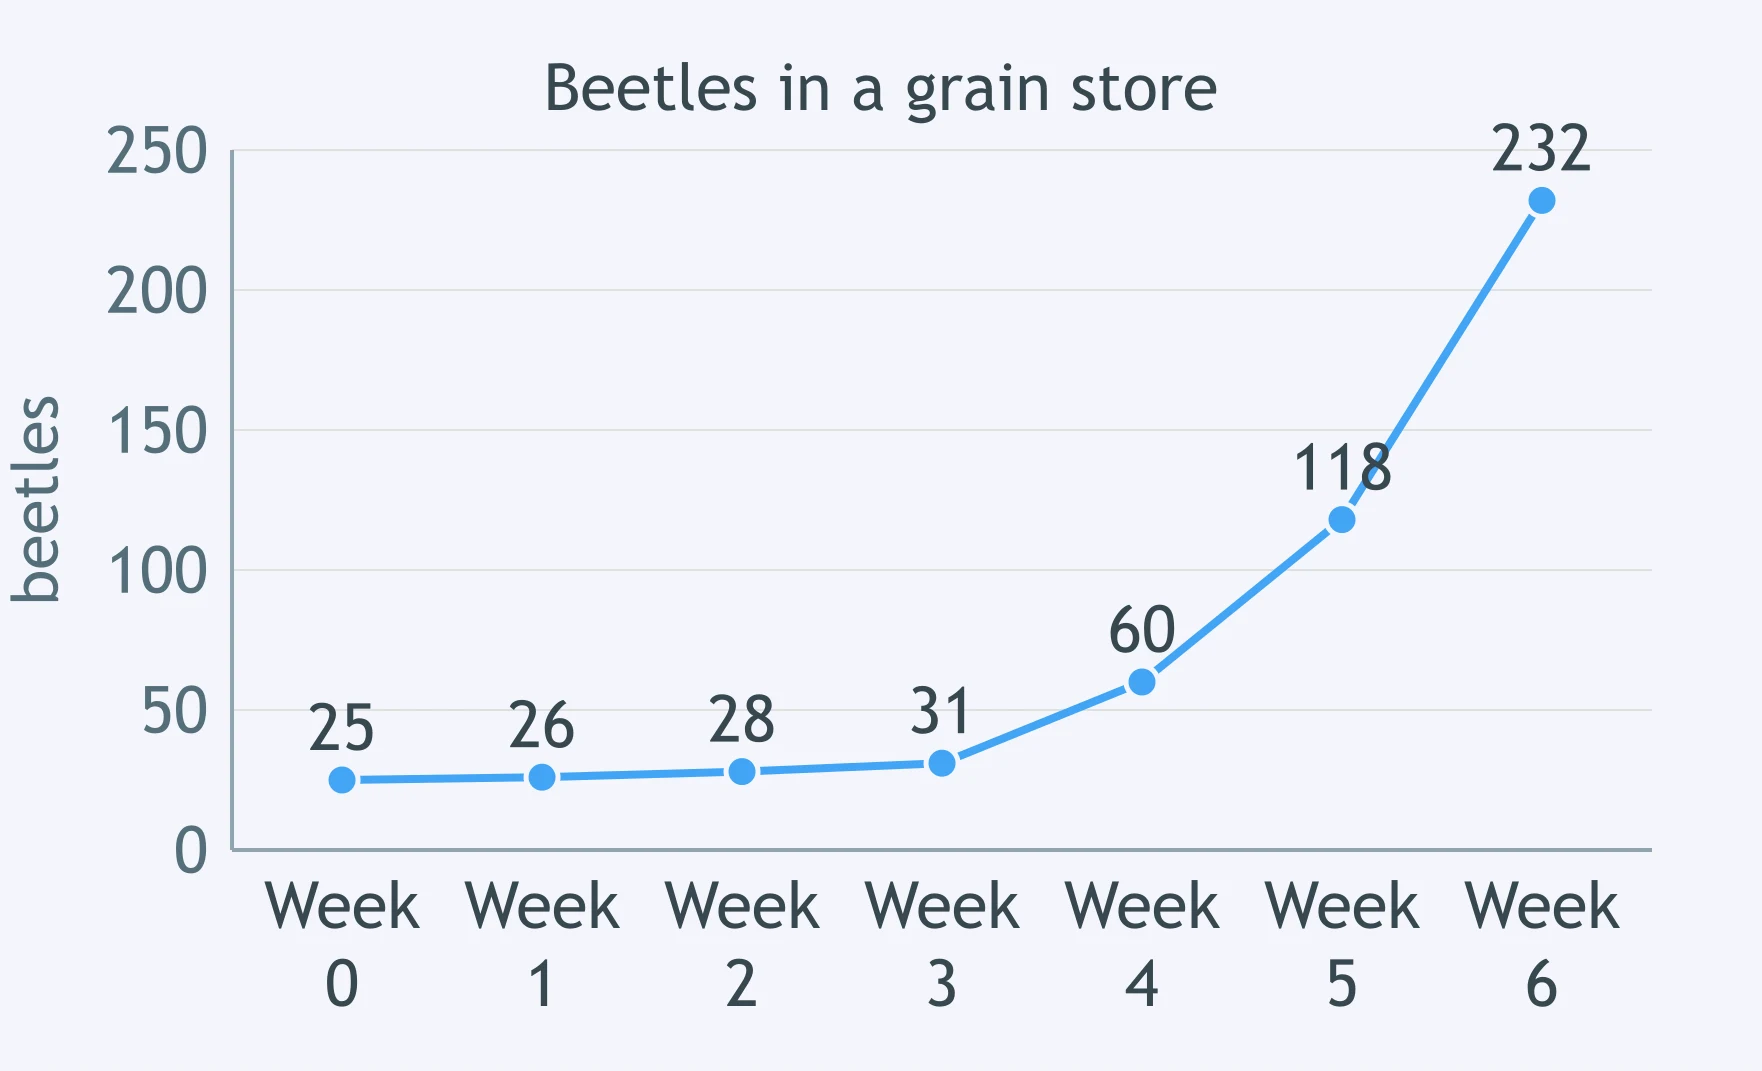
Use the graph of the beetle population. Which description fits the population over the first three weeks?
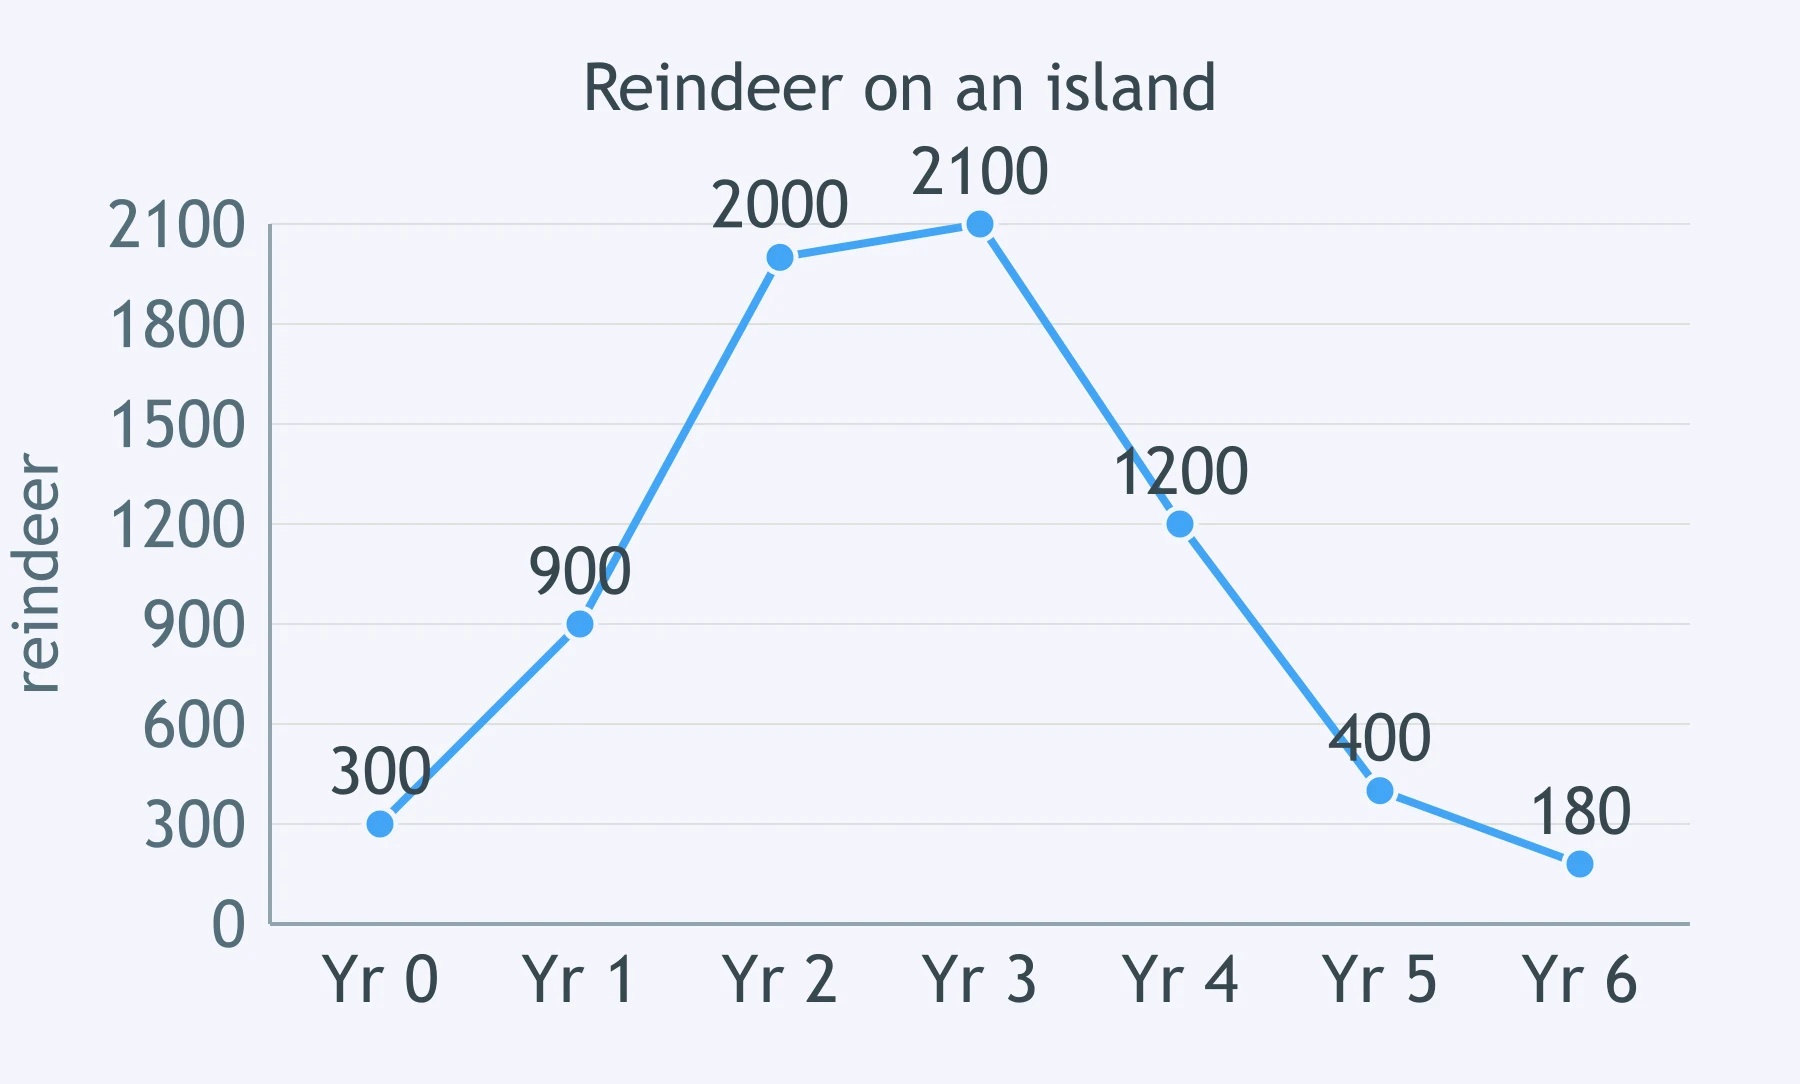
The graph shows a reindeer herd introduced to an island. Which phase is the herd in at year 6?
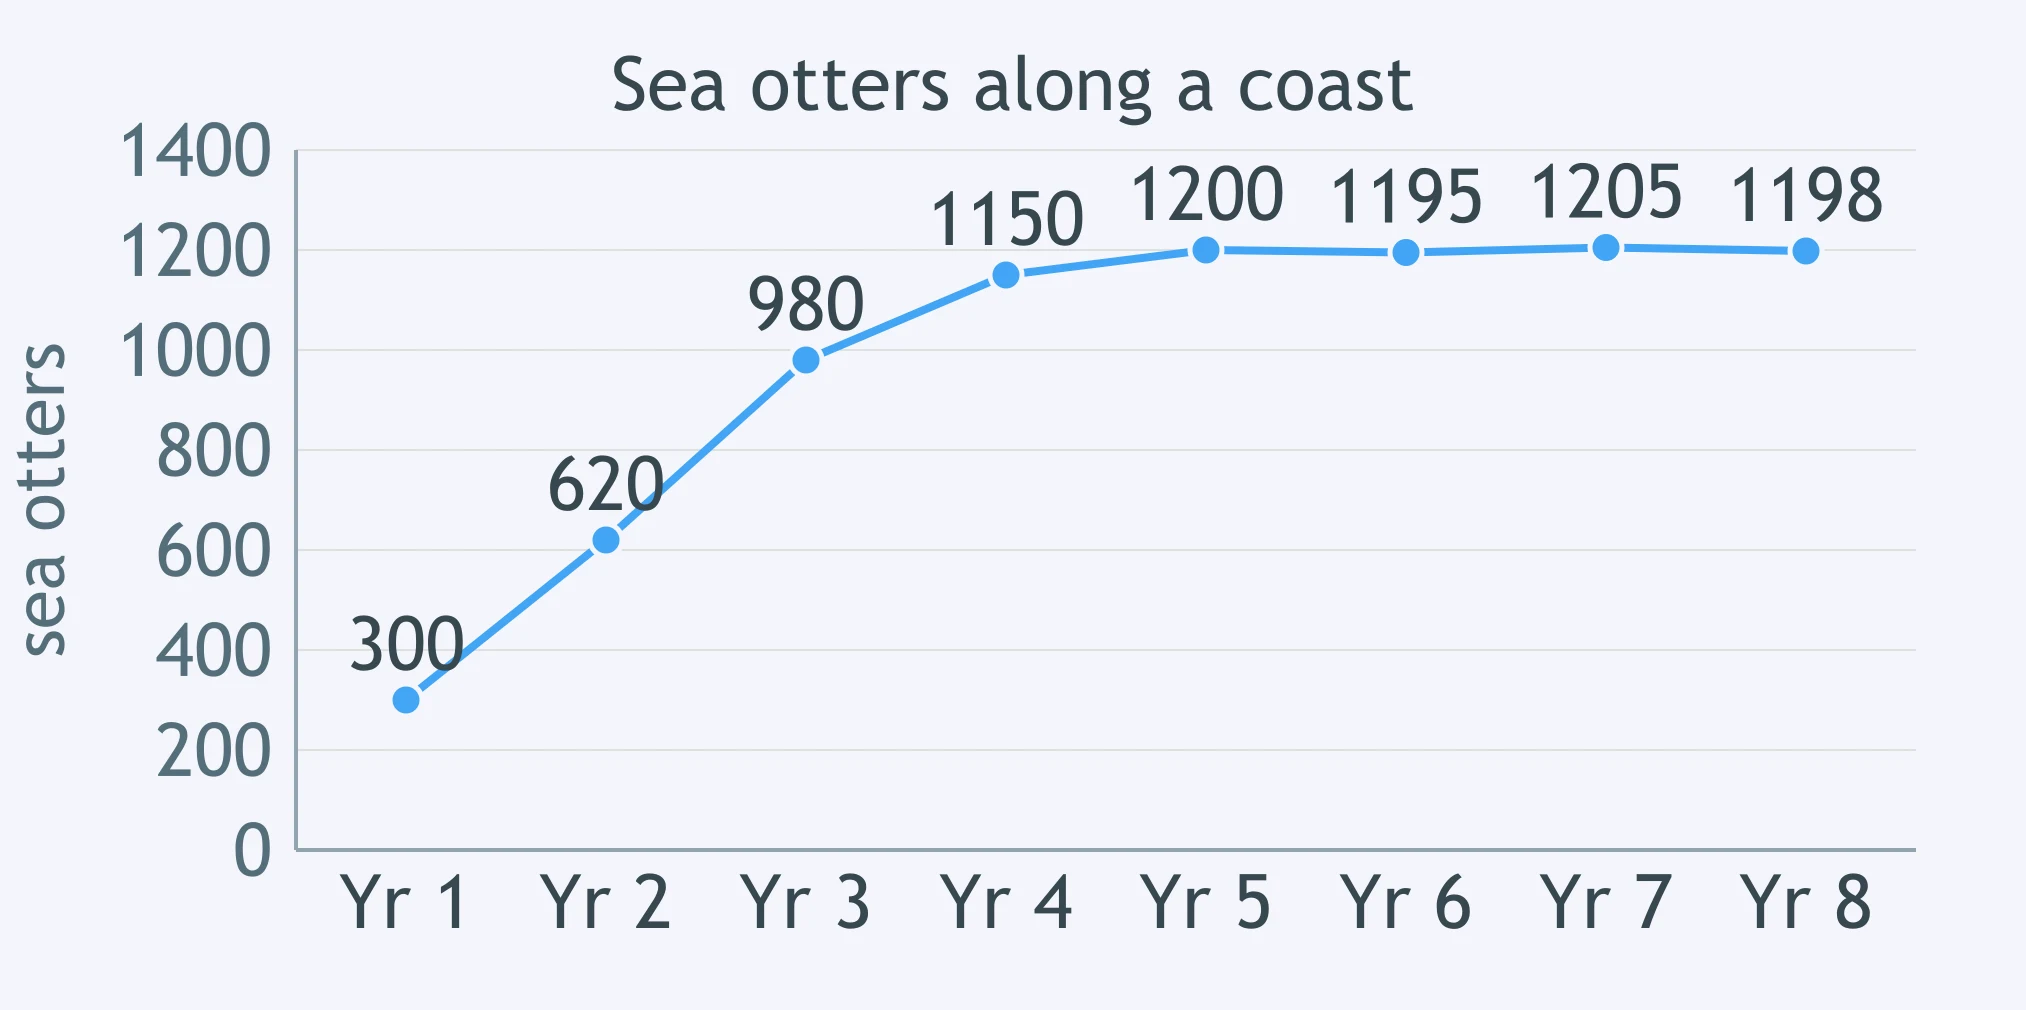
Use the graph of the sea otter population. Which description fits the last four years shown?
Weeds in a plot are counted every 2 days: 20, 22, 26, 52, 104, 208, 260, 275. During which interval was the population growing exponentially?
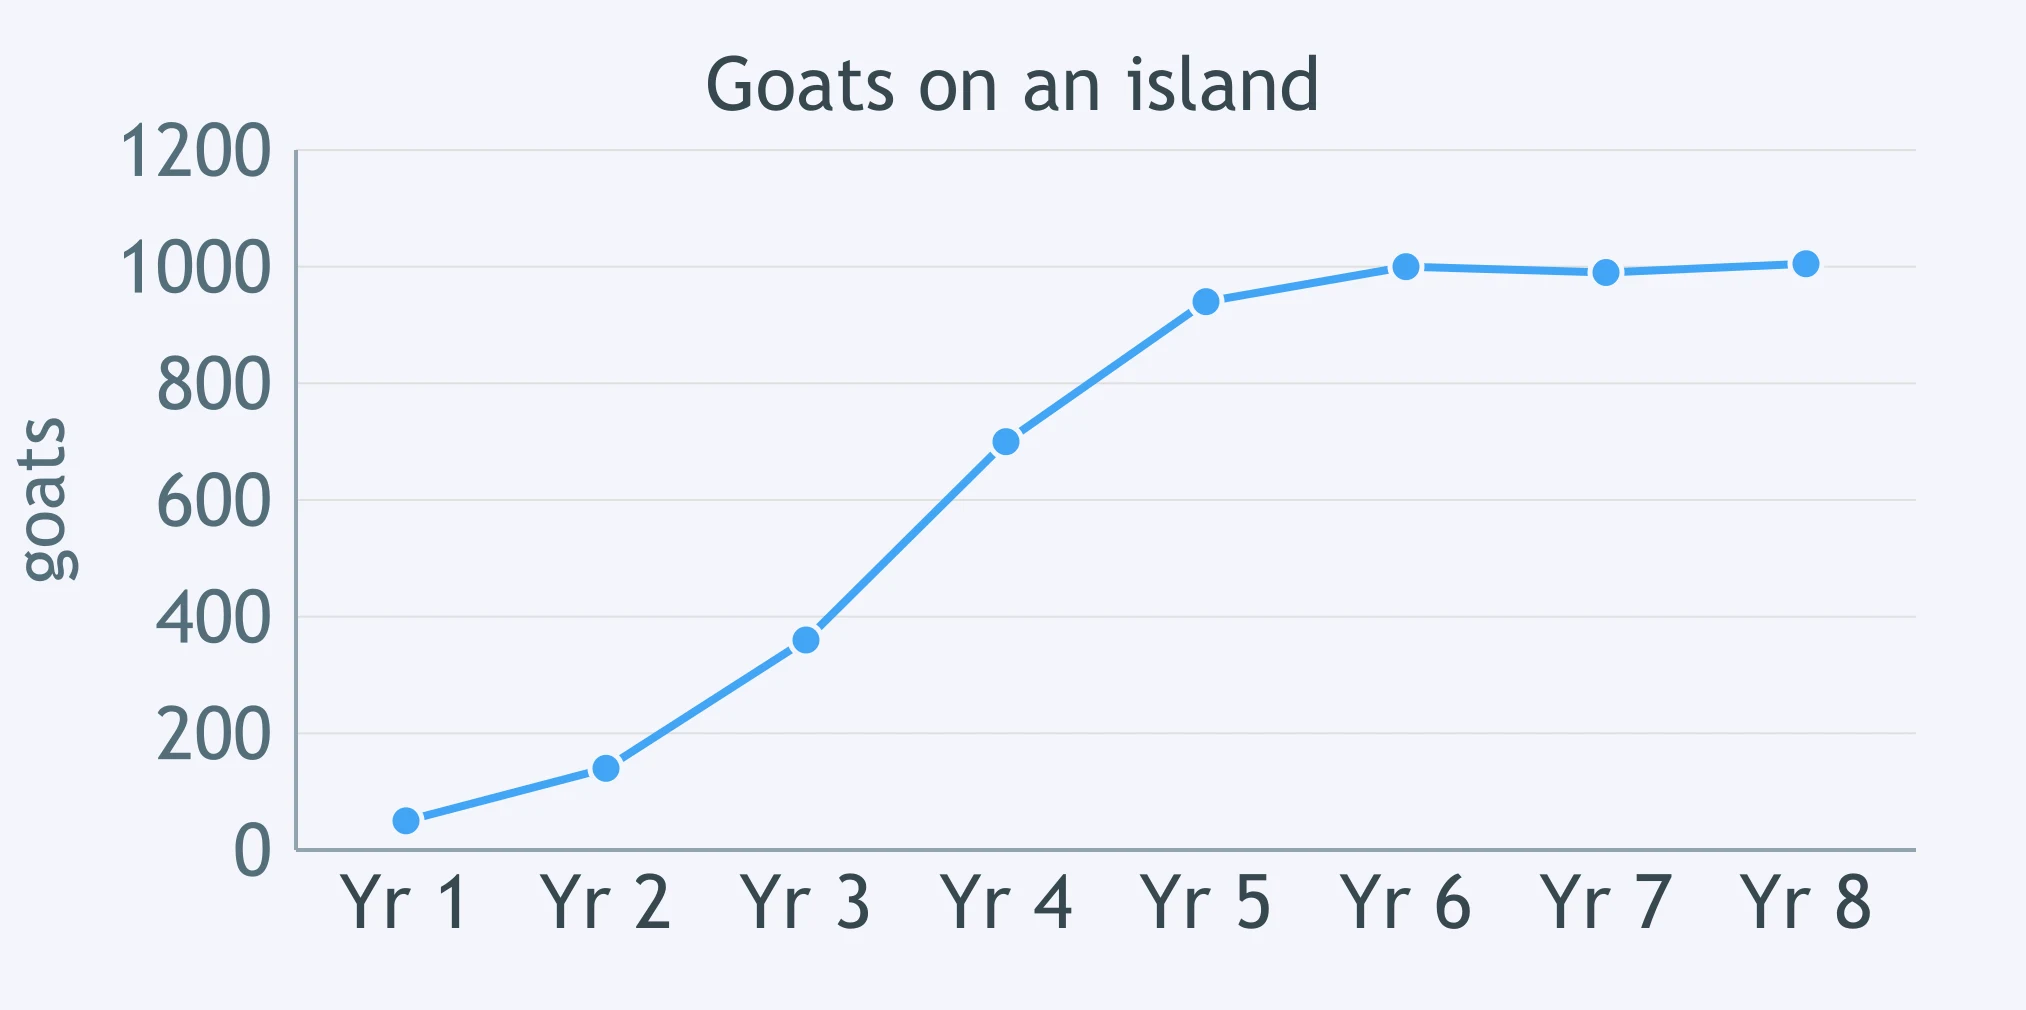
Look at the graph of the goat population on an island. About what is the carrying capacity of the island for these goats?
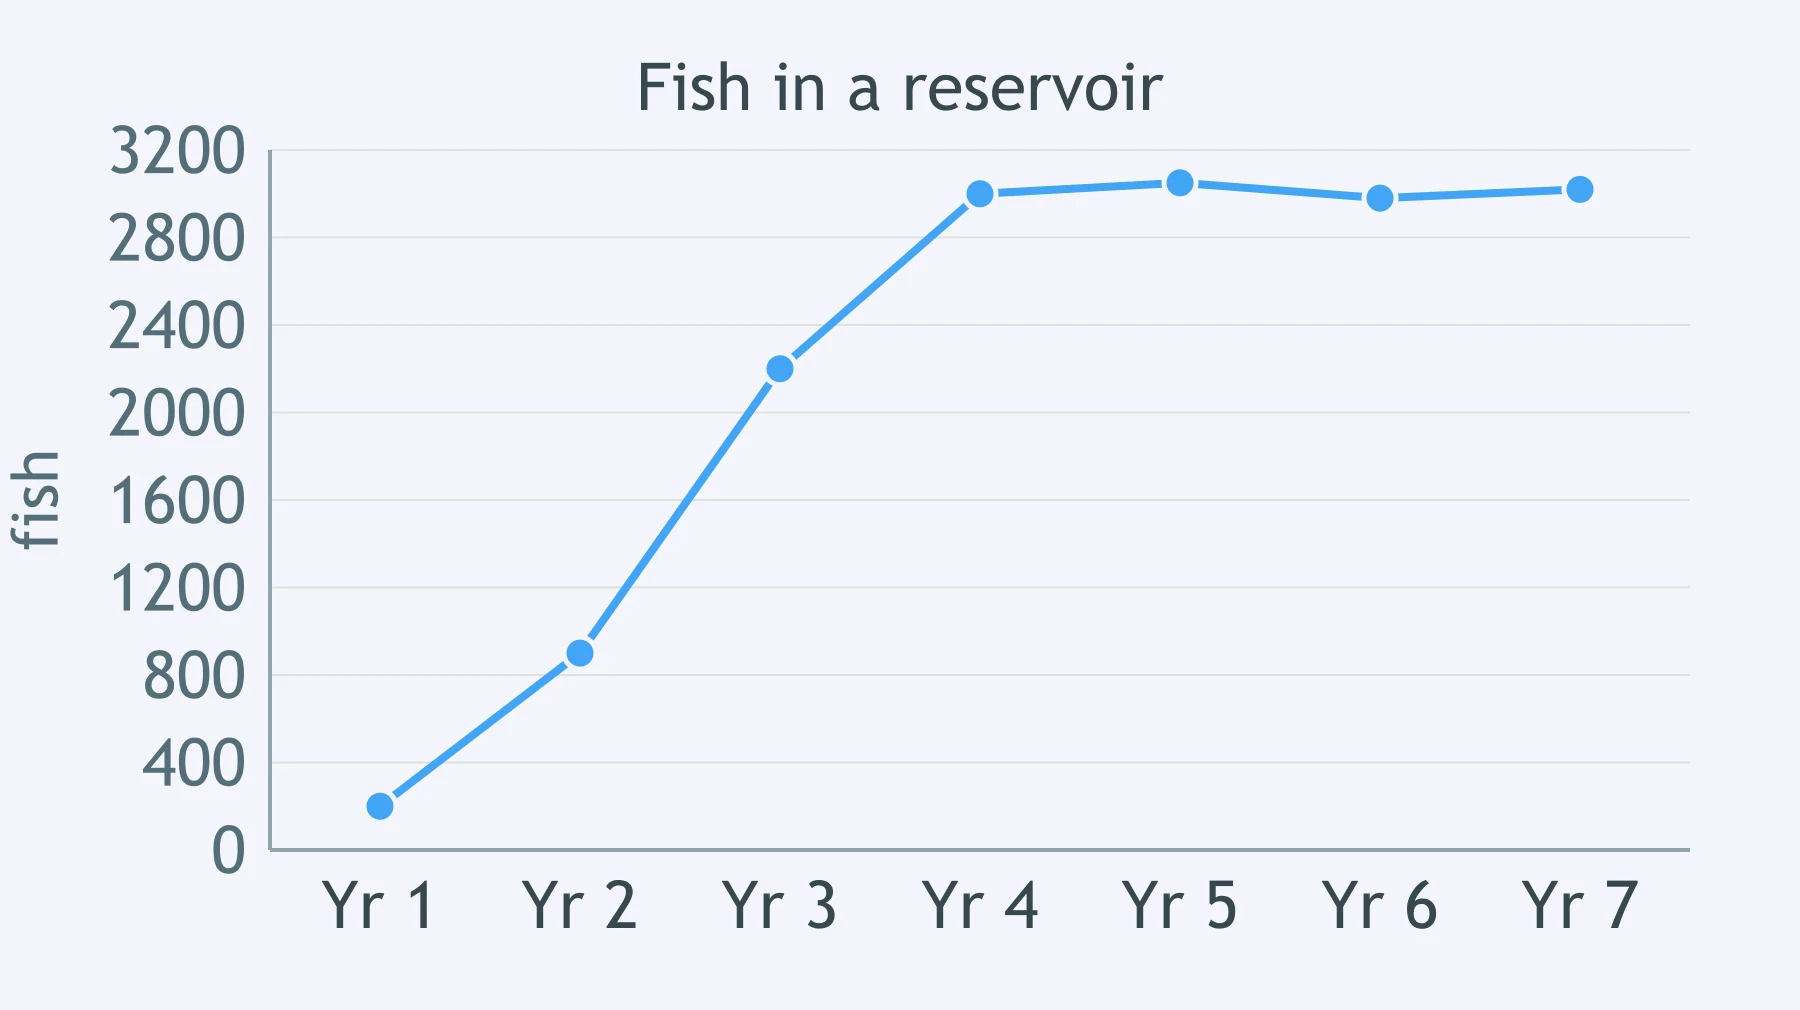
The graph shows a fish population in a reservoir. About what is the carrying capacity of the reservoir for these fish?
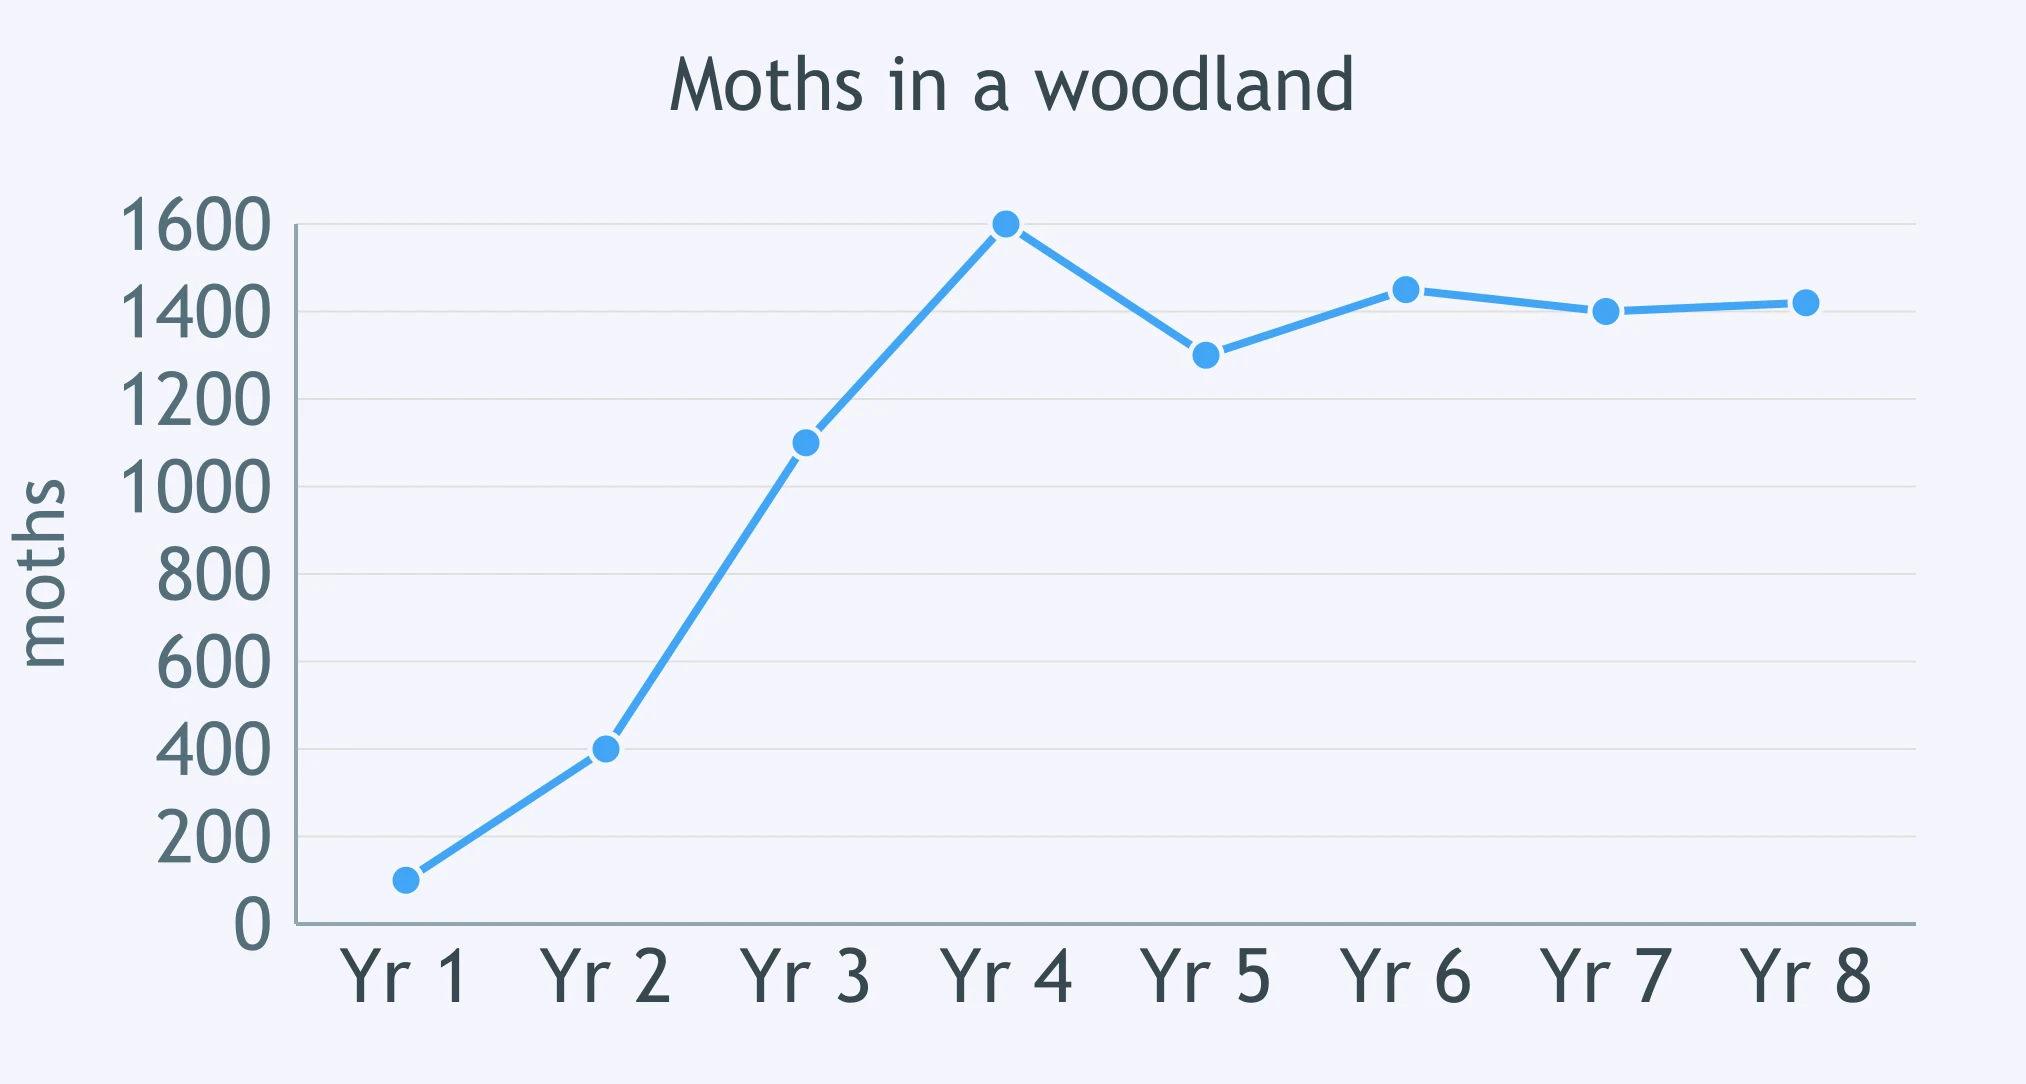
Use the graph of the moth population. About what is the carrying capacity of this habitat for the moths?
An ant colony is counted each spring: 260; 610; 1,180; 1,900; 2,350; 2,480; 2,460; 2,500; 2,470. What is the carrying capacity of the hill for these ants?
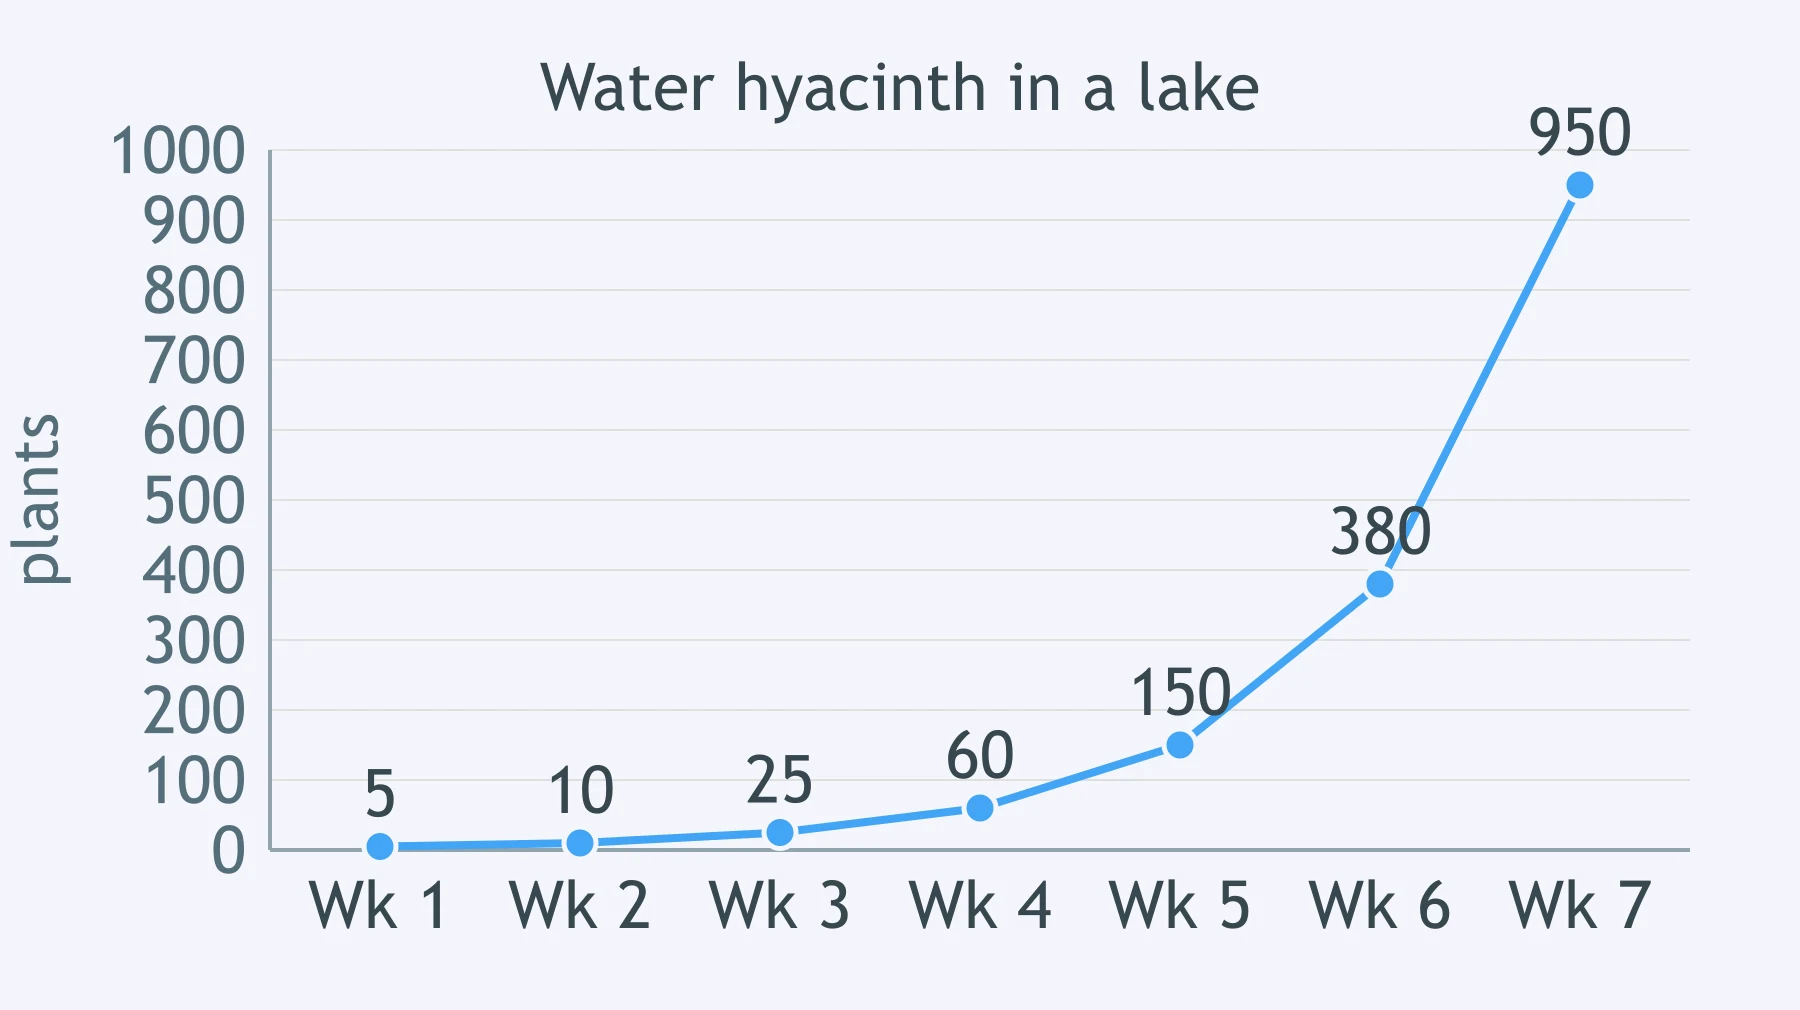
The graph shows water hyacinth plants spreading in a lake they were newly introduced to. Which pattern do these data show?
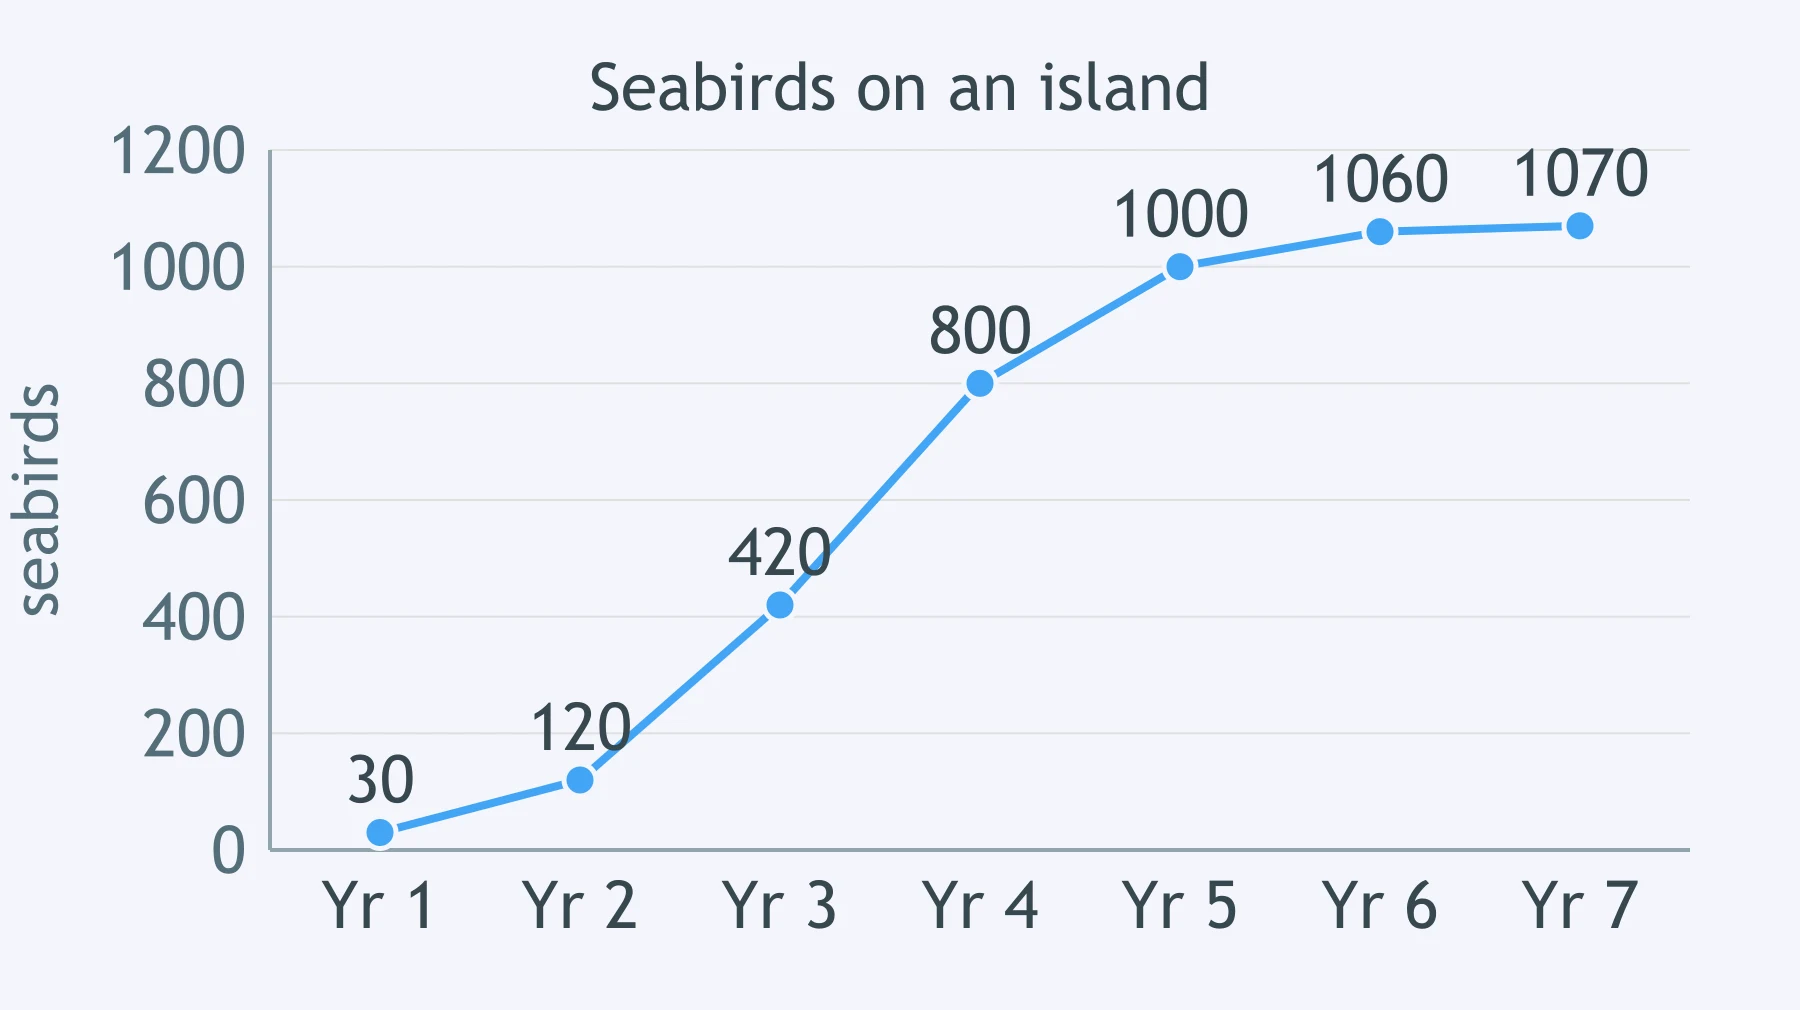
Look at the graph of the seabird population on an island. What most likely caused the counts to stop increasing?
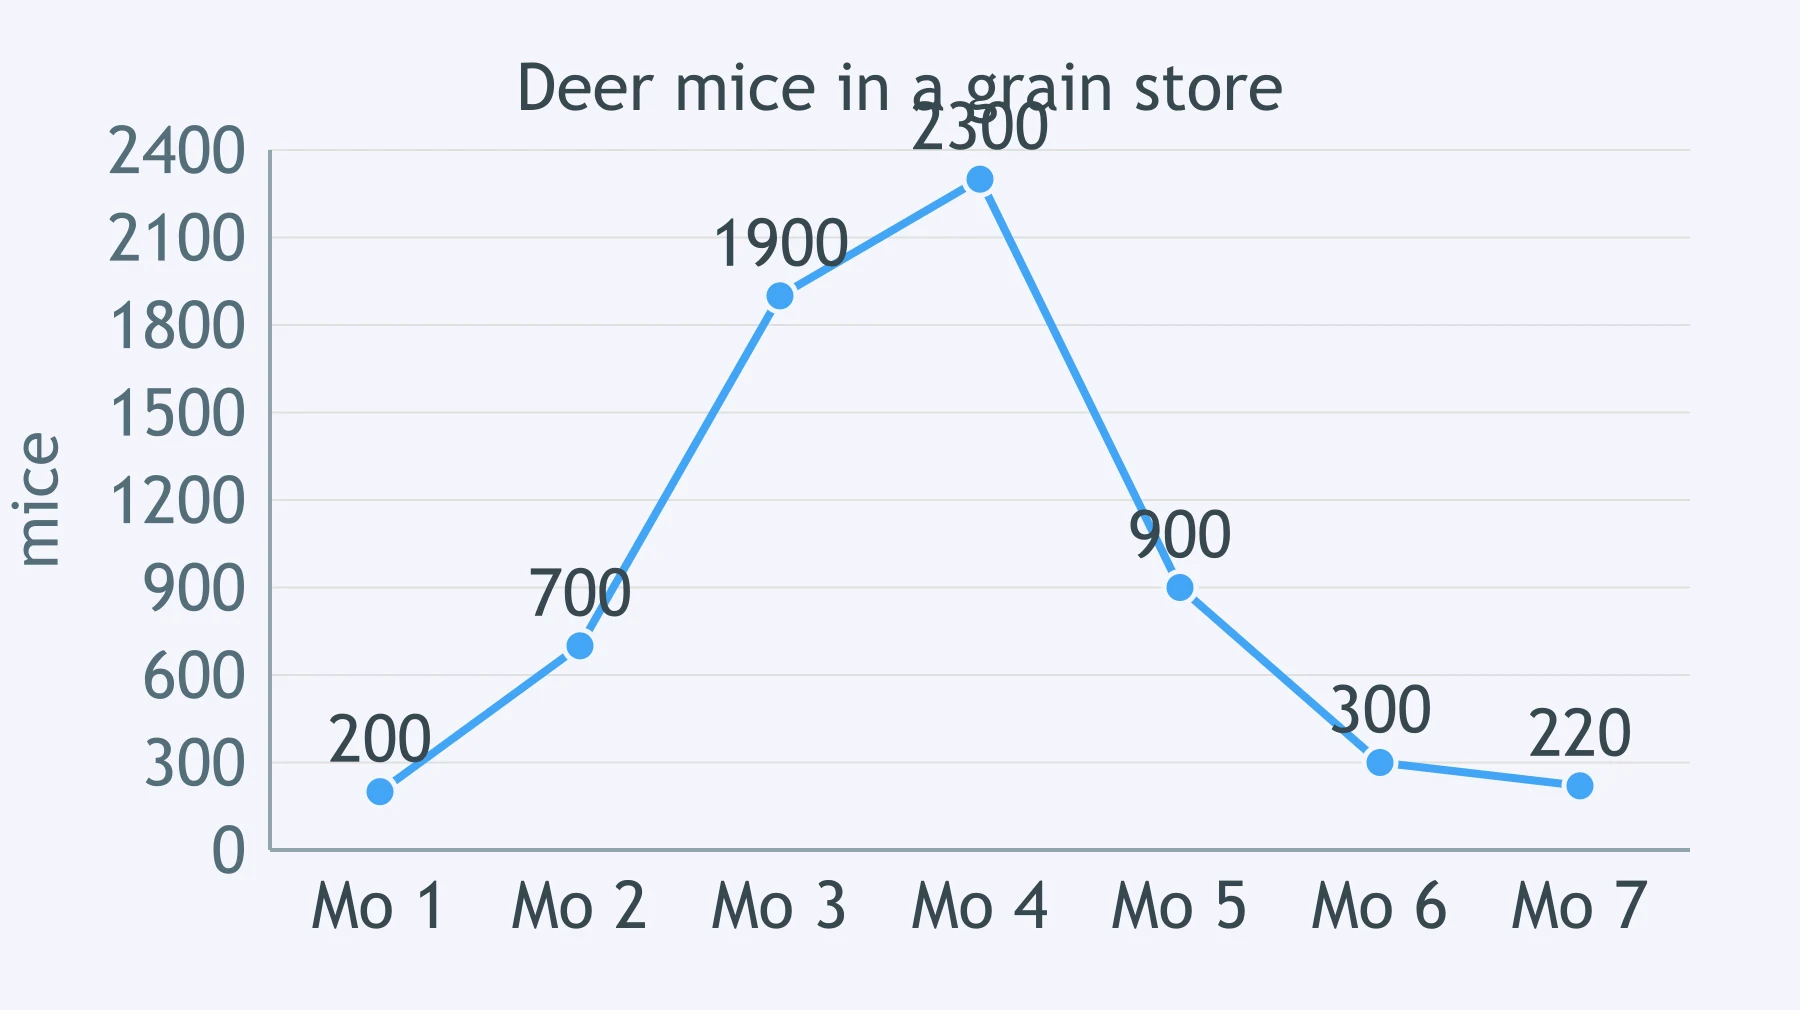
The graph shows a deer mouse population living in a grain store. Which description fits the whole curve?
Water lilies in a pond are counted each week: 8, 16, 33, 65, 131, 260, 522. Which curve shape do these data show?
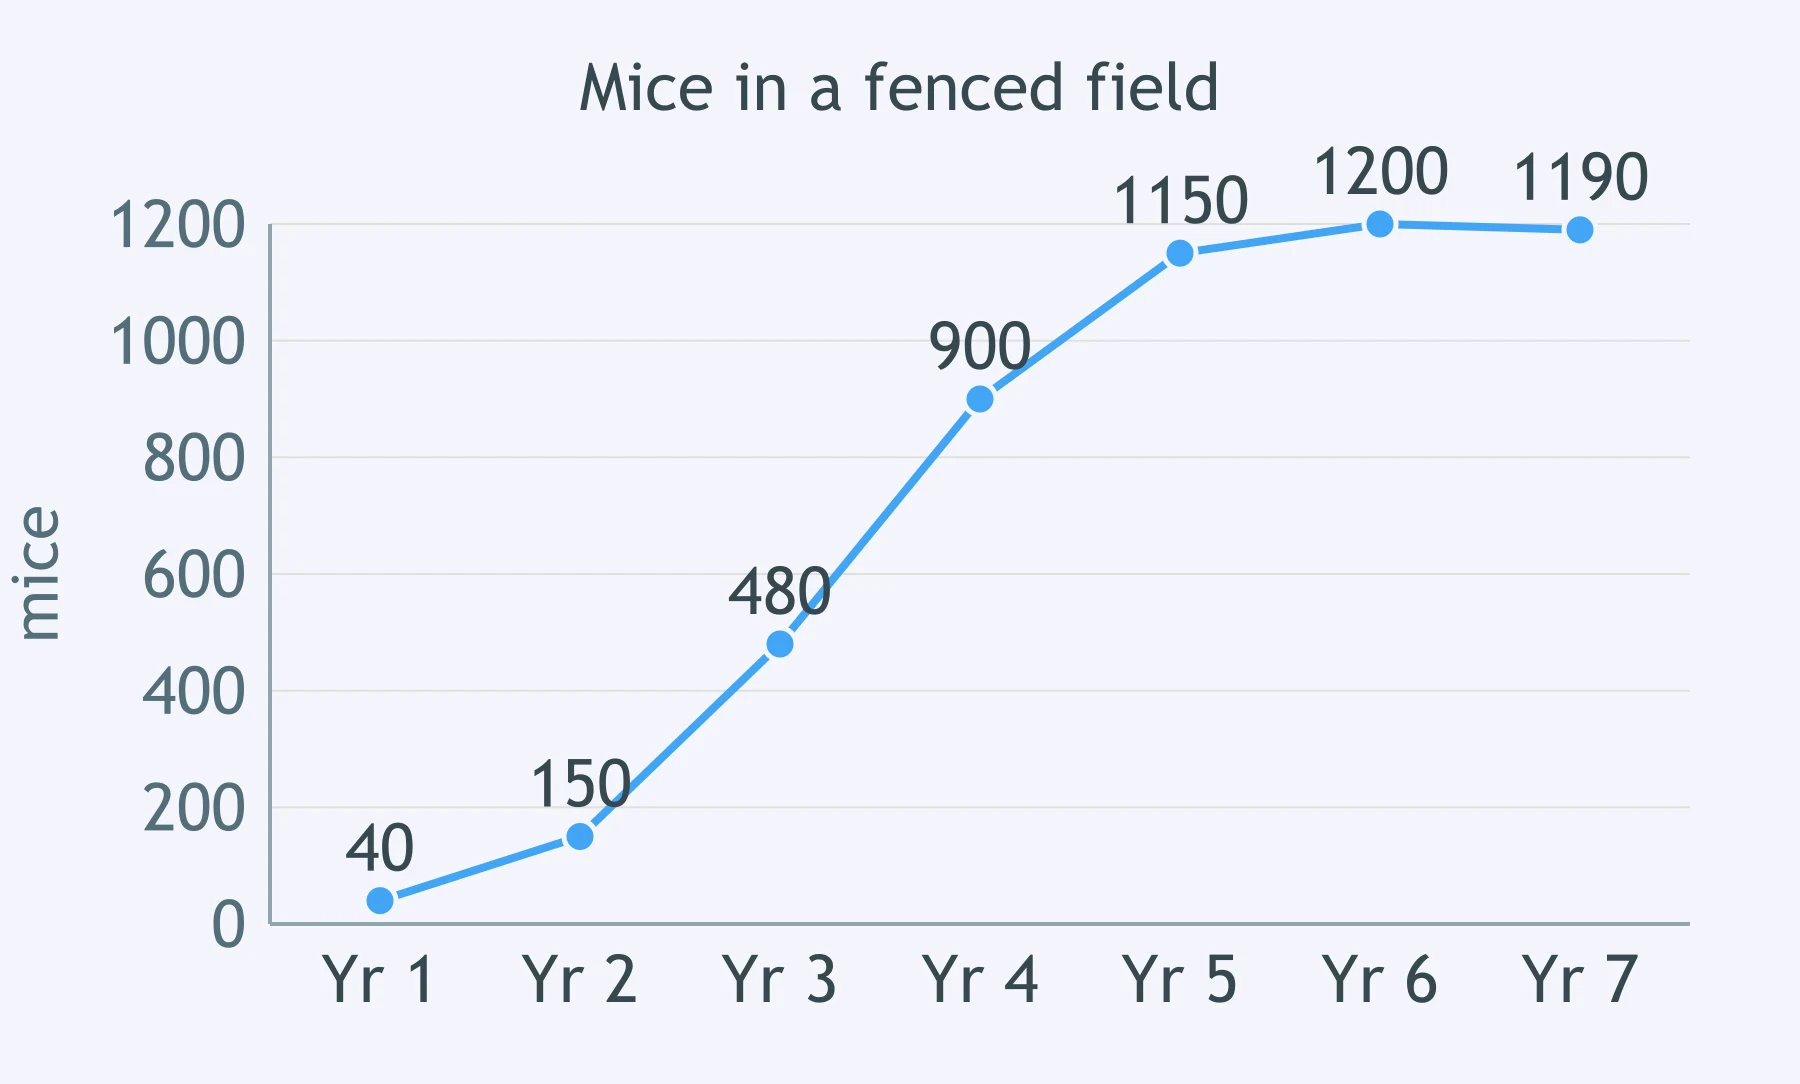
The graph shows a mouse population in a fenced field. Which density-dependent factor best explains the leveling off?
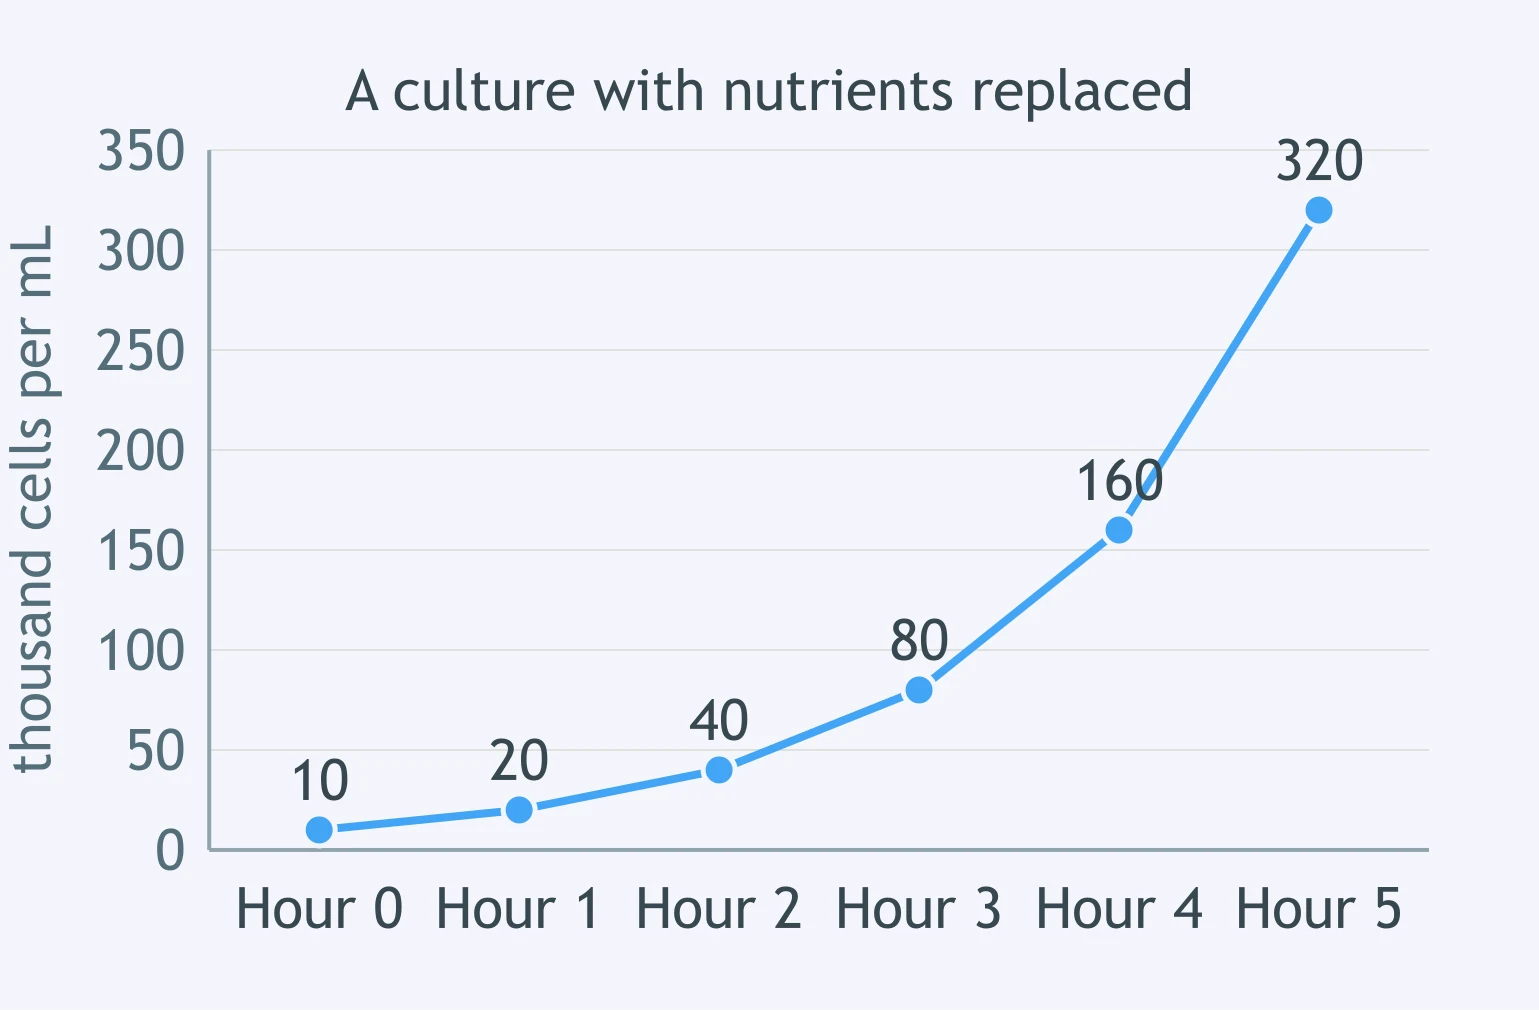
Use the graph. The culture is kept in a vessel where nutrients are continuously replaced and wastes removed. If the pattern continues, what will the count be at hour 6?
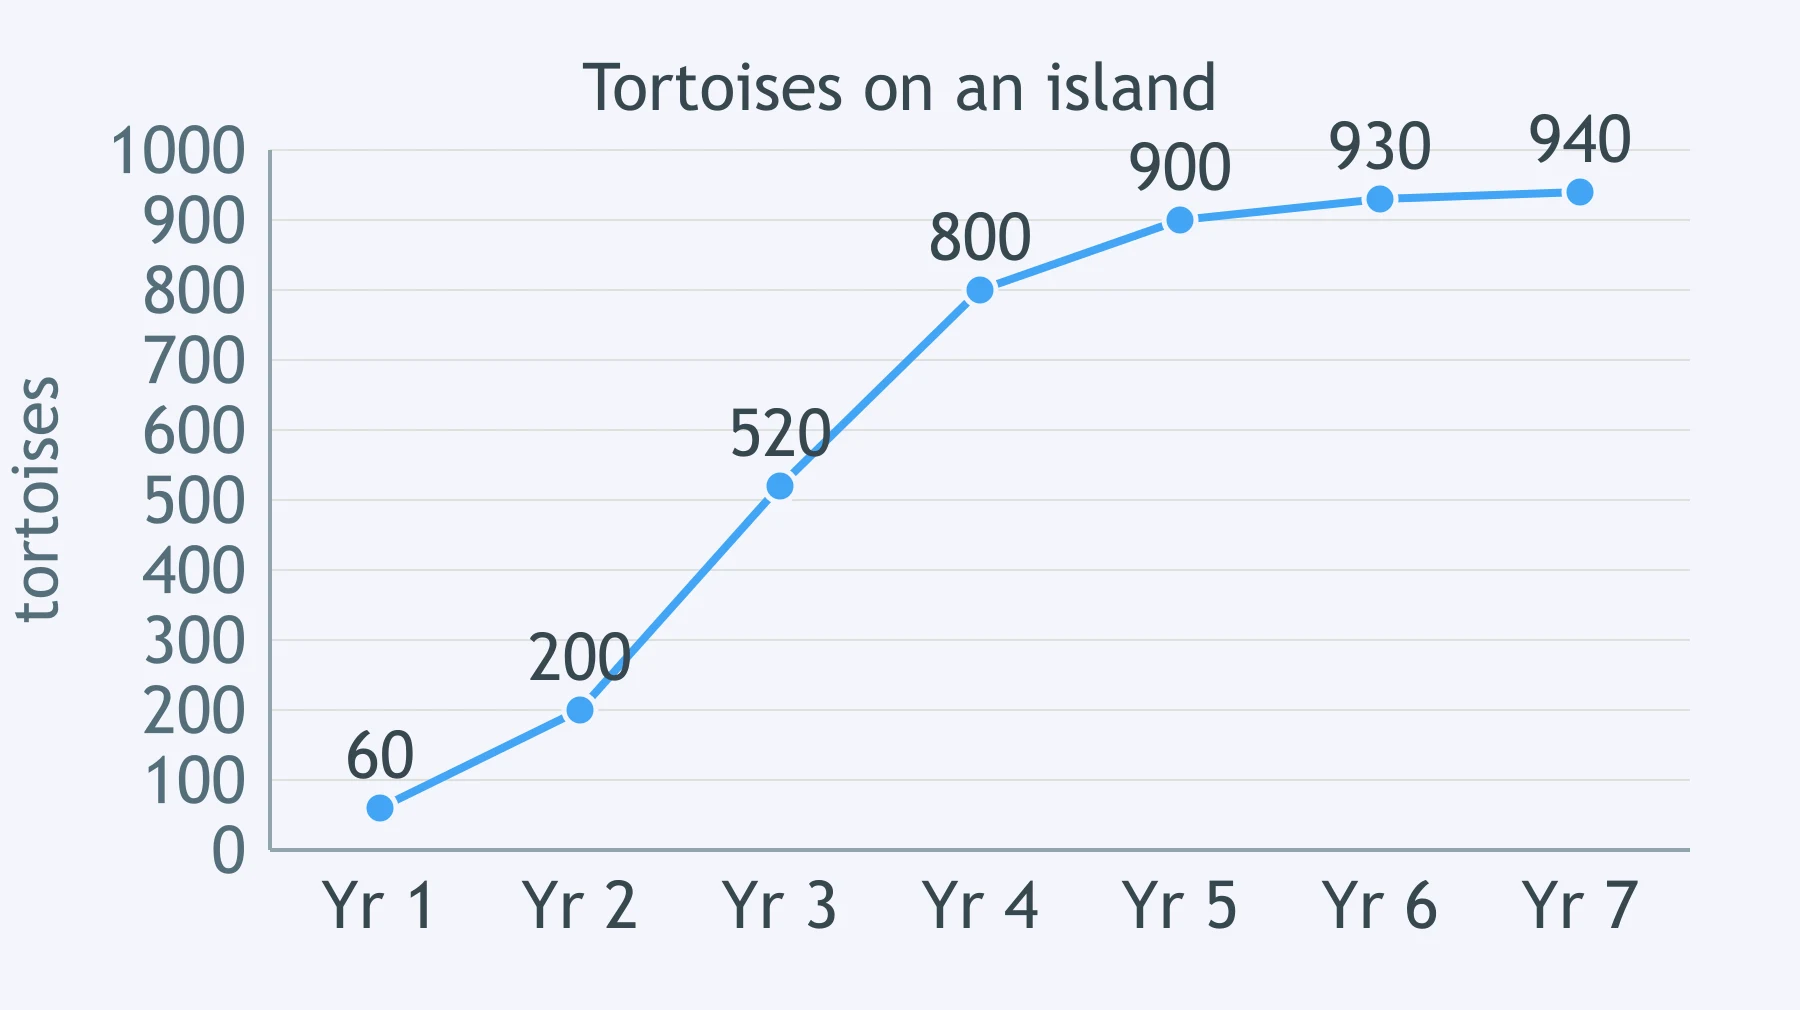
Look at the graph of the tortoise population. If food, space and predators stay as they are, what will the counts most likely do over the next few years?
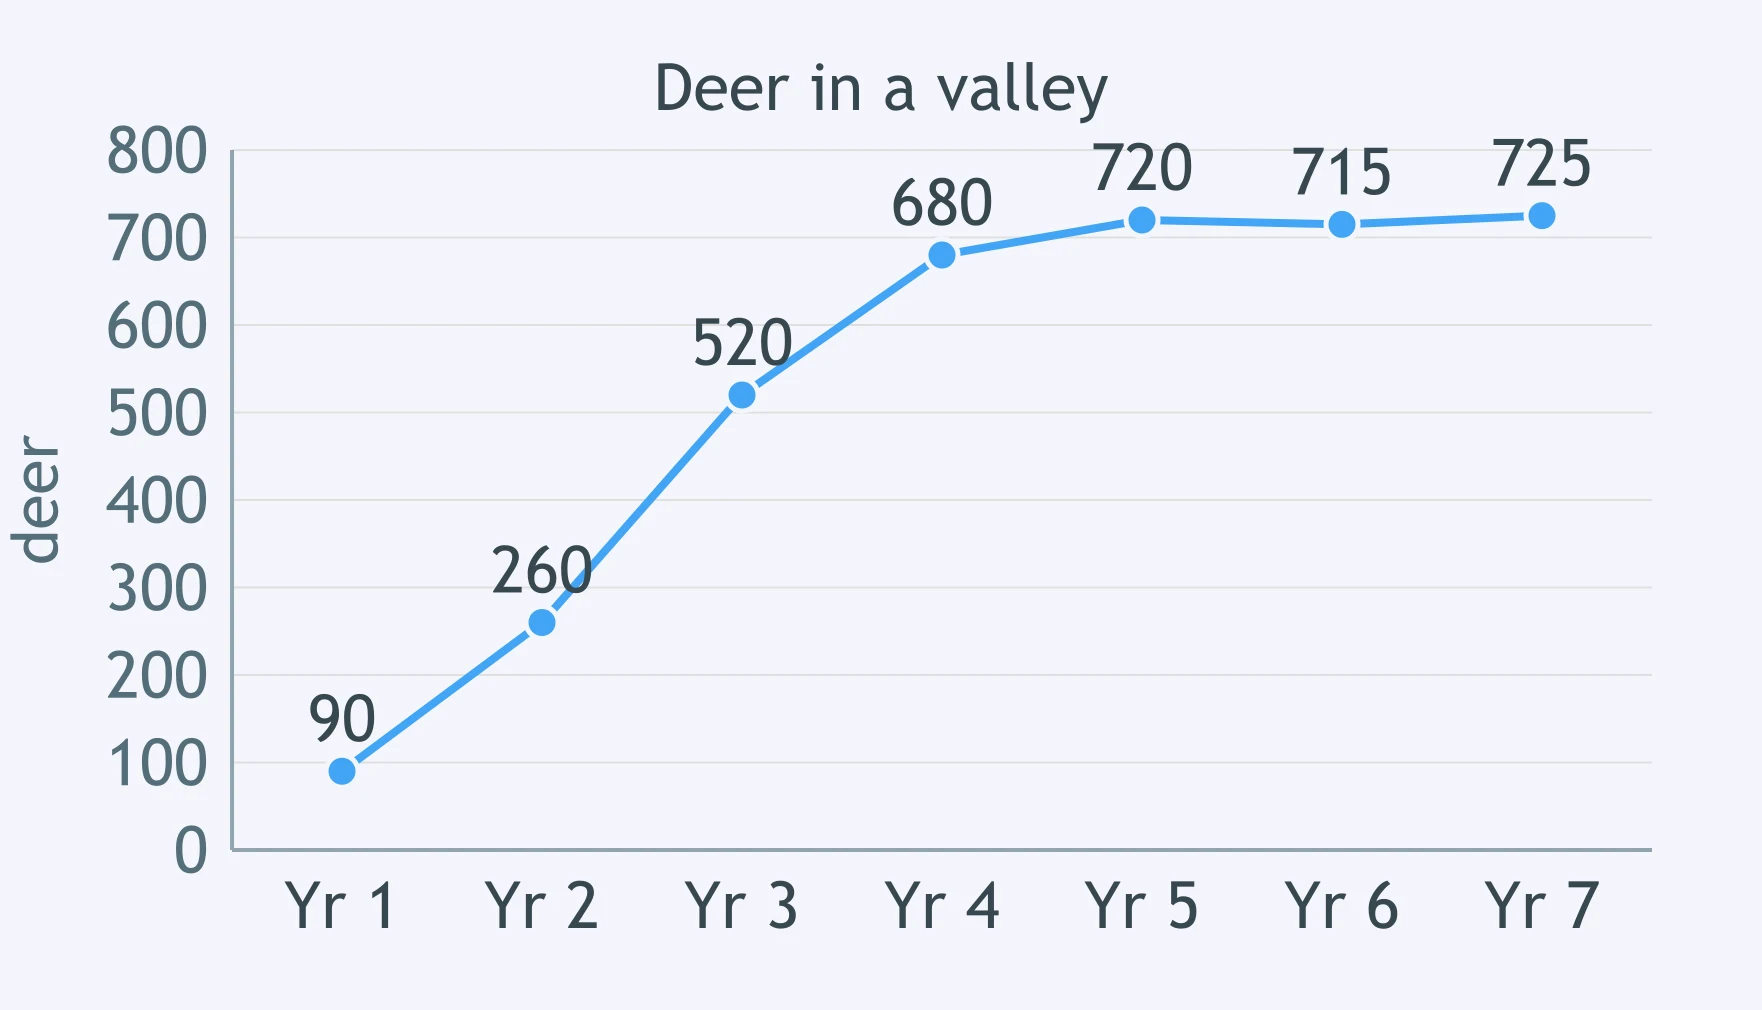
The graph shows a deer population in a valley. Several severe winters then cut the amount of winter browse in half for several years. What is the most likely change in the counts?
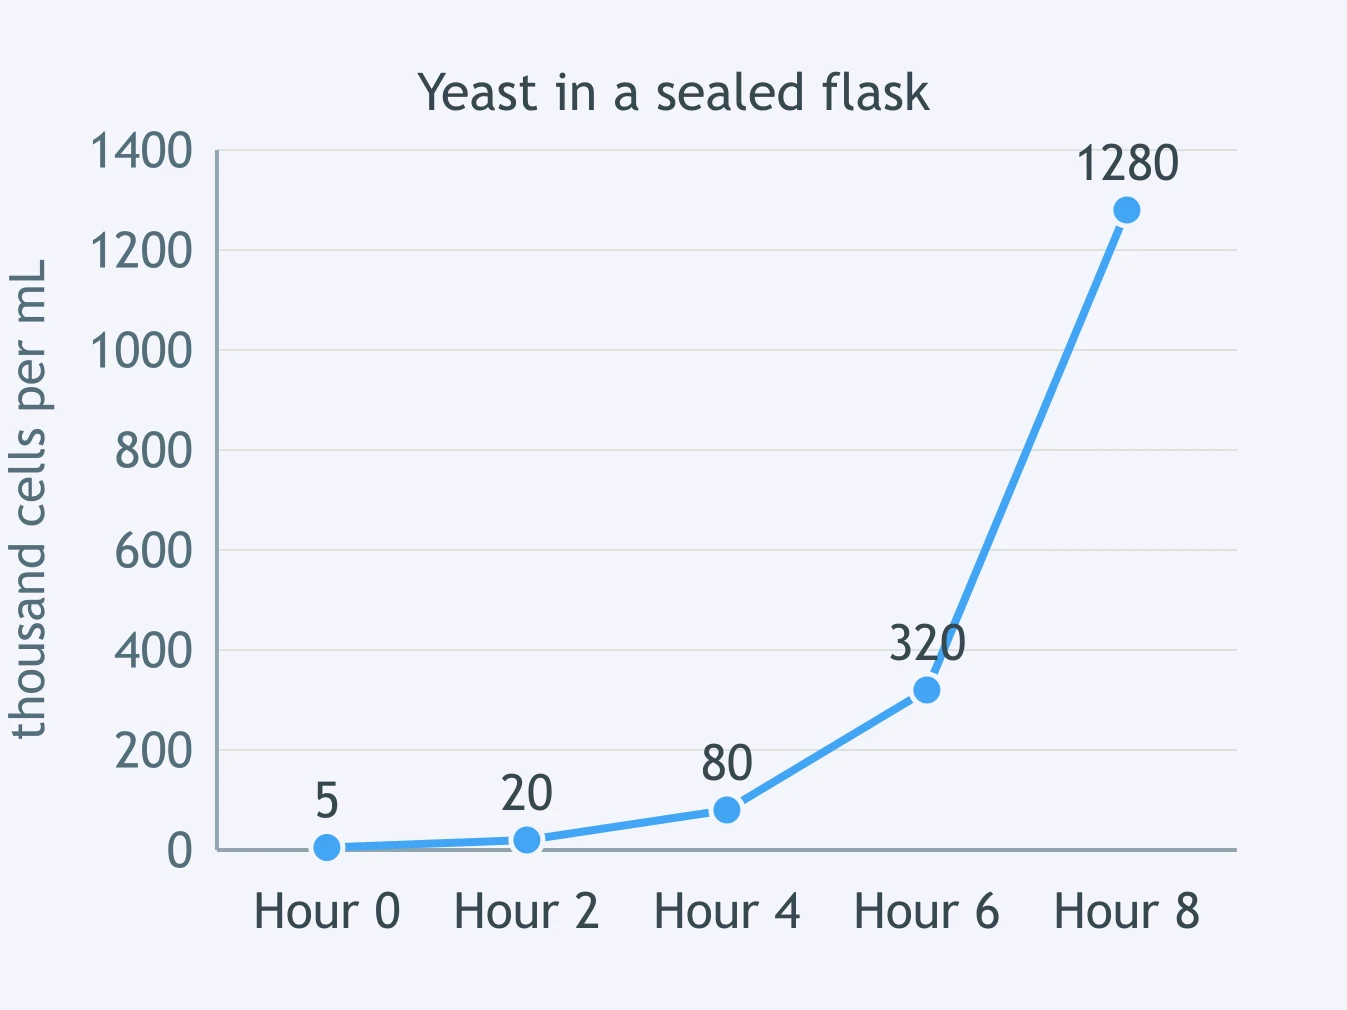
Look at the graph of yeast in a sealed flask that was given one fixed amount of sugar at the start. What will the curve most likely do after the last point shown?
Duckweed plants on a tub of water are counted weekly: 15, 30, 61, 120, 240. The plants now cover half of the water surface. What will the counts most likely do next?
Crack the passcode before the zombies get in.
Answer, then swat bugs for bonus points.
Race through questions at your own speed.
Same question on every screen. Fastest wins.

Pick a tile, answer, hit bonuses and steals.
Predation and Competition
20 questions