Loading
by BlastRoom
Argue from data about how population and per-person use affect Earth's systems.
#us_grade_7_science

20 questions
One question set, multiple game modes. Tap any game to see it in action. Not sure which to pick?
Answer to place stones and capture territory.
Outrun the snow together.
Earn blasts, then hunt the other team.
Answer to earn energy, then climb.

The class blasts through walls together.
Bid on mystery lots. Most money wins.
Sell tours. Nice, standard, or a total scam.

Answer, restock, and serve the rush.
More correct answers pulls the rope your way.
Answer, then shoot down the alien wave.
Answer, then tap to leap the frozen ridge.
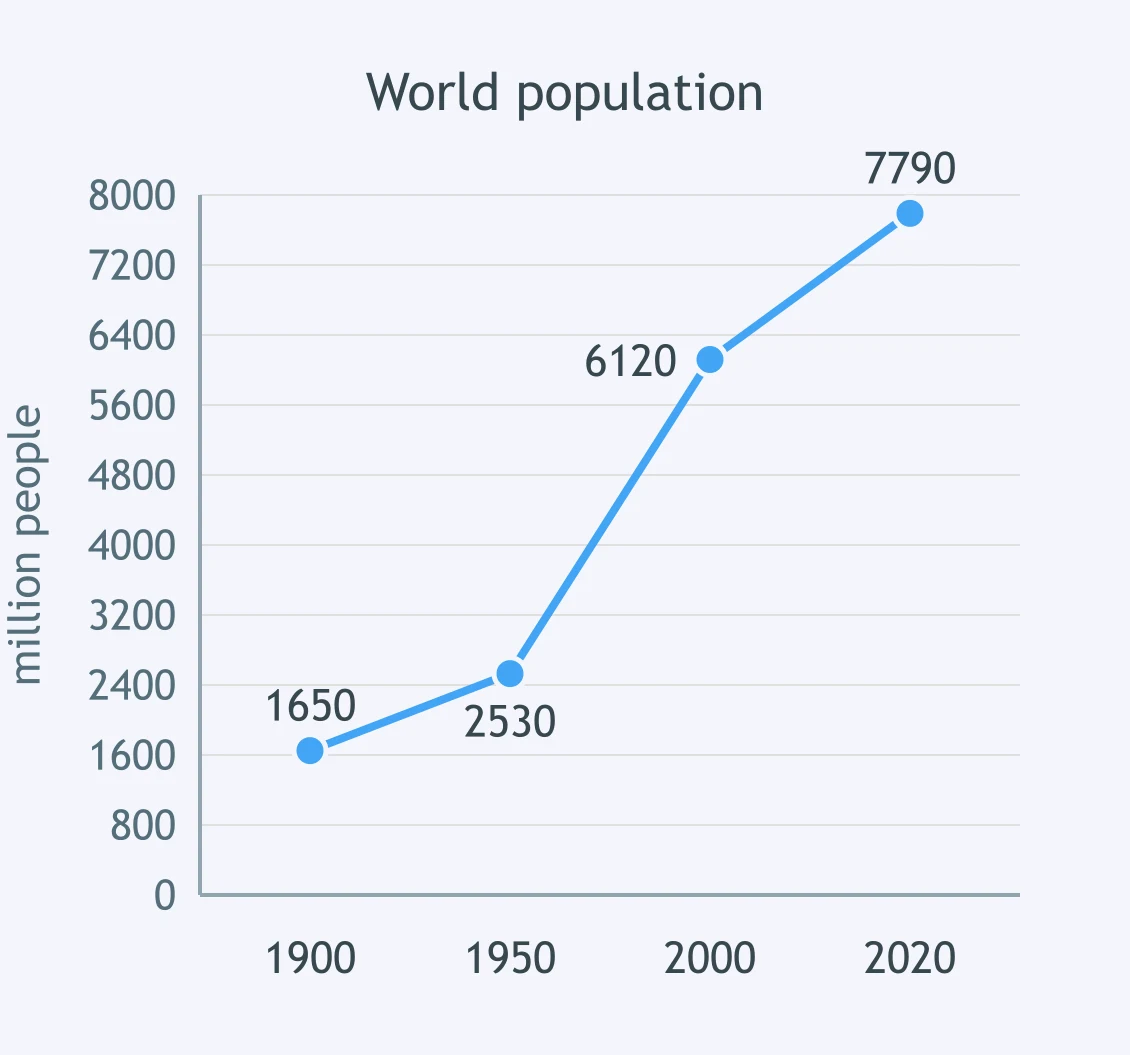
Use the world population graph. How did population growth after 1950 compare with growth before it?
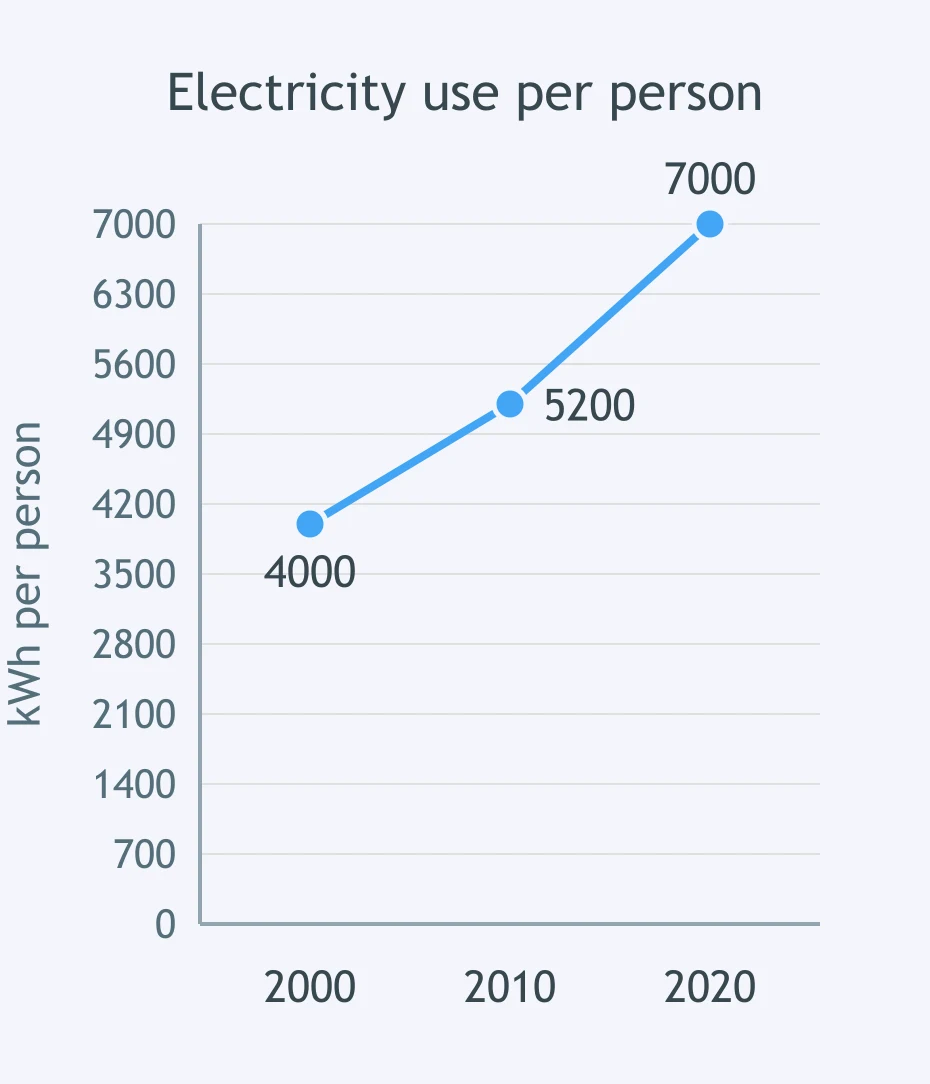
Use the line graph of per-person electricity use. What claim about consumption from 2000 to 2020 is supported?
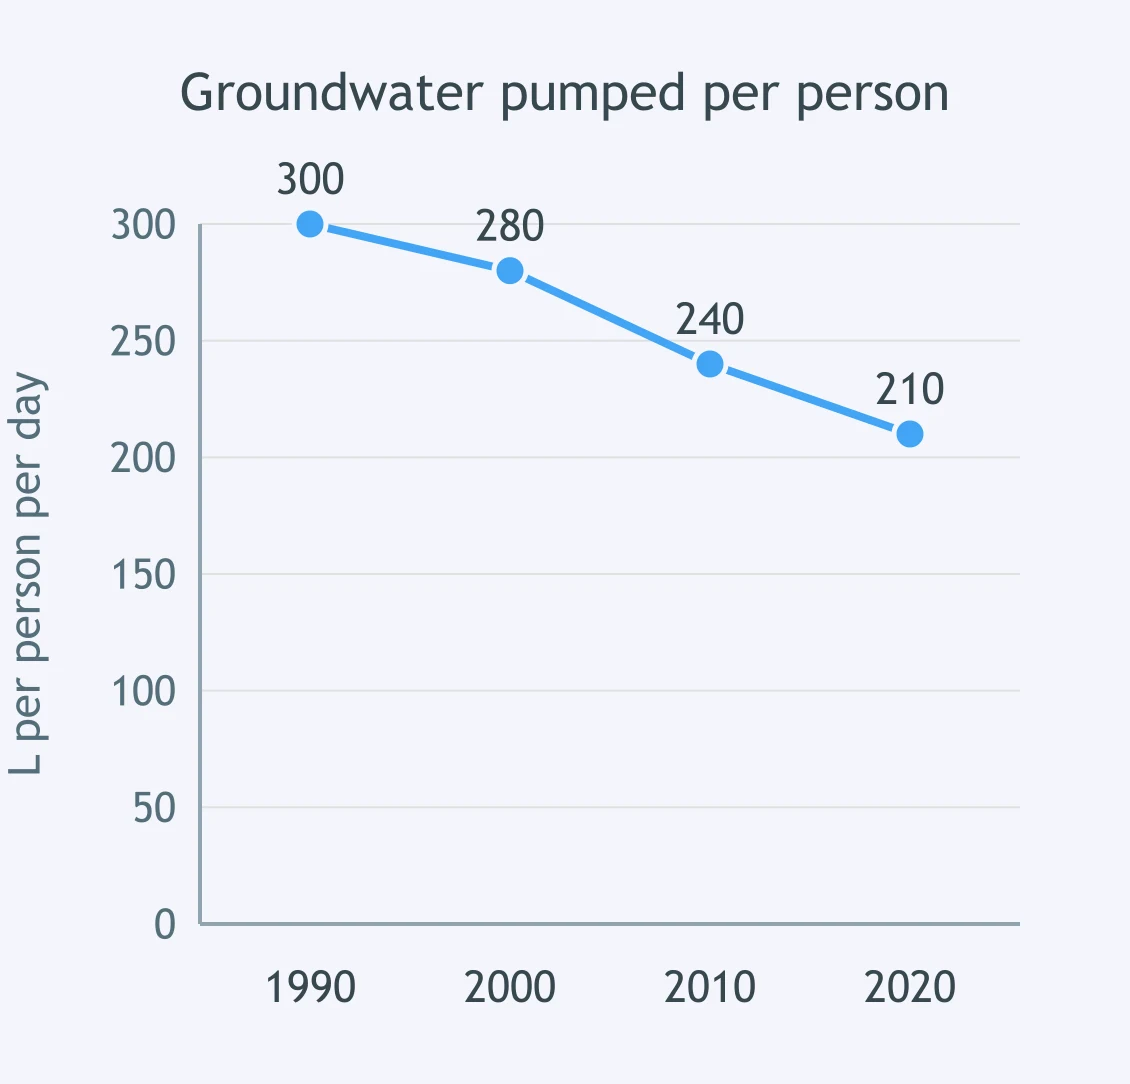
Use the groundwater graph. What claim best fits the per-person pumping record?
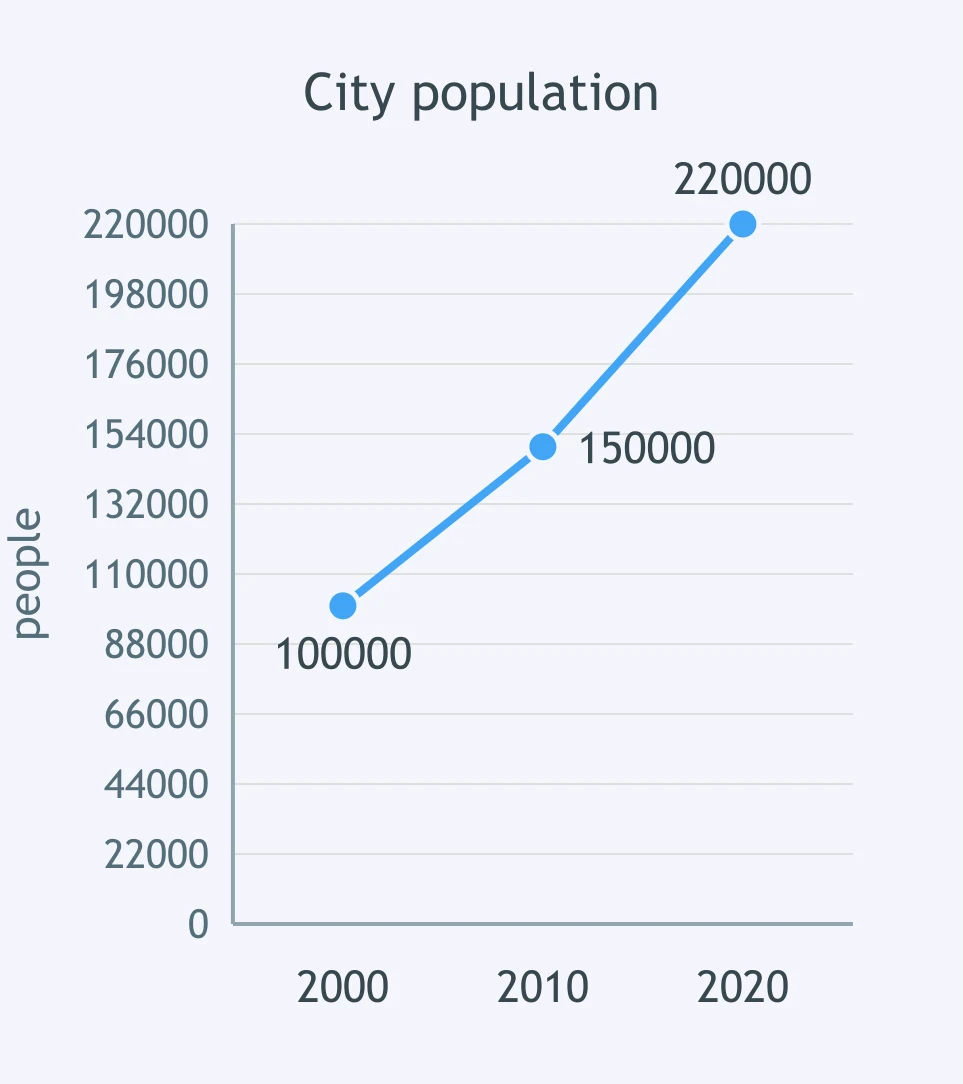
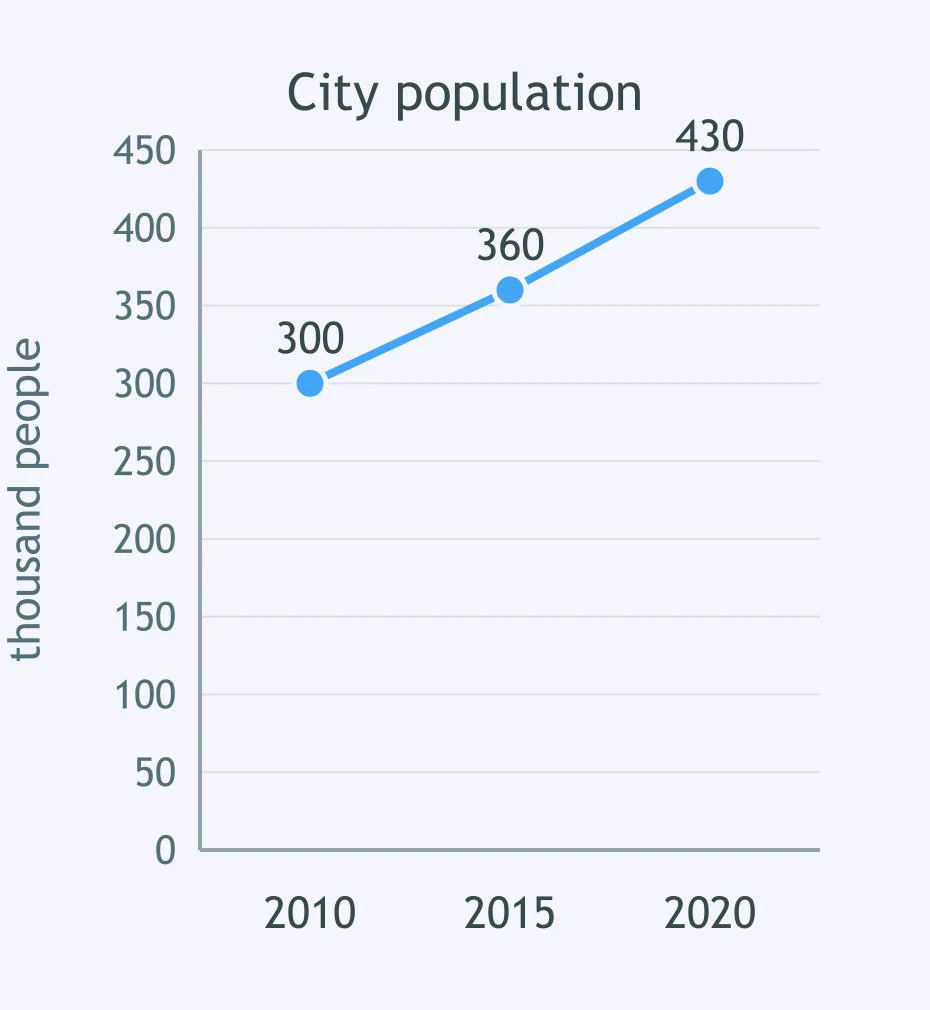
Use the city population graph. If plastic waste per person stayed about the same, what claim about total plastic waste is supported?
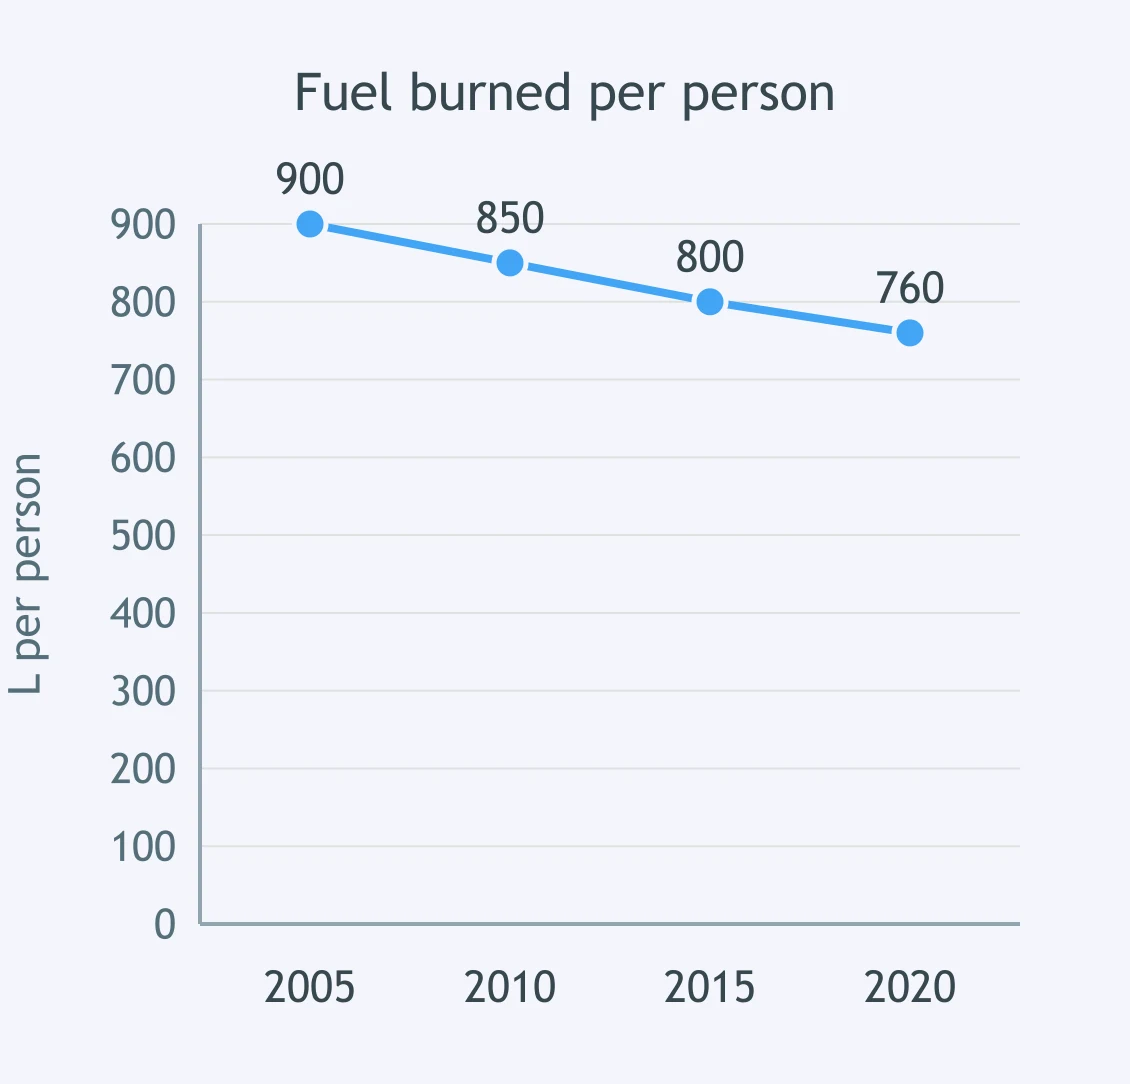
Use the line graph of liters of fuel burned per person. What claim about fossil fuel consumption is supported?
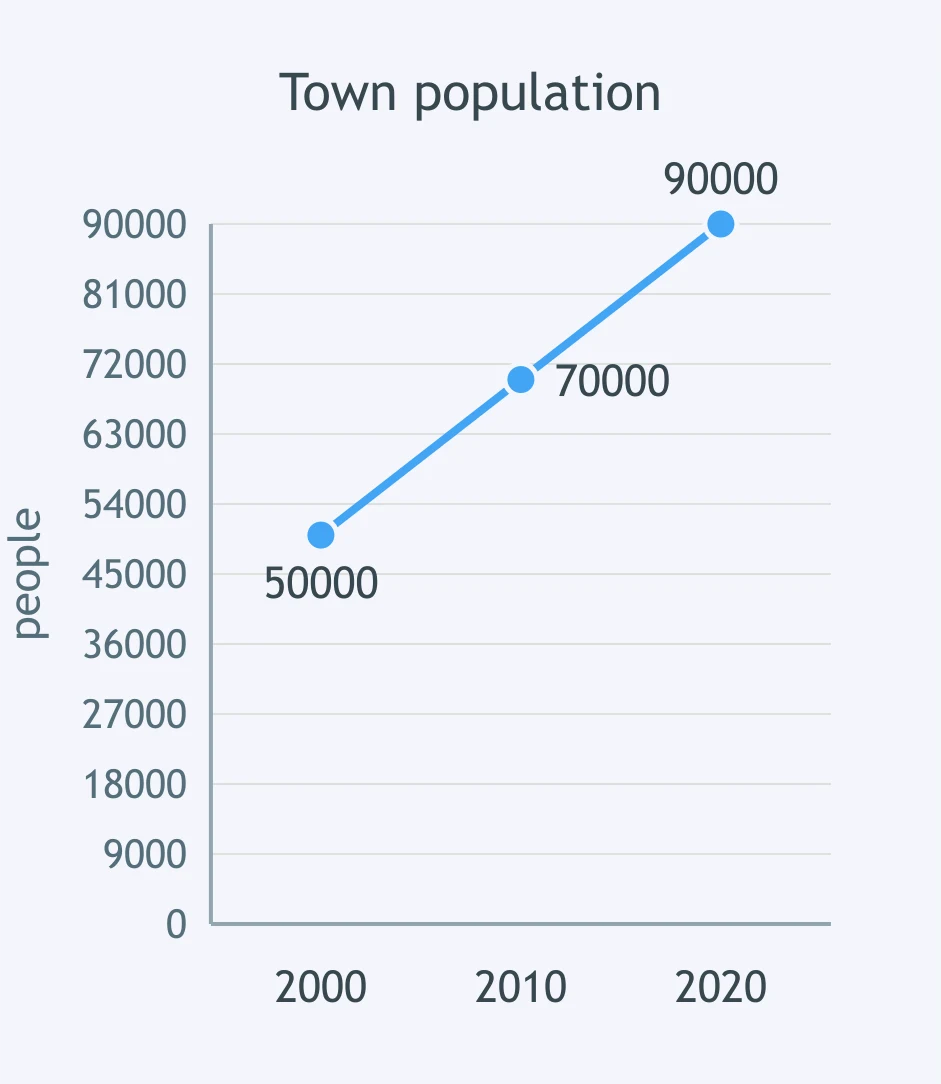
Use the town population graph. If each person used more resources each year, what claim about total resource use is supported?
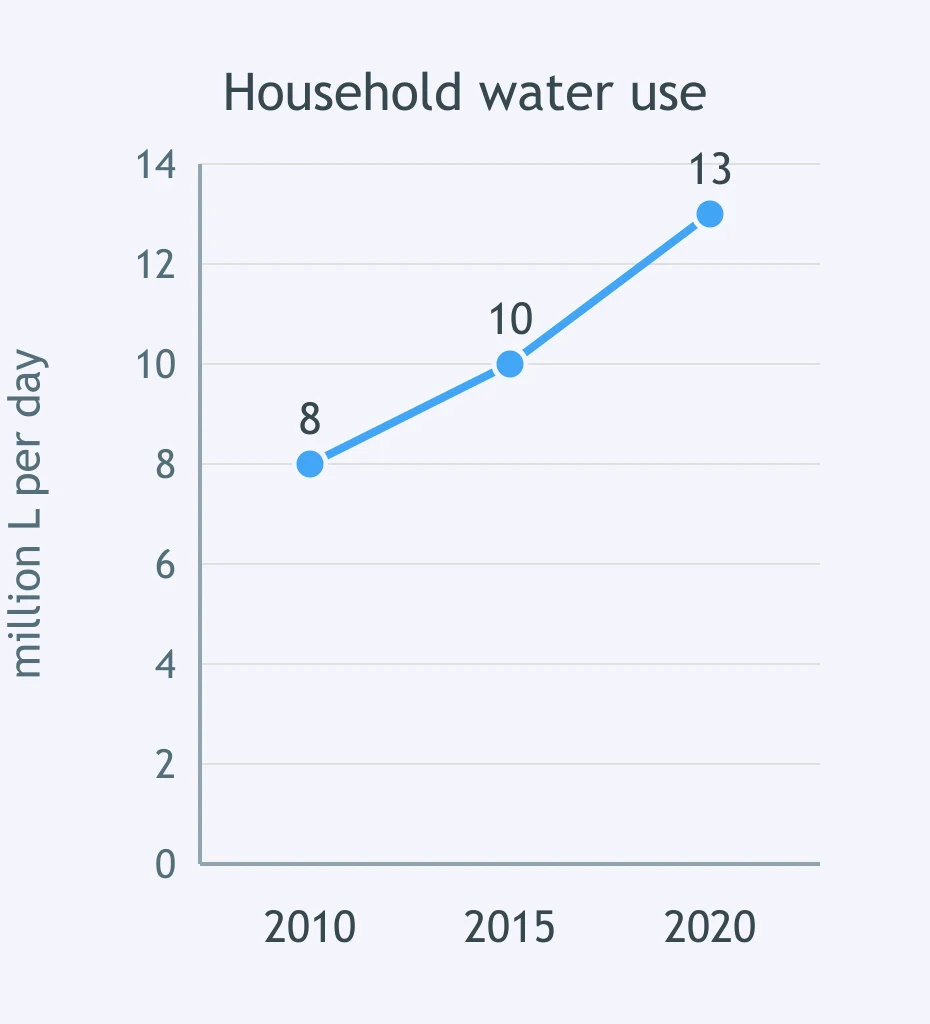
A town's population stayed about the same. Use the household water graph. What most likely caused the water increase?
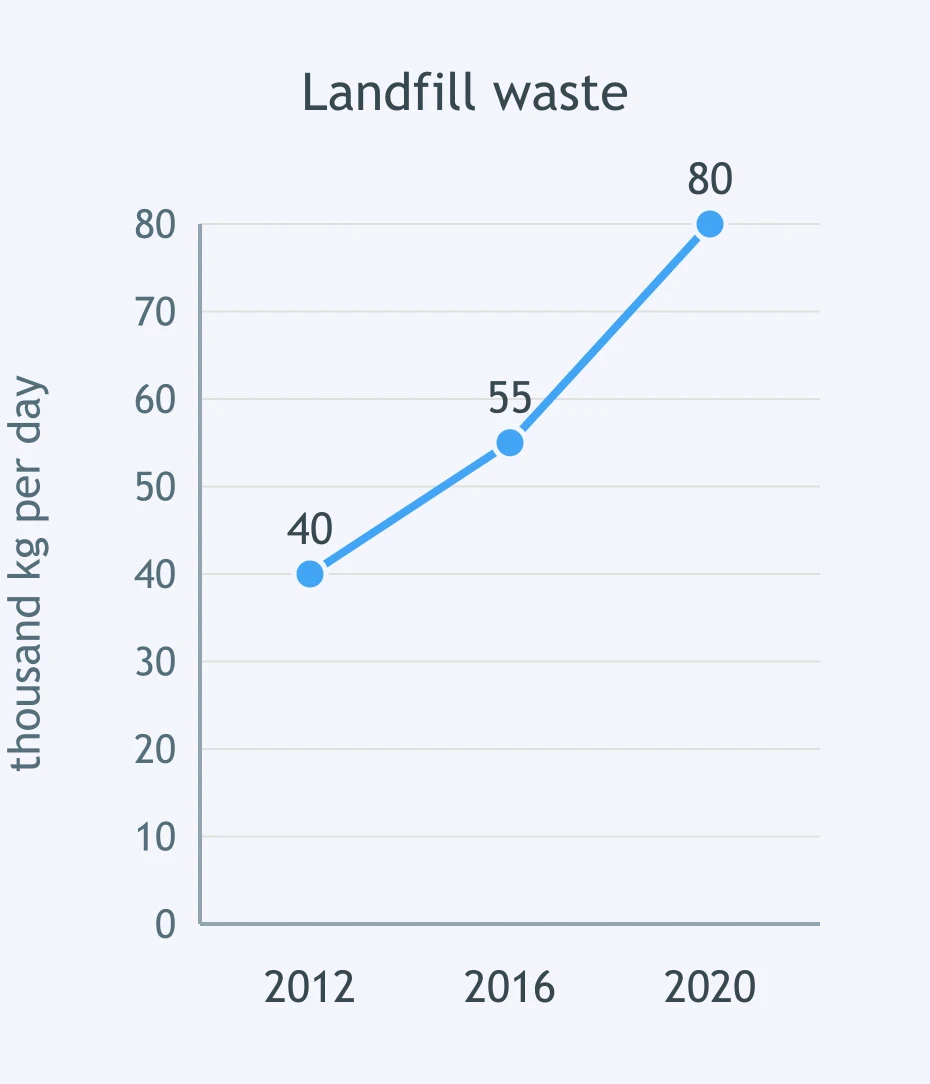
A town's number of residents stayed about the same. Use the landfill graph. What most likely drove the change in total waste?
An island's total fish catch doubled, while the catch per person stayed the same. What must have happened to the island's population?
Each household used about the same electricity as before, but a town added many households. What caused the increase in total electricity use?
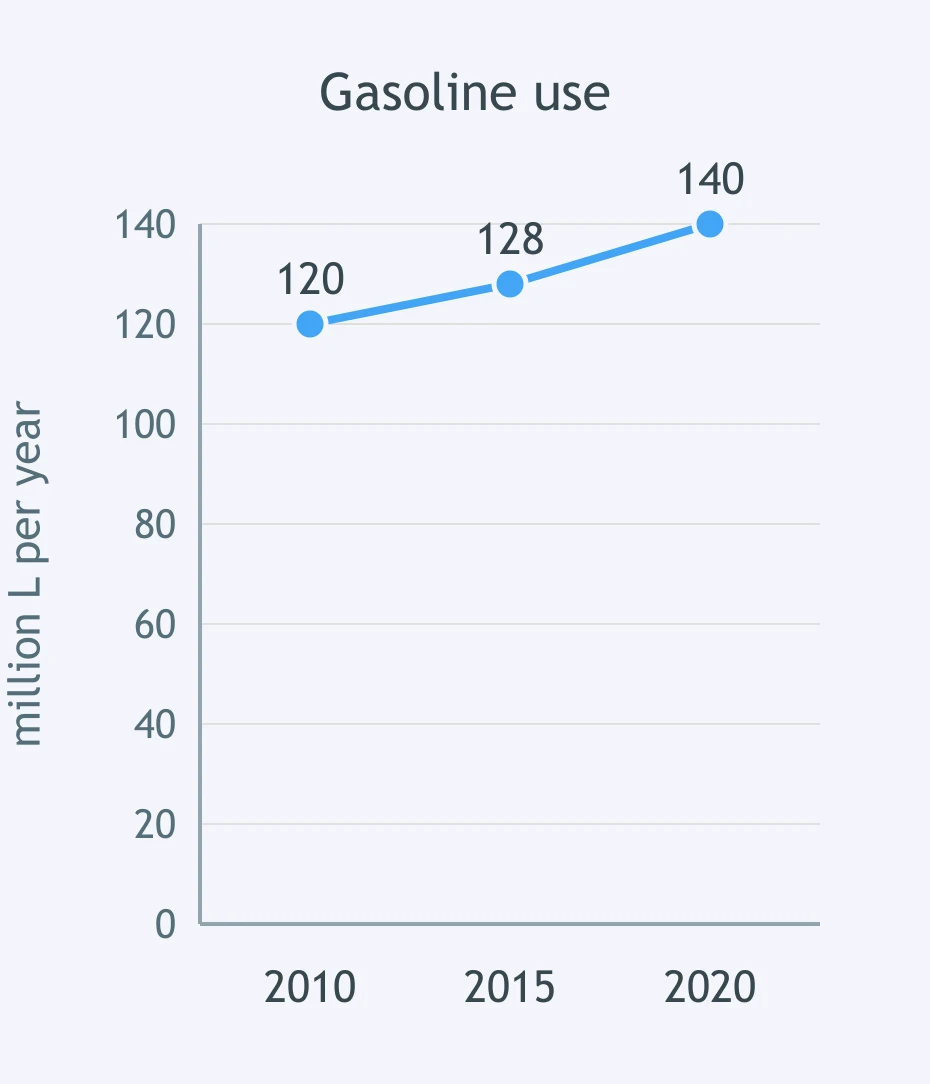
A city's population decreased. Use the gasoline graph. What most likely changed?
Region A has 2 million people using 6 metric tons per person yearly. Region B has 5 million using 2. Which uses more material total?
Community X has 100,000 people using 500 L of water each day. Community Y has 200,000 using 200 L. Which uses more total water?
District M has 30,000 people making 4 kg of waste each week. District N has 20,000 making 7 kg. Which makes more total waste?
City A has 4 million people using 3,000 kWh each year. City B has 3 million using 5,000 kWh. Which uses more electricity total?
Town A has 80,000 people using 2 kg of plastic weekly. Town B has 50,000 using 3 kg. Which uses more plastic total?
A student argues, "Landfill waste rose because population grew, although waste per person stayed constant." What reasoning best supports this argument?
A city expects lower groundwater pumping after installing efficient fixtures. Use the city population graph. What reasoning is most complete?
Two towns emit equal carbon dioxide. Town A has fewer people but higher fuel use per person. What reasoning explains the equality?
A student claims, "A larger population always causes a larger impact." Evidence shows a smaller town uses much more energy per person. What evaluation is best?
Crack the passcode before the zombies get in.
Answer, then swat bugs for bonus points.
Race through questions at your own speed.
Same question on every screen. Fastest wins.

Pick a tile, answer, hit bonuses and steals.

Evidence for Climate Change
20 questions