Loading
by BlastRoom
Taking a value or a pattern off a shaded, dotted, flow or distorted-area map.
#us_hs_world_geography
25 questions
One question set, multiple game modes. Tap any game to see it in action. Not sure which to pick?
Answer to place stones and capture territory.
Outrun the snow together.
Earn blasts, then hunt the other team.
Answer to earn energy, then climb.

The class blasts through walls together.
Bid on mystery lots. Most money wins.
Sell tours. Nice, standard, or a total scam.

Answer, restock, and serve the rush.
More correct answers pulls the rope your way.
Answer, then shoot down the alien wave.
Answer, then tap to leap the frozen ridge.
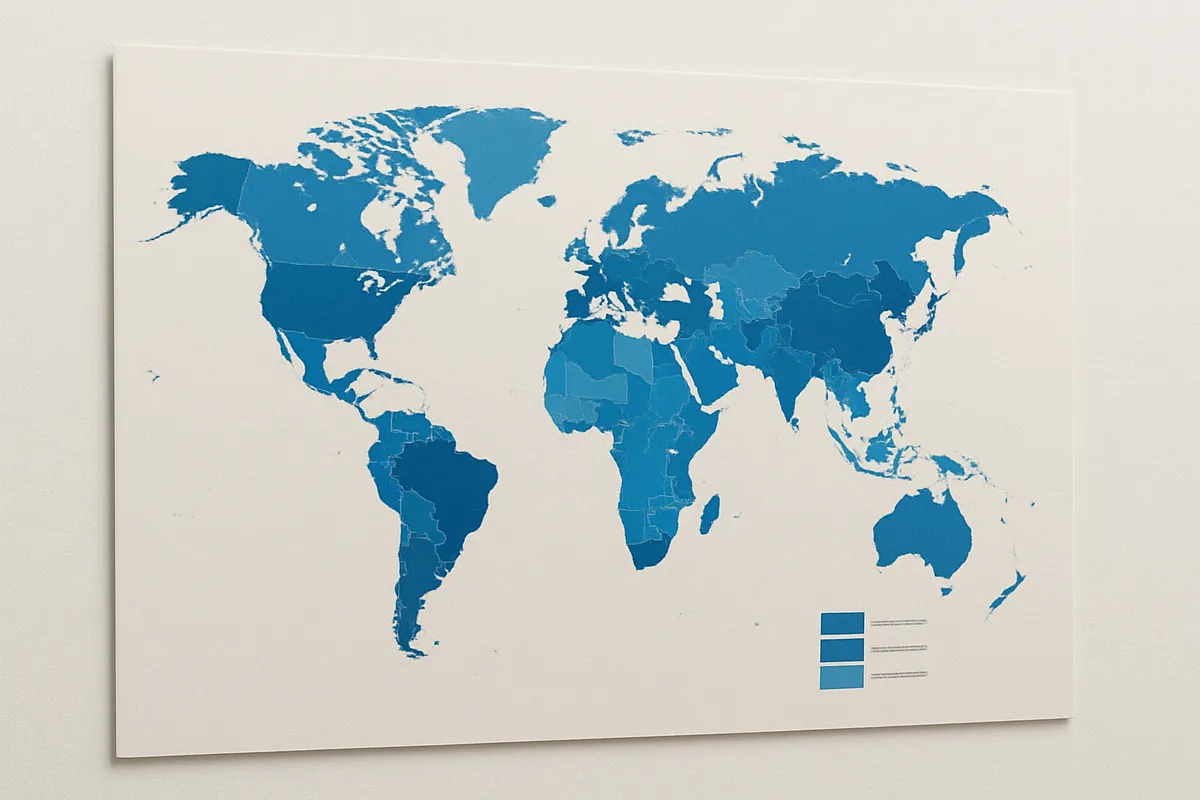
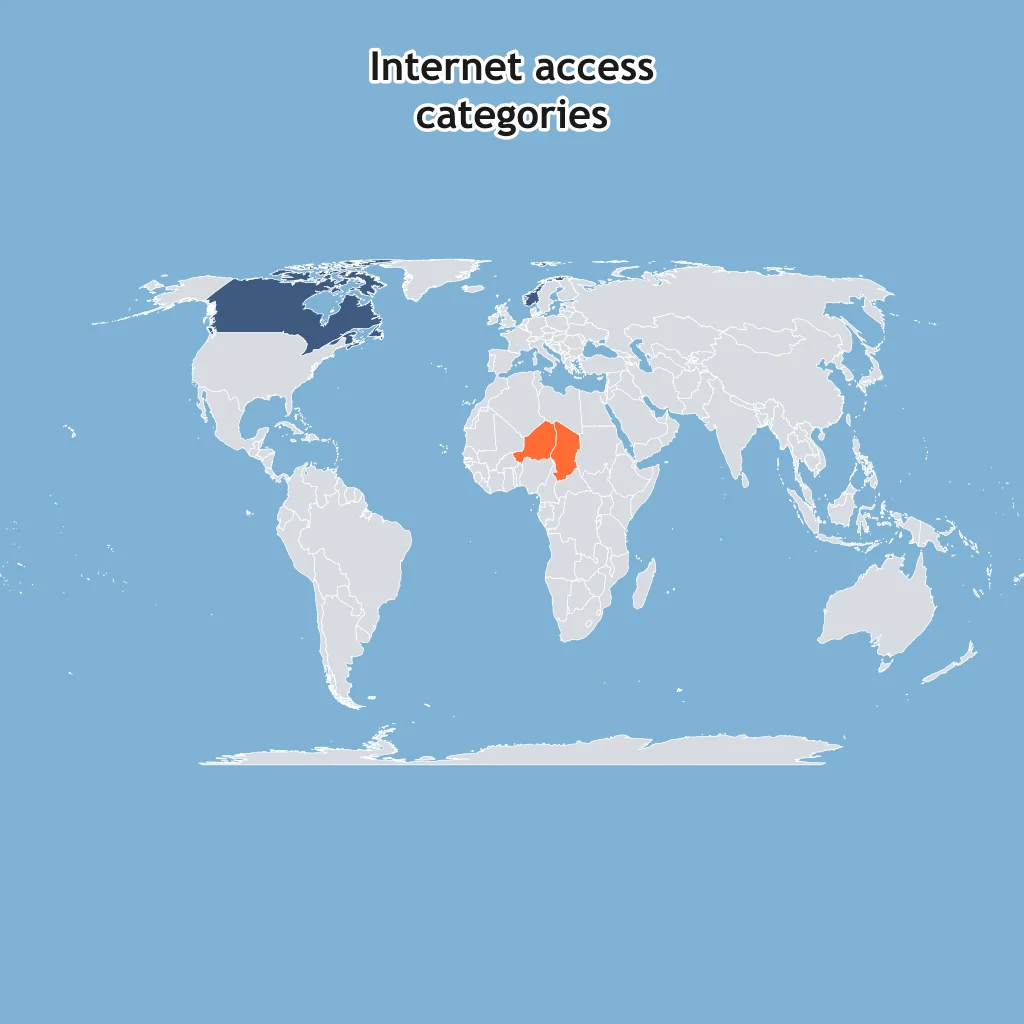
Dark shading means over 80% internet access; light shading means under 40%. What pattern does the choropleth show?
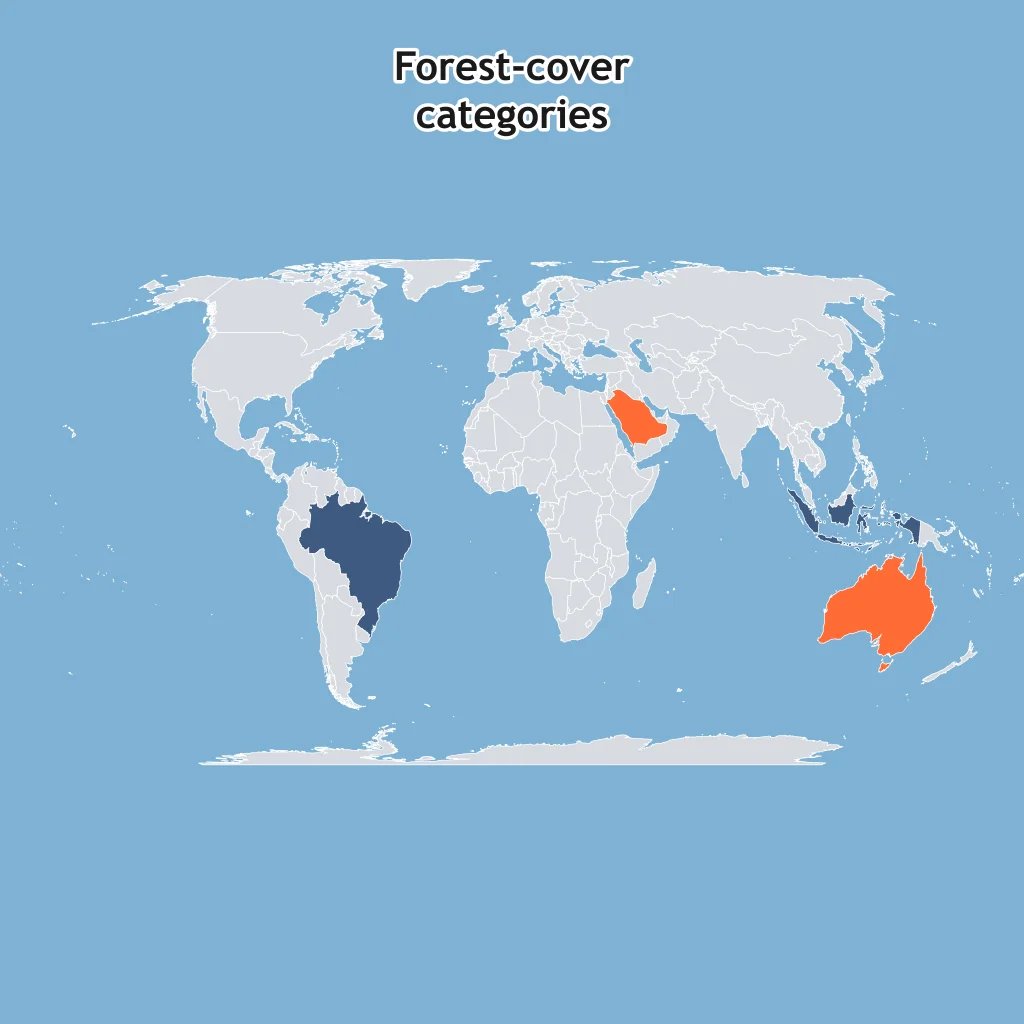
Dark shading means high forest-cover share; light shading means low forest-cover share. What spatial pattern is shown?
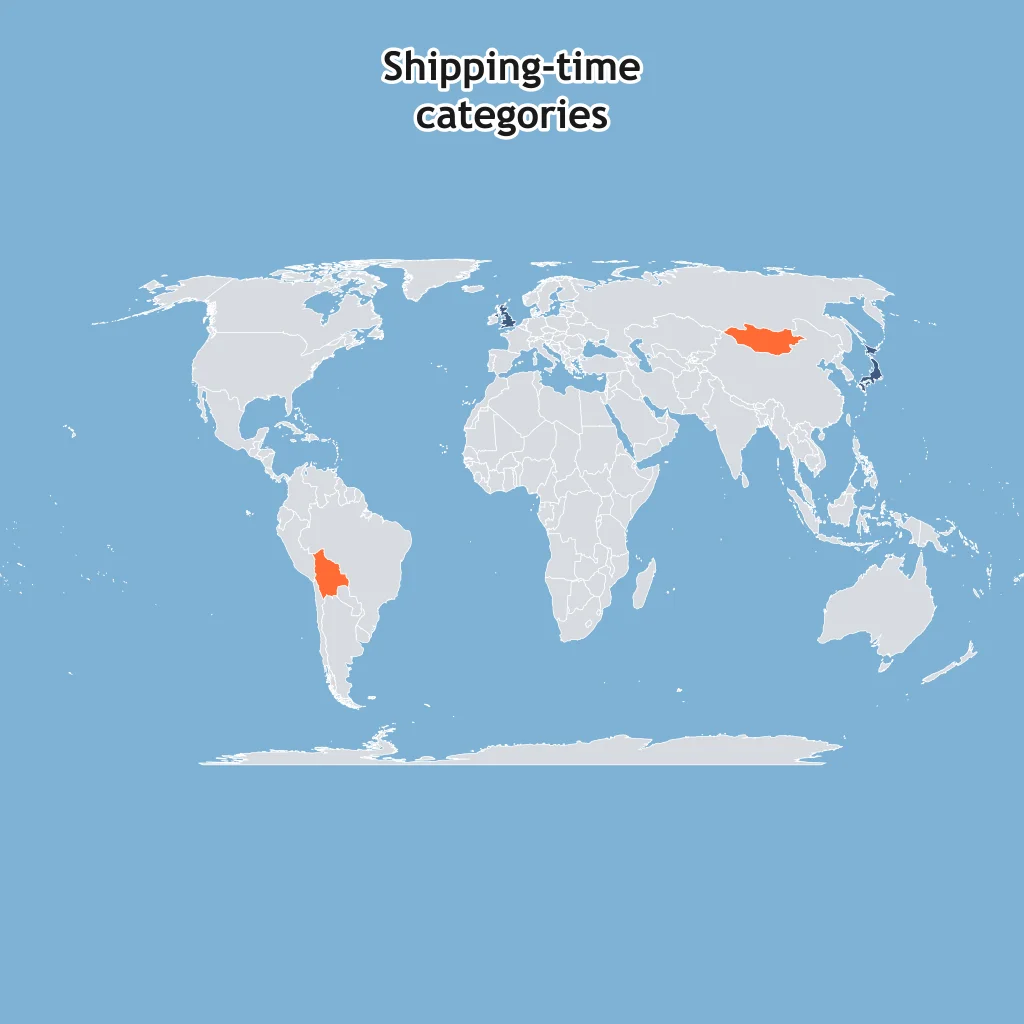
Dark shading means shorter shipping time to major ocean routes; light shading means longer time. What comparison does the map show?
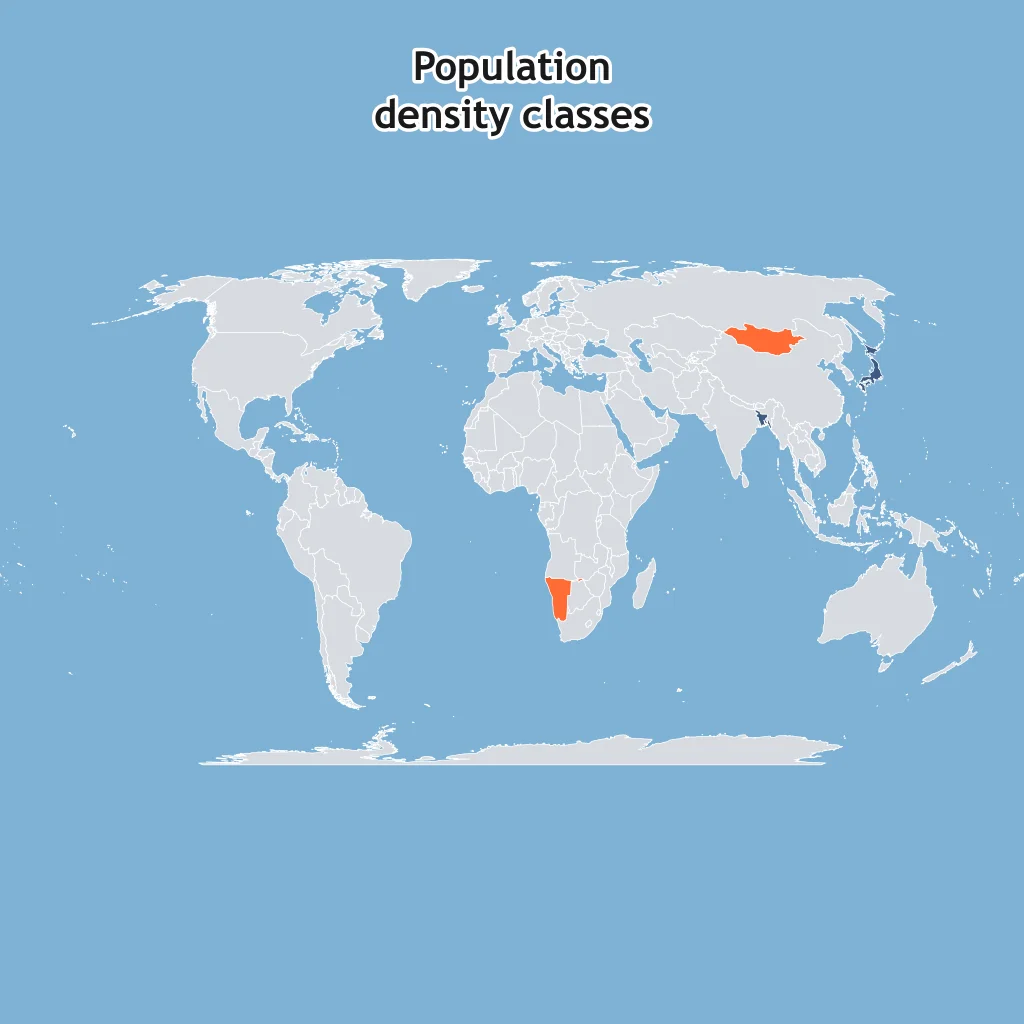
Dark shading means high population density; light shading means low population density. What does the choropleth show?
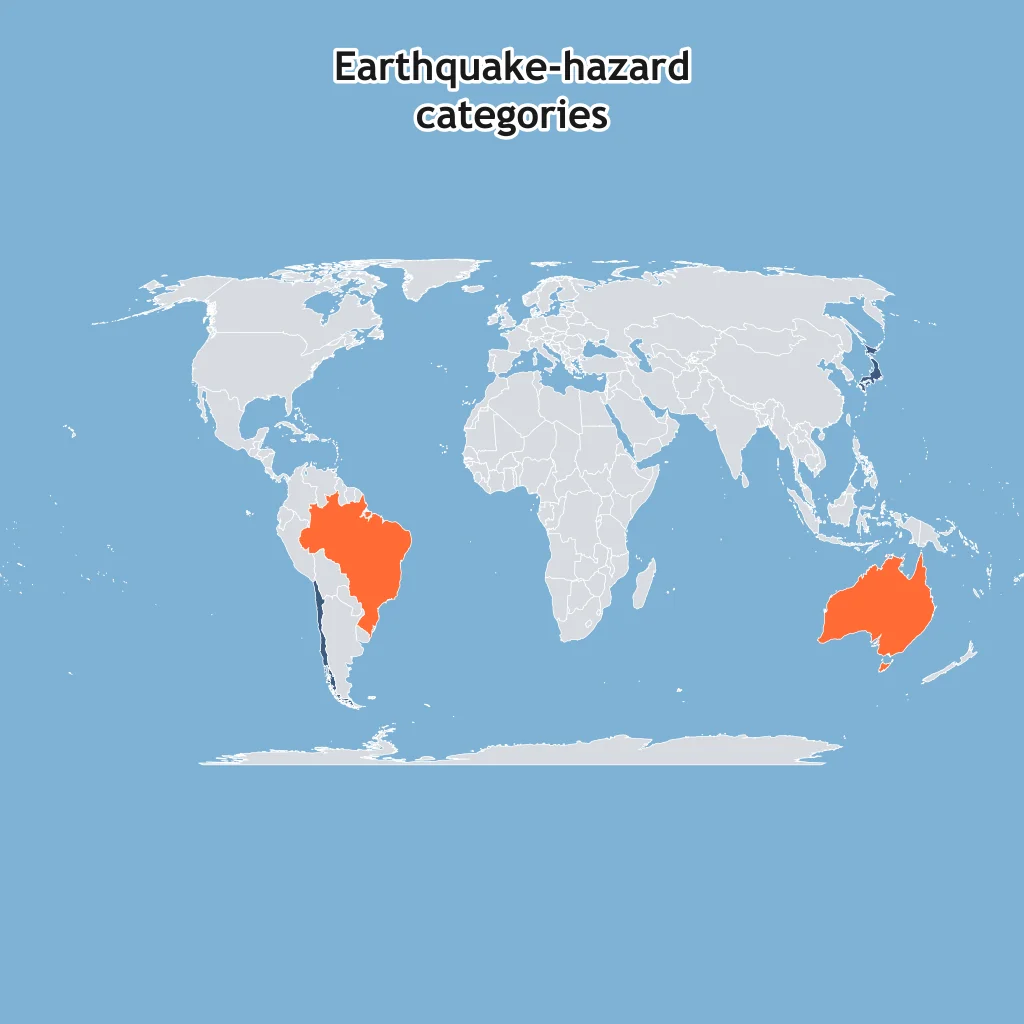
Dark blue shading means higher earthquake hazard; orange shading means lower hazard. What pattern does the shaded map show?
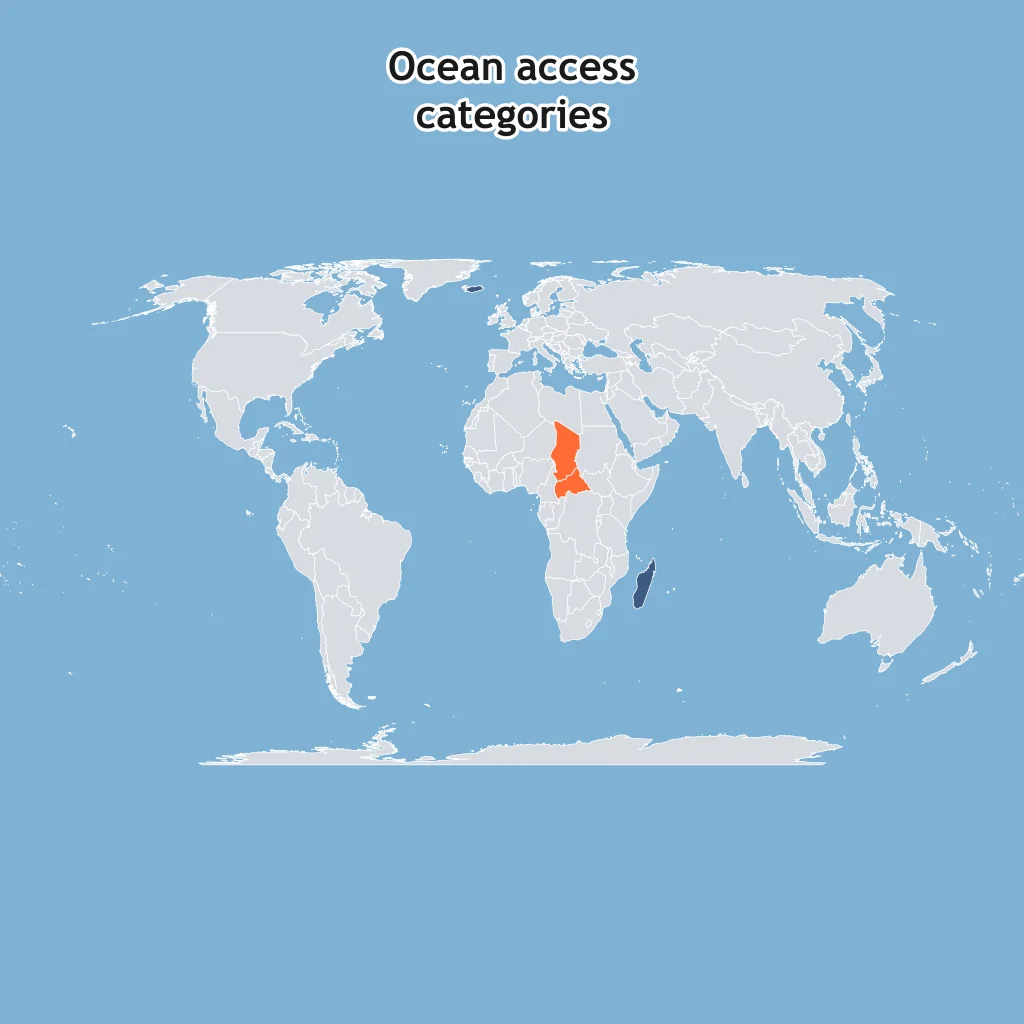
Dark shading means high direct ocean access; light shading means no direct coastline. What does the map classify?
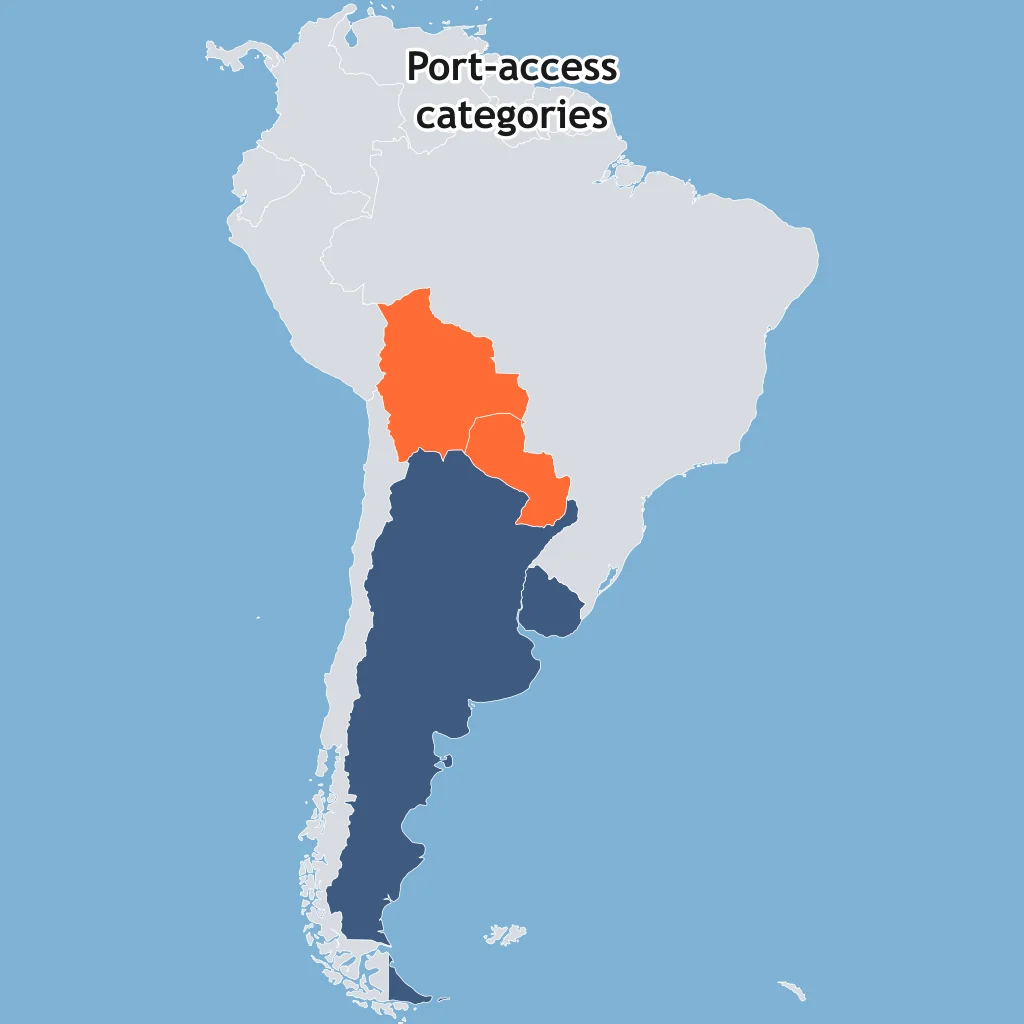
Dark shading means higher port access; light shading means lower port access. What South American pattern is shown?
A geographer has a percent for each country and wants a map that shades each country from pale to dark by that percent. What thematic map type fits?
A geographer wants to map individual earthquake epicenters as separate marks at their exact locations. What thematic map type fits?
A geographer wants country shapes resized so area represents total population, not land area. What thematic map type fits?
A map will use arrows from exporting countries to importing countries, with wider arrows for more trade. What thematic map type fits?
A choropleth map colors each census tract from pale to dark based on median income. What does one tract's shade tell a reader?
A health geographer's dot distribution map uses one dot for every 1,000 malaria cases. One district shows 7 dots. About how many cases does it have?
On this flow map, each route label gives migrants in millions. What comparison does the map show?
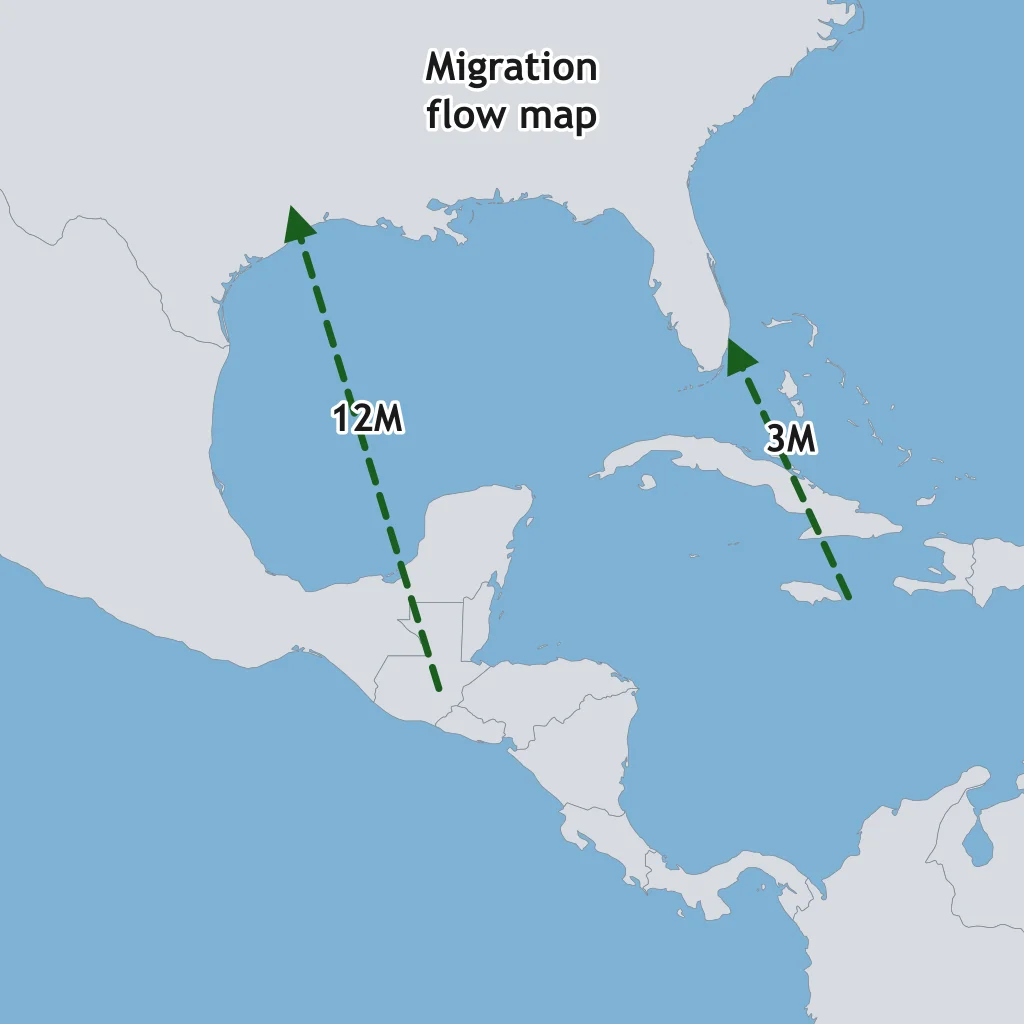
On the trade flow map, labels give millions of tons shipped. What does the map show?
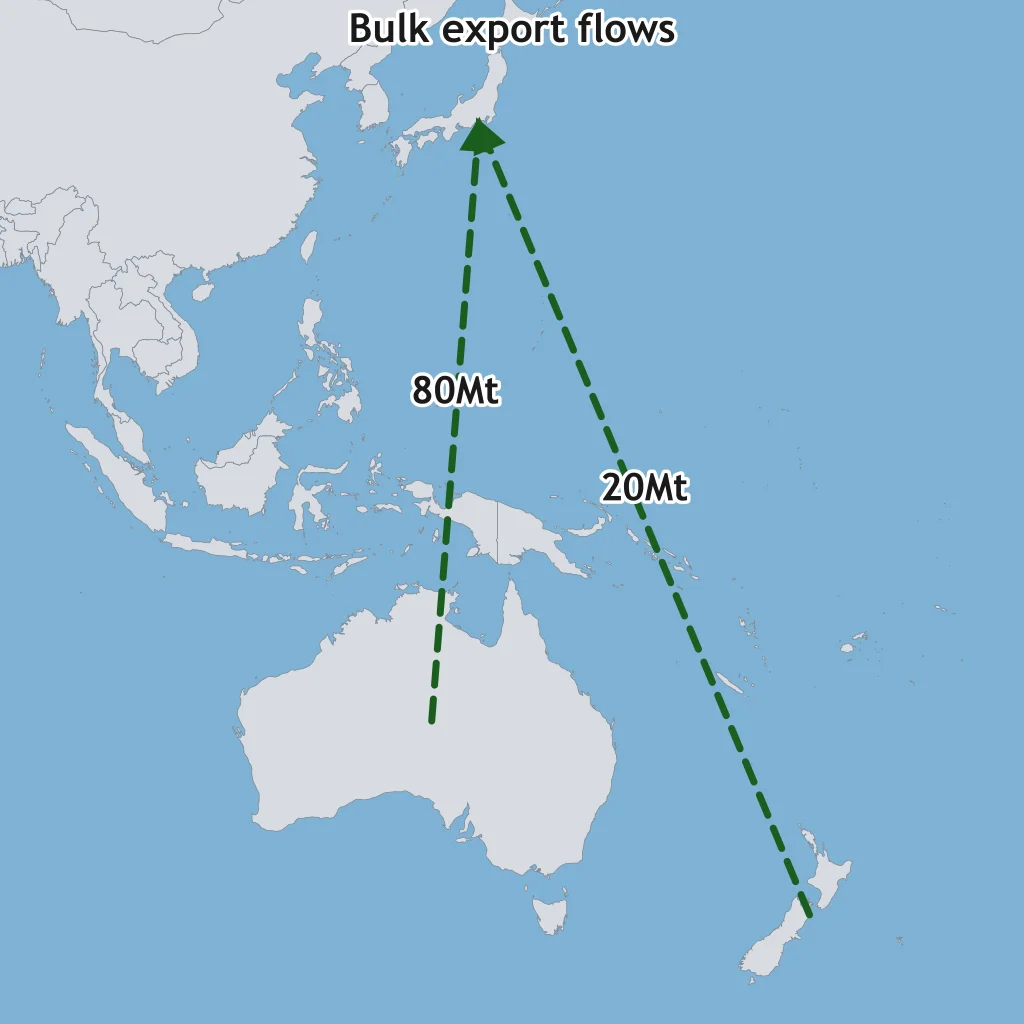
A container-flow map labels two ocean routes. What pattern is shown by the labels?
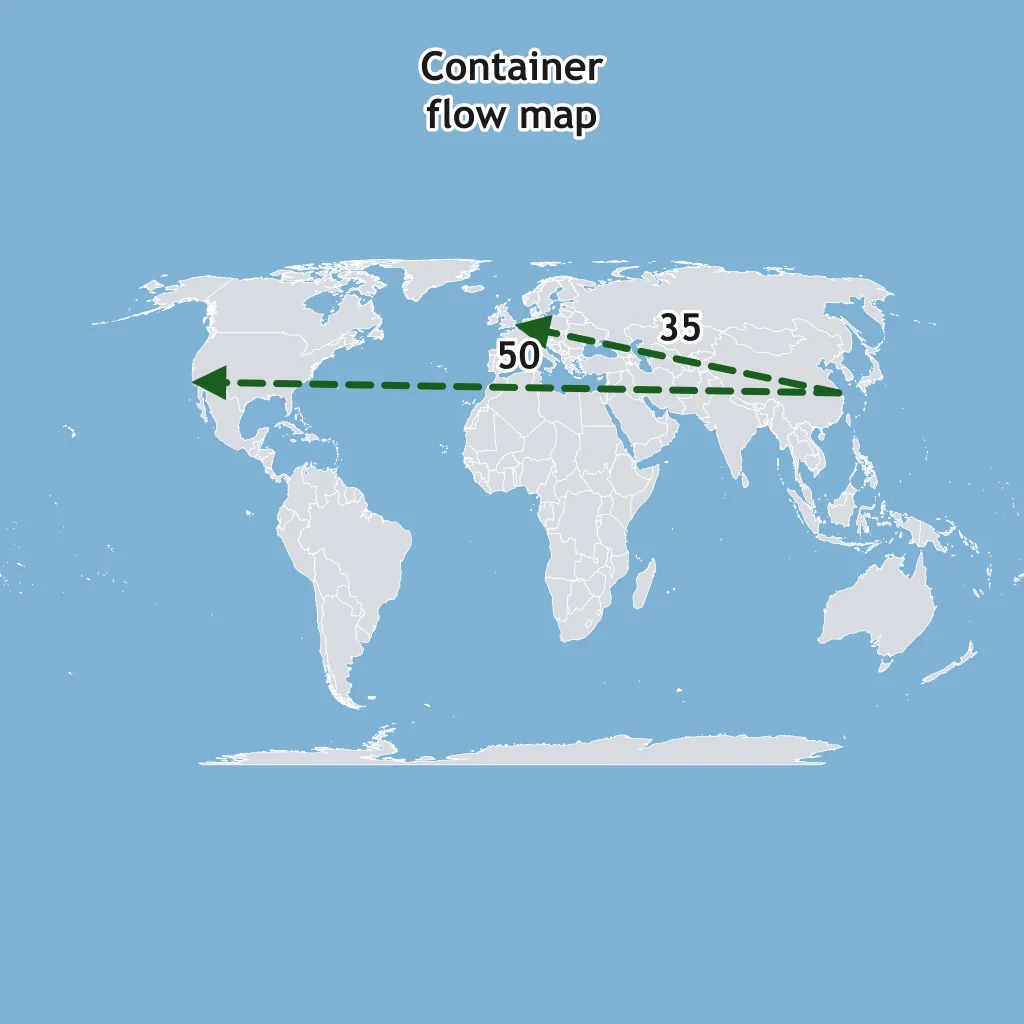
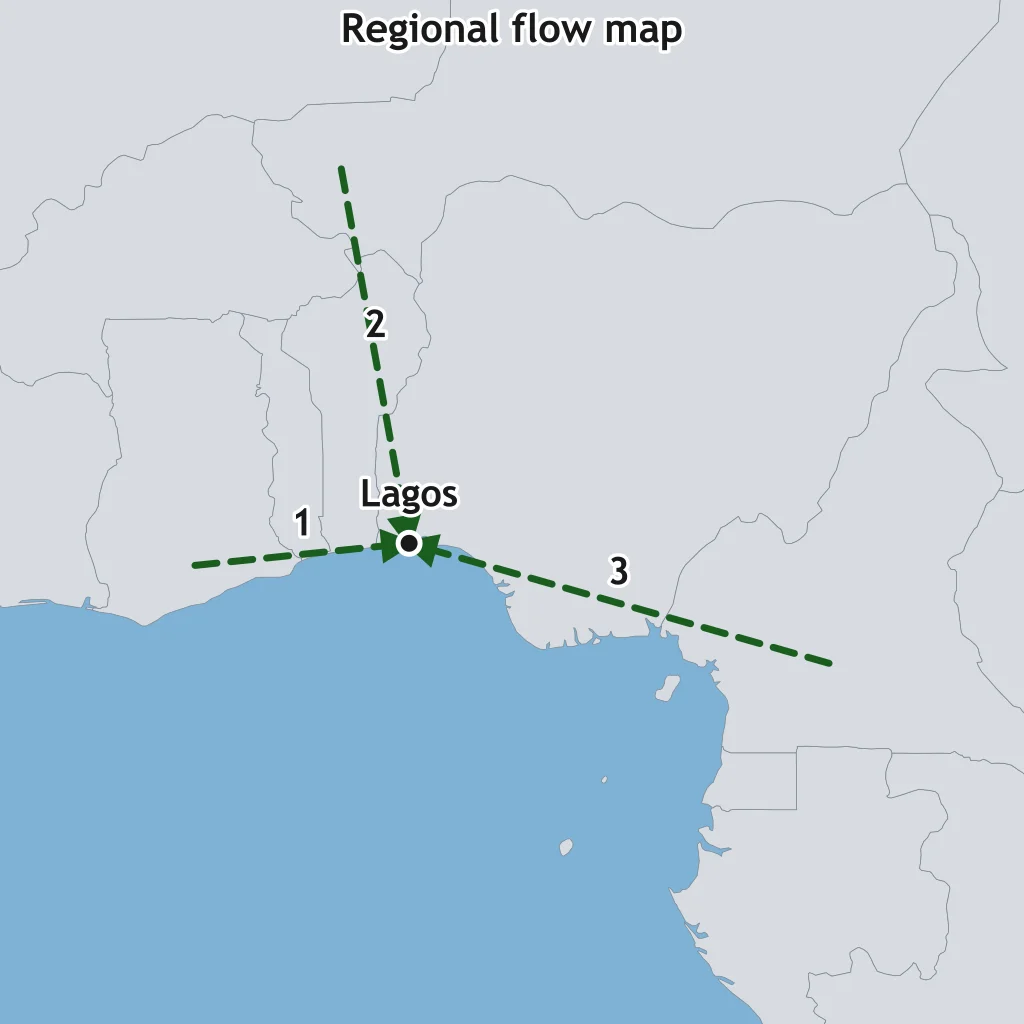
Read the flow lines on the map. What movement pattern do they show?
On this export flow map, route labels give volume. What comparison is supported?
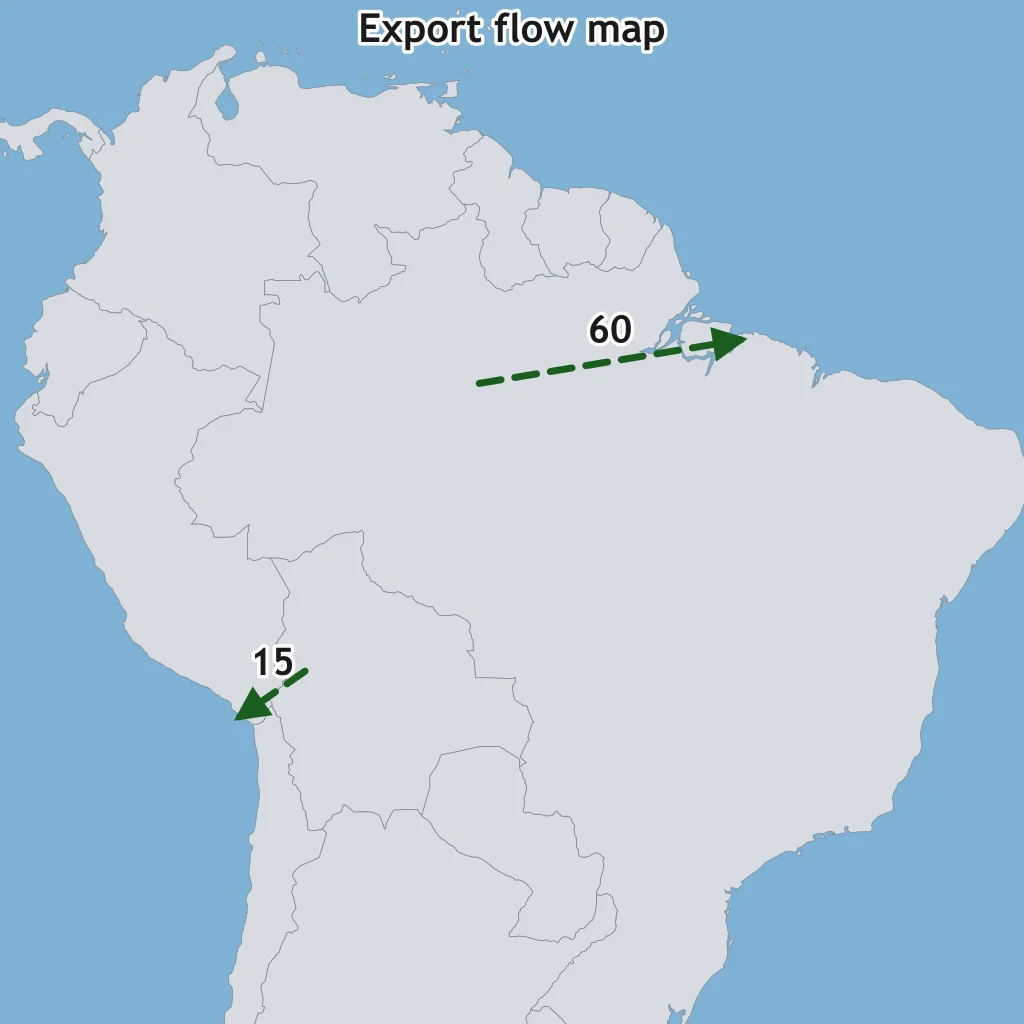
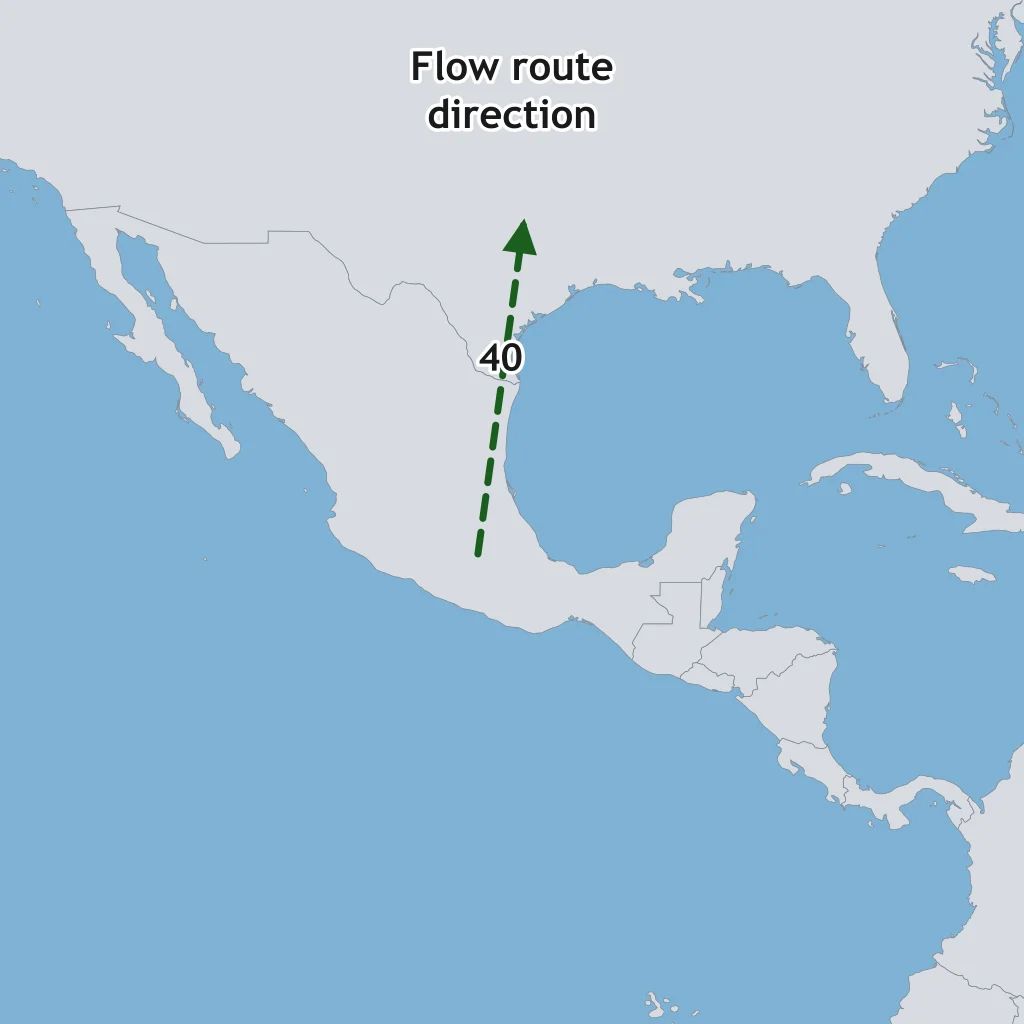
On a flow map, arrowheads point from origin to destination. In the figure, where does the 40 route end?
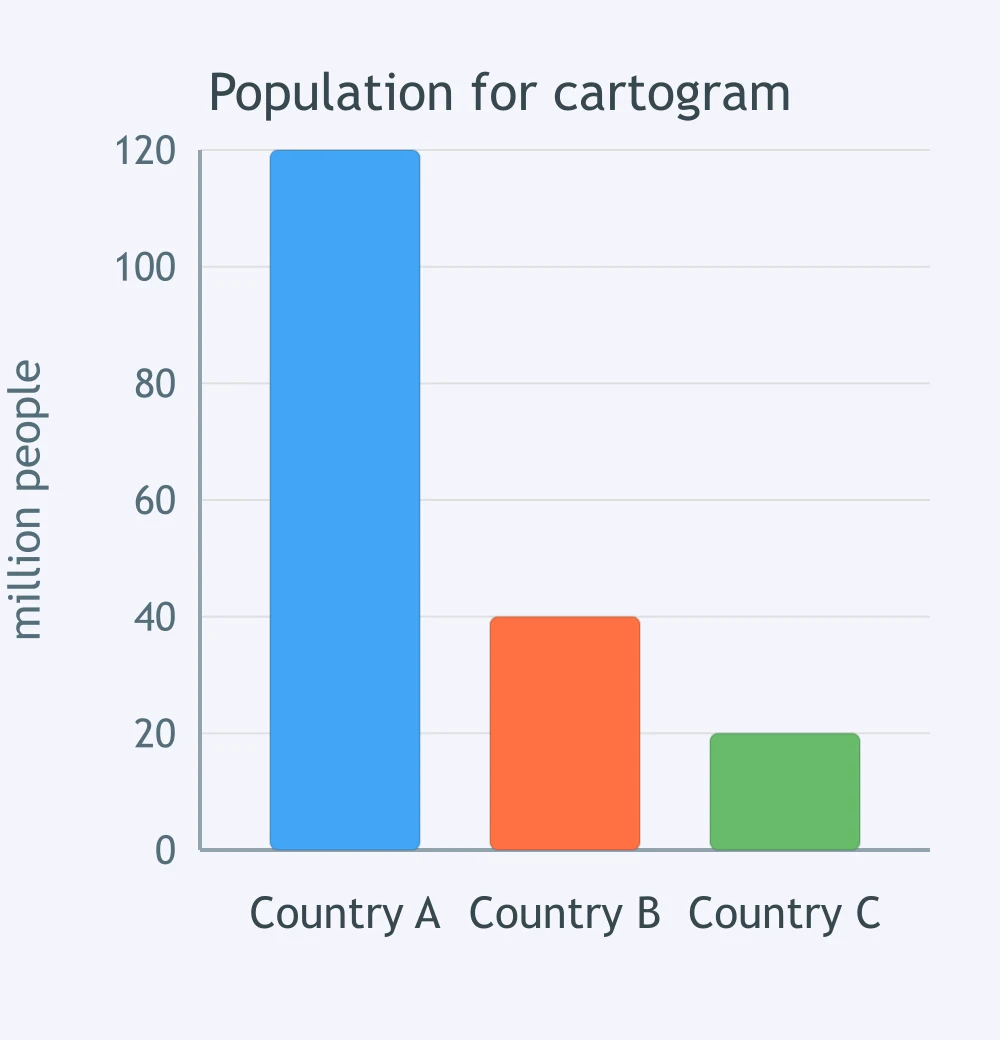
A population cartogram will size countries by the values in the graph, not land area. What will be drawn largest?
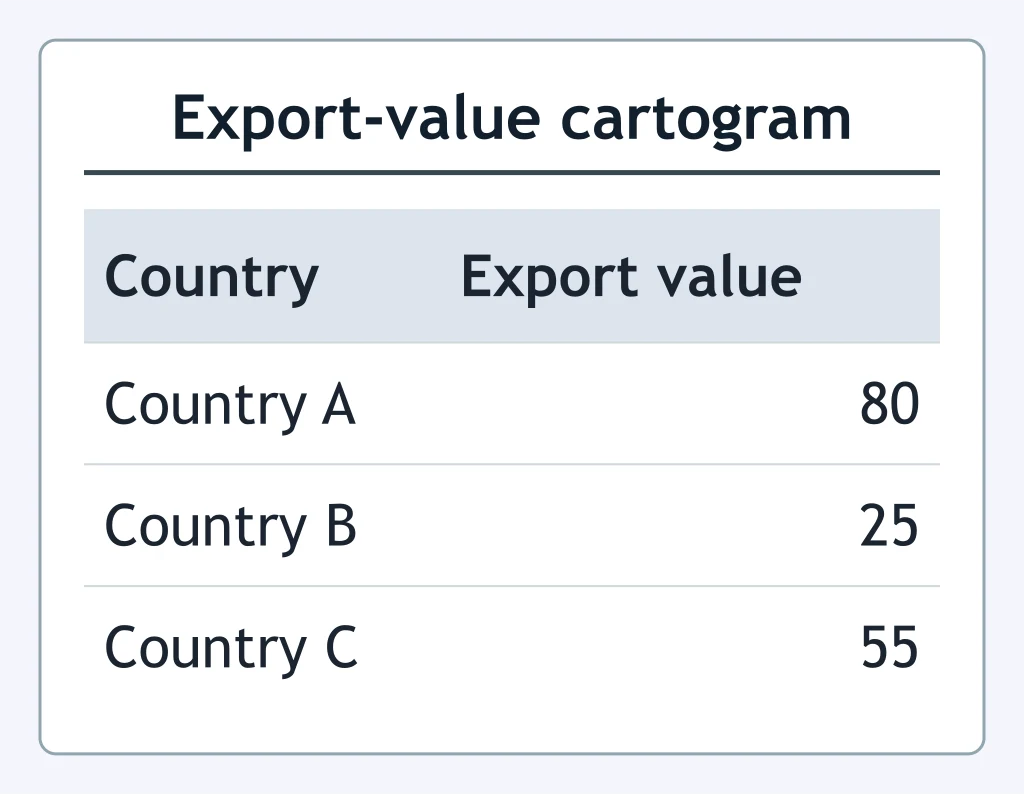
A cartogram sizes each country by export value using the table. What pattern will it show?
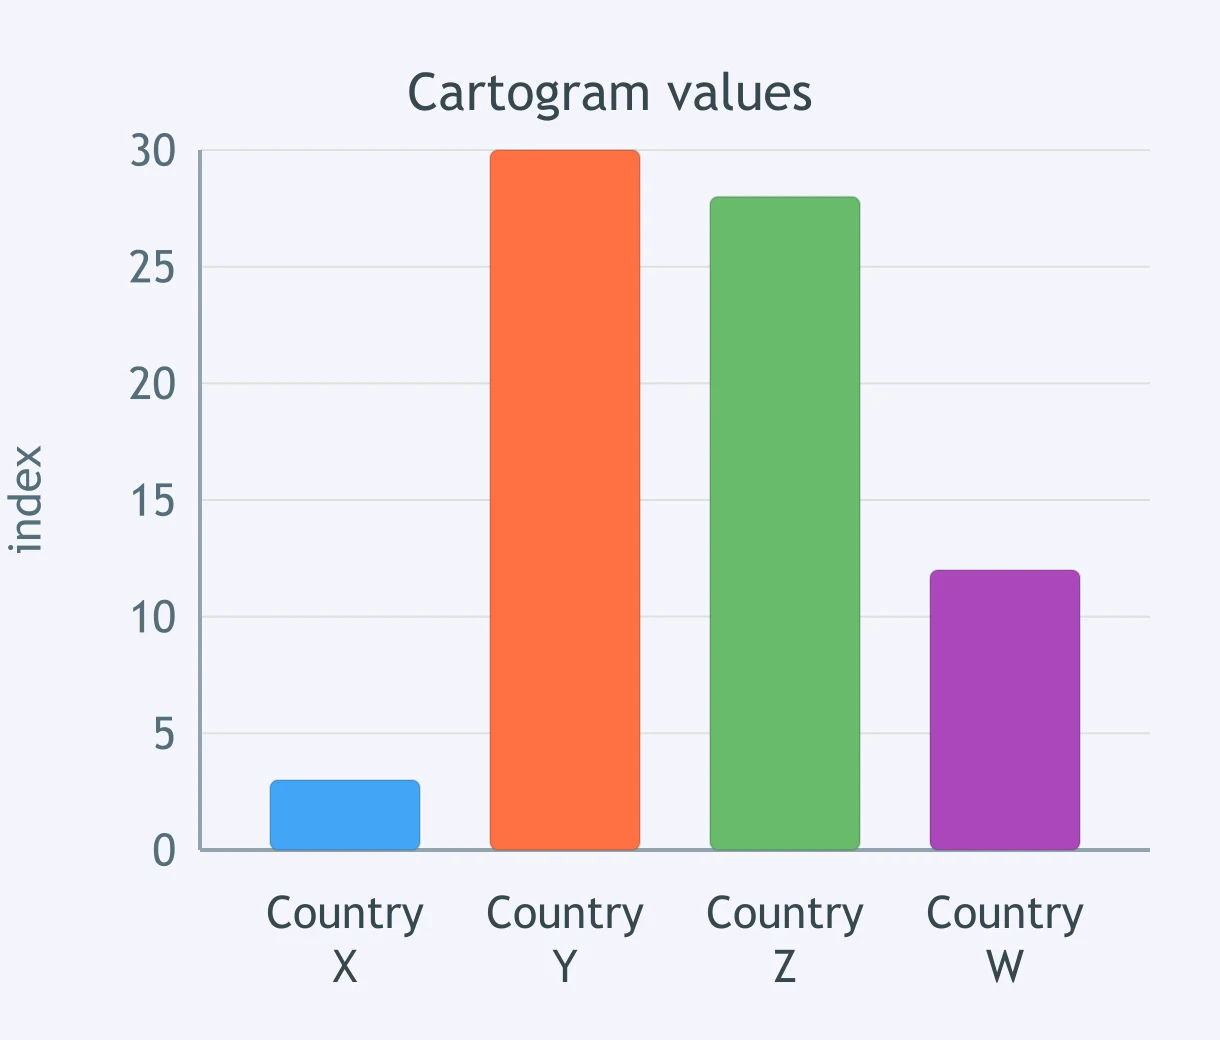
A cartogram will use the graph values as map area. Which pair would look nearly equal in area?
The table gives land area and population. A population cartogram uses the population column. What will the cartogram show?
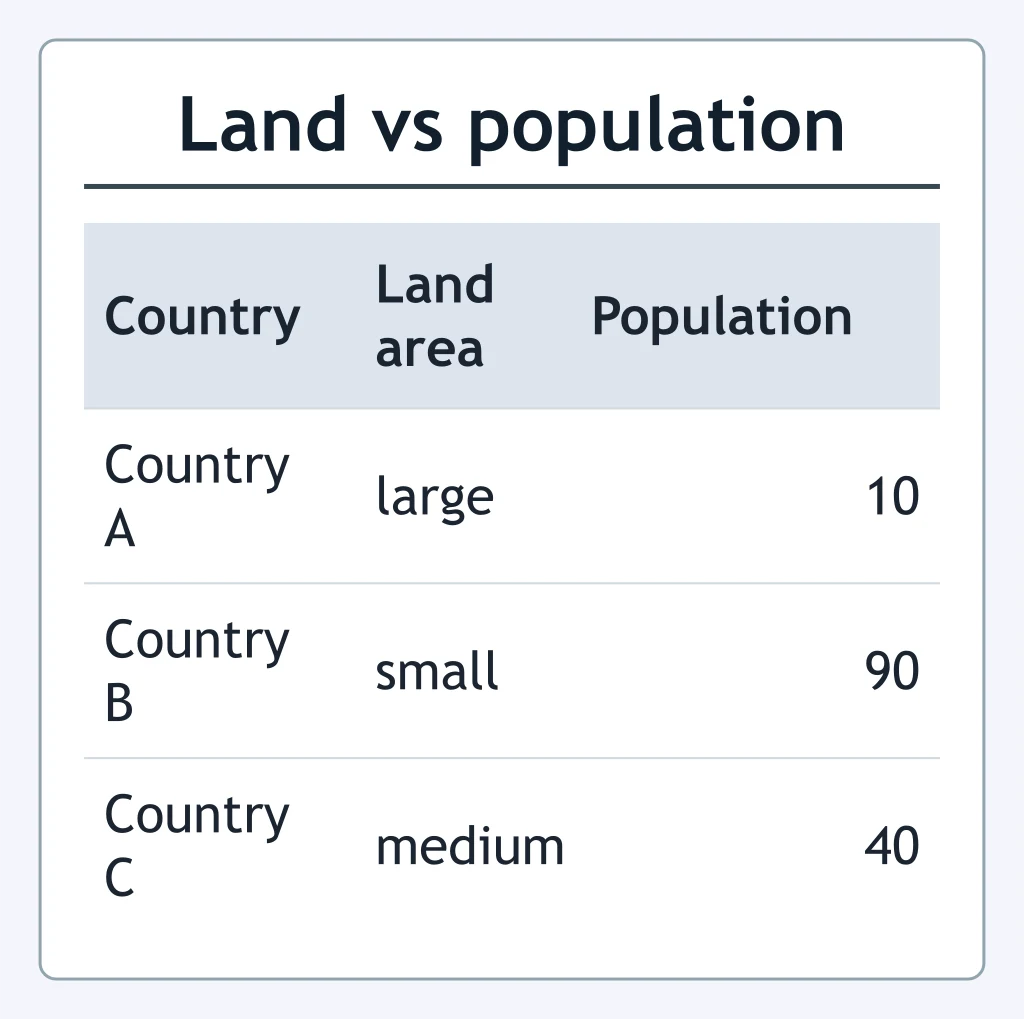
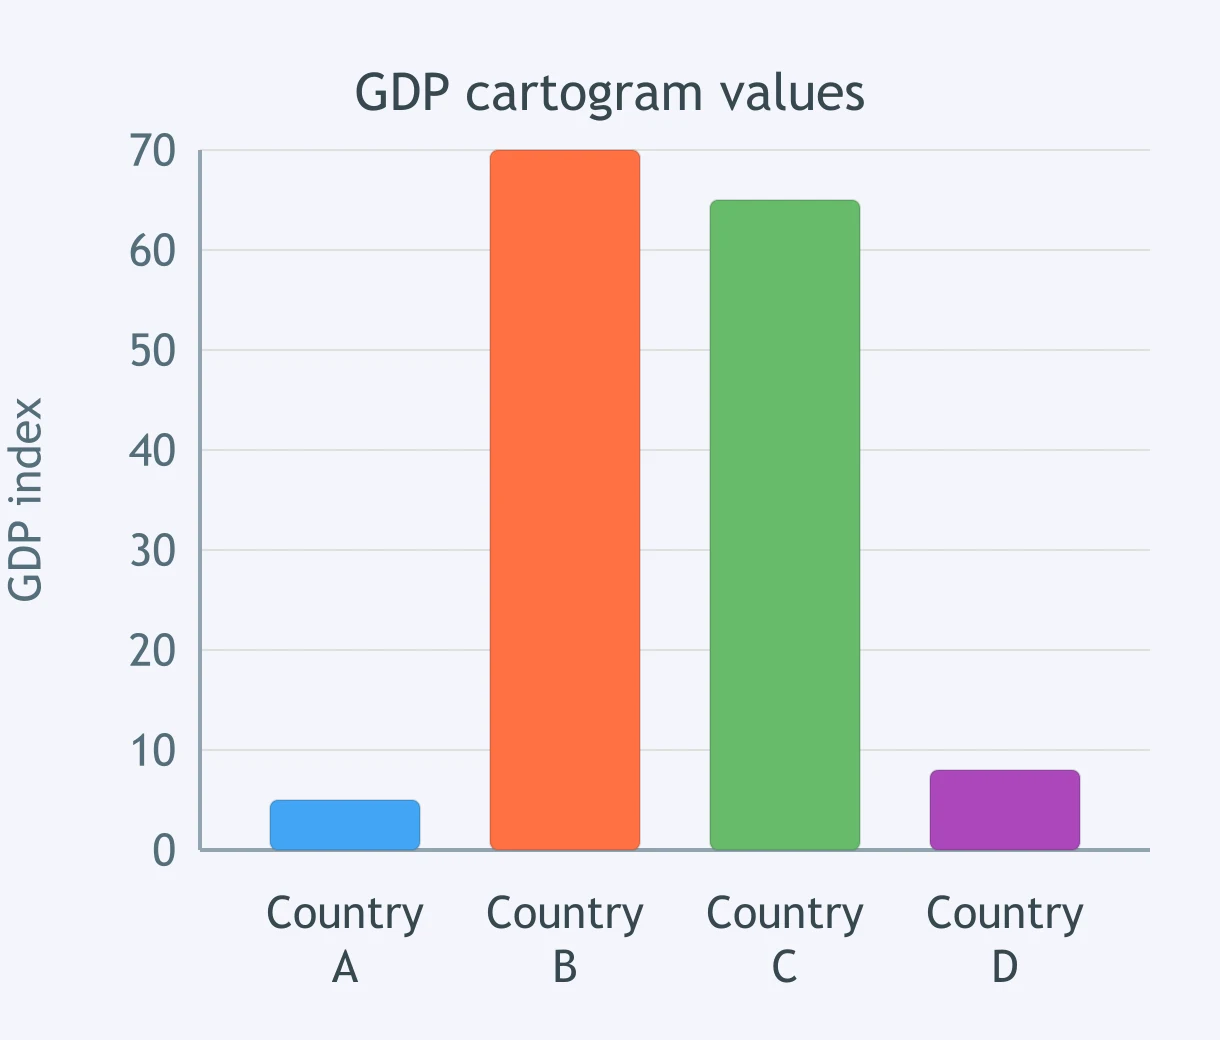
A GDP cartogram will enlarge places with higher values on the graph. Which two places would be enlarged most?
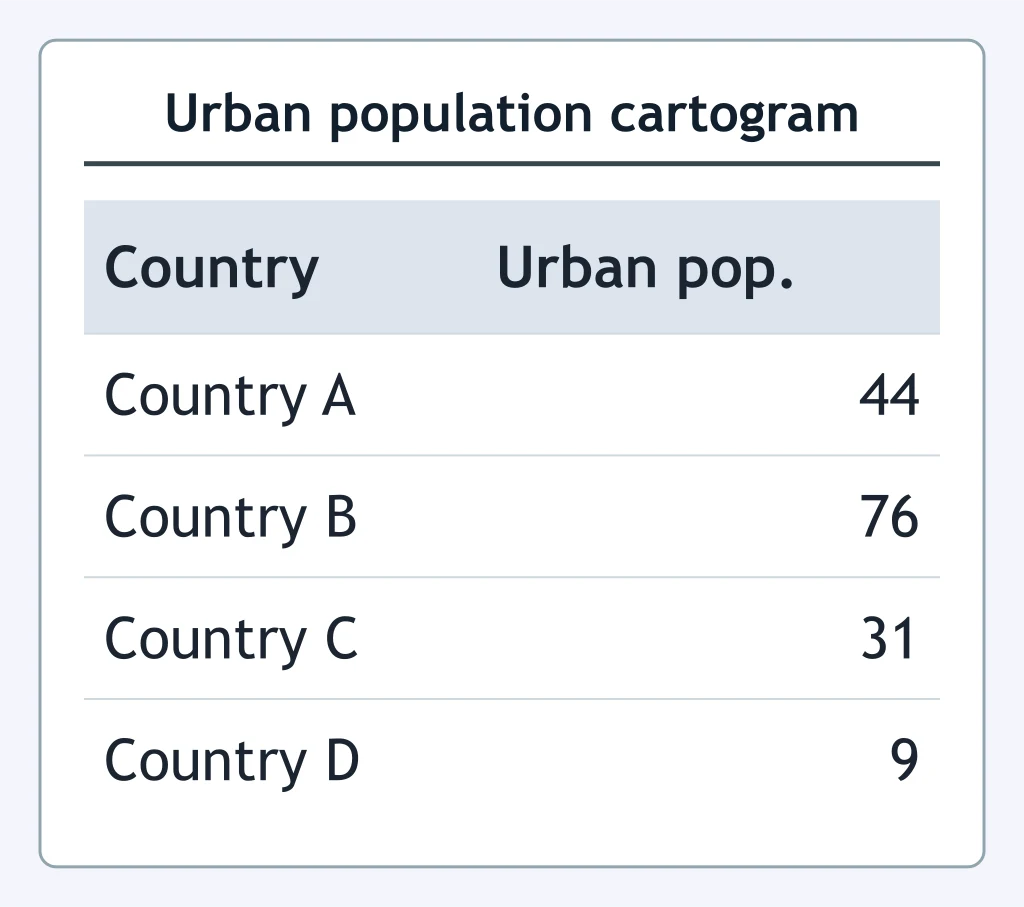
A cartogram uses the table's urban population values to set area. Which country would be smallest?
Crack the passcode before the zombies get in.
Answer, then swat bugs for bonus points.
Race through questions at your own speed.
Same question on every screen. Fastest wins.

Pick a tile, answer, hit bonuses and steals.
Continents, Oceans and the World Political Map
40 questions