Loading
by BlastRoom
Describing the direction, form and strength of an association and spotting a point away from the pattern.
#algebra_i

20 questions
One question set, multiple game modes. Tap any game to see it in action. Not sure which to pick?
Answer to place stones and capture territory.
Outrun the snow together.
Earn blasts, then hunt the other team.
Answer to earn energy, then climb.

The class blasts through walls together.
Bid on mystery lots. Most money wins.
Sell tours. Nice, standard, or a total scam.

Answer, restock, and serve the rush.
More correct answers pulls the rope your way.
Answer, then shoot down the alien wave.
Answer, then tap to leap the frozen ridge.
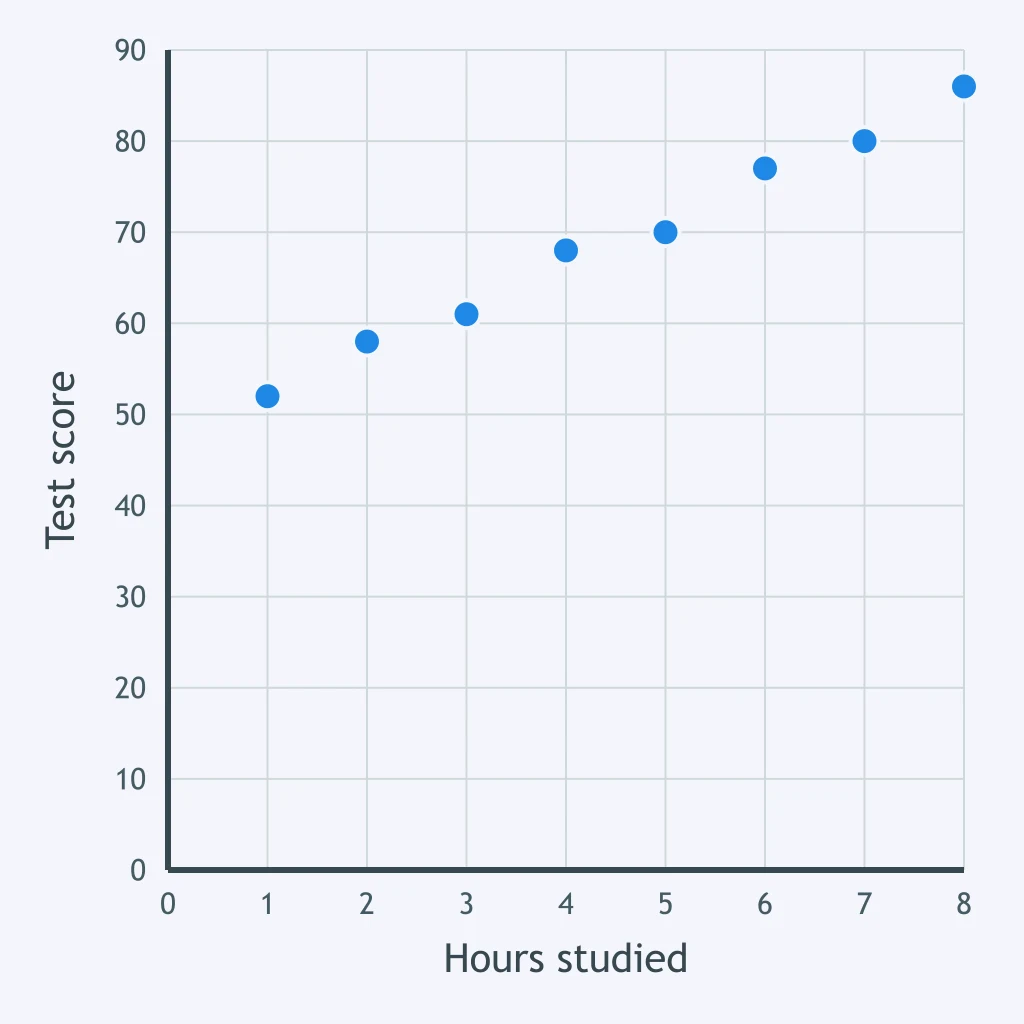
The scatter plot pairs the hours eight students studied with the score each earned. Which statement describes the association shown?
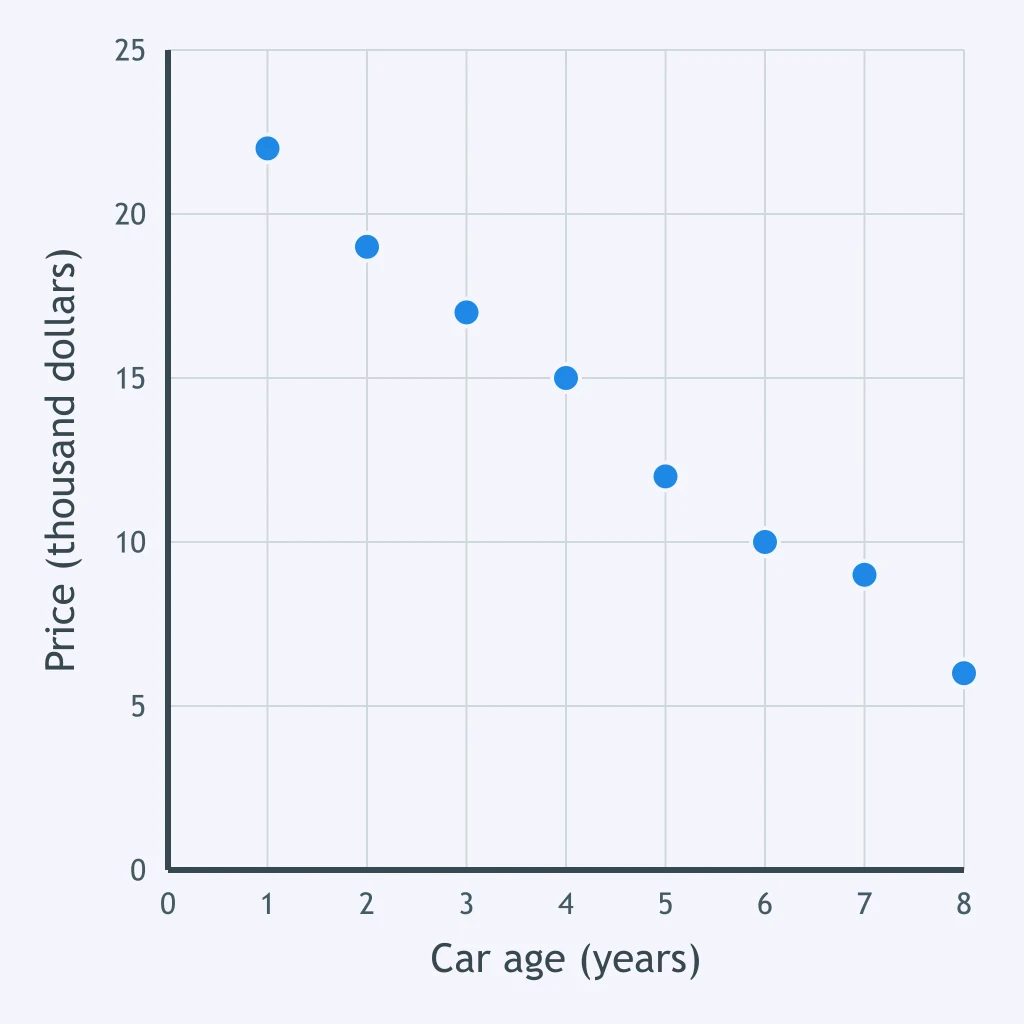
Use the scatter plot of car age and resale price. As a car gets older, what does the plot show about its price?
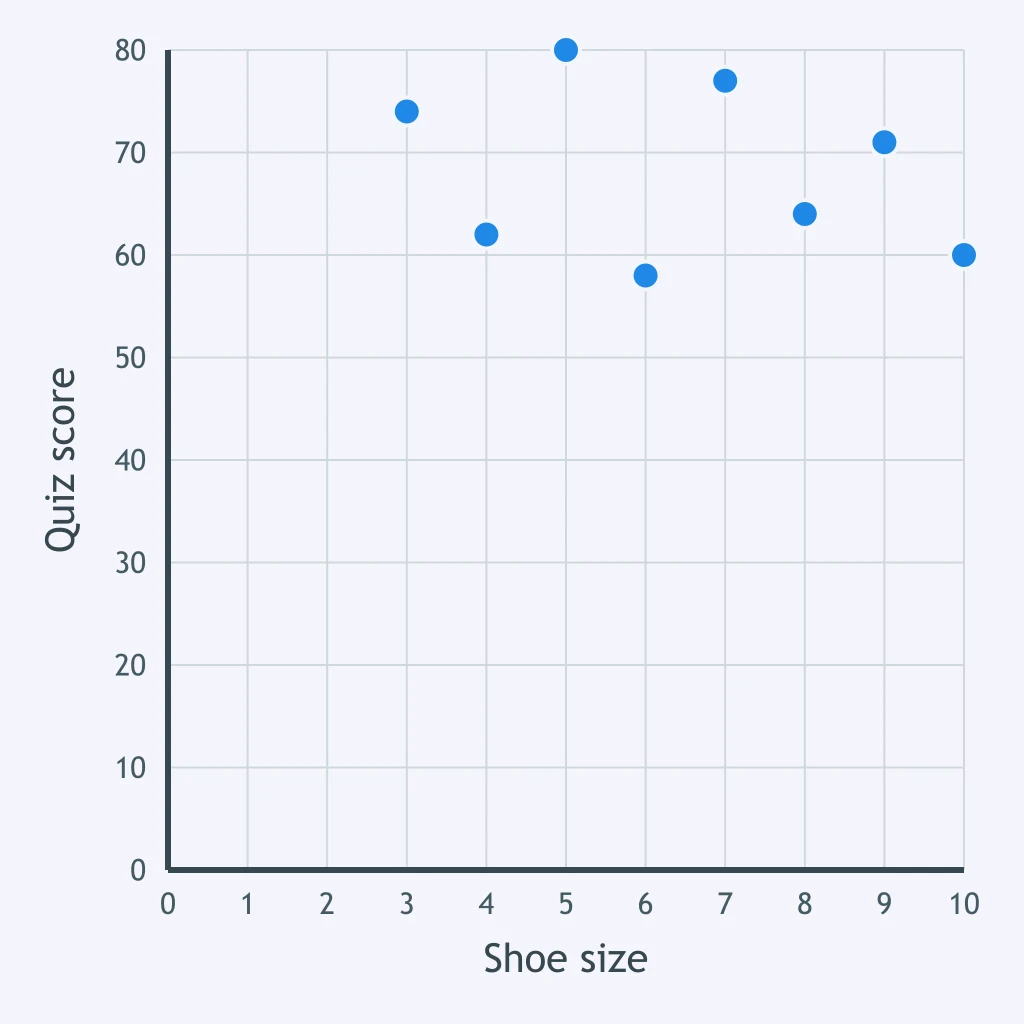
The plot pairs each student's shoe size with a quiz score. What direction does the association have?
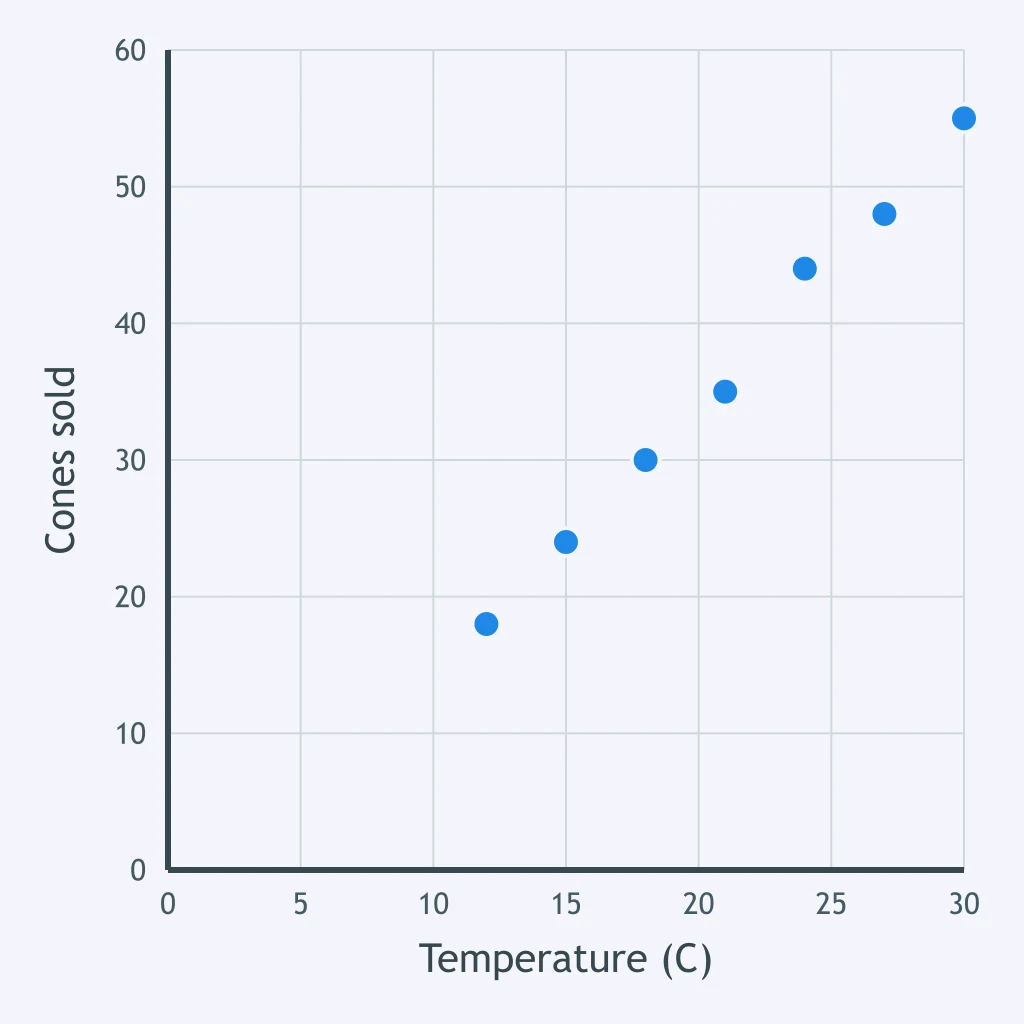
A student wrote that this plot of daily temperature and cones sold shows a negative association. Which statement corrects that?
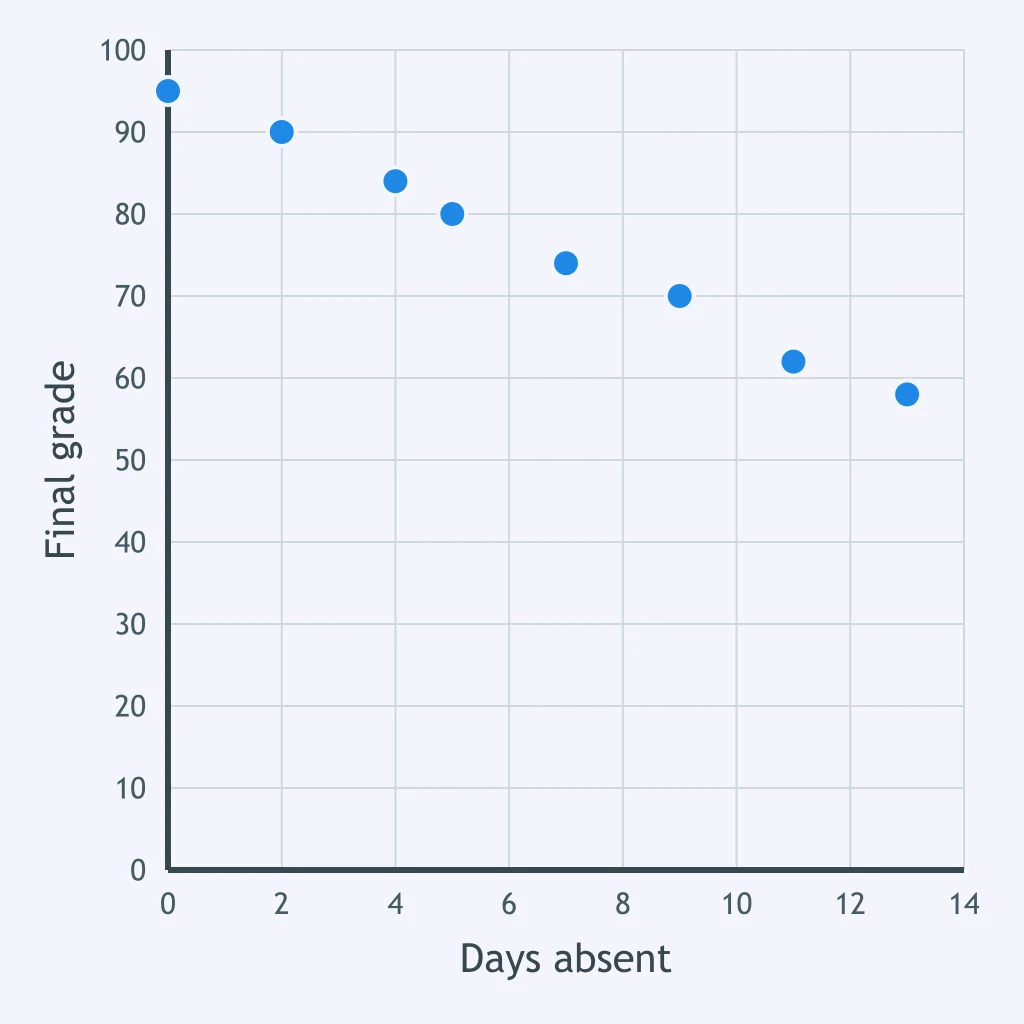
Use the plot of days absent and final grade. A new student has more absences than anyone plotted. What does the trend predict for that student's grade?
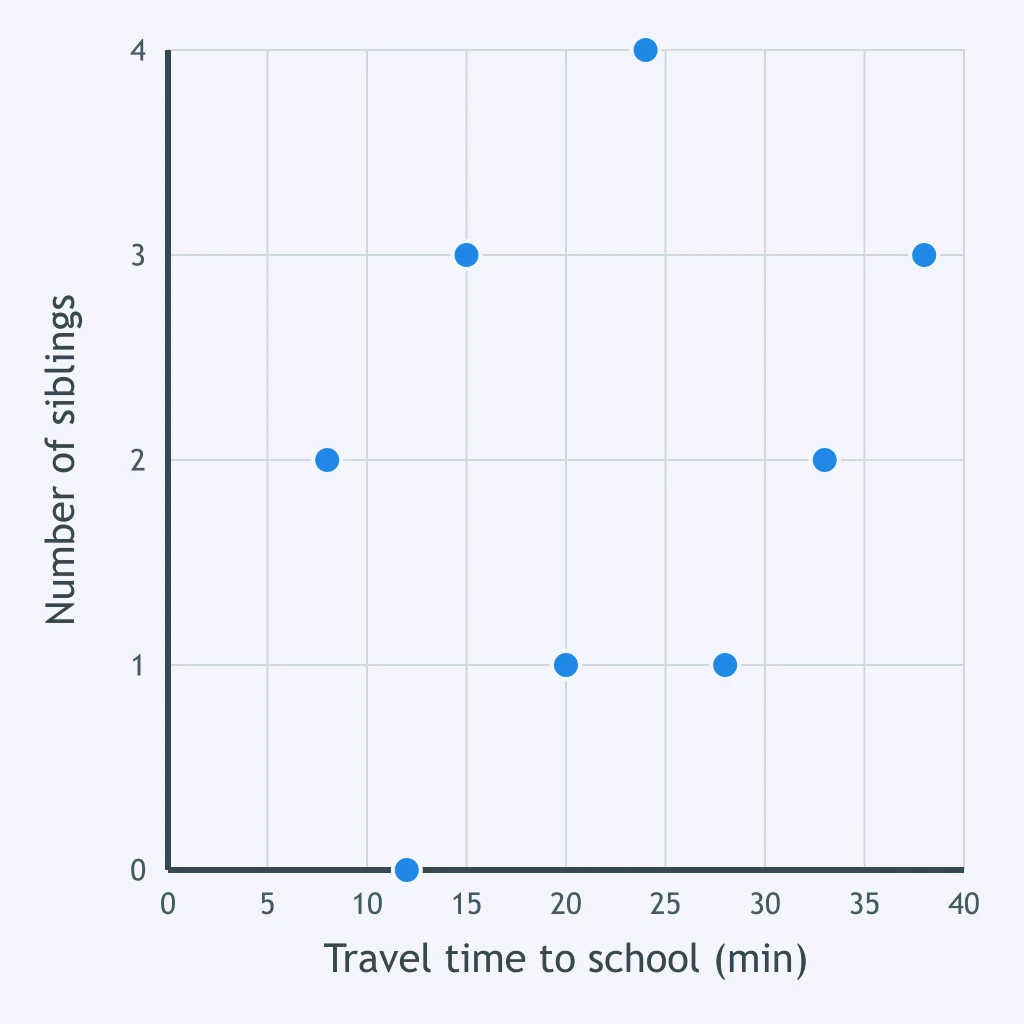
Look at the plot pairing each student's travel time to school in minutes with the number of siblings they have. Which description fits the pattern of the points?
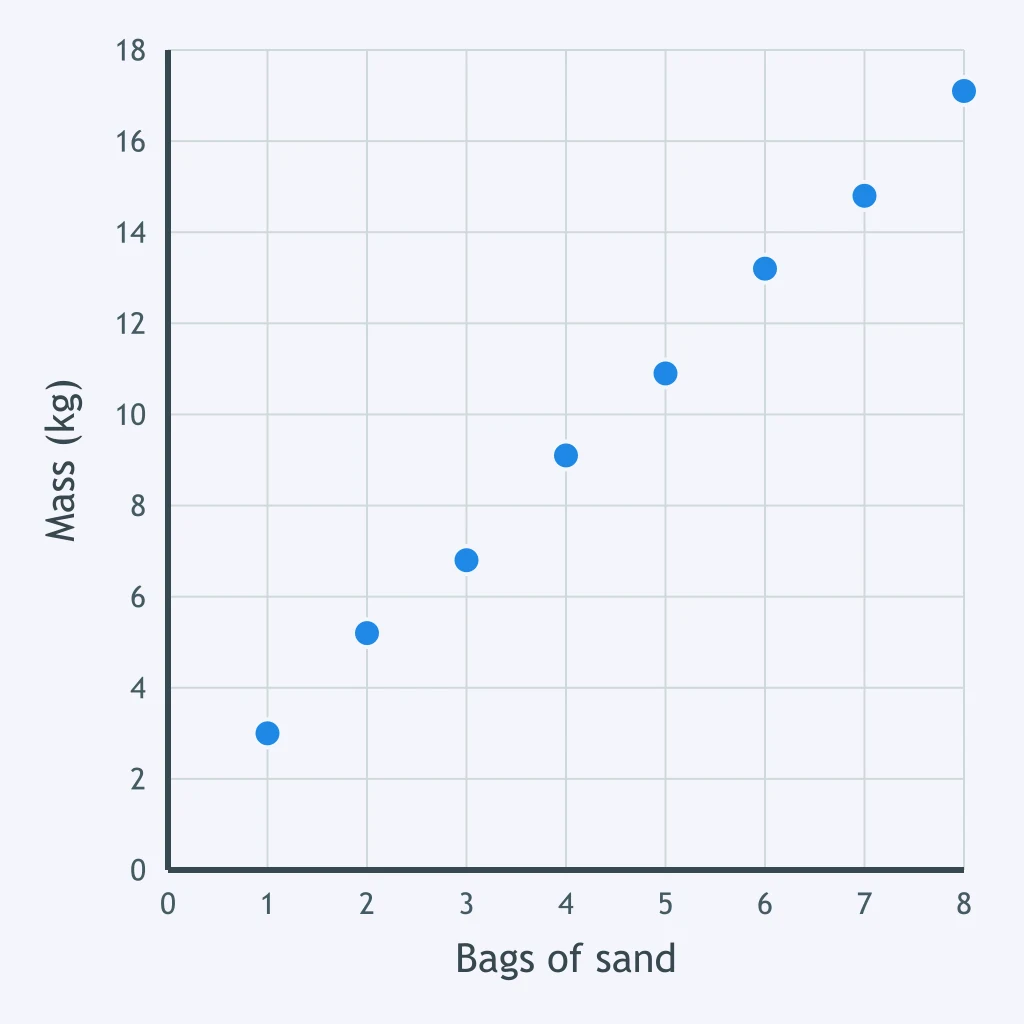
The plot pairs the number of sand bags loaded onto a cart with the cart's total mass in kilograms. How strong is the linear association?
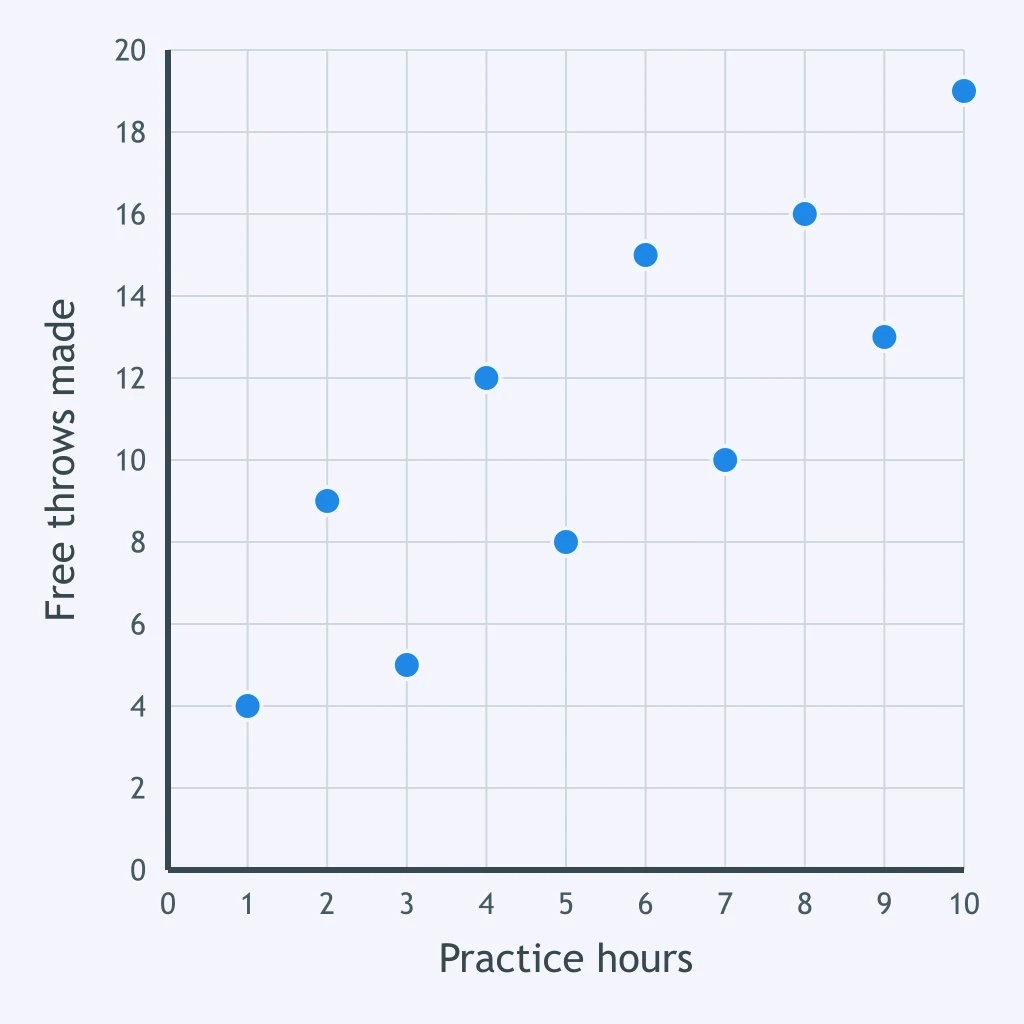
This plot pairs a player's weekly practice hours with the free throws they made out of twenty. Describe the strength and direction of the linear association.
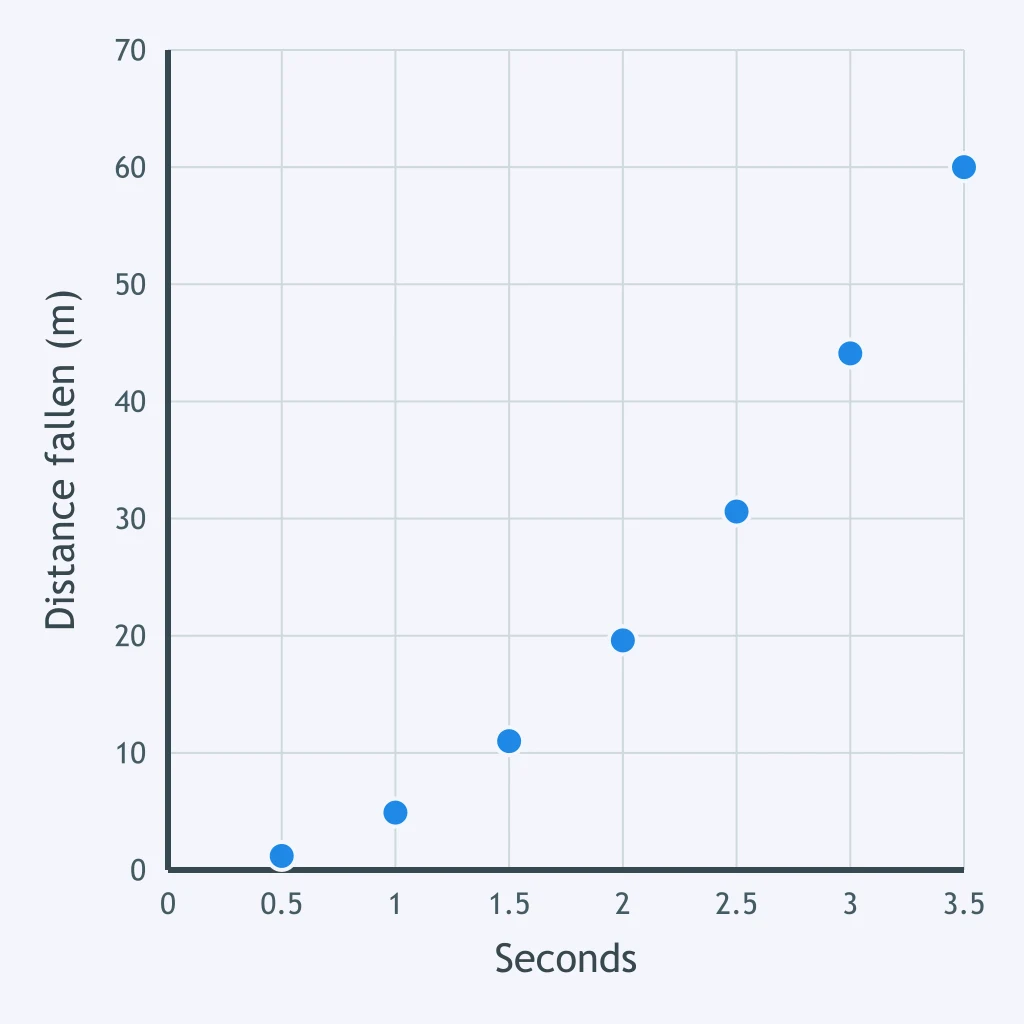
This plot pairs the seconds since a ball was dropped with the distance it has fallen in meters. Would a straight line of best fit model this data well?
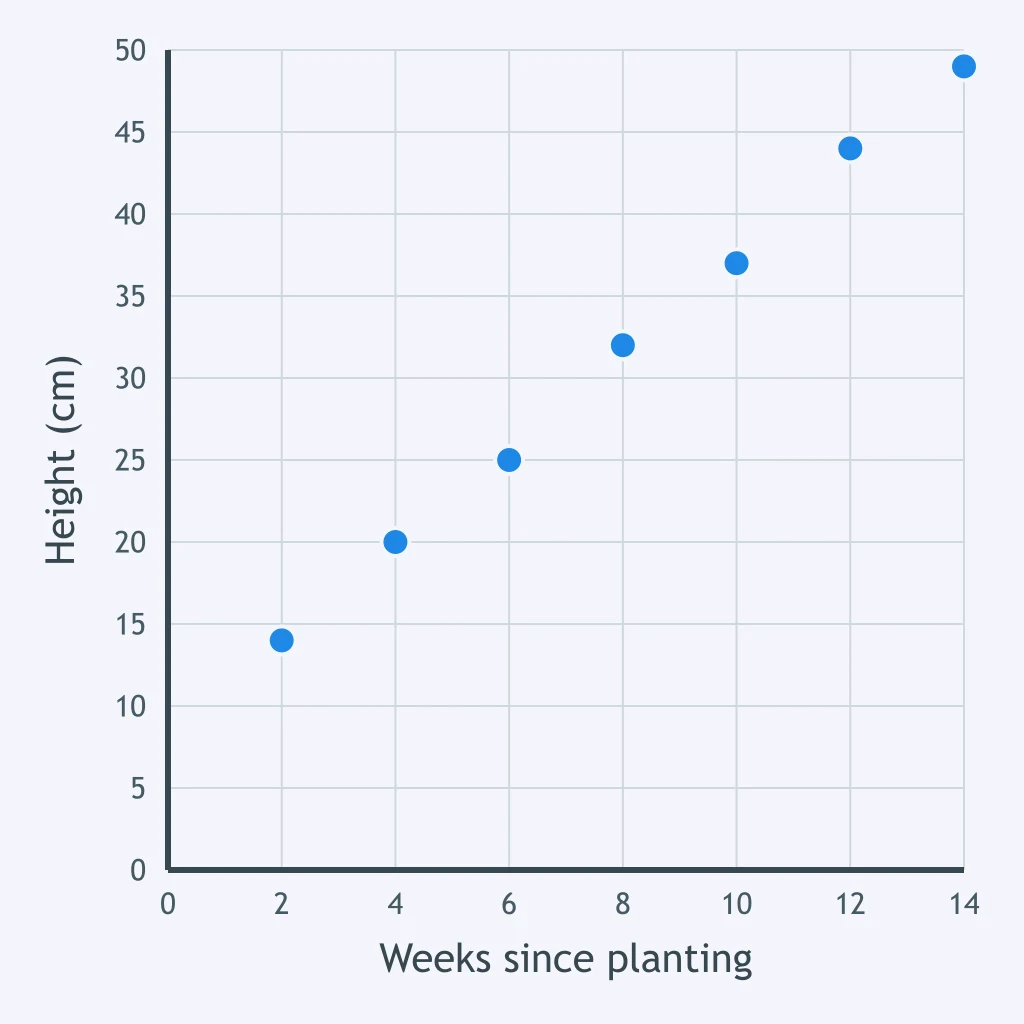
A gardener wants one straight line to summarize this plot of weeks since planting and seedling height. Does the shape of the point cloud support that choice?
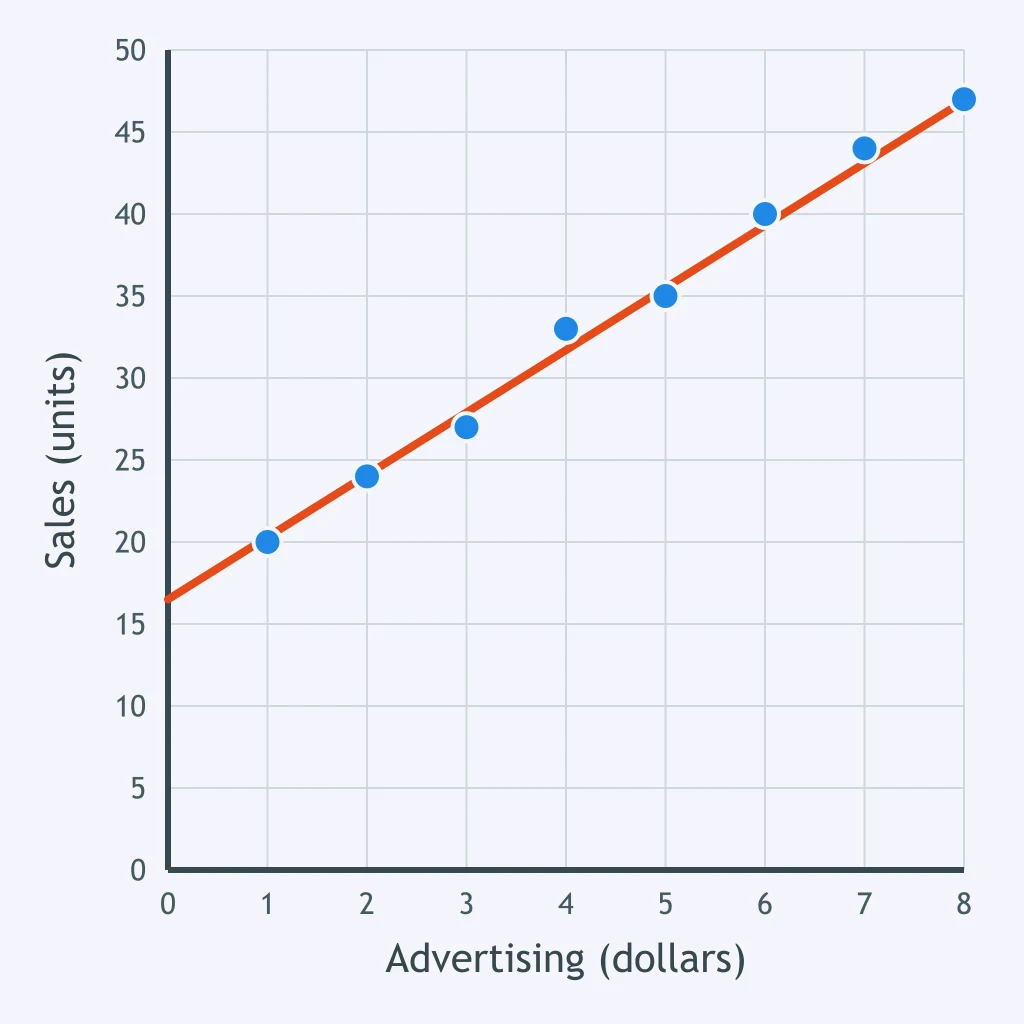
A line of best fit is drawn on this plot of weekly advertising spending in dollars and sales. How well does that line fit the data?
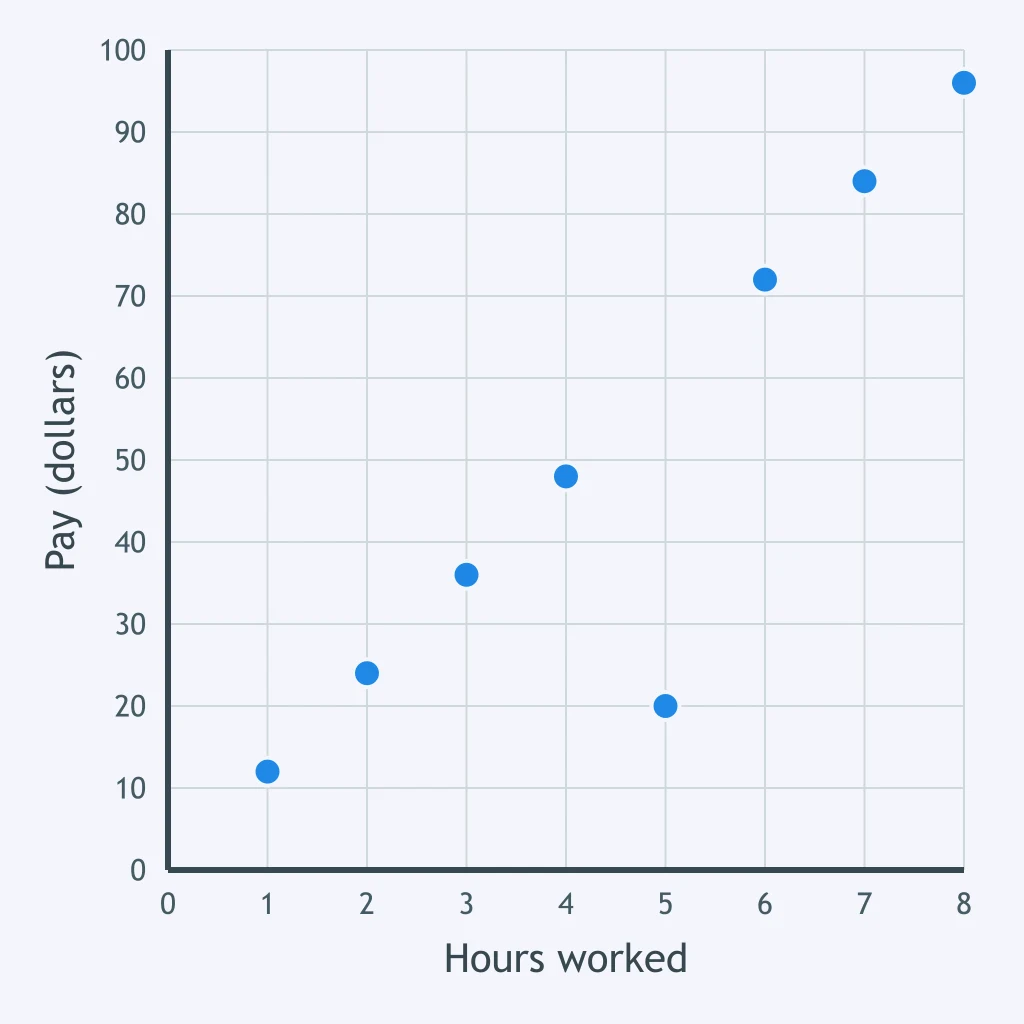
One point in this plot of hours worked and pay in dollars sits away from the pattern the others make. Which point is it?
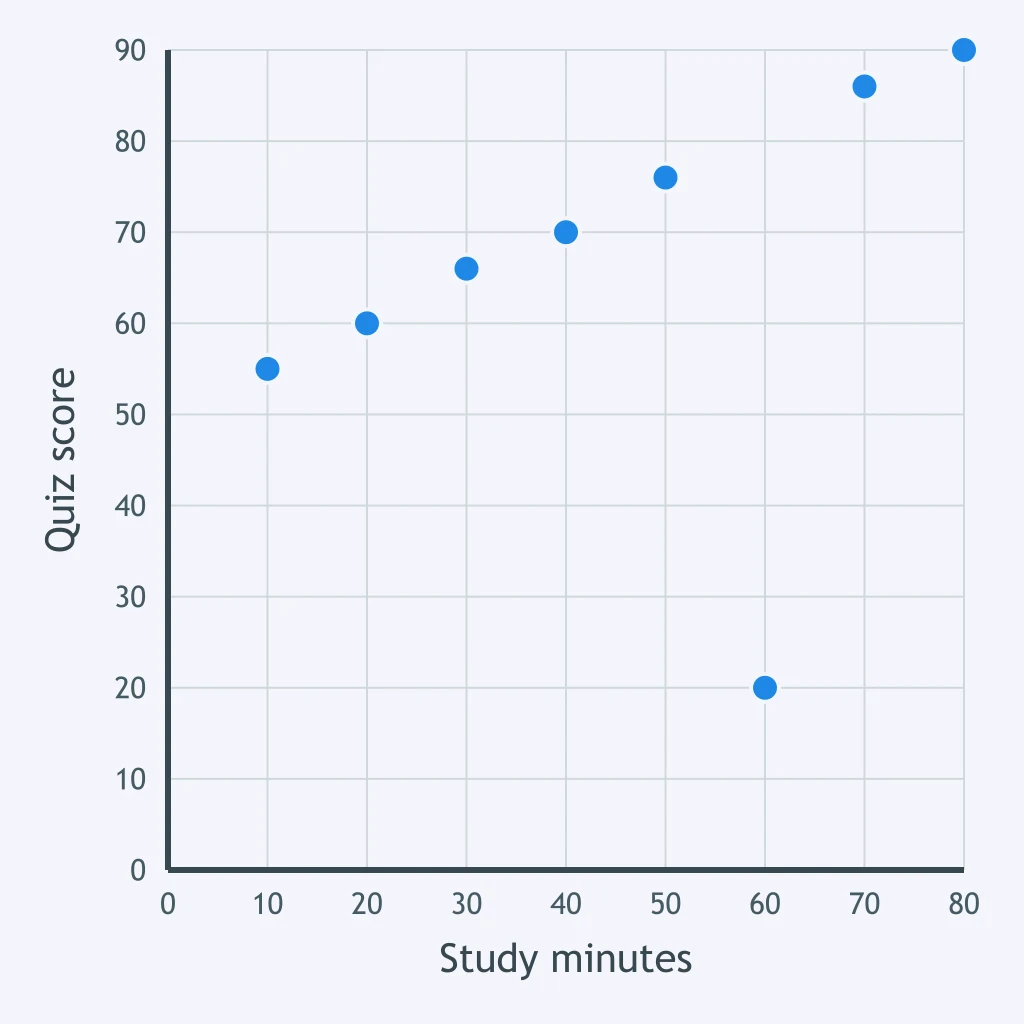
A teacher plotted study minutes against quiz score for eight students. Which plotted point does not follow the trend the rest of the points make?
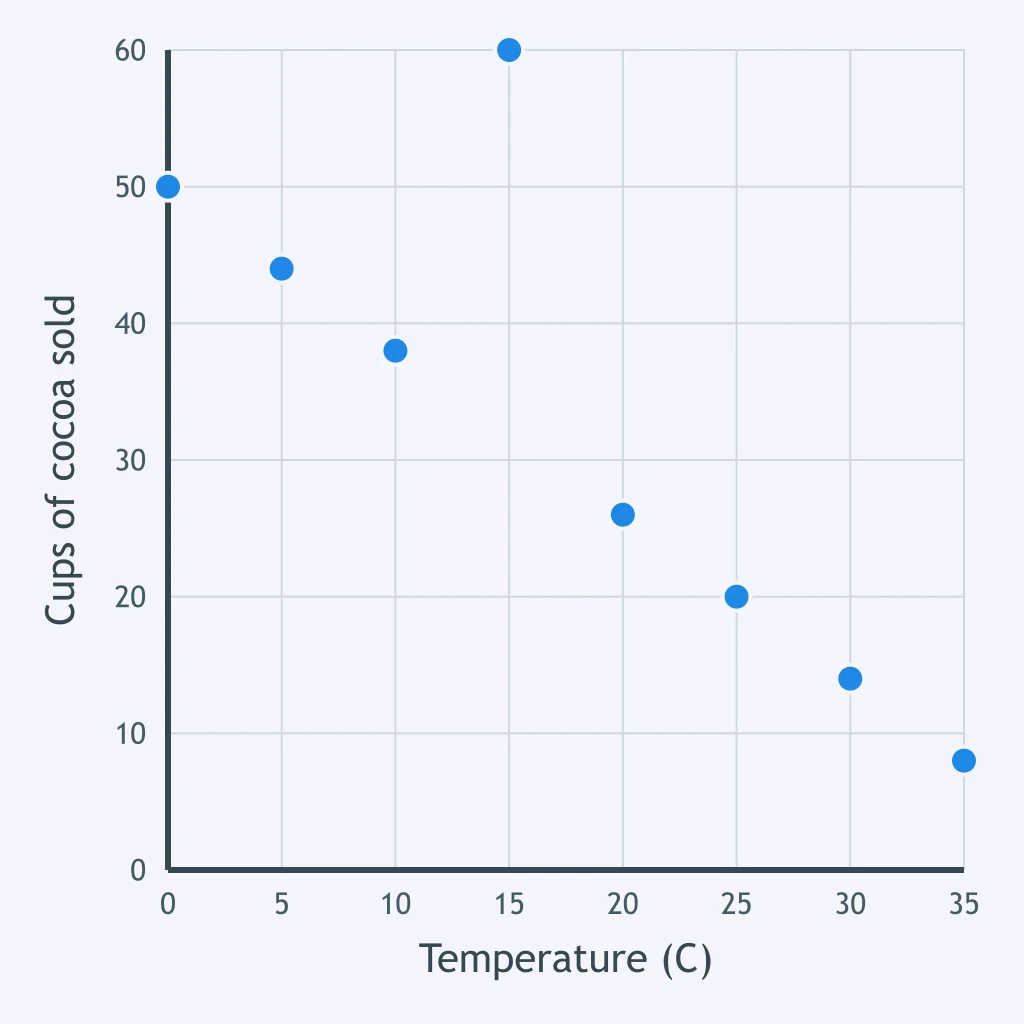
This plot pairs the daily temperature in degrees Celsius with cups of cocoa sold. Name the point that lies away from the straight path the other points follow.
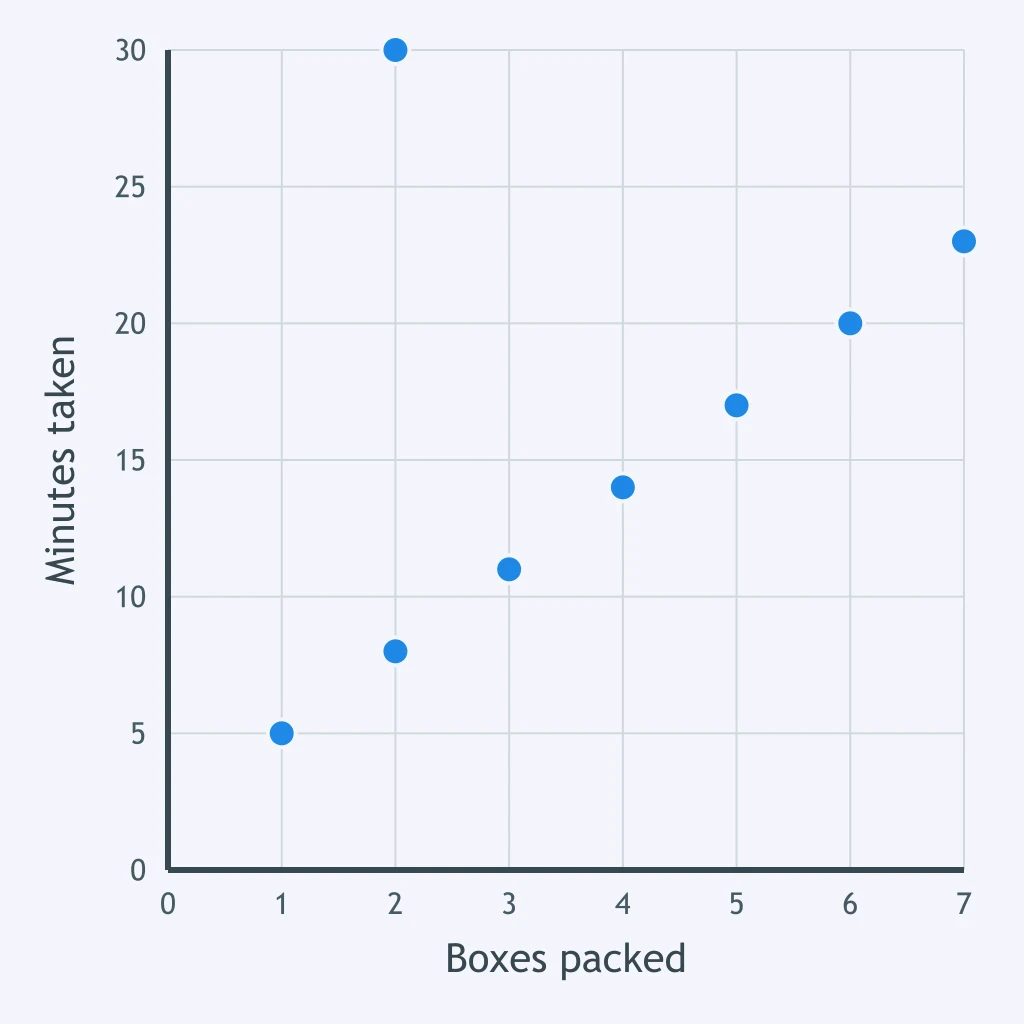
A student says every point in this plot of boxes packed and minutes taken fits one straight path. Which point shows the student is wrong?
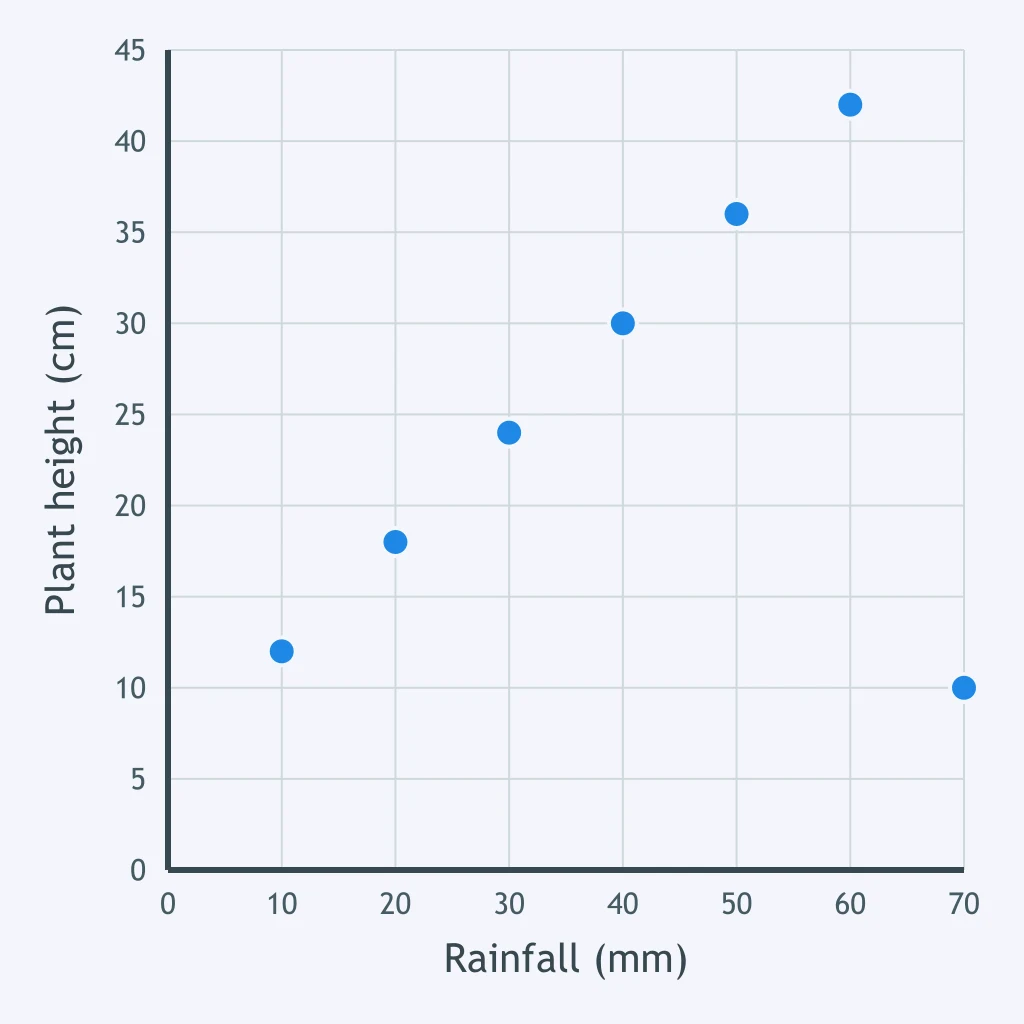
Seven plots of land are graphed by rainfall in millimeters and plant height in centimeters. Which point breaks the pattern the other six make?
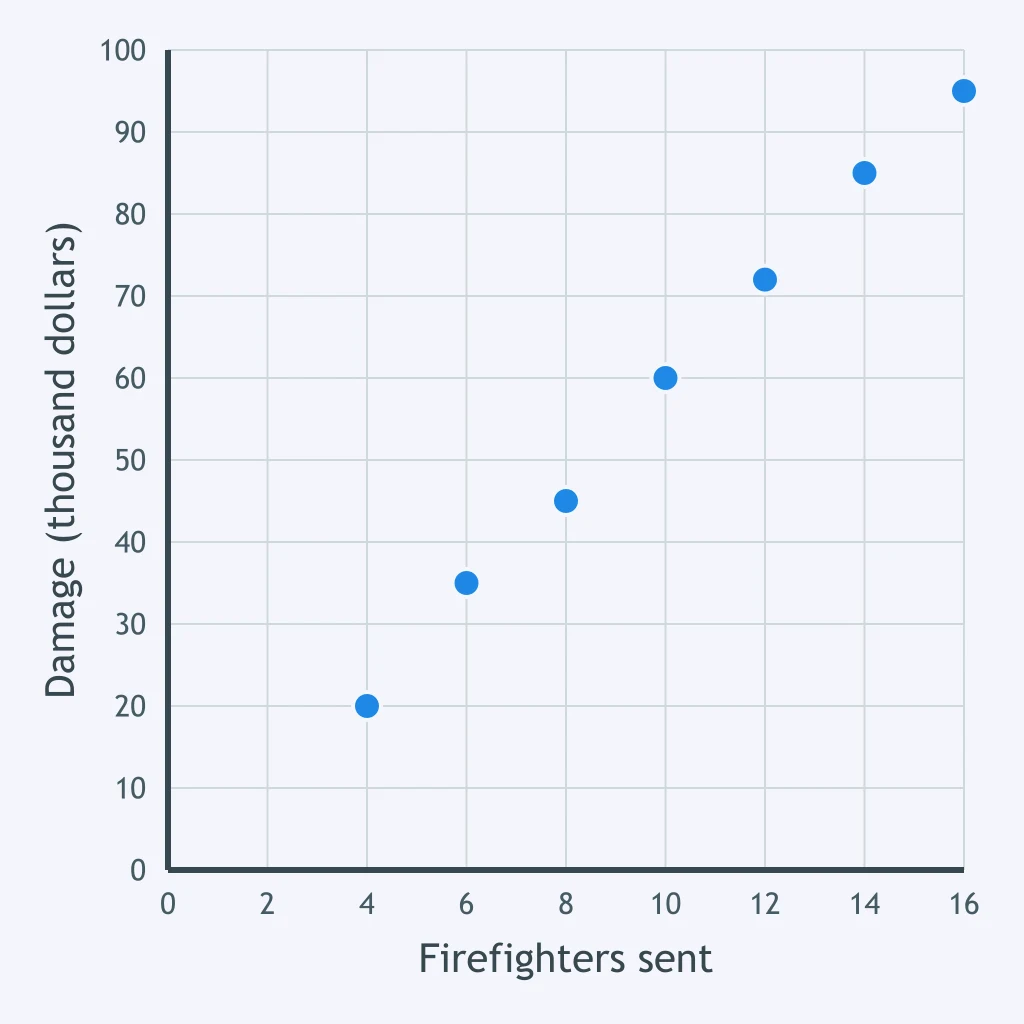
This plot pairs the number of firefighters sent to a fire with the damage in thousands of dollars, and the association is strongly positive. What can be concluded?
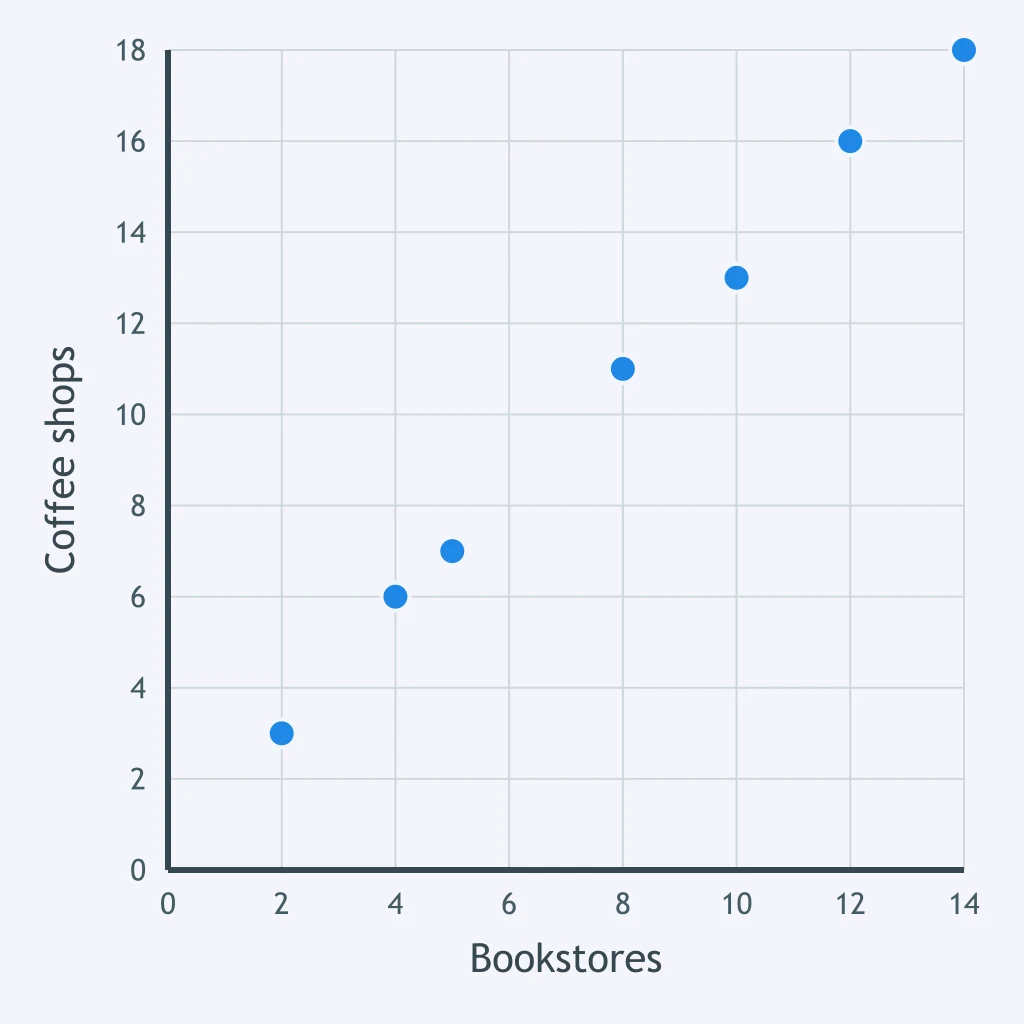
The plot pairs the number of bookstores with the number of coffee shops in several towns. The upward trend alone does not show that opening bookstores causes coffee shops to open.
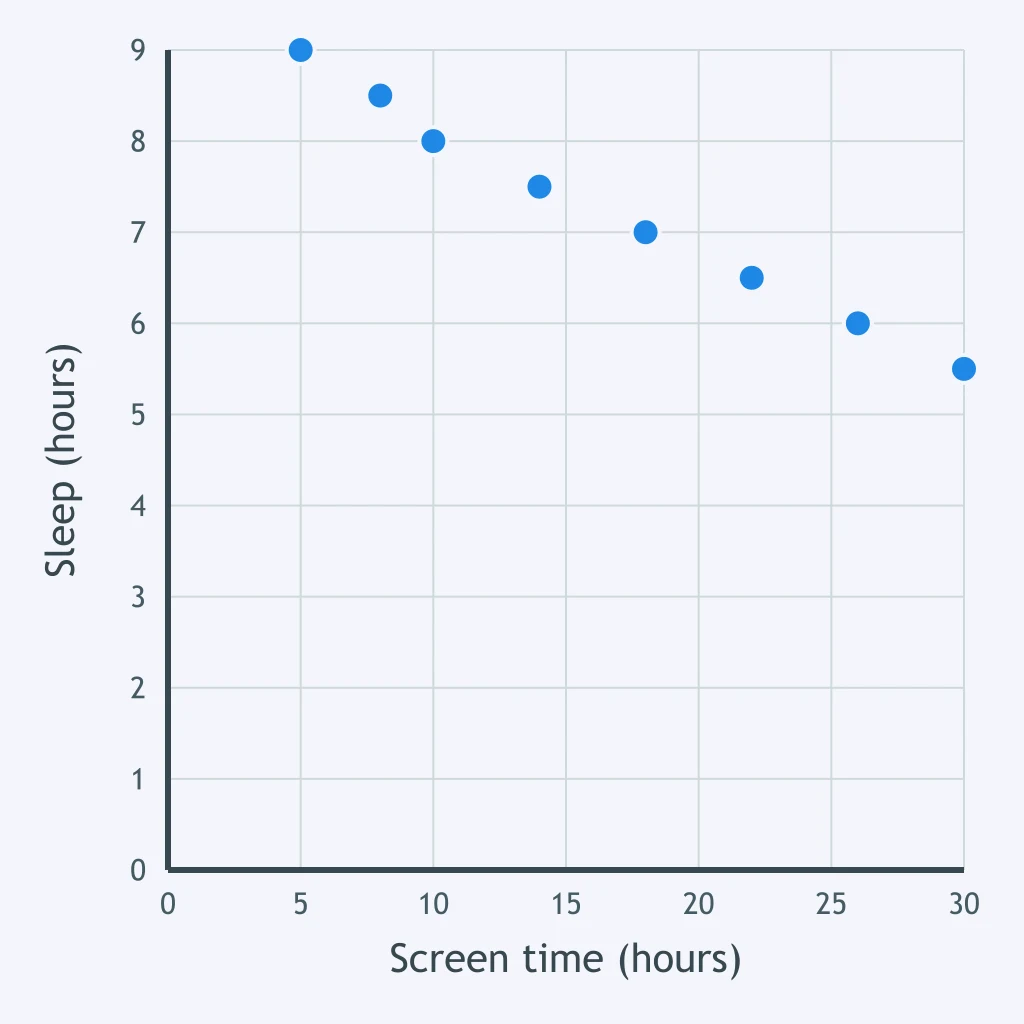
The plot pairs each student's weekly screen-time hours with their nightly sleep hours. The downward trend proves that screen time causes students to sleep less.
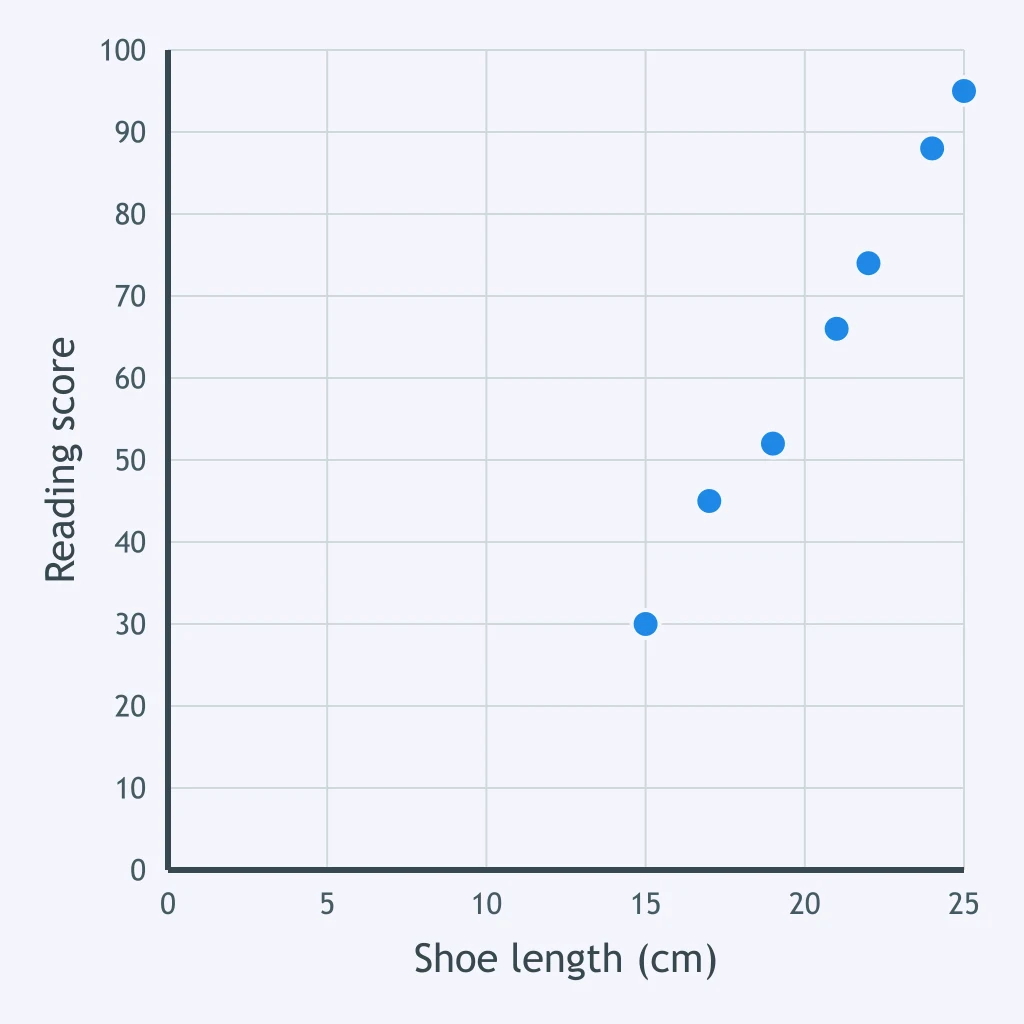
This plot pairs children's shoe length in centimeters with their reading test scores and trends upward. Why does the trend fail to show that longer feet cause better reading?
Crack the passcode before the zombies get in.
Answer, then swat bugs for bonus points.
Race through questions at your own speed.
Same question on every screen. Fastest wins.

Pick a tile, answer, hit bonuses and steals.
Two-Way Frequency Tables
20 questions