Loading
by BlastRoom
Reading a five-number summary off a box plot and testing a value against the outlier rule.
#algebra_i
20 questions
One question set, multiple game modes. Tap any game to see it in action. Not sure which to pick?
Answer to place stones and capture territory.
Outrun the snow together.
Earn blasts, then hunt the other team.
Answer to earn energy, then climb.

The class blasts through walls together.
Bid on mystery lots. Most money wins.
Sell tours. Nice, standard, or a total scam.

Answer, restock, and serve the rush.
More correct answers pulls the rope your way.
Answer, then shoot down the alien wave.
Answer, then tap to leap the frozen ridge.
The box plot shows the mass of each parcel for one delivery round, with one reading drawn as a dot beyond the right whisker at 37 kilograms. Under the 1.5 x IQR rule, is that reading an outlier?
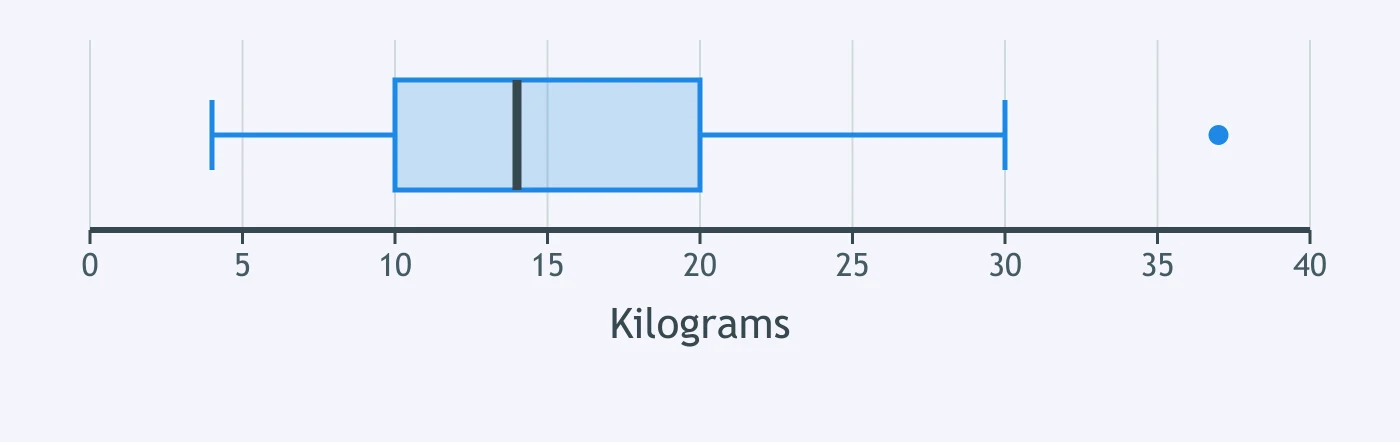
The box plot shows the mass of each parcel for one delivery round. What is the median?
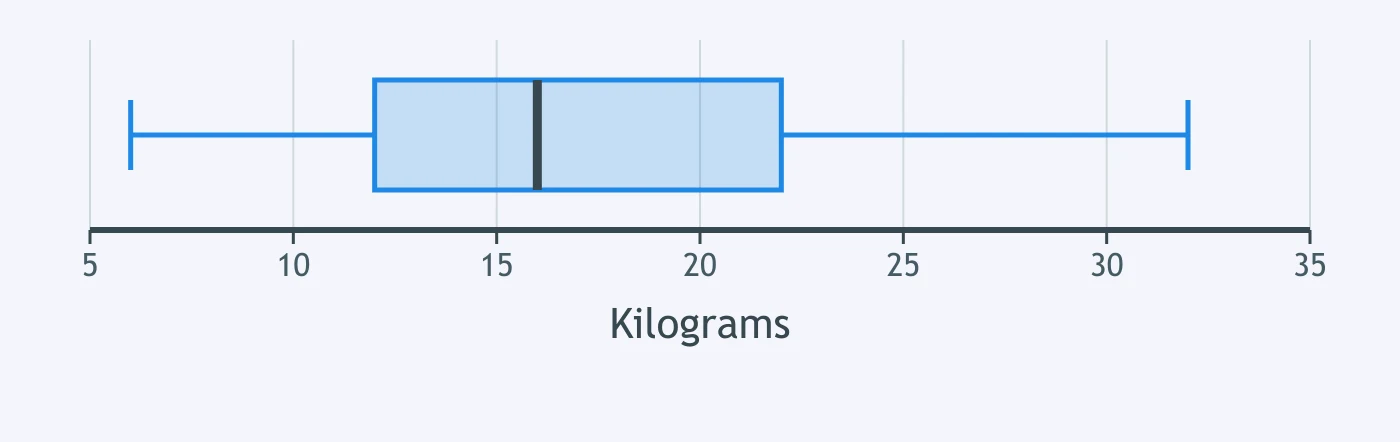
The box plot shows the score each student earned for one class. What is the third quartile?
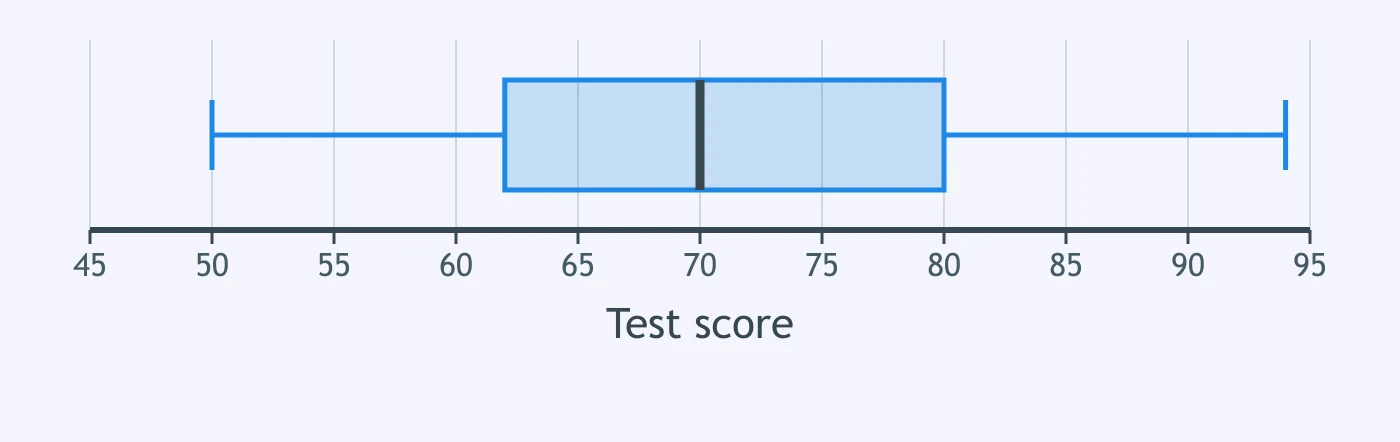
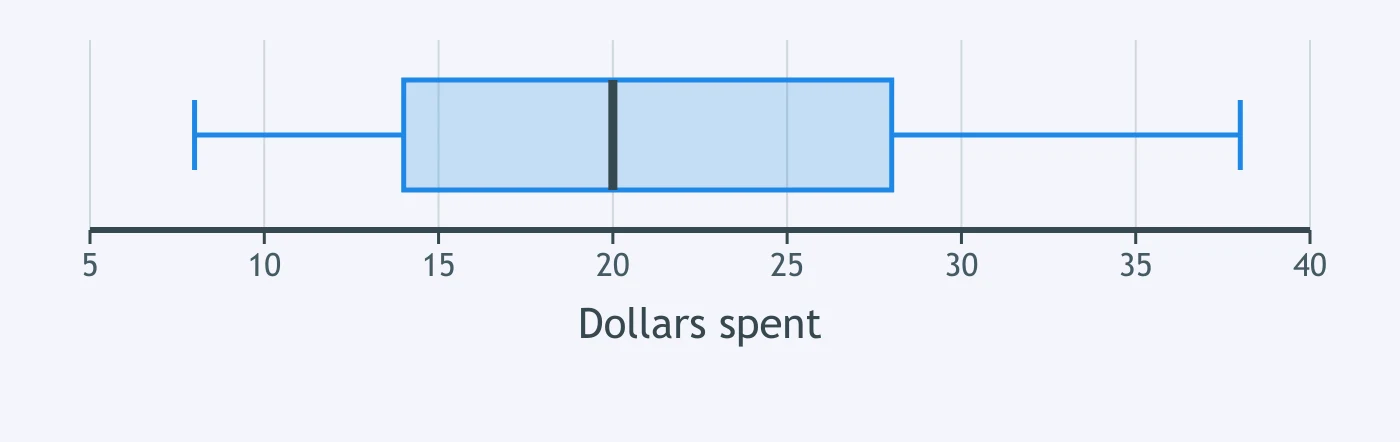
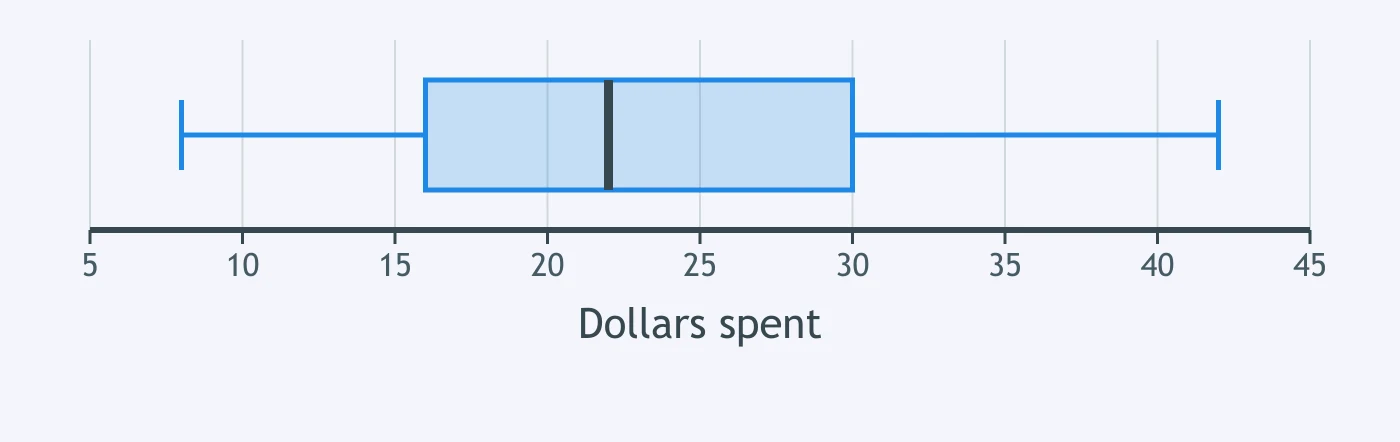
The box plot shows the amount each customer spent for one morning at a shop. What is the smallest value?
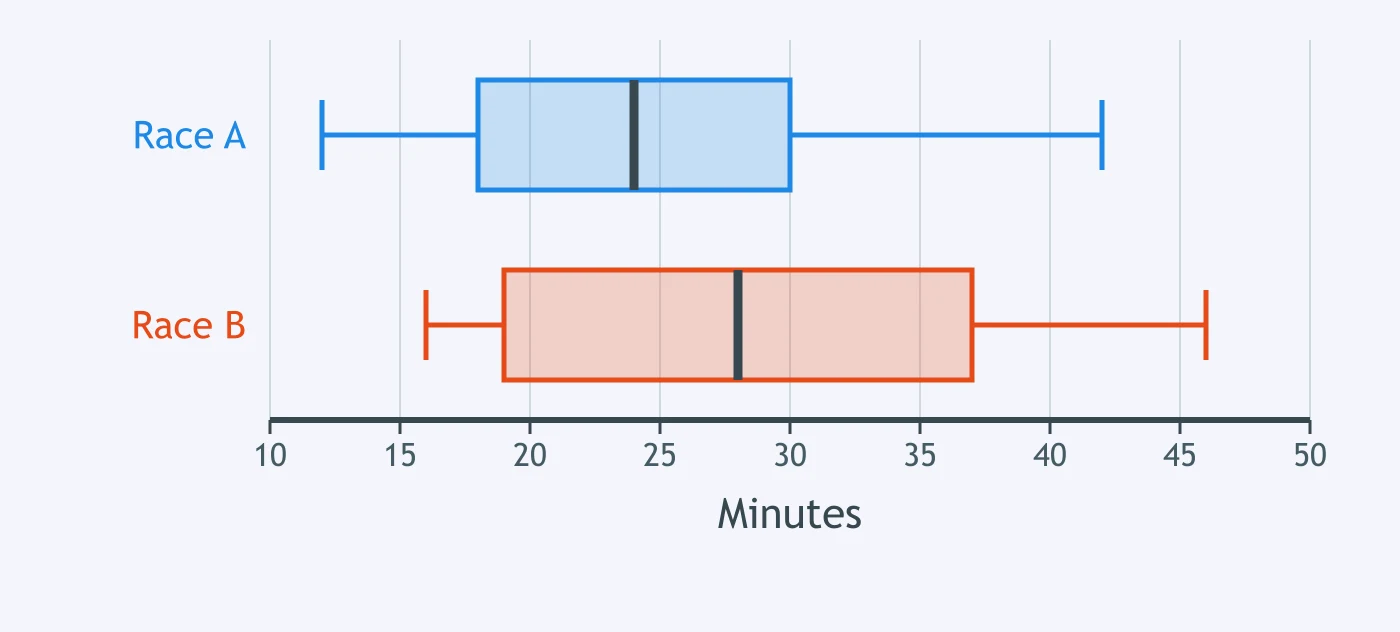
The figure stacks a box plot of the minutes each runner took for Race A above one for Race B. How much greater is the median of Race B than the median of Race A?
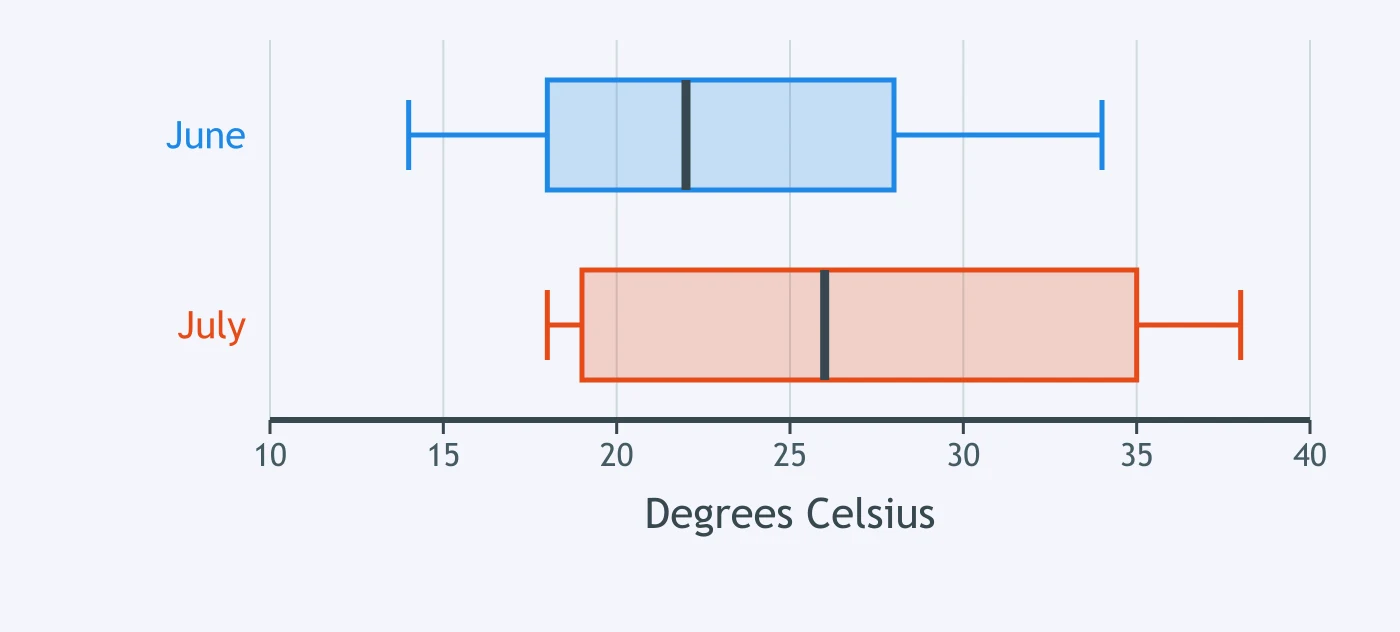
The figure stacks a box plot of the daily high temperature for June above one for July. How much greater is the median of July than the median of June?
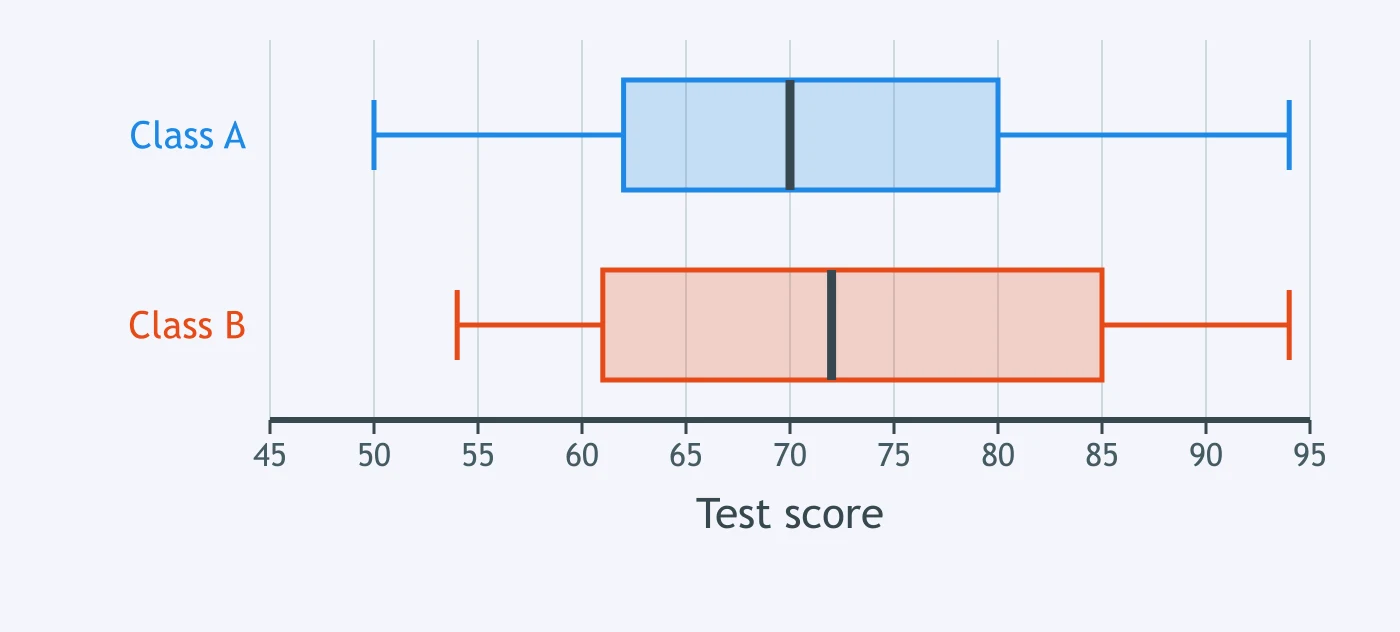
The figure stacks a box plot of the score each student earned for Class A above one for Class B. Which statement about the two is correct?
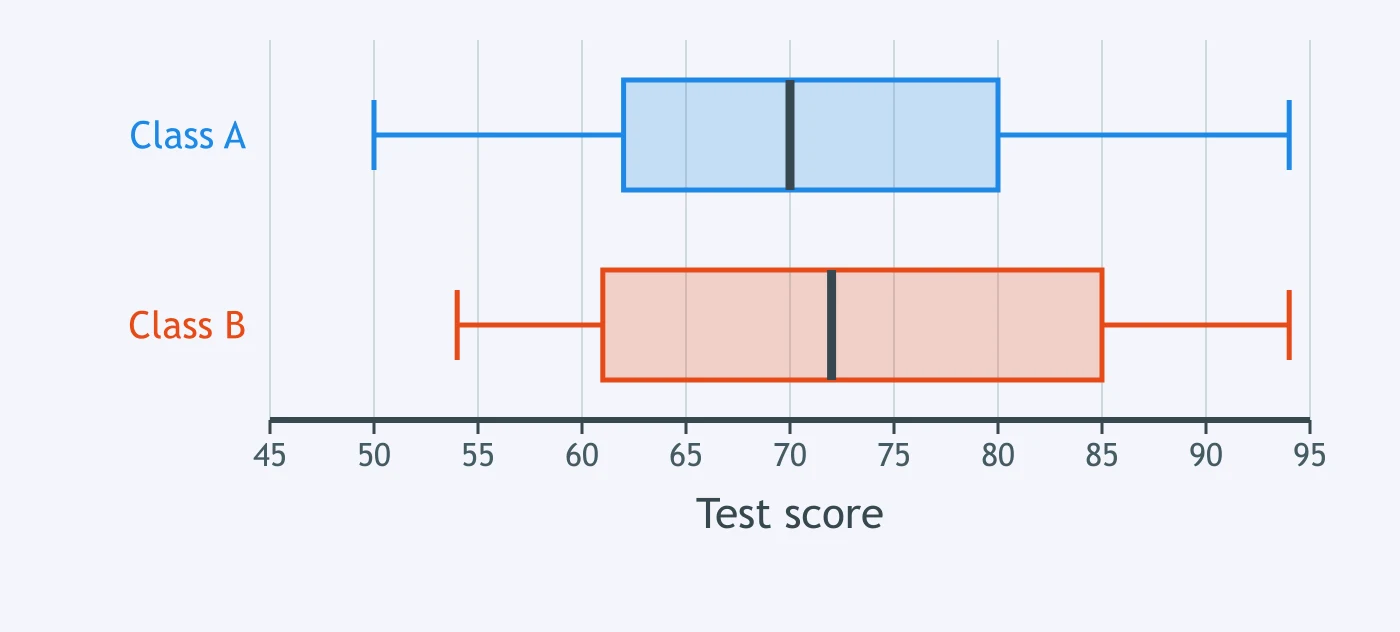
The figure stacks a box plot of the score each student earned for Class A above one for Class B. How much greater is the median of Class B than the median of Class A?
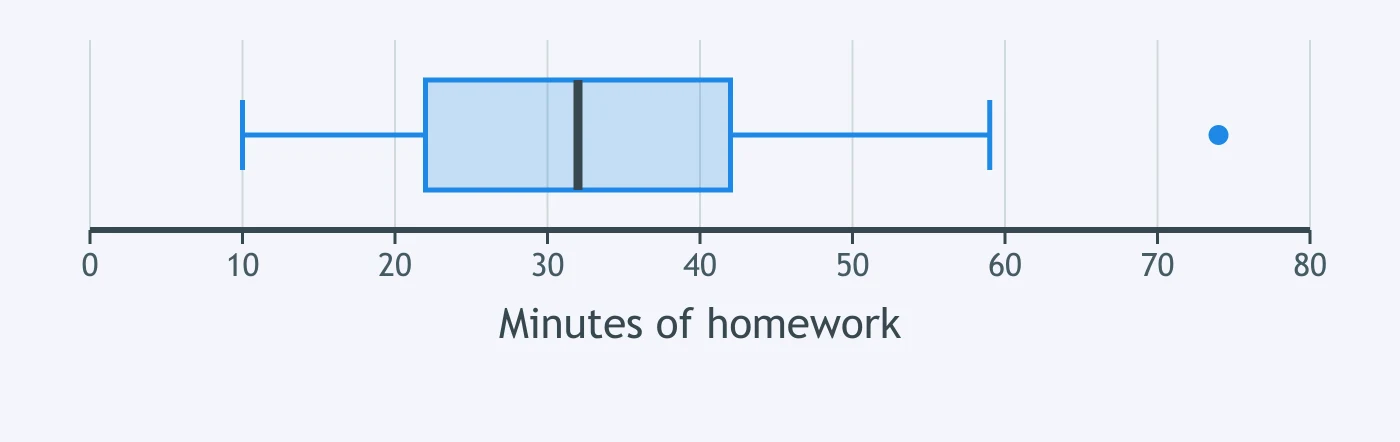
The box plot shows the minutes each student spent on homework for one evening, with one reading drawn as a dot beyond the right whisker at 74 minutes. Under the 1.5 x IQR rule, is that reading an outlier?
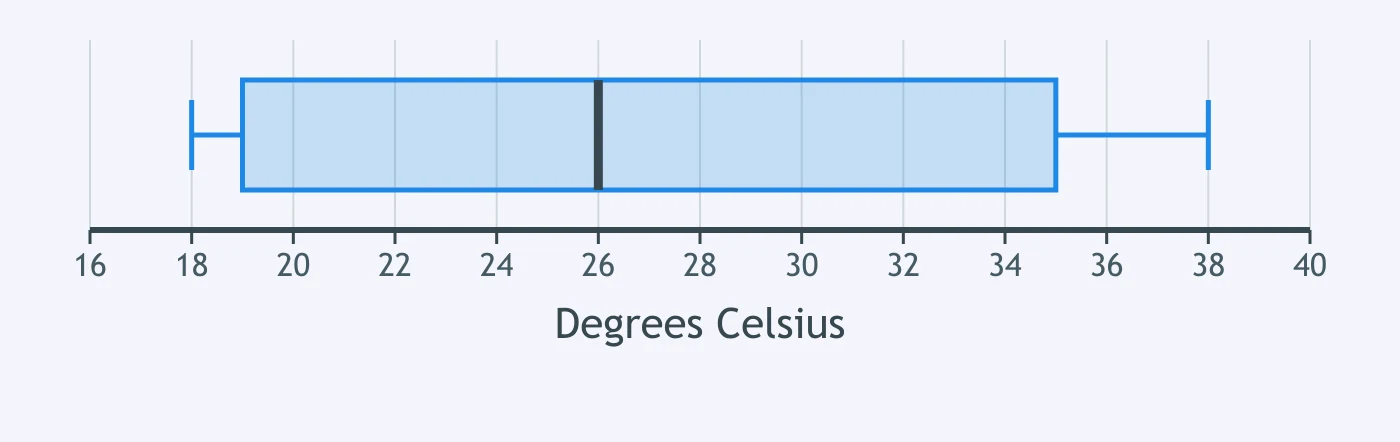
The box plot shows the daily high temperature for a month of readings. The largest quarter of the values lies between the right edge of the box and the end of the right whisker. How wide is that stretch?
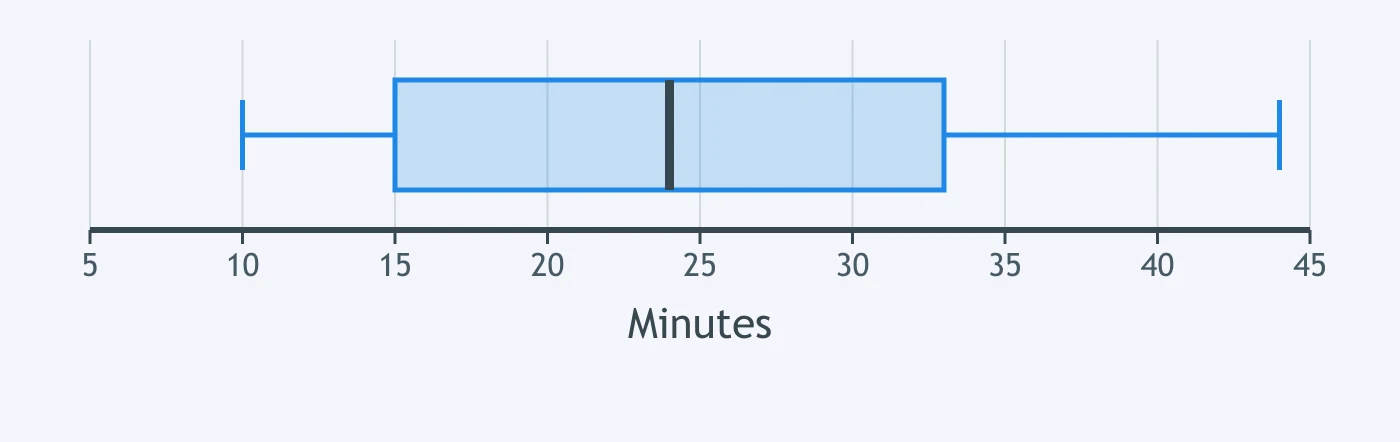
The box plot shows the minutes each runner took for a fun run. What is the interquartile range of the data?
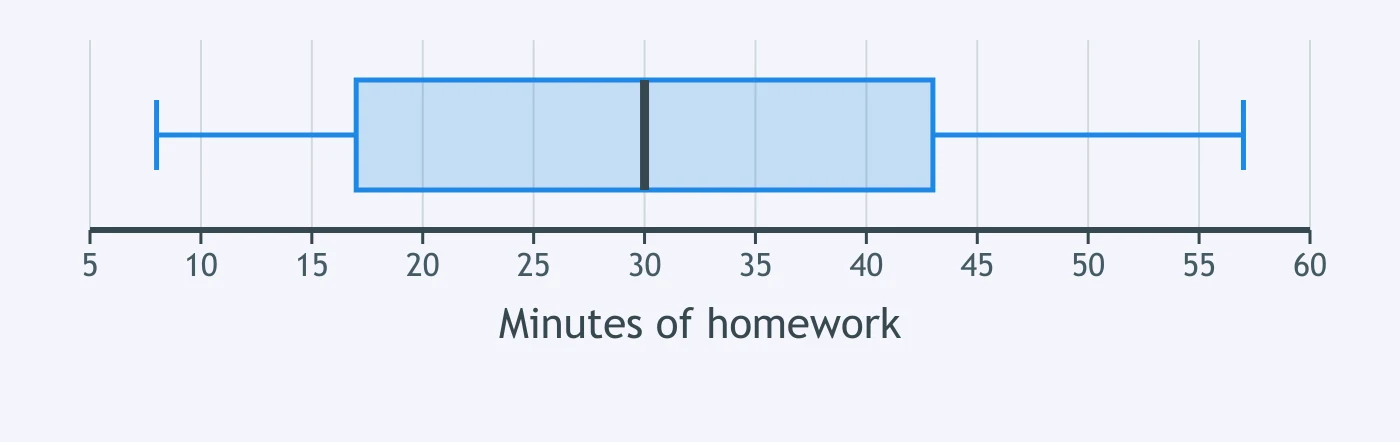
The box plot shows the minutes each student spent on homework for one evening. What is the third quartile?
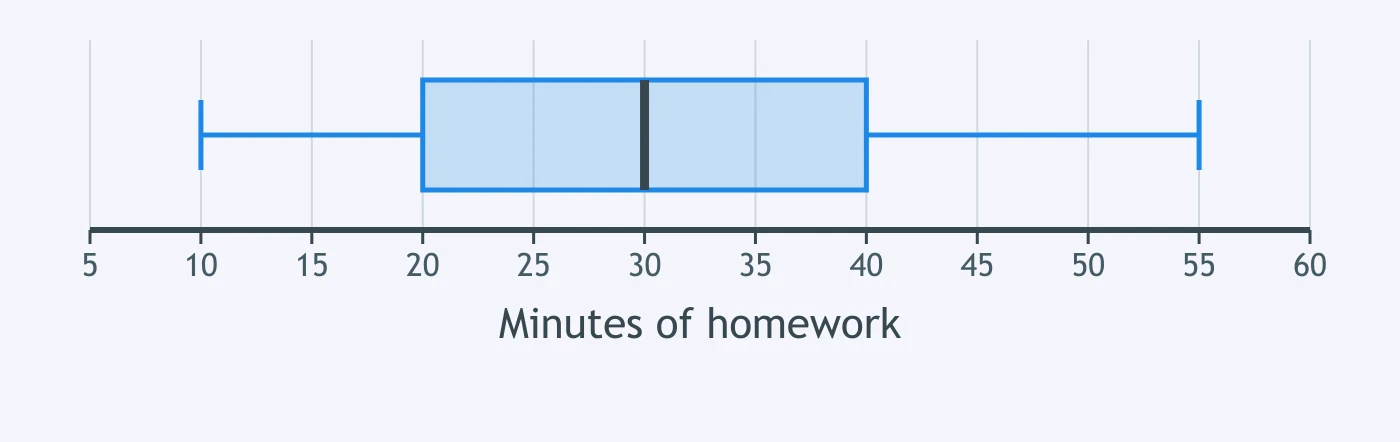
The box plot shows the mass of each parcel for one delivery round. What is the first quartile?
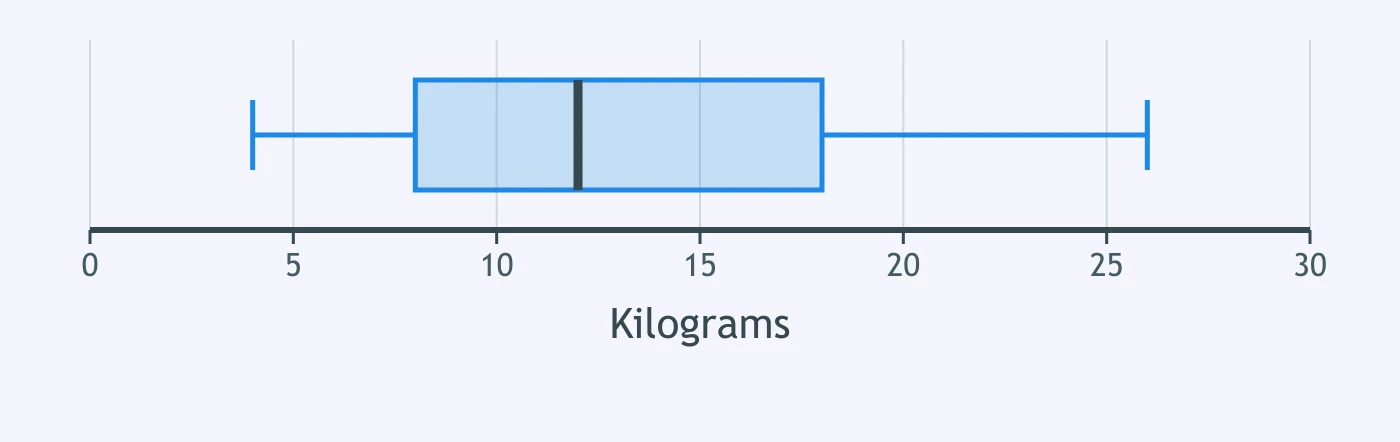
The box plot shows the minutes each student spent on homework for one evening. What is the interquartile range of the data?
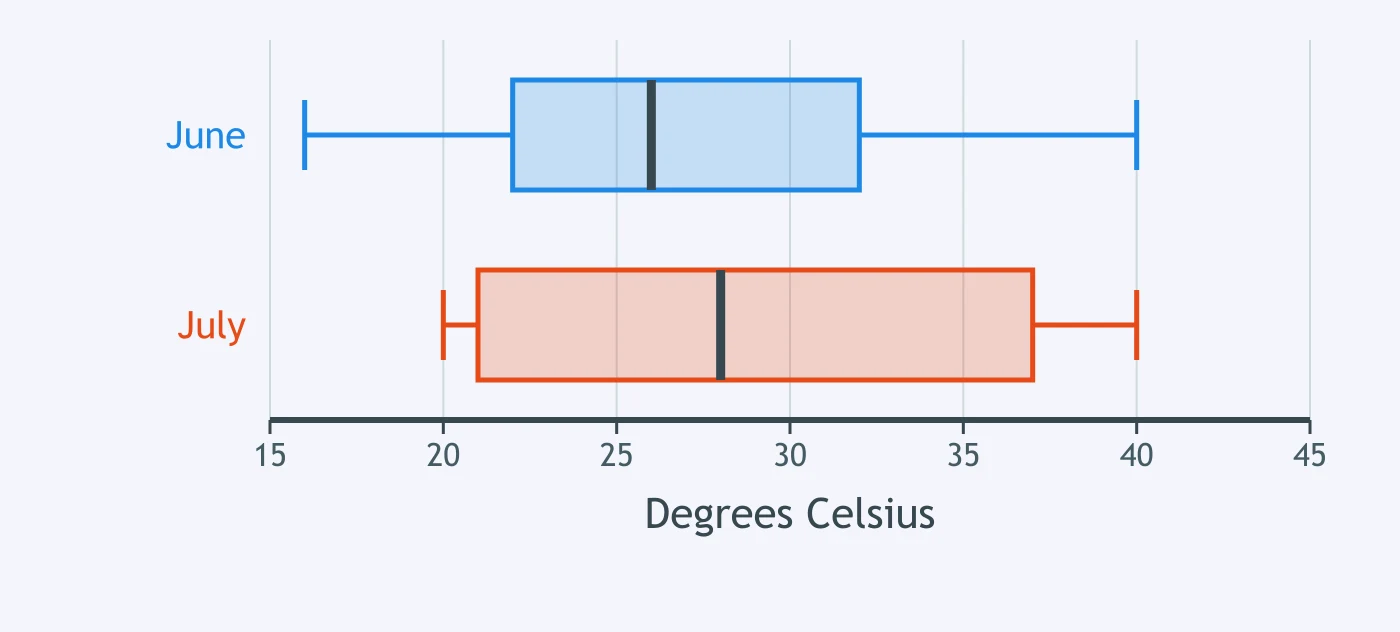
The figure stacks a box plot of the daily high temperature for June above one for July. How much greater is the median of July than the median of June?
The box plot shows the amount each customer spent for one morning at a shop. What is the first quartile?
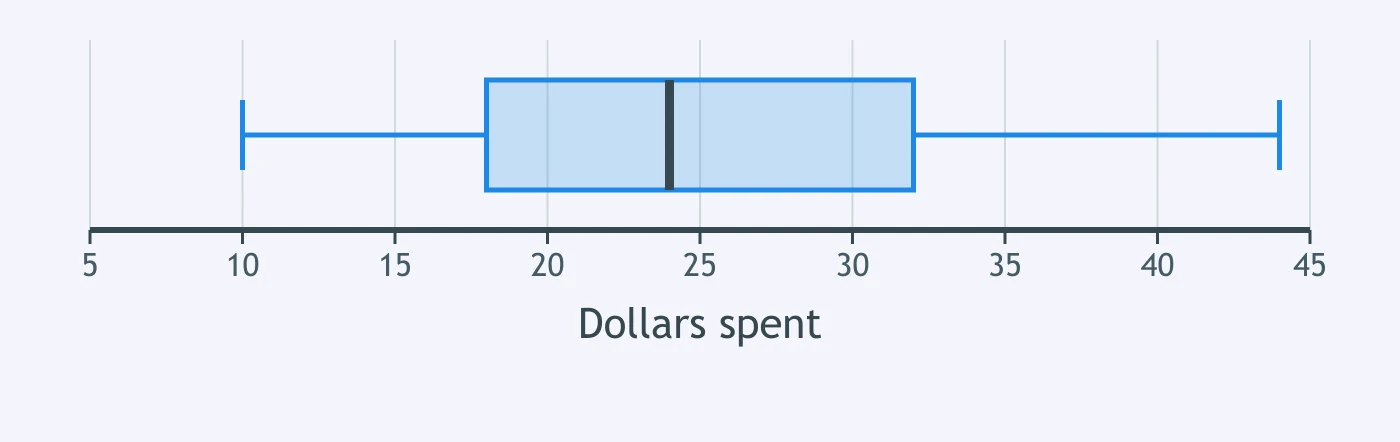
The box plot shows the daily high temperature for a month of readings. What is the smallest value?
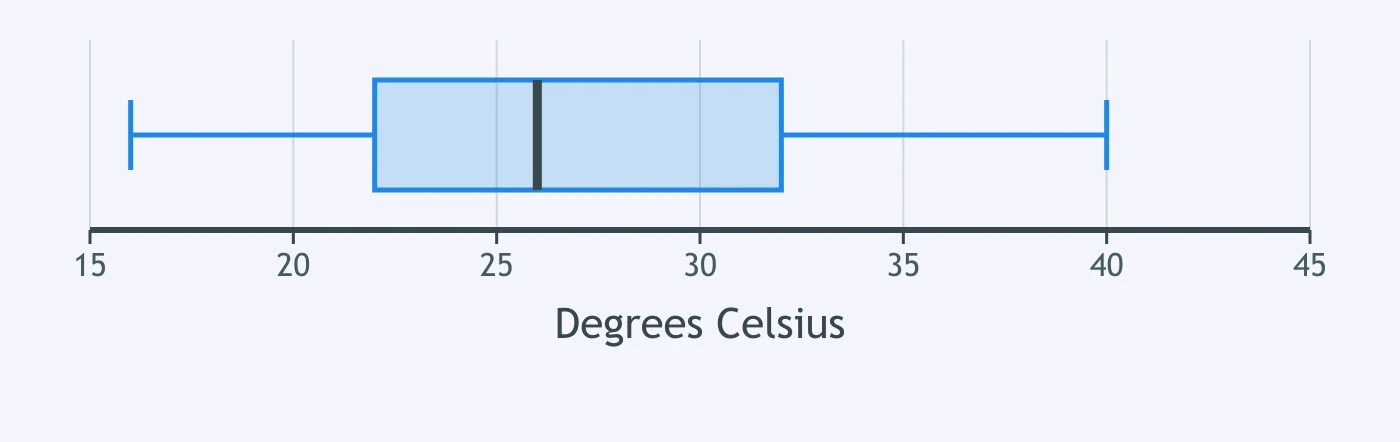
The box plot shows the mass of each parcel for one delivery round. What is the interquartile range of the data?
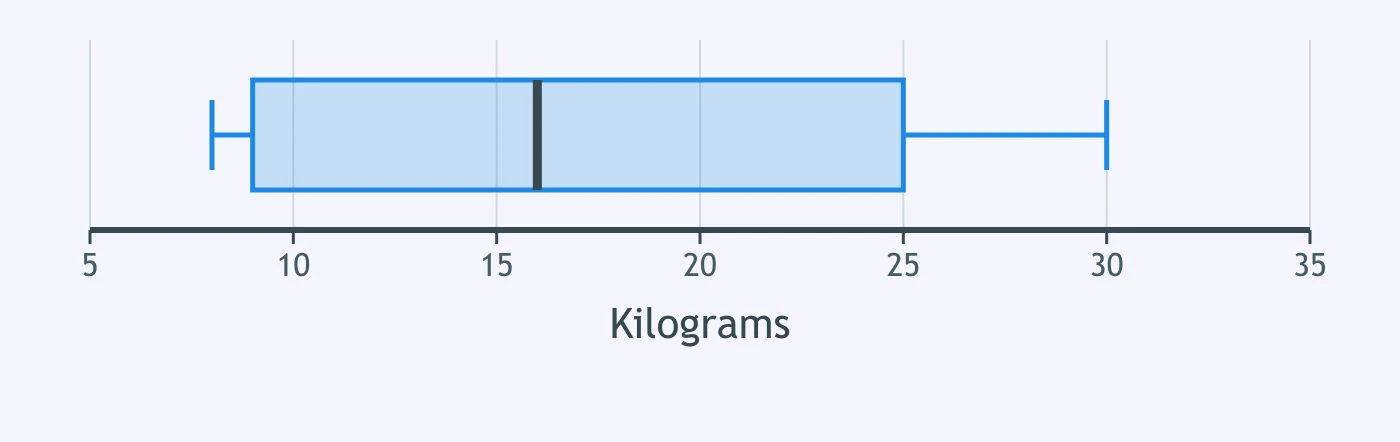
The box plot shows the amount each customer spent for one morning at a shop. The largest quarter of the values lies between the right edge of the box and the end of the right whisker. How wide is that stretch?
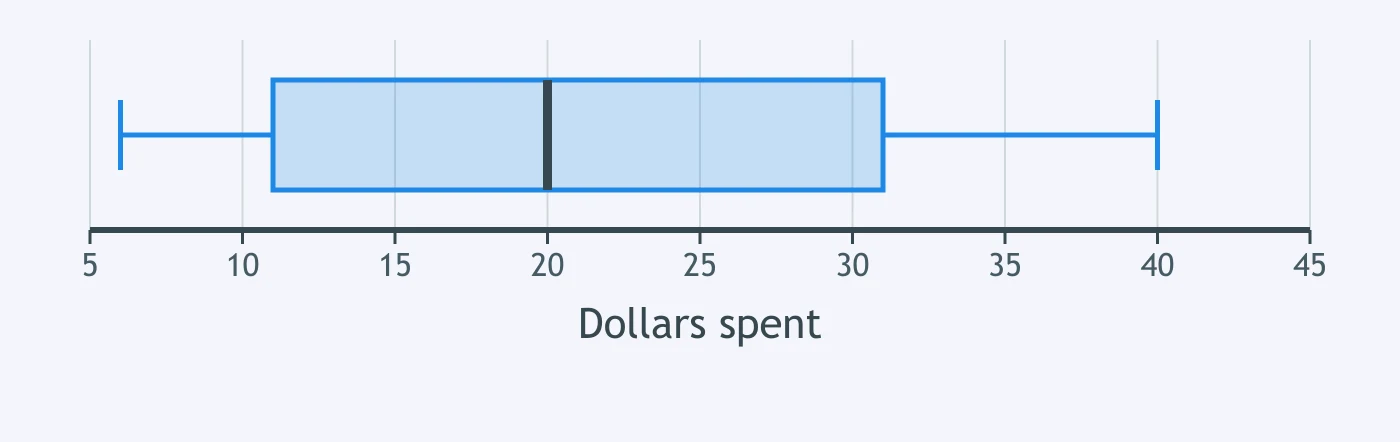
The box plot shows the amount each customer spent for one morning at a shop. Its largest reading is 42 dollars, at the end of the right whisker. Under the 1.5 x IQR rule, is that reading an outlier?
Crack the passcode before the zombies get in.
Answer, then swat bugs for bonus points.
Race through questions at your own speed.
Same question on every screen. Fastest wins.

Pick a tile, answer, hit bonuses and steals.
Scatter Plots and Association
20 questions