Loading
by BlastRoom
Reading frequencies off a histogram and describing a distribution as symmetric, skewed or uniform.
#algebra_i

20 questions
One question set, multiple game modes. Tap any game to see it in action. Not sure which to pick?
Answer to place stones and capture territory.
Outrun the snow together.
Earn blasts, then hunt the other team.
Answer to earn energy, then climb.

The class blasts through walls together.
Bid on mystery lots. Most money wins.
Sell tours. Nice, standard, or a total scam.

Answer, restock, and serve the rush.
More correct answers pulls the rope your way.
Answer, then shoot down the alien wave.
Answer, then tap to leap the frozen ridge.
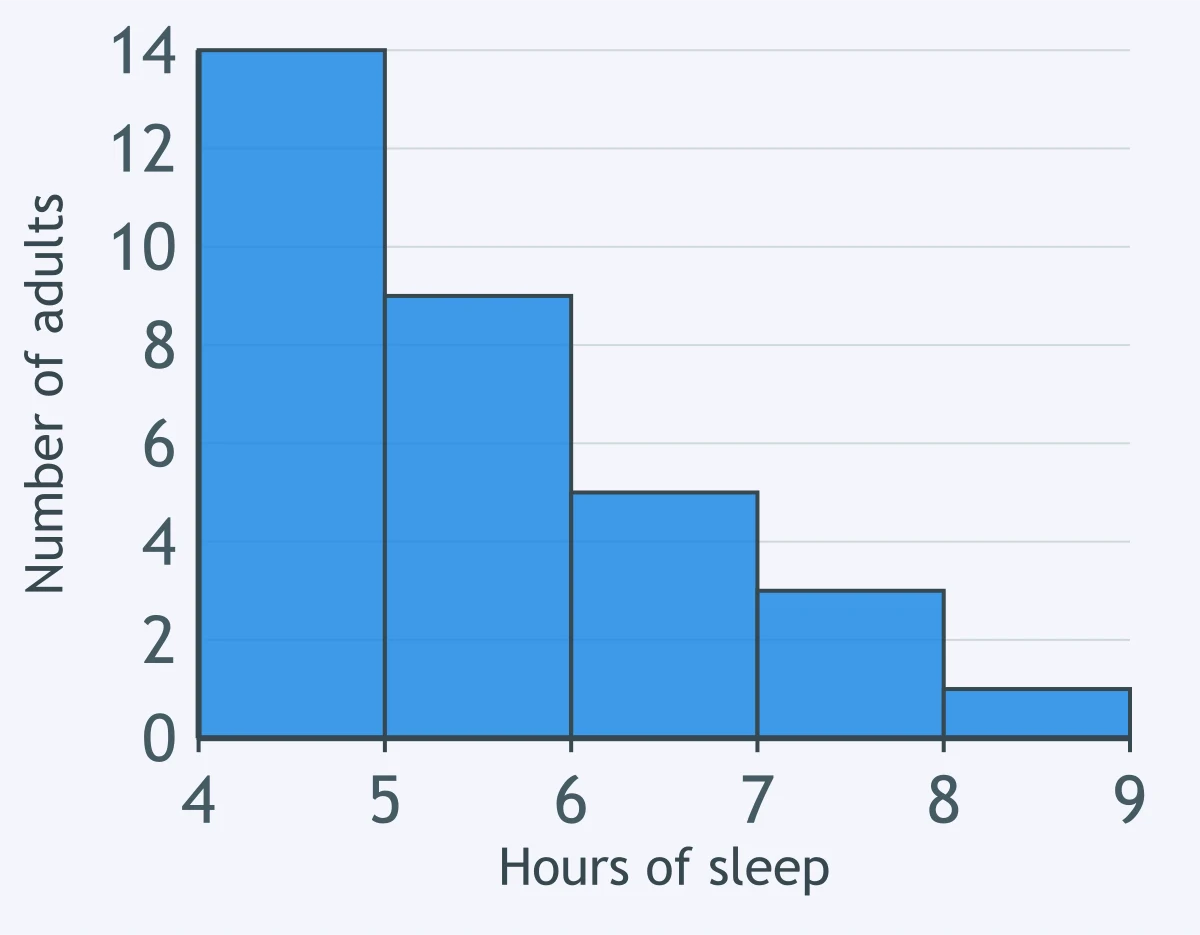
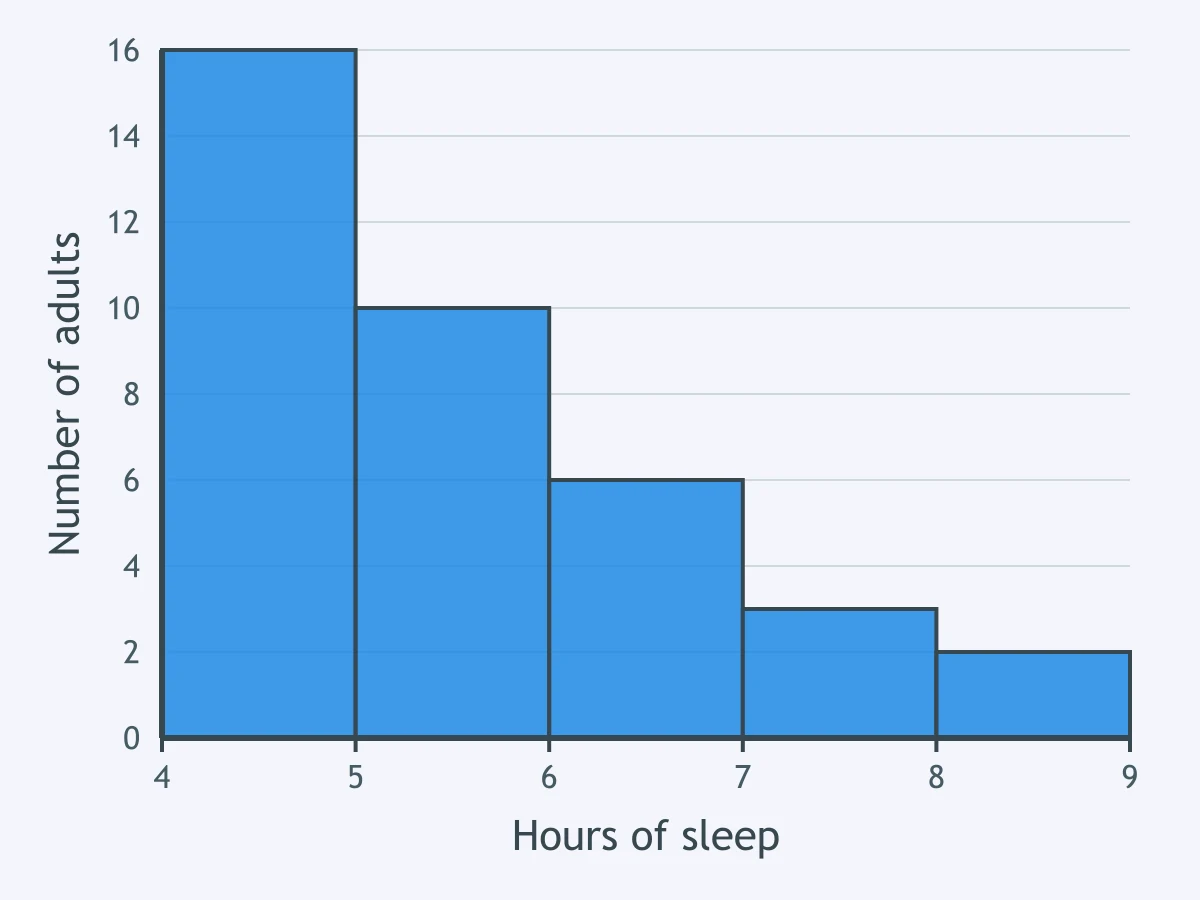
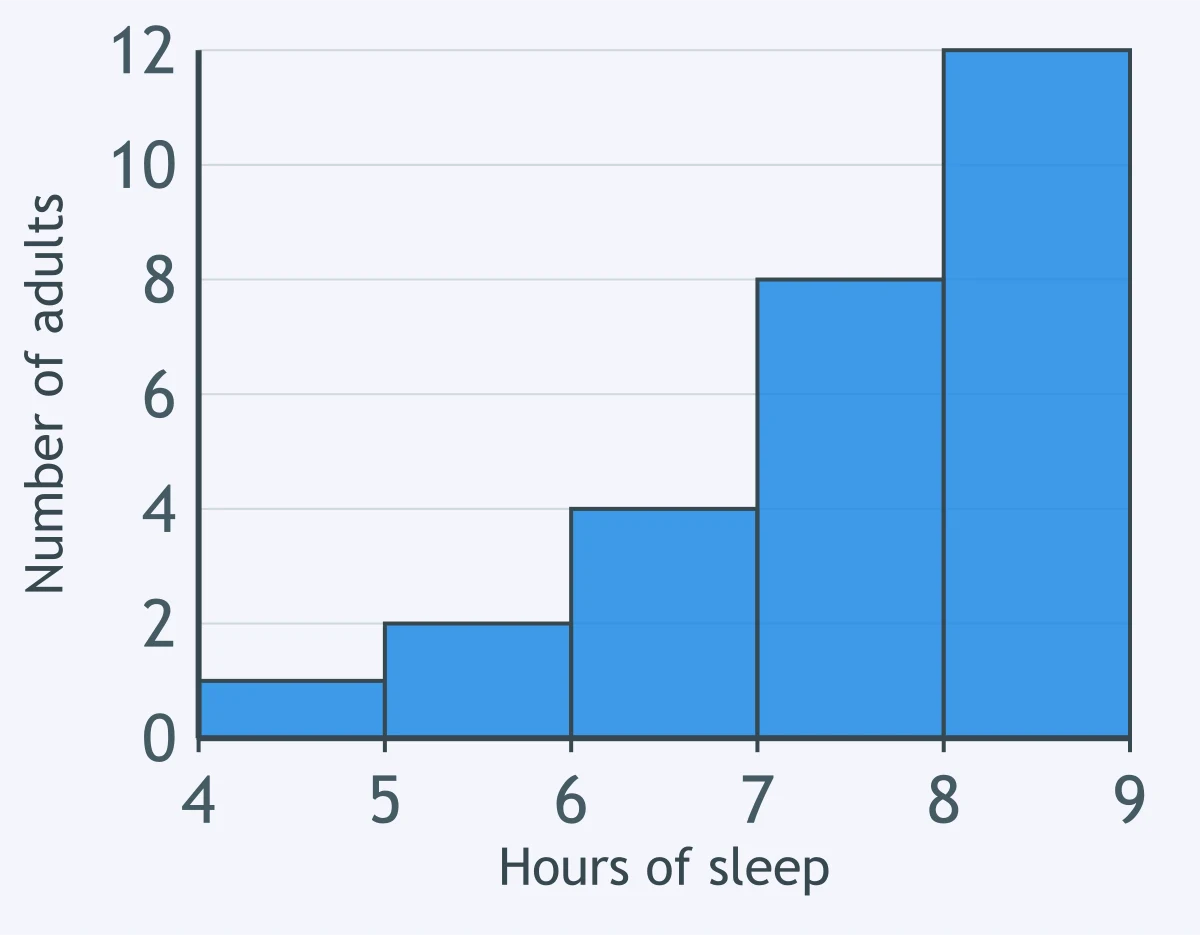
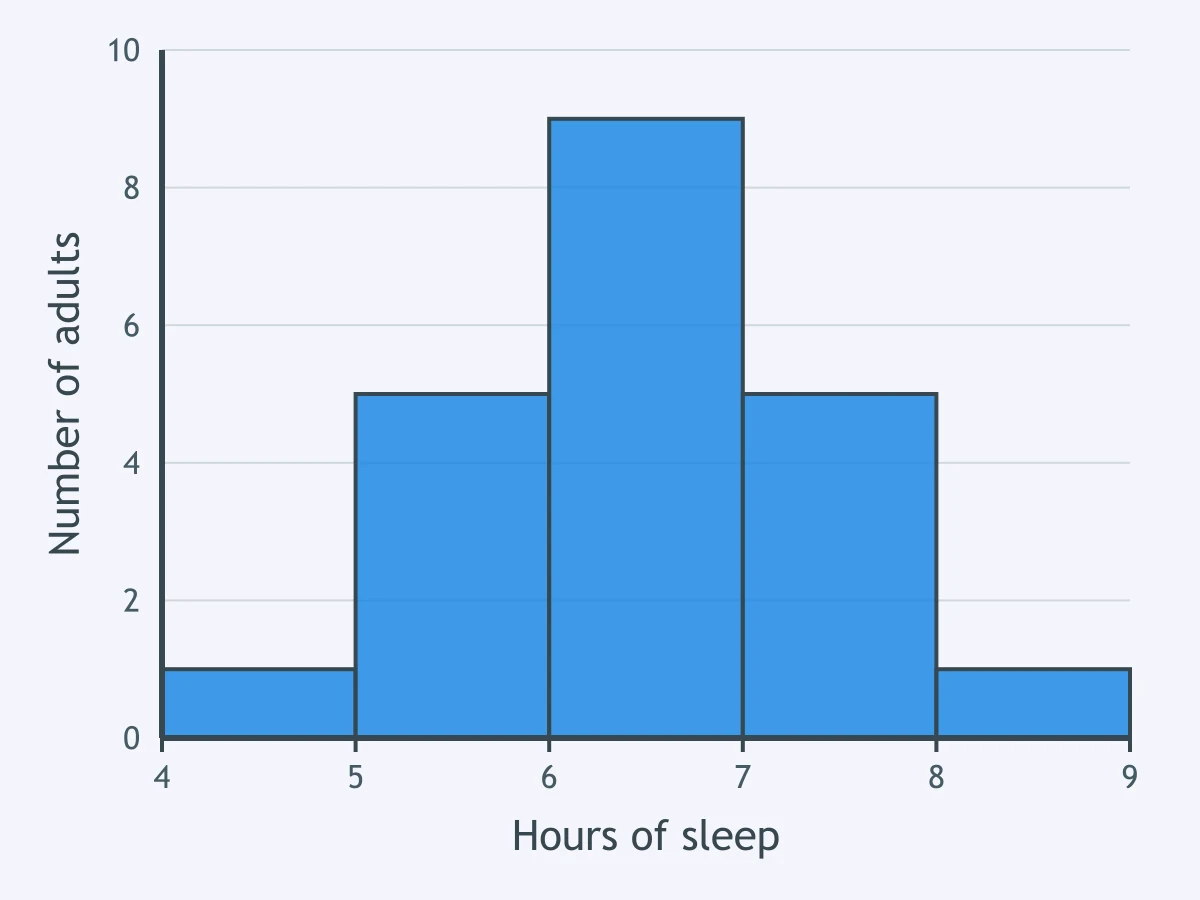
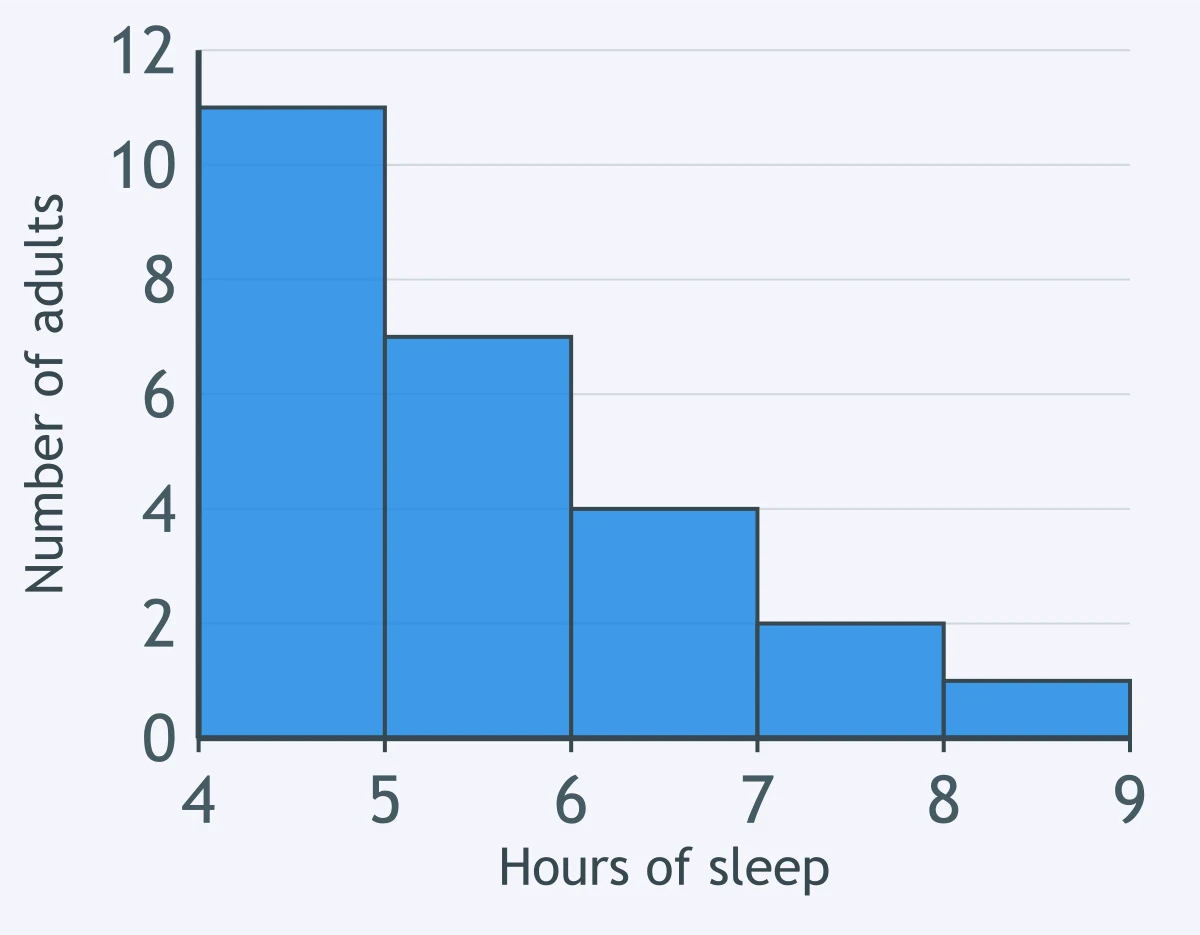
The histogram shows the hours of sleep each adult had for one night in a study. How many adults are in the group from 5 to 6 hours?
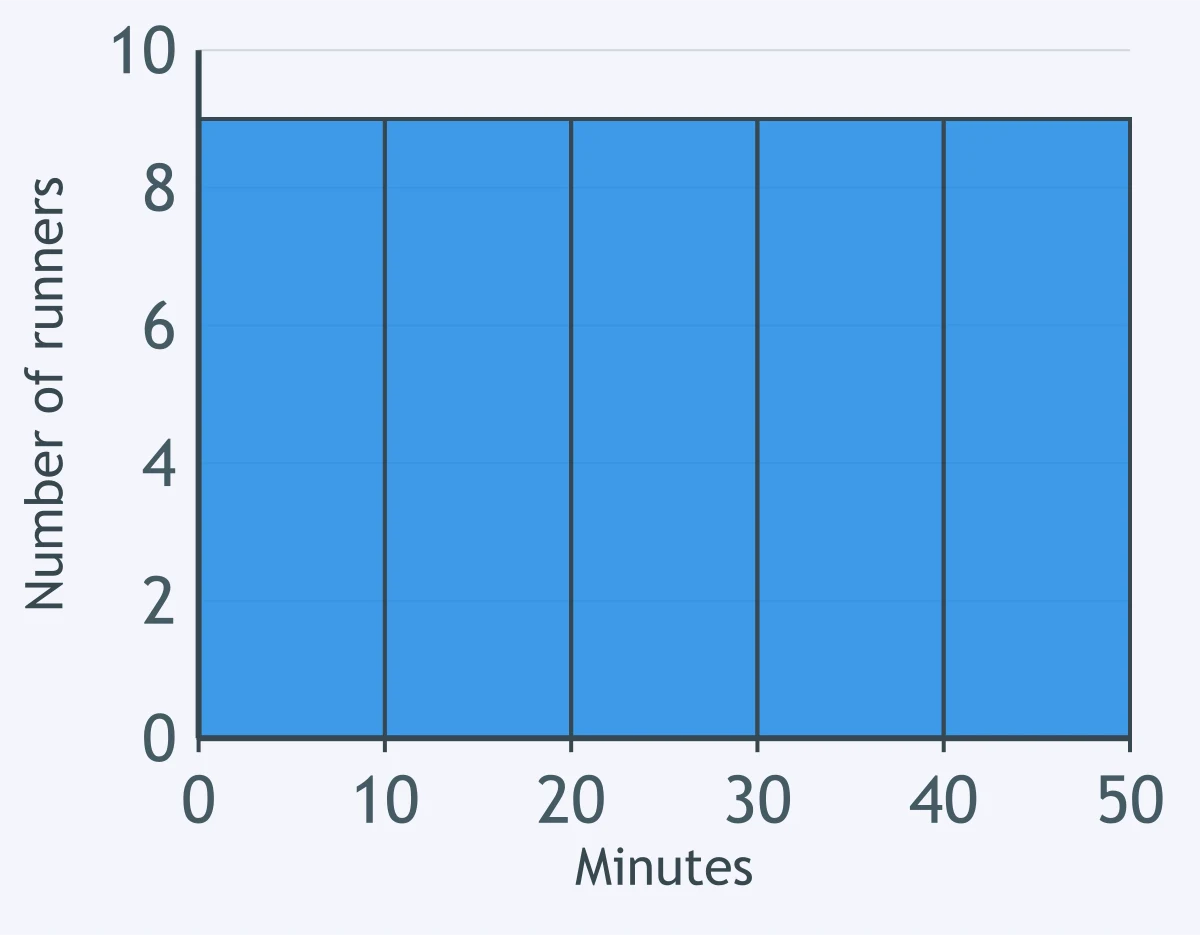
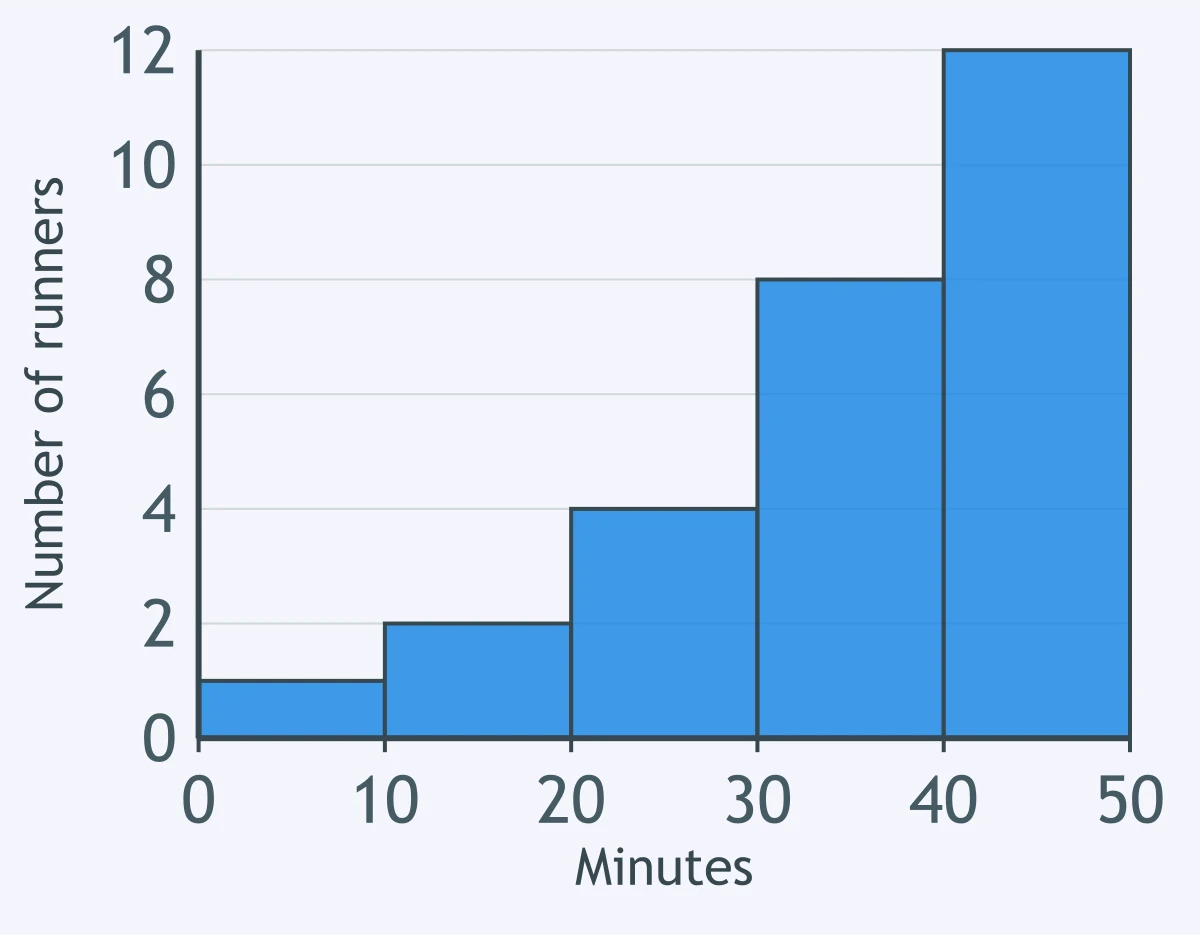
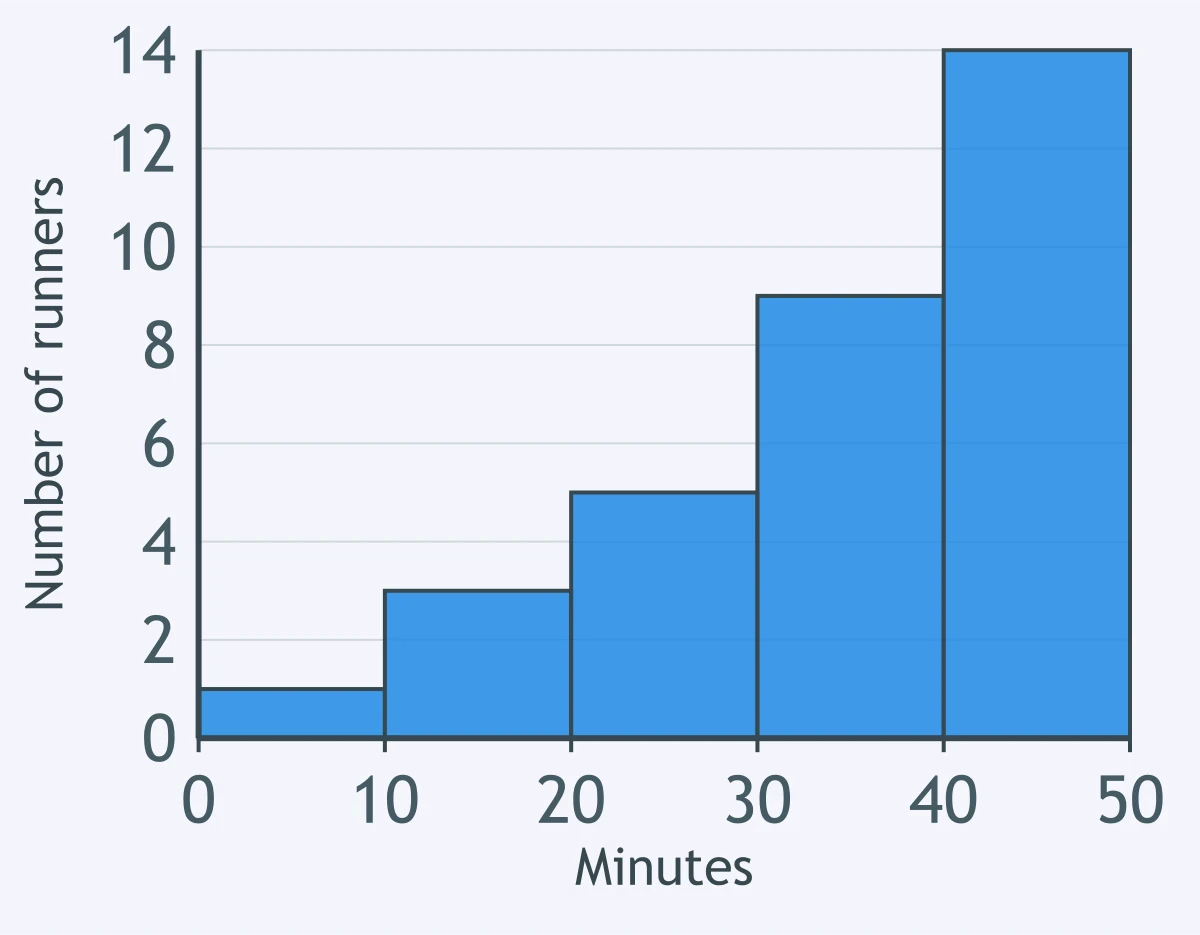
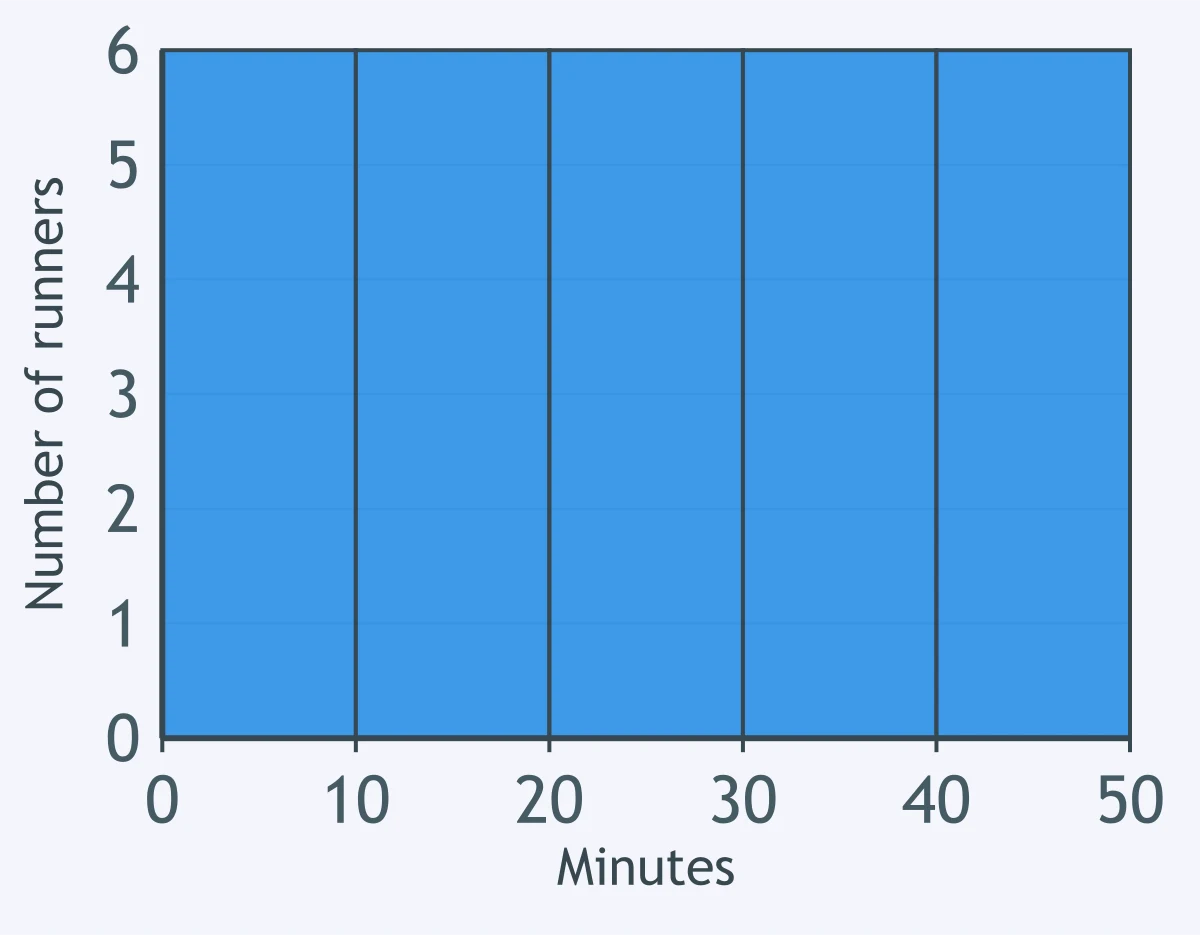
The histogram shows the minutes each runner took for a fun run. Where does the mean of this data sit compared with the median?
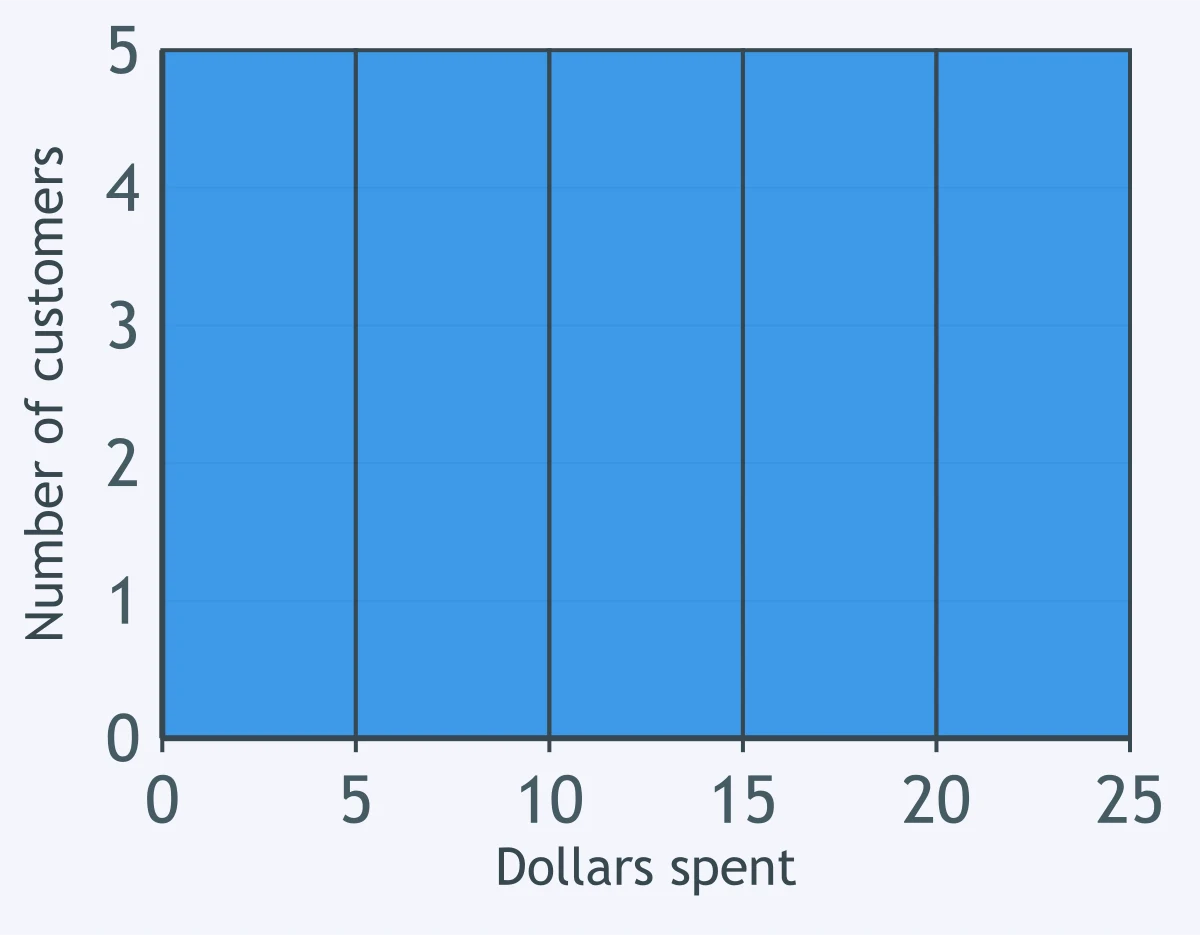
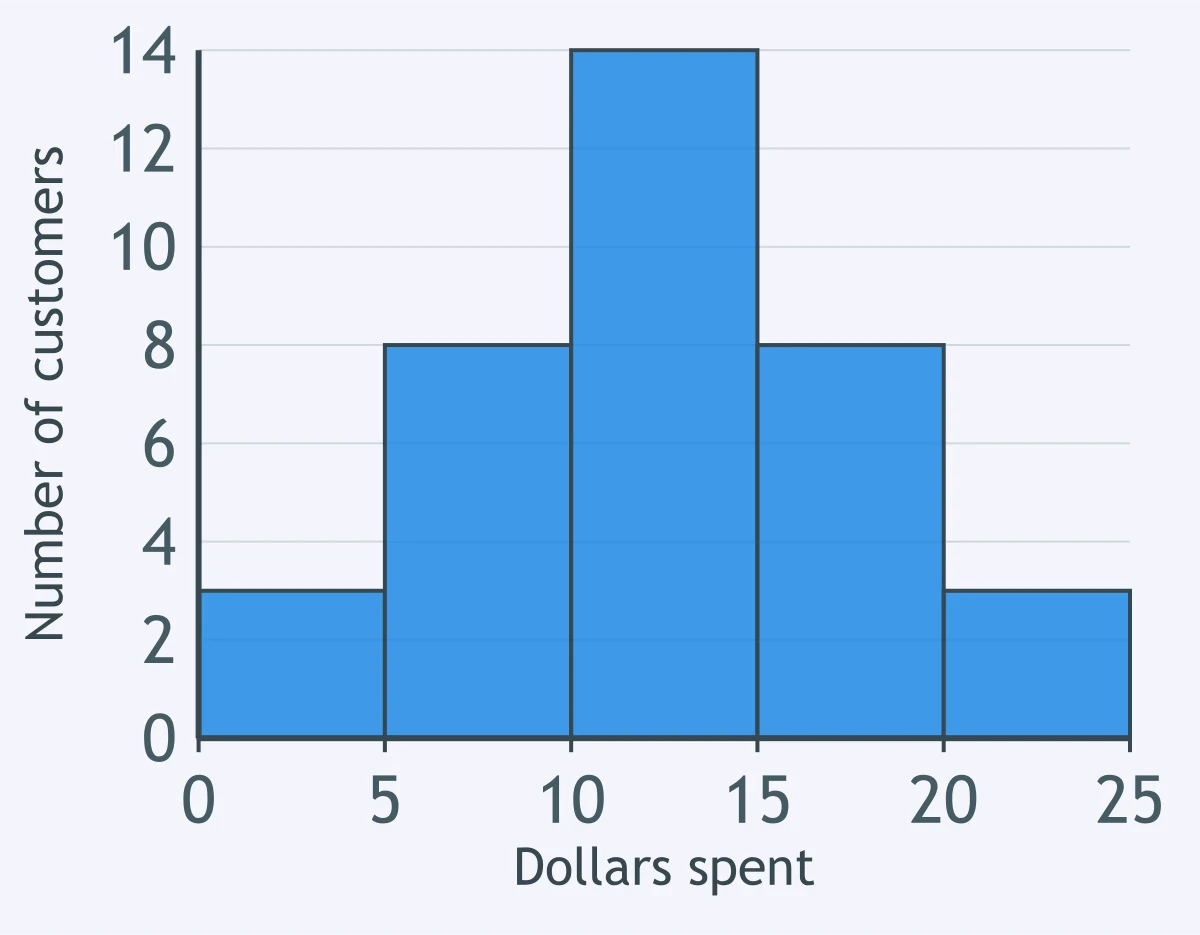
The histogram shows the amount each customer spent for one morning at a shop. How is the shape of this distribution best described?
The histogram shows the minutes each runner took for a fun run. How is the shape of this distribution best described?
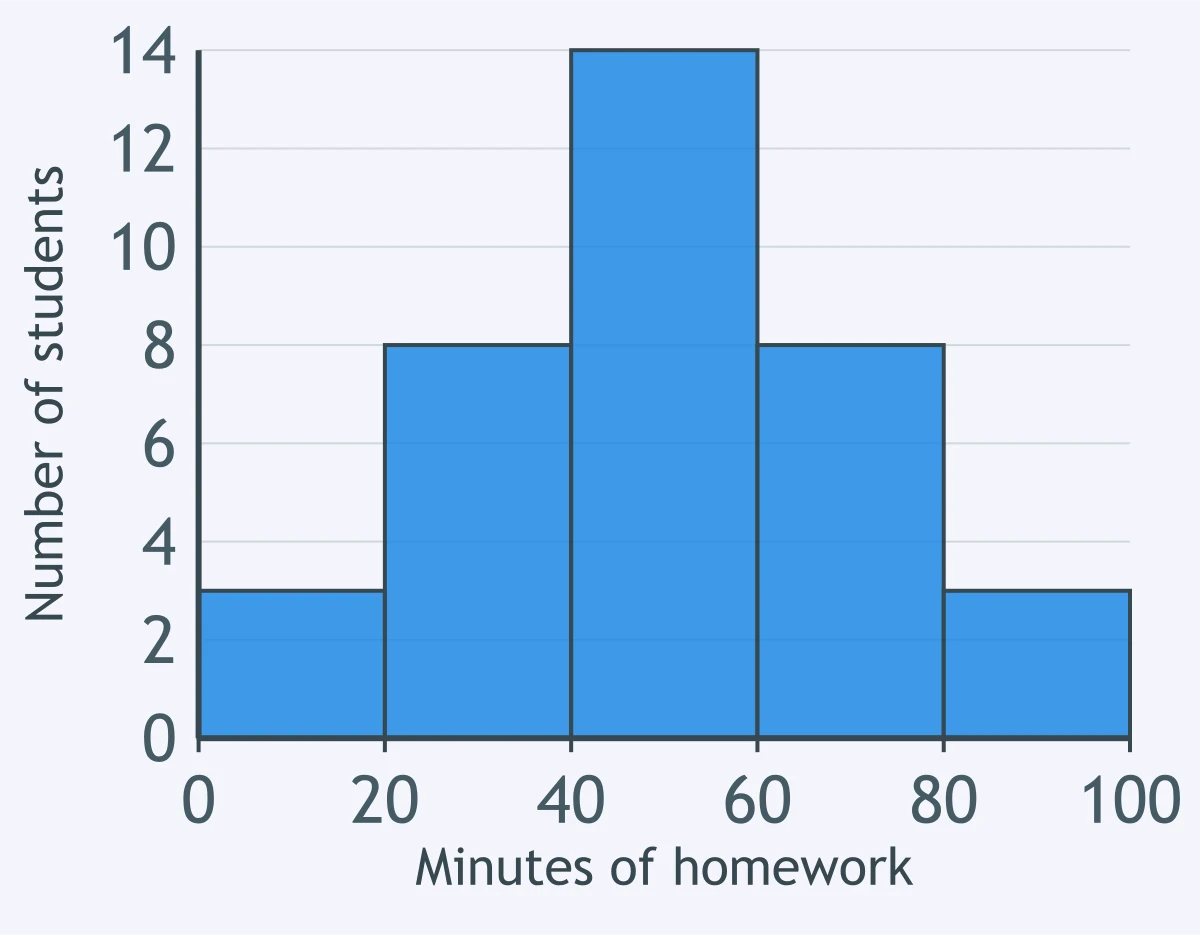
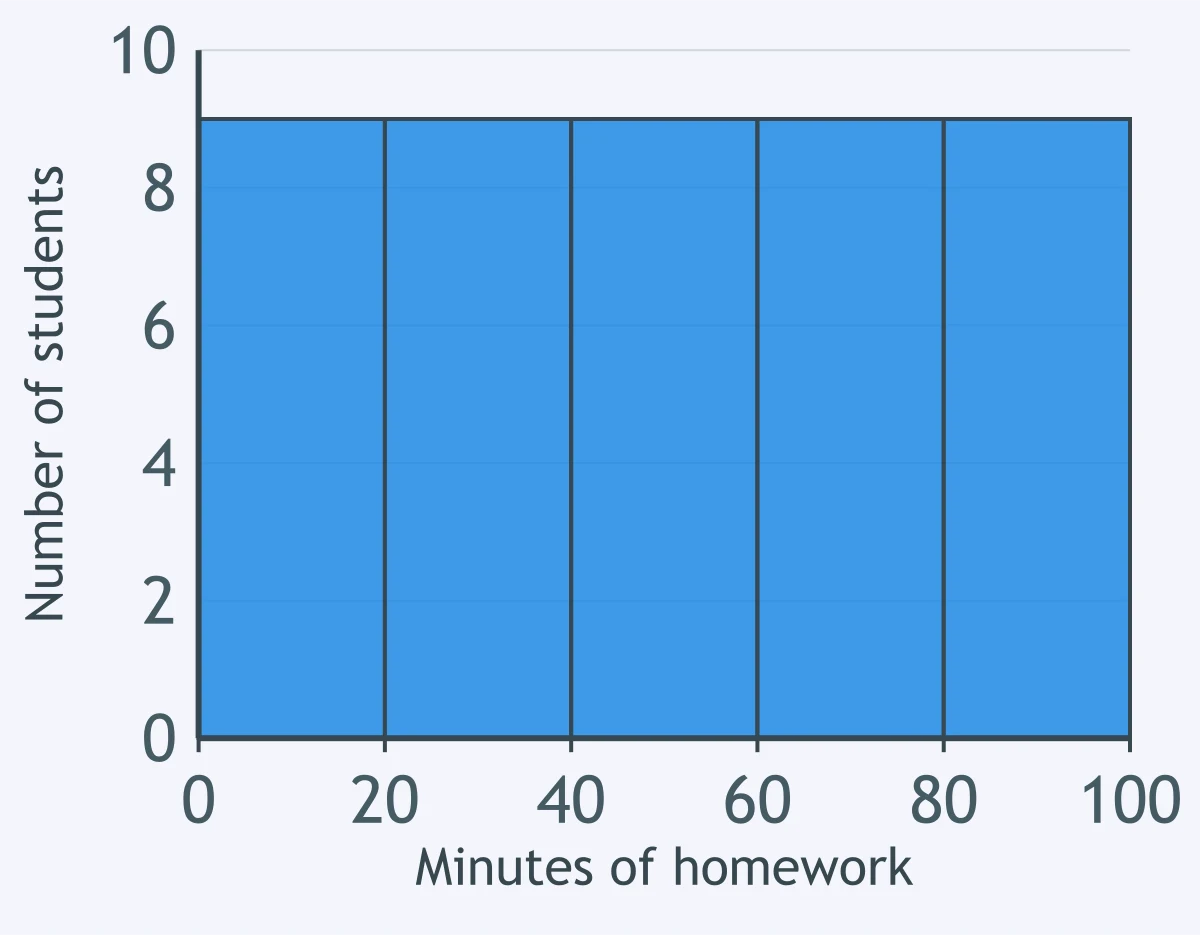
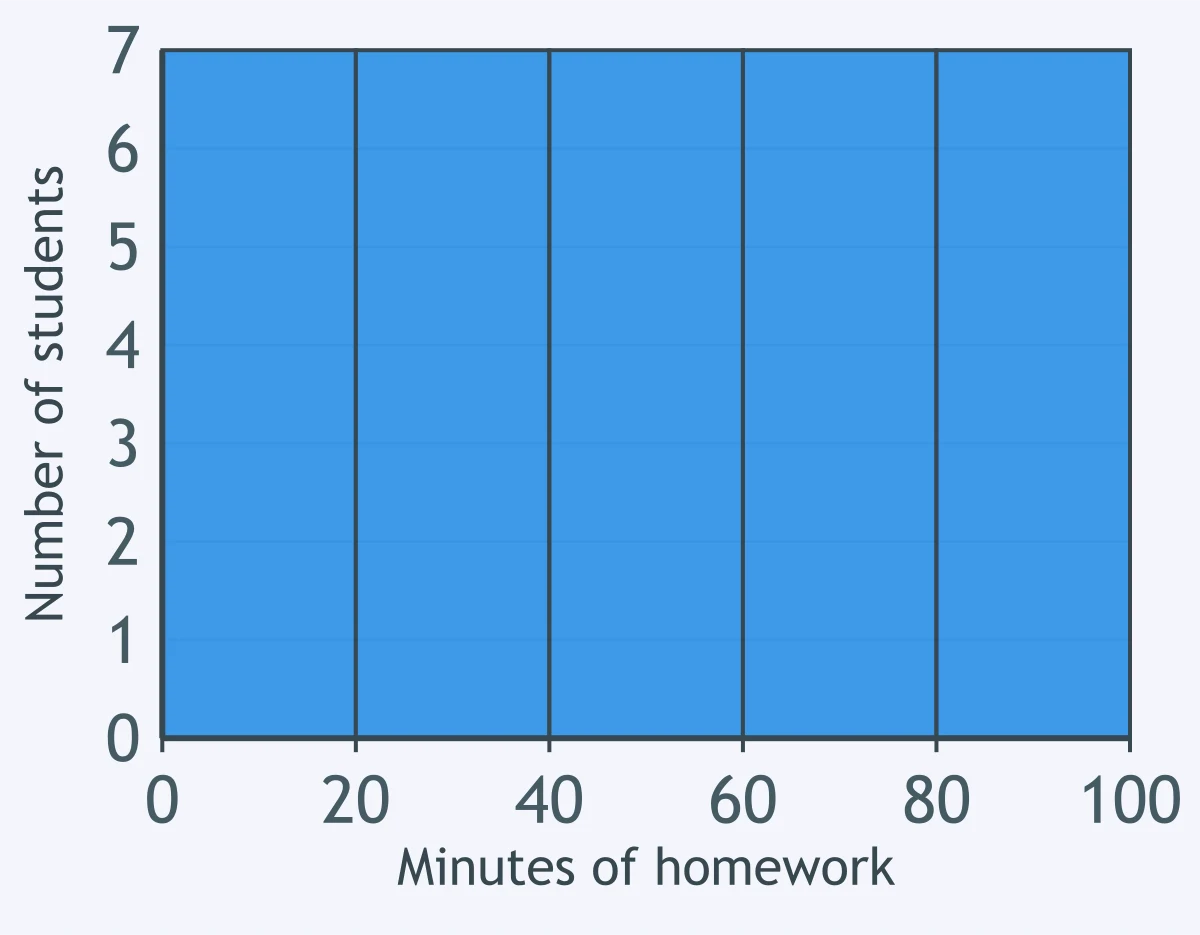
The histogram shows the minutes each student spent on homework for one evening. How is the shape of this distribution best described?
The histogram shows the amount each customer spent for one morning at a shop. How many customers are in the group from 5 to 10 dollars?
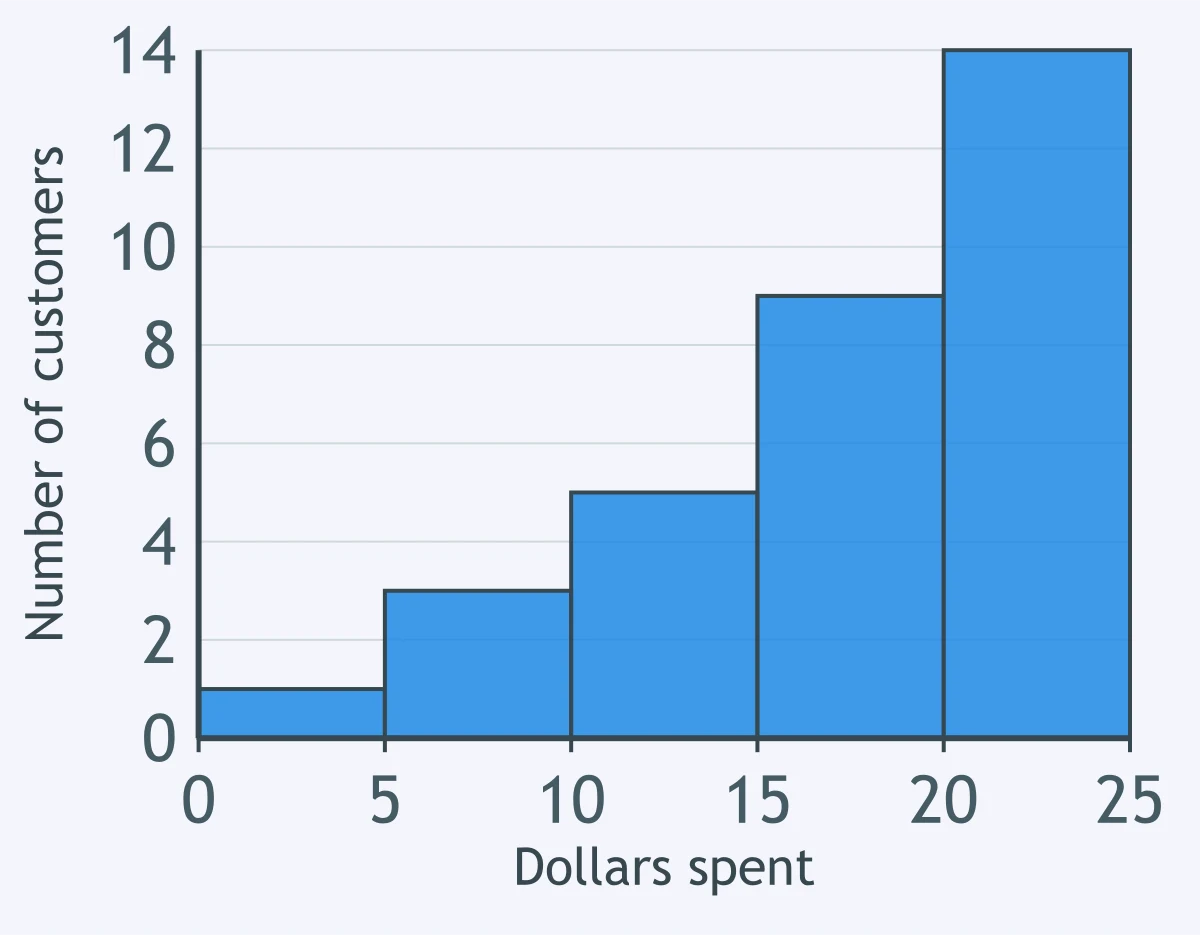
The histogram shows the amount each customer spent for one morning at a shop. How is the shape of this distribution best described?
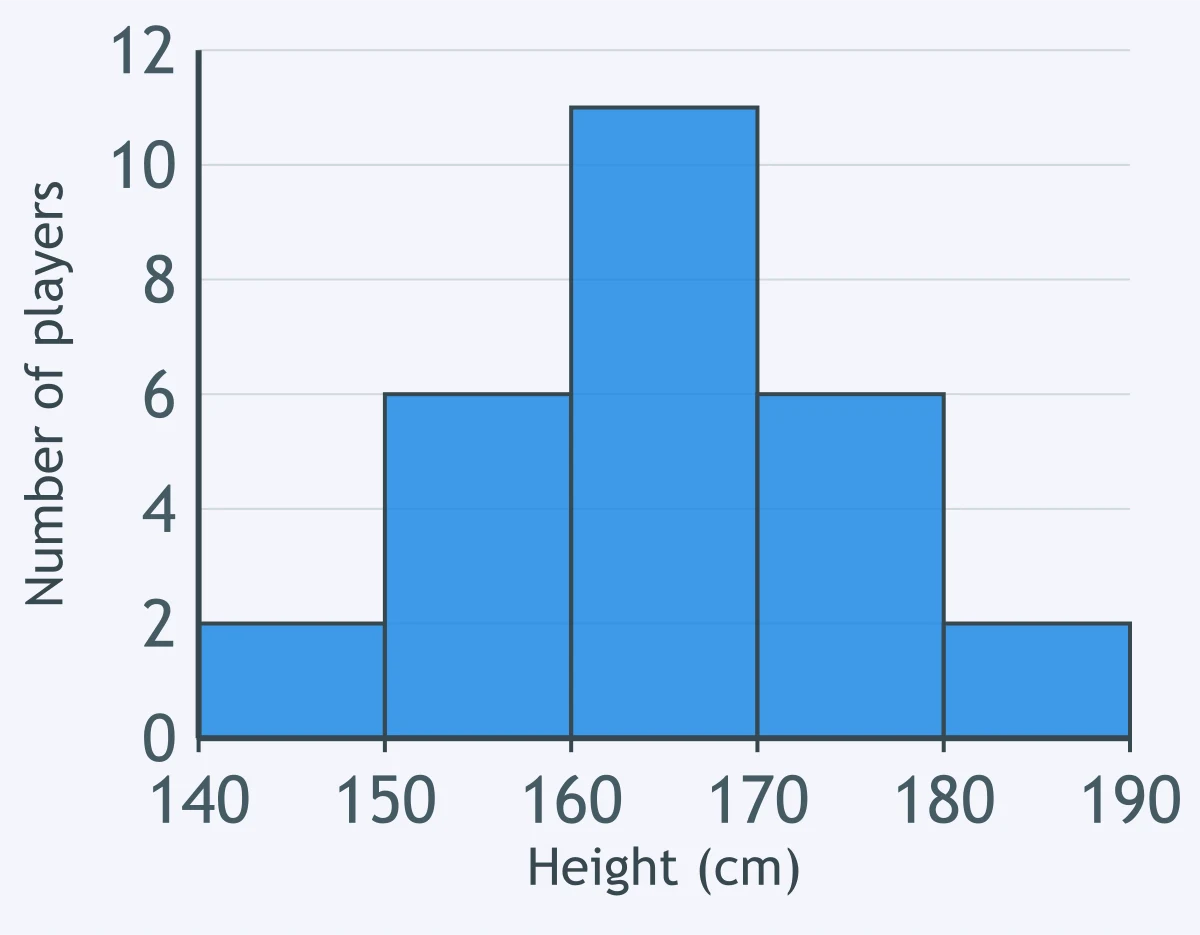
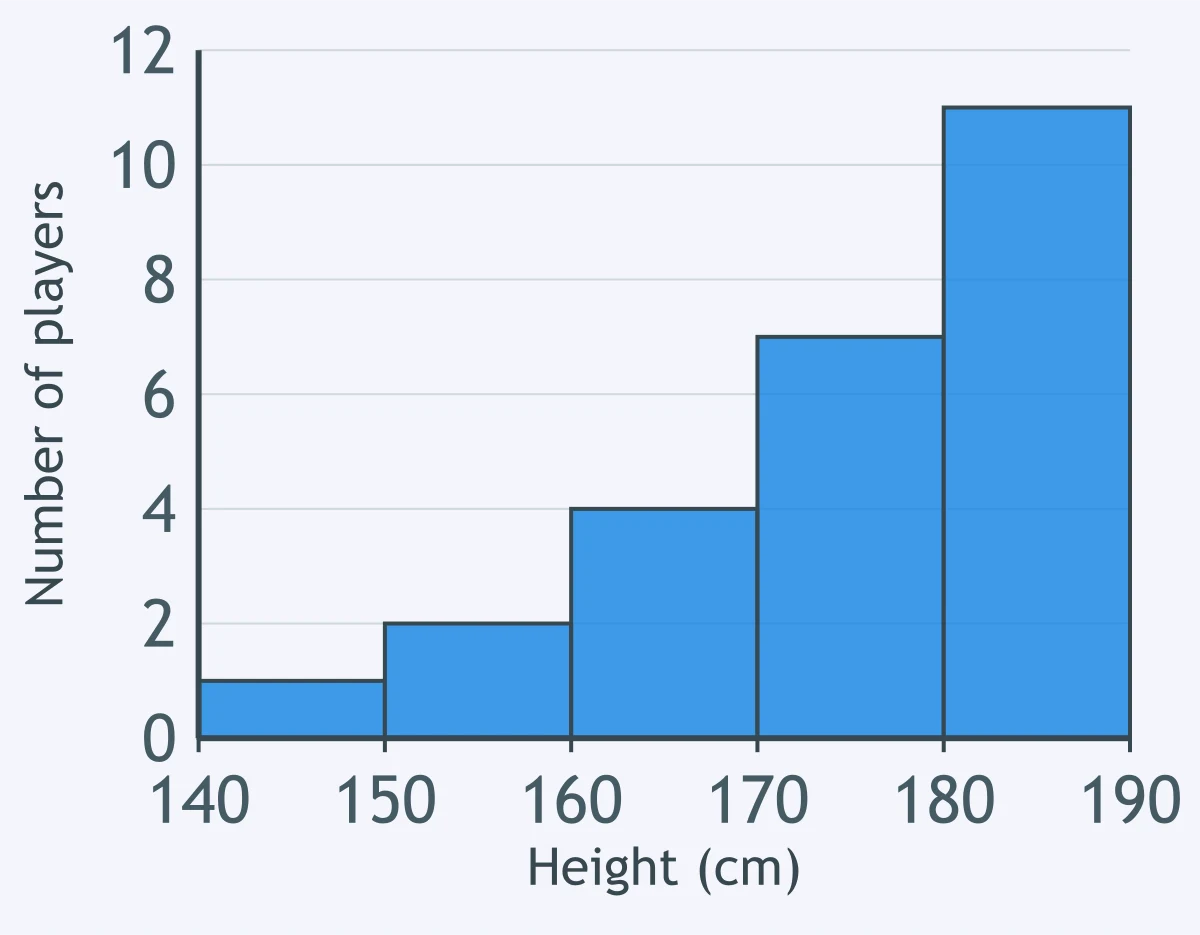
The histogram shows the height of each player for a squad. How many players are in the group from 150 to 160 centimeters?
The histogram shows the minutes each student spent on homework for one evening. Where does the mean of this data sit compared with the median?
The histogram shows the hours of sleep each adult had for one night in a study. Where does the mean of this data sit compared with the median?
The histogram shows the height of each player for a squad. How many players are in the group from 170 to 180 centimeters?
The histogram shows the hours of sleep each adult had for one night in a study. How is the shape of this distribution best described?
The histogram shows the minutes each runner took for a fun run. How many runners are counted in the bars at 30 minutes and above?
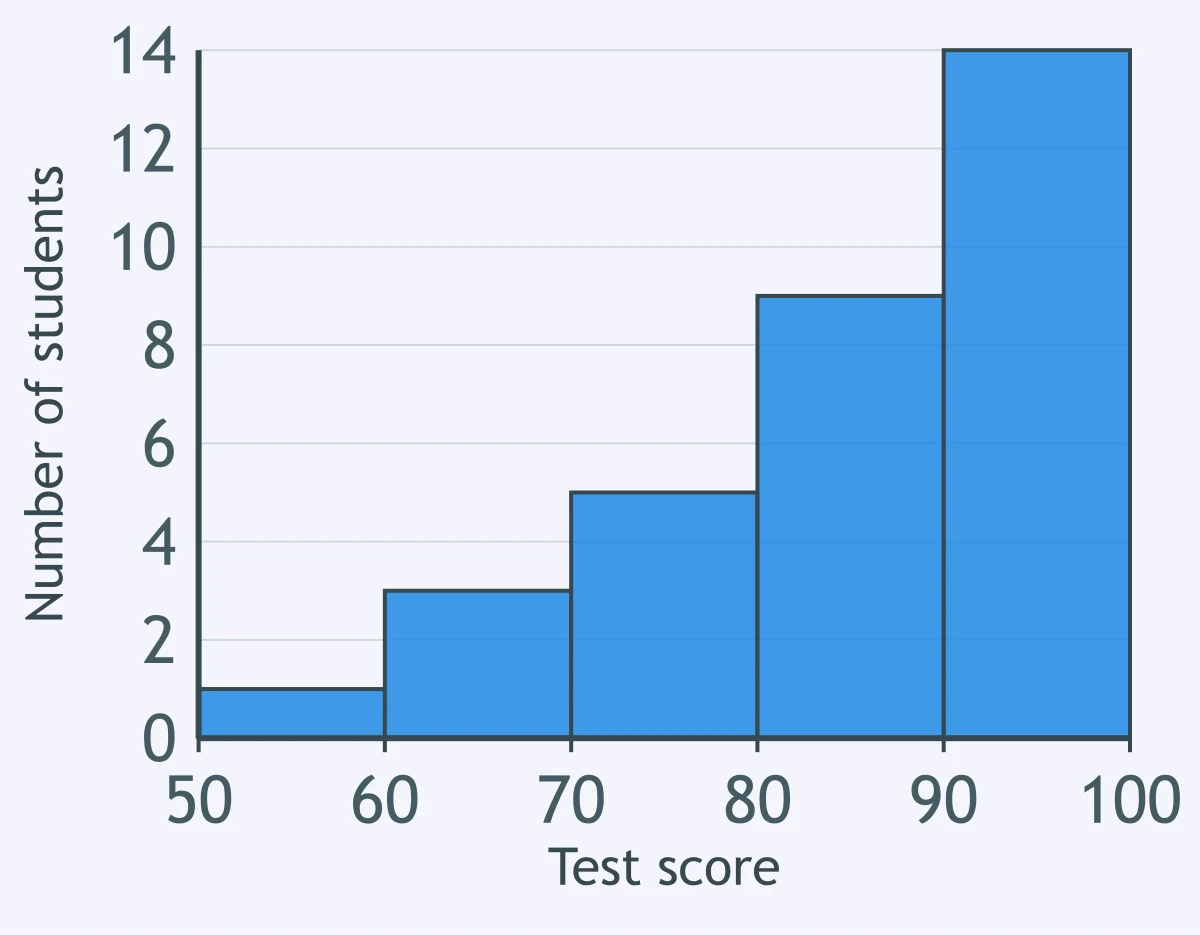
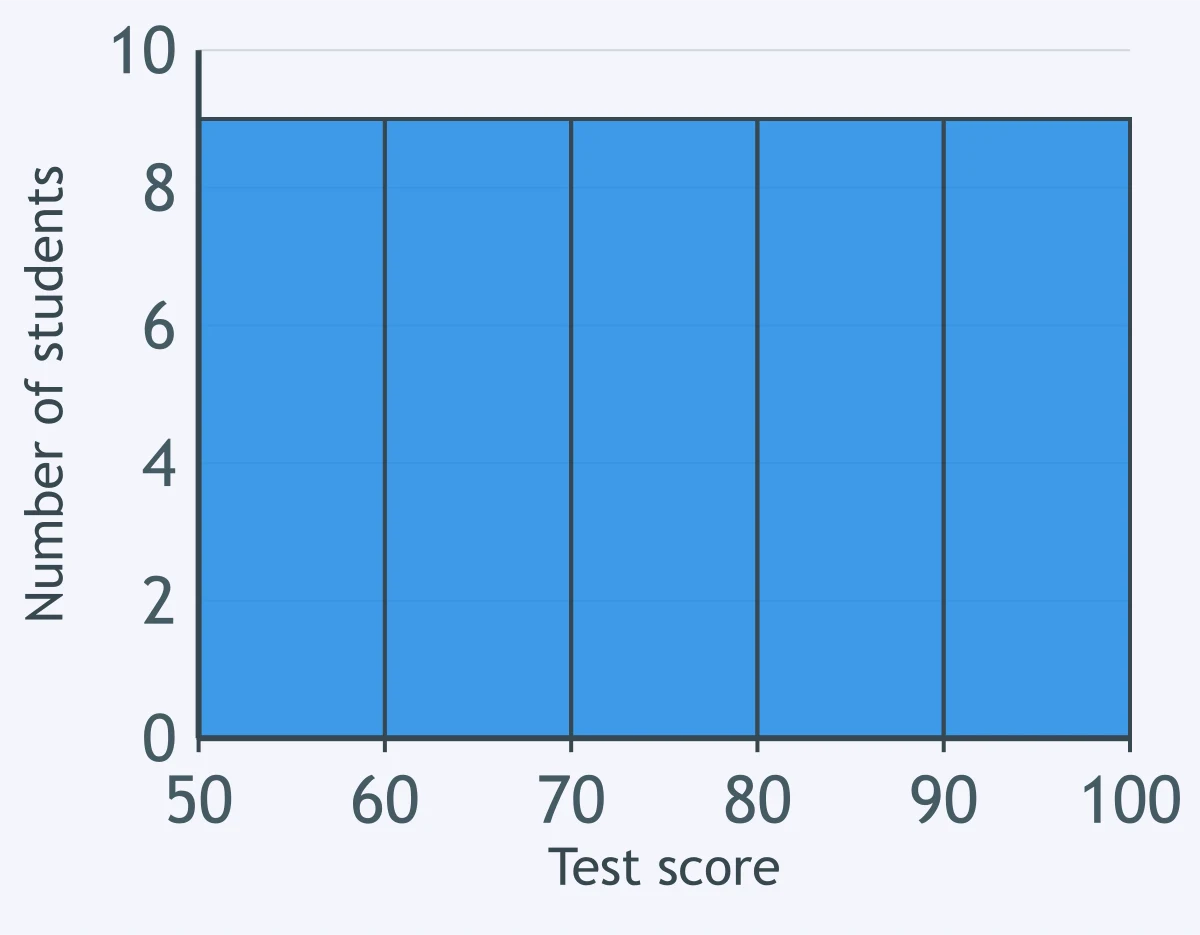
The histogram shows the score each student earned for one class. How many students are in the group from 80 to 90 points?
The histogram shows the hours of sleep each adult had for one night in a study. Where does the mean of this data sit compared with the median?
The histogram shows the minutes each runner took for a fun run. Which description matches the data the bars show?
The histogram shows the hours of sleep each adult had for one night in a study. Which description matches the data the bars show?
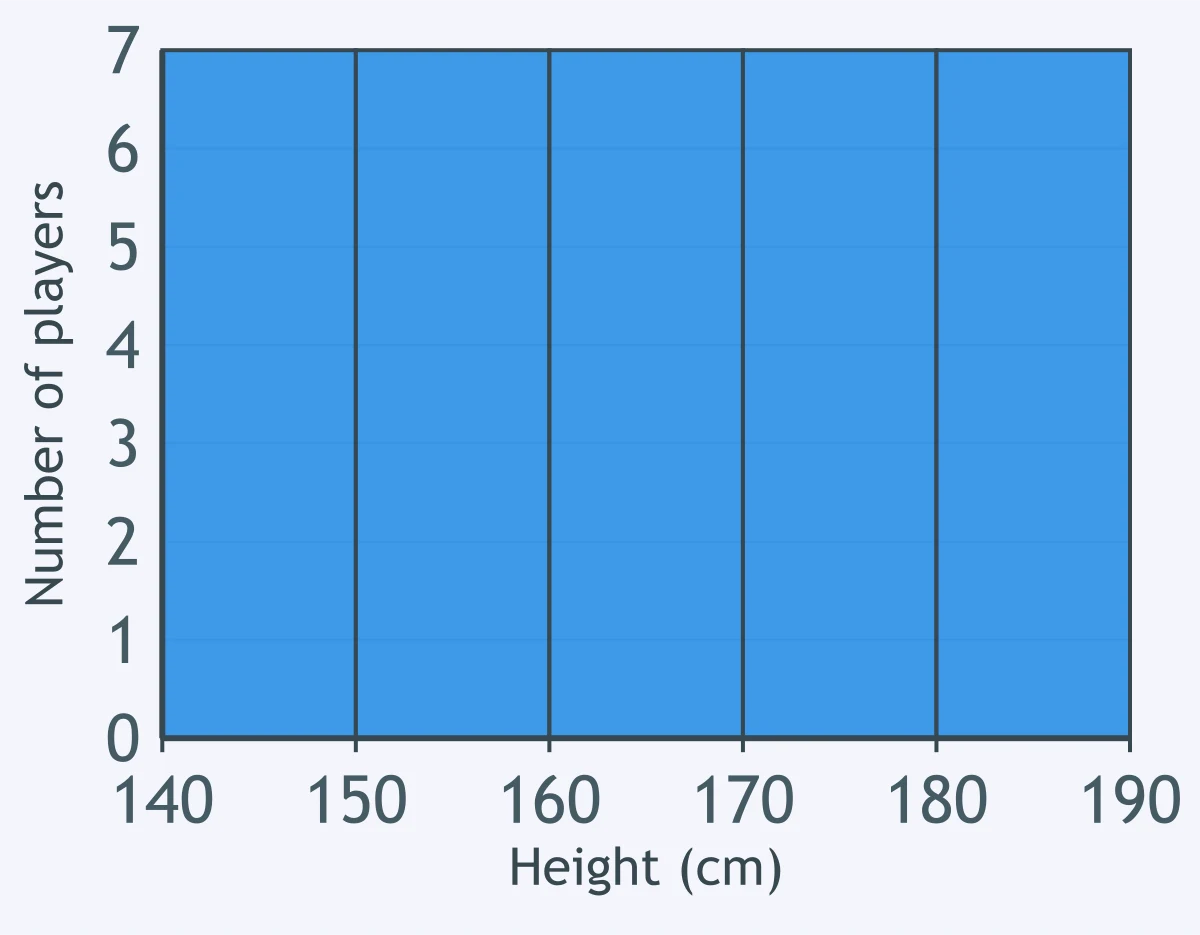
The histogram shows the height of each player for a squad. Which description matches the data the bars show?
The histogram shows the score each student earned for one class. Where does the mean of this data sit compared with the median?
The histogram shows the minutes each student spent on homework for one evening. How many students are counted in the bars at 60 minutes and above?
Crack the passcode before the zombies get in.
Answer, then swat bugs for bonus points.
Race through questions at your own speed.
Same question on every screen. Fastest wins.

Pick a tile, answer, hit bonuses and steals.
Lines of Best Fit
20 questions