Loading
by BlastRoom
Read bar graphs and models of Earth's water to find where the salt water, the fresh water, and the frozen fresh water actually sit.
#water_distribution#us_grade_5_science
20 questions
One question set, multiple game modes. Tap any game to see it in action. Not sure which to pick?
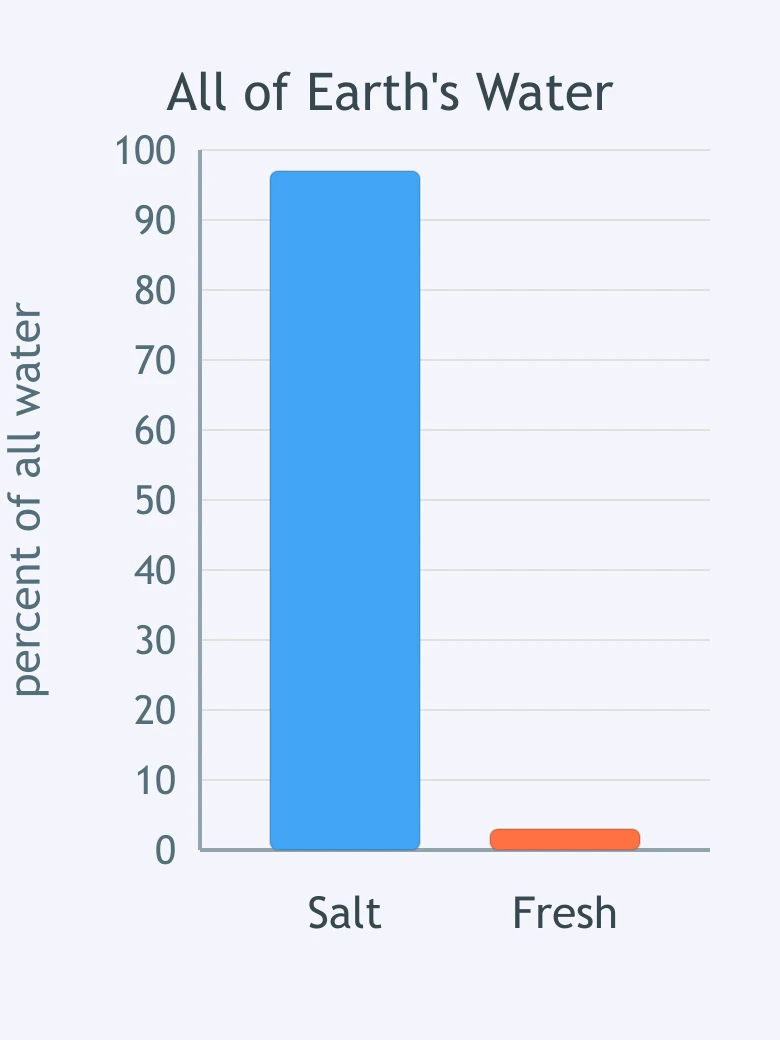
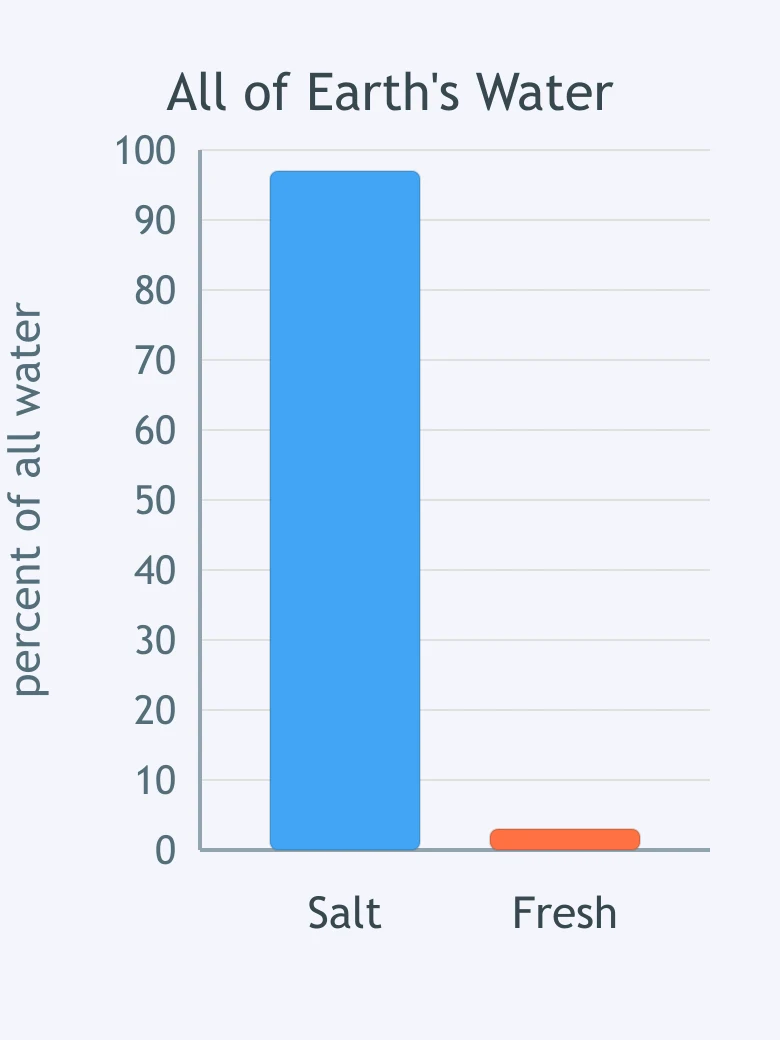
Look at the bar graph of all the water on Earth. About what percent of it is salt water?
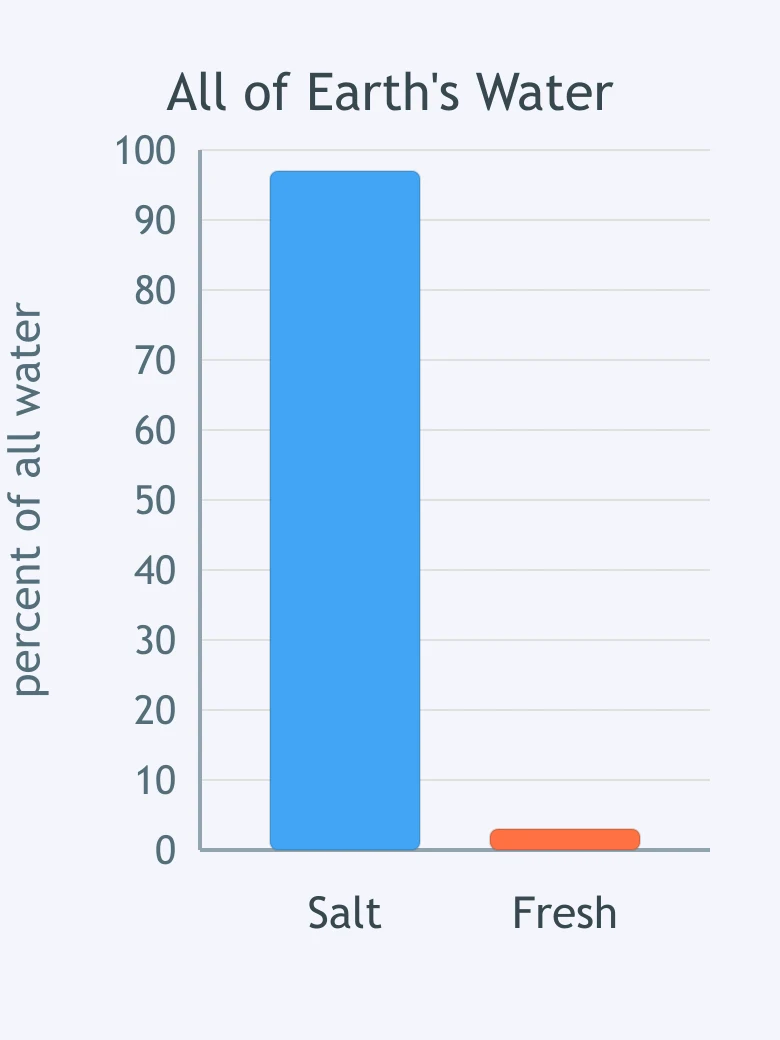
Look at the same bar graph of all the water on Earth. Which claim about Earth's water does the graph support?
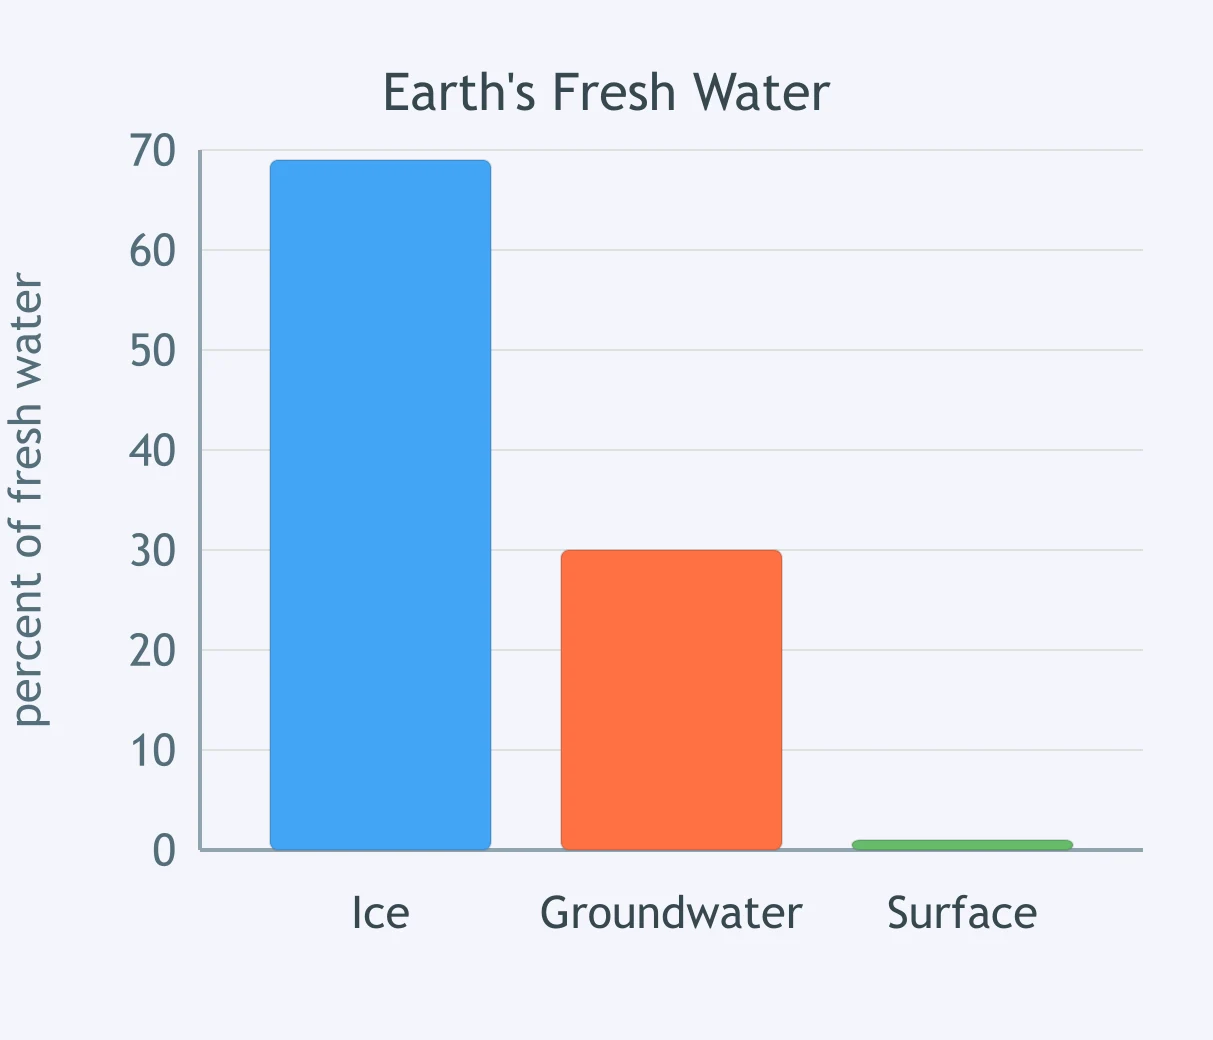
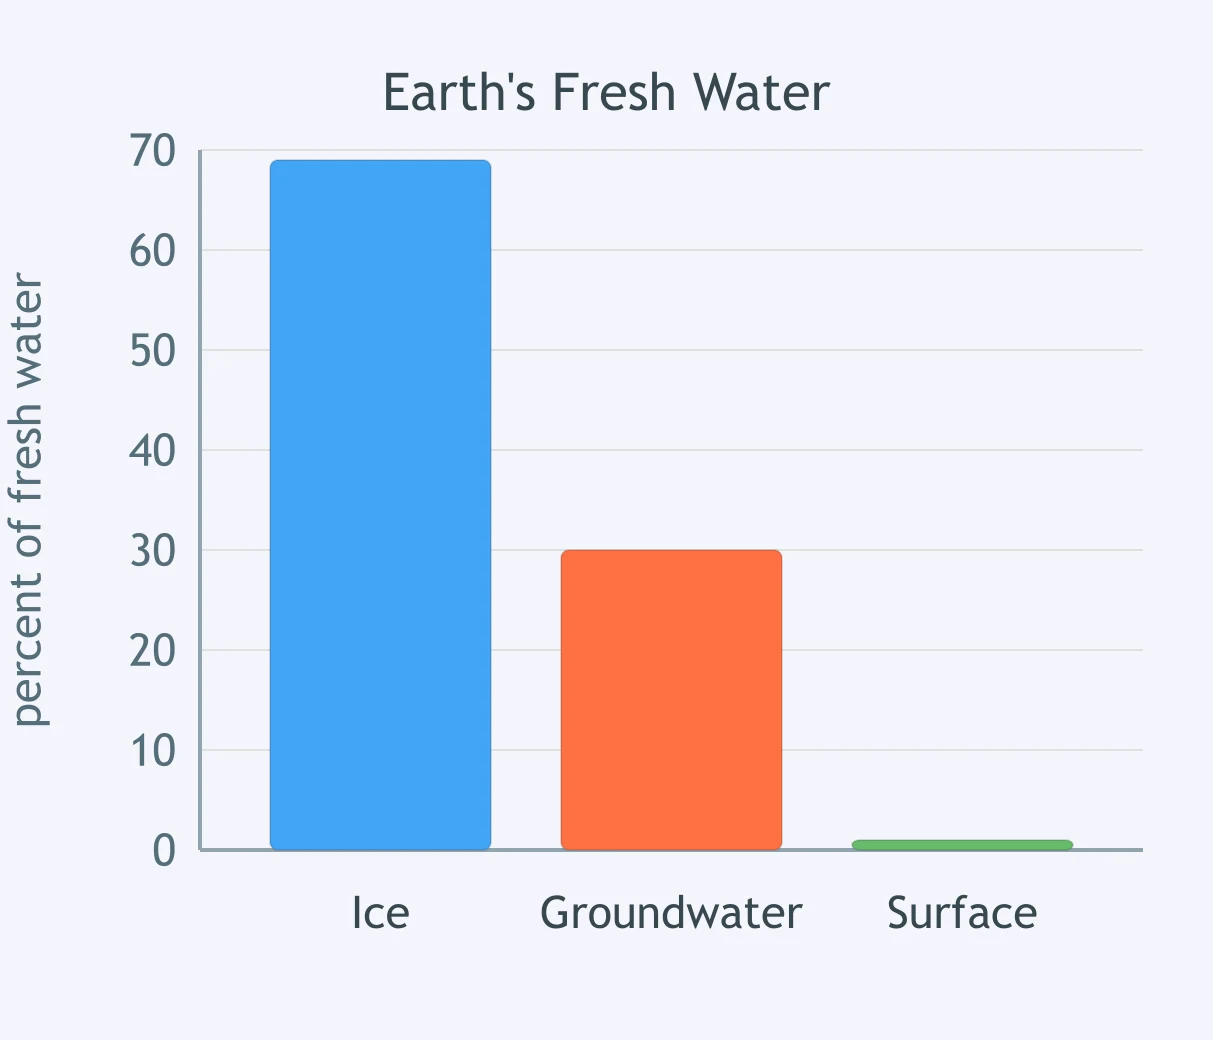
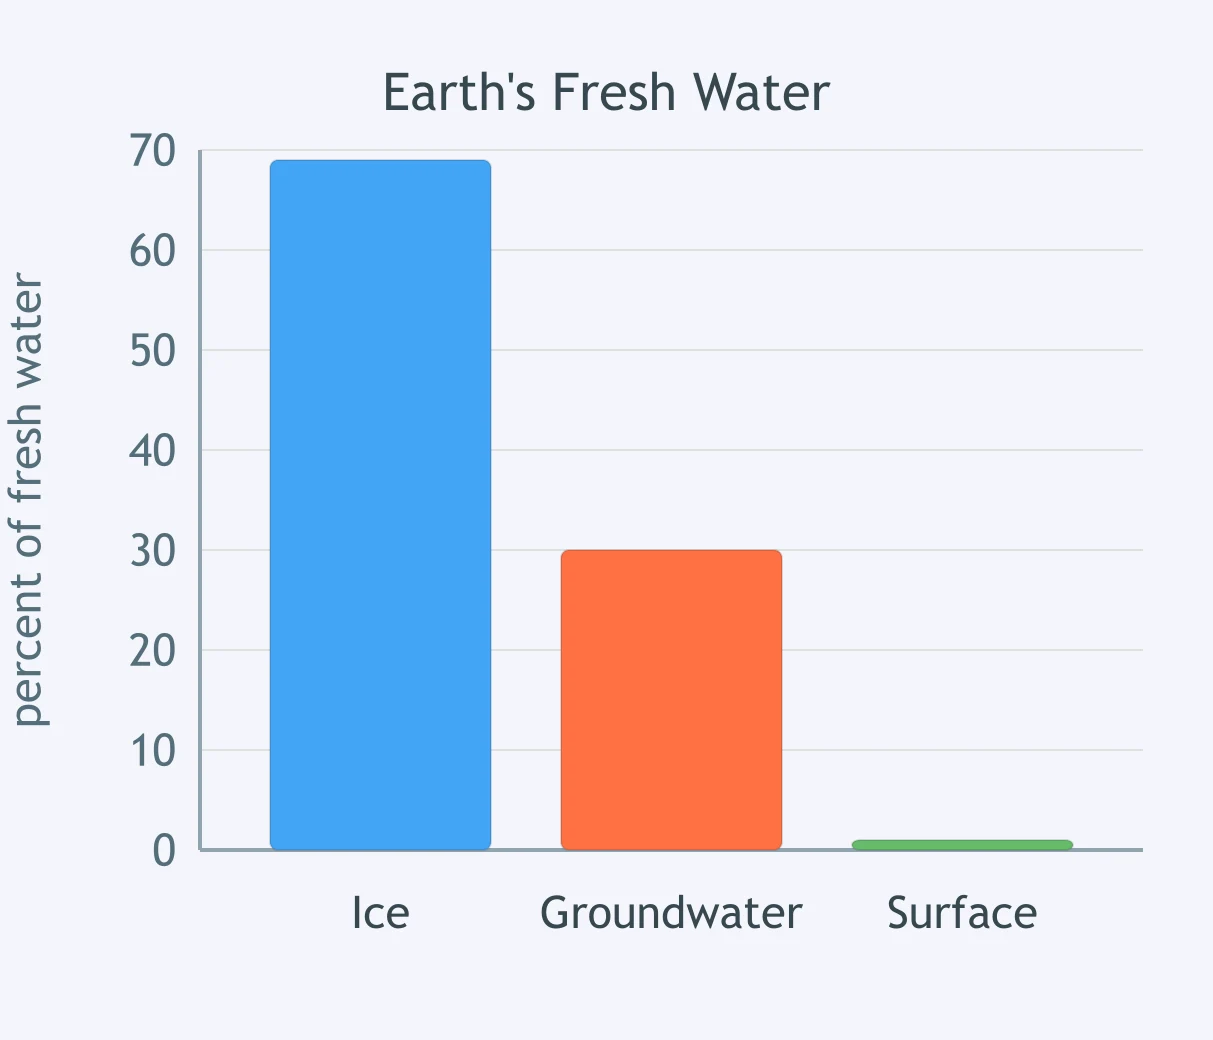
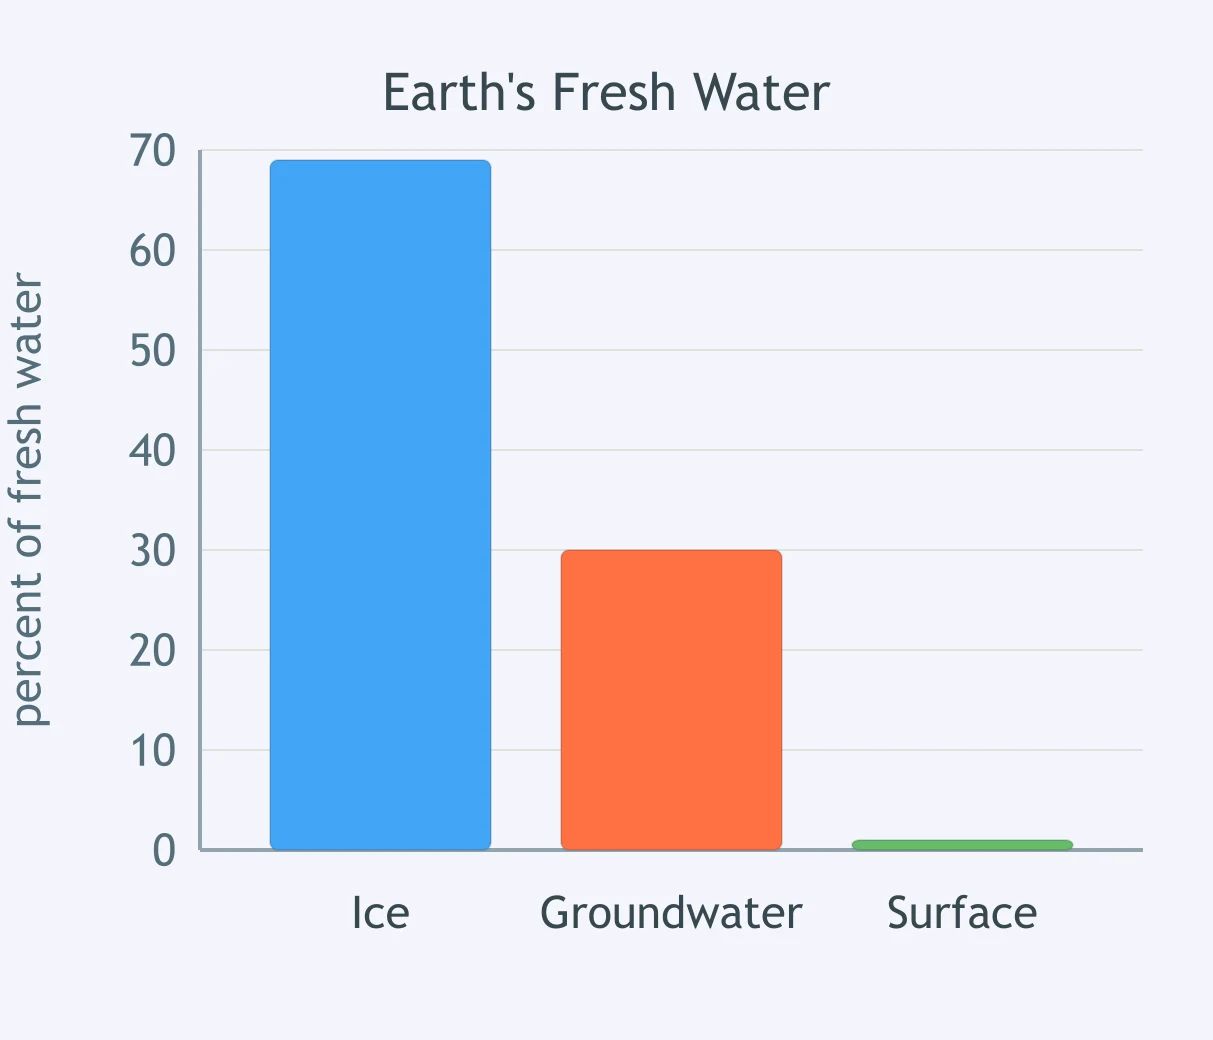
Look at the bar graph of Earth's fresh water. Which store of fresh water is the largest?
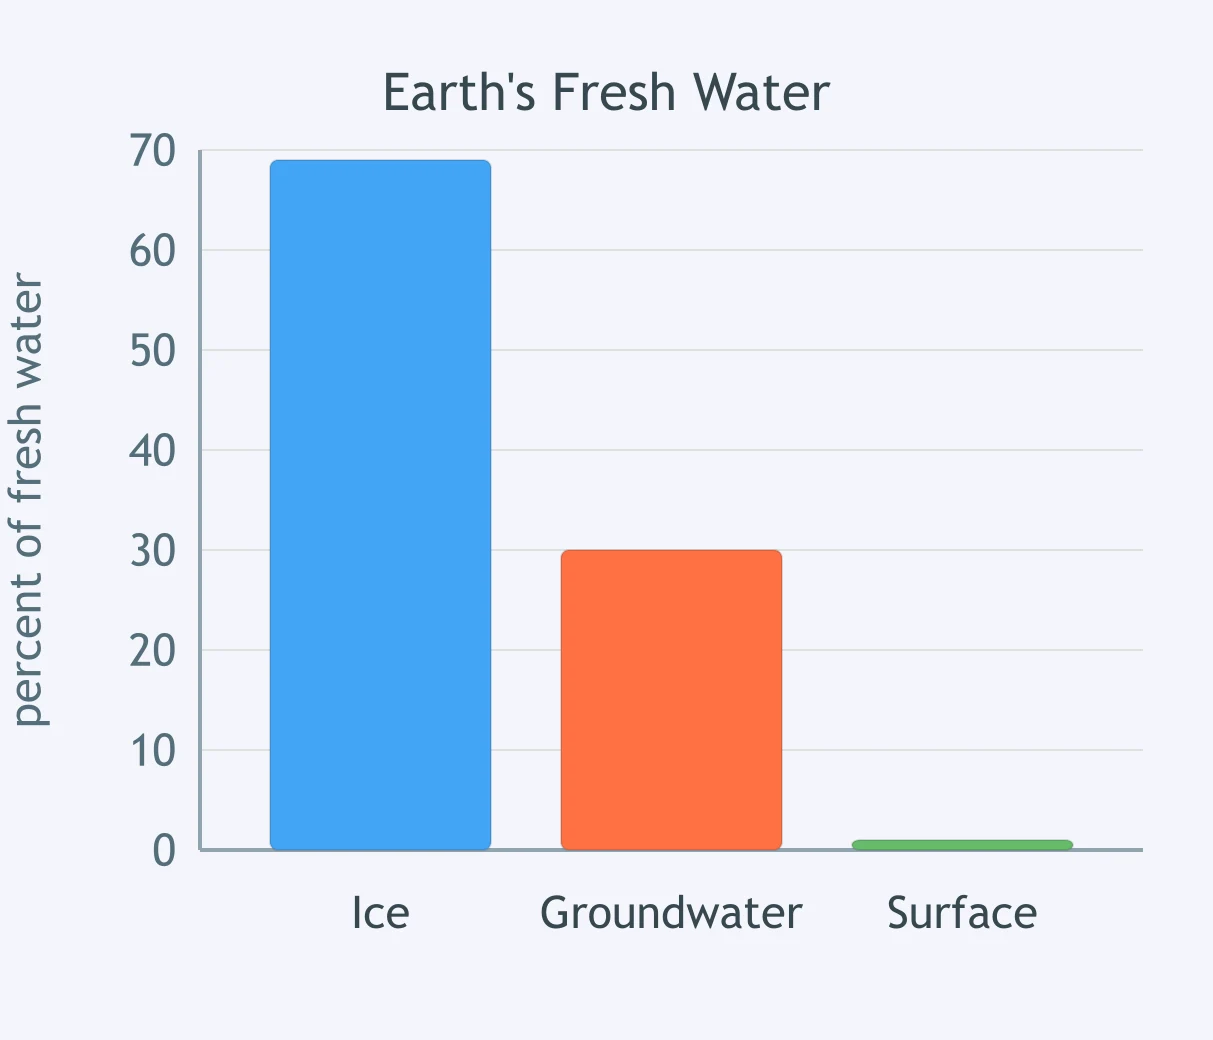
Use the bar graph of Earth's fresh water. About what percent of that fresh water is groundwater?
Look at the bar graph of all the water on Earth. About what percent of it is fresh water?
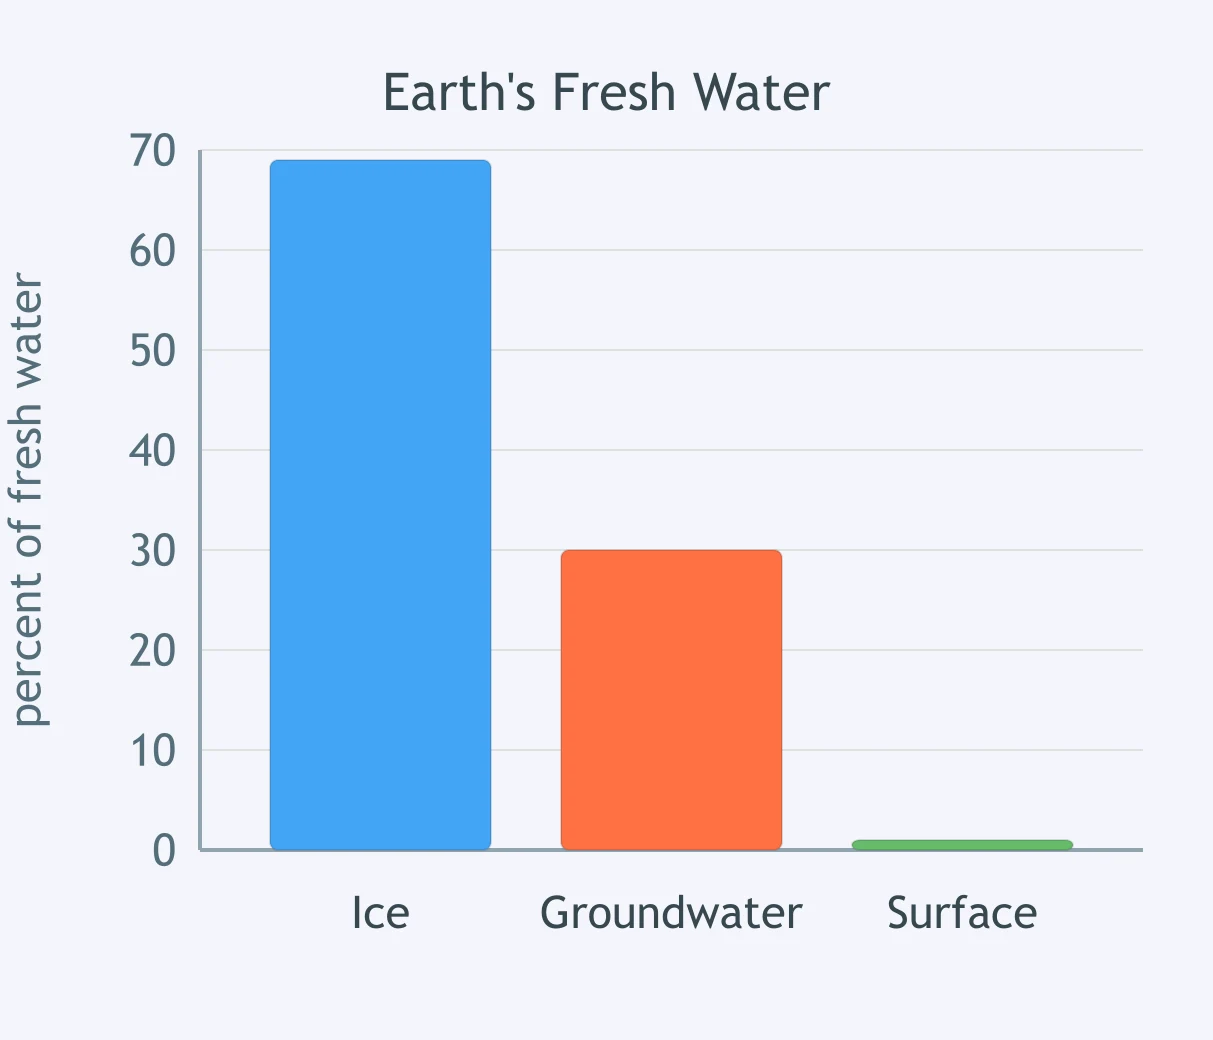
Use the bar graph of Earth's fresh water. Which claim does the graph support?
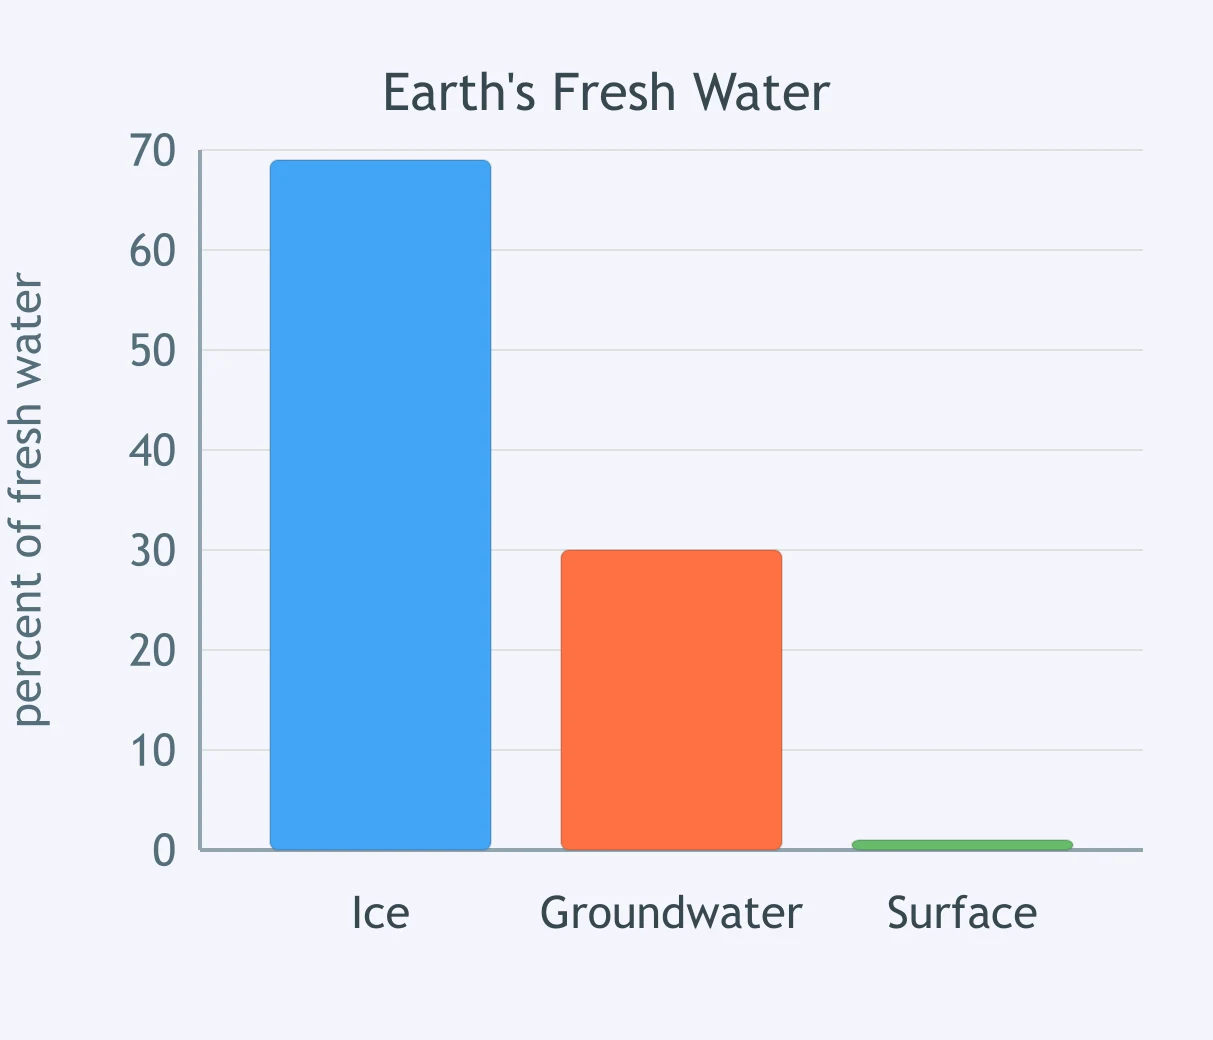
A student claims that people can use most of Earth's fresh water right away. Which measurement best shows that this claim is wrong?
During a dry summer a town limits lawn watering. Which fact about Earth's water best explains why the town must protect its supply?
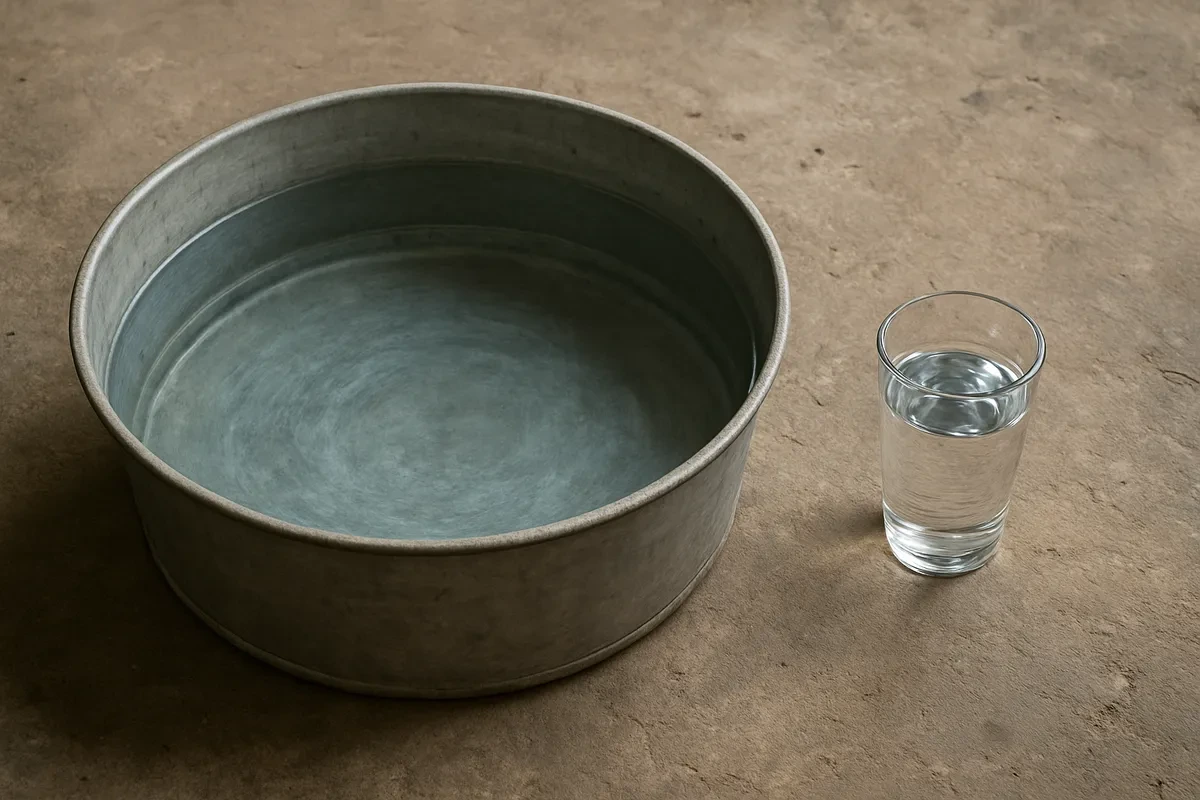
A class pours 100 mL of water to stand for all of Earth's water. About how much of it should they set aside to stand for the fresh water?
Glaciers and ice caps hold the most fresh water on Earth. Where is the next largest store of Earth's fresh water?
Water vapor in the air holds more of Earth's fresh water than all the glaciers and ice caps.
Groundwater is fresh water stored in spaces in the rock and soil below Earth's surface.
Look at the bar graph of all the water on Earth. A scientist collects one sample from the ocean and one from a glacier. Which claim about the two samples does the graph support?
Look at the bar graph of Earth's fresh water. Which claim does the graph support?
Look at the bar graph of Earth's fresh water. About what percent of it is held in rivers, lakes, soil and the air?
A model uses 1,000 mL for all of Earth's water. About 30 mL is fresh, and about 20 mL of that fresh water is frozen. What does the model show?
Look at the bar graph of Earth's fresh water. About what percent of it is frozen in glaciers and ice caps?
Look at the bar graph of all the water on Earth. A town wants to draw its drinking water from the largest store shown. Why will that not work?
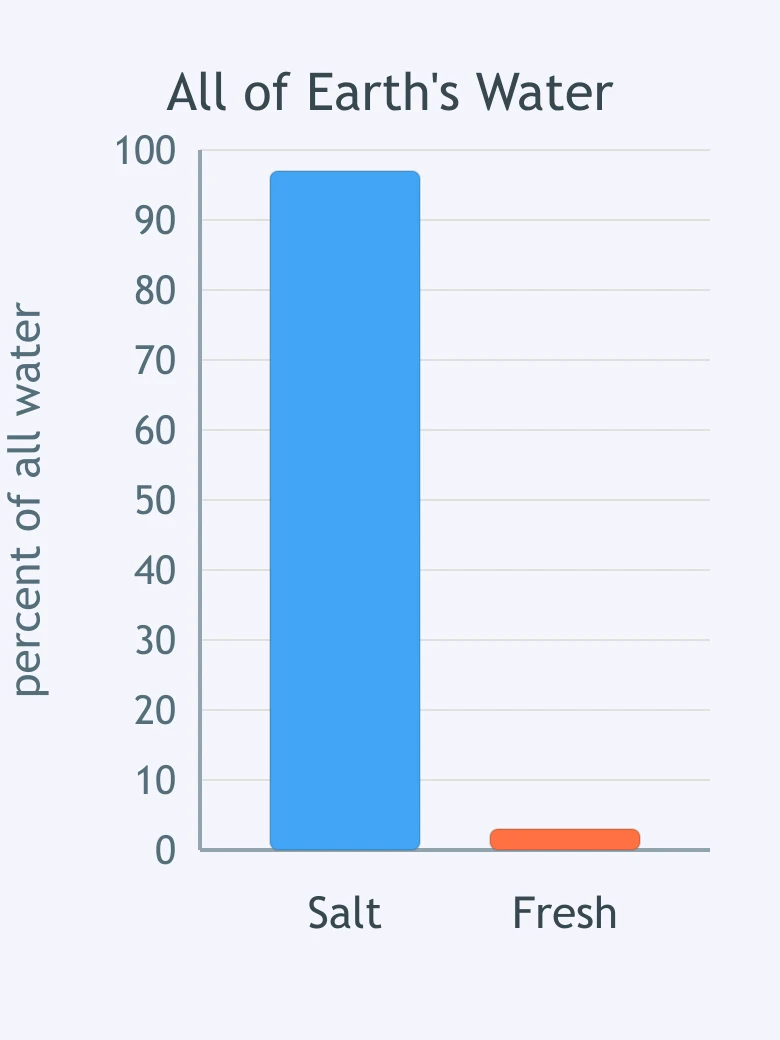
Use the bar graph of Earth's fresh water. A student says the rivers and lakes people use every day hold most of Earth's fresh water. What does the graph show about that claim?
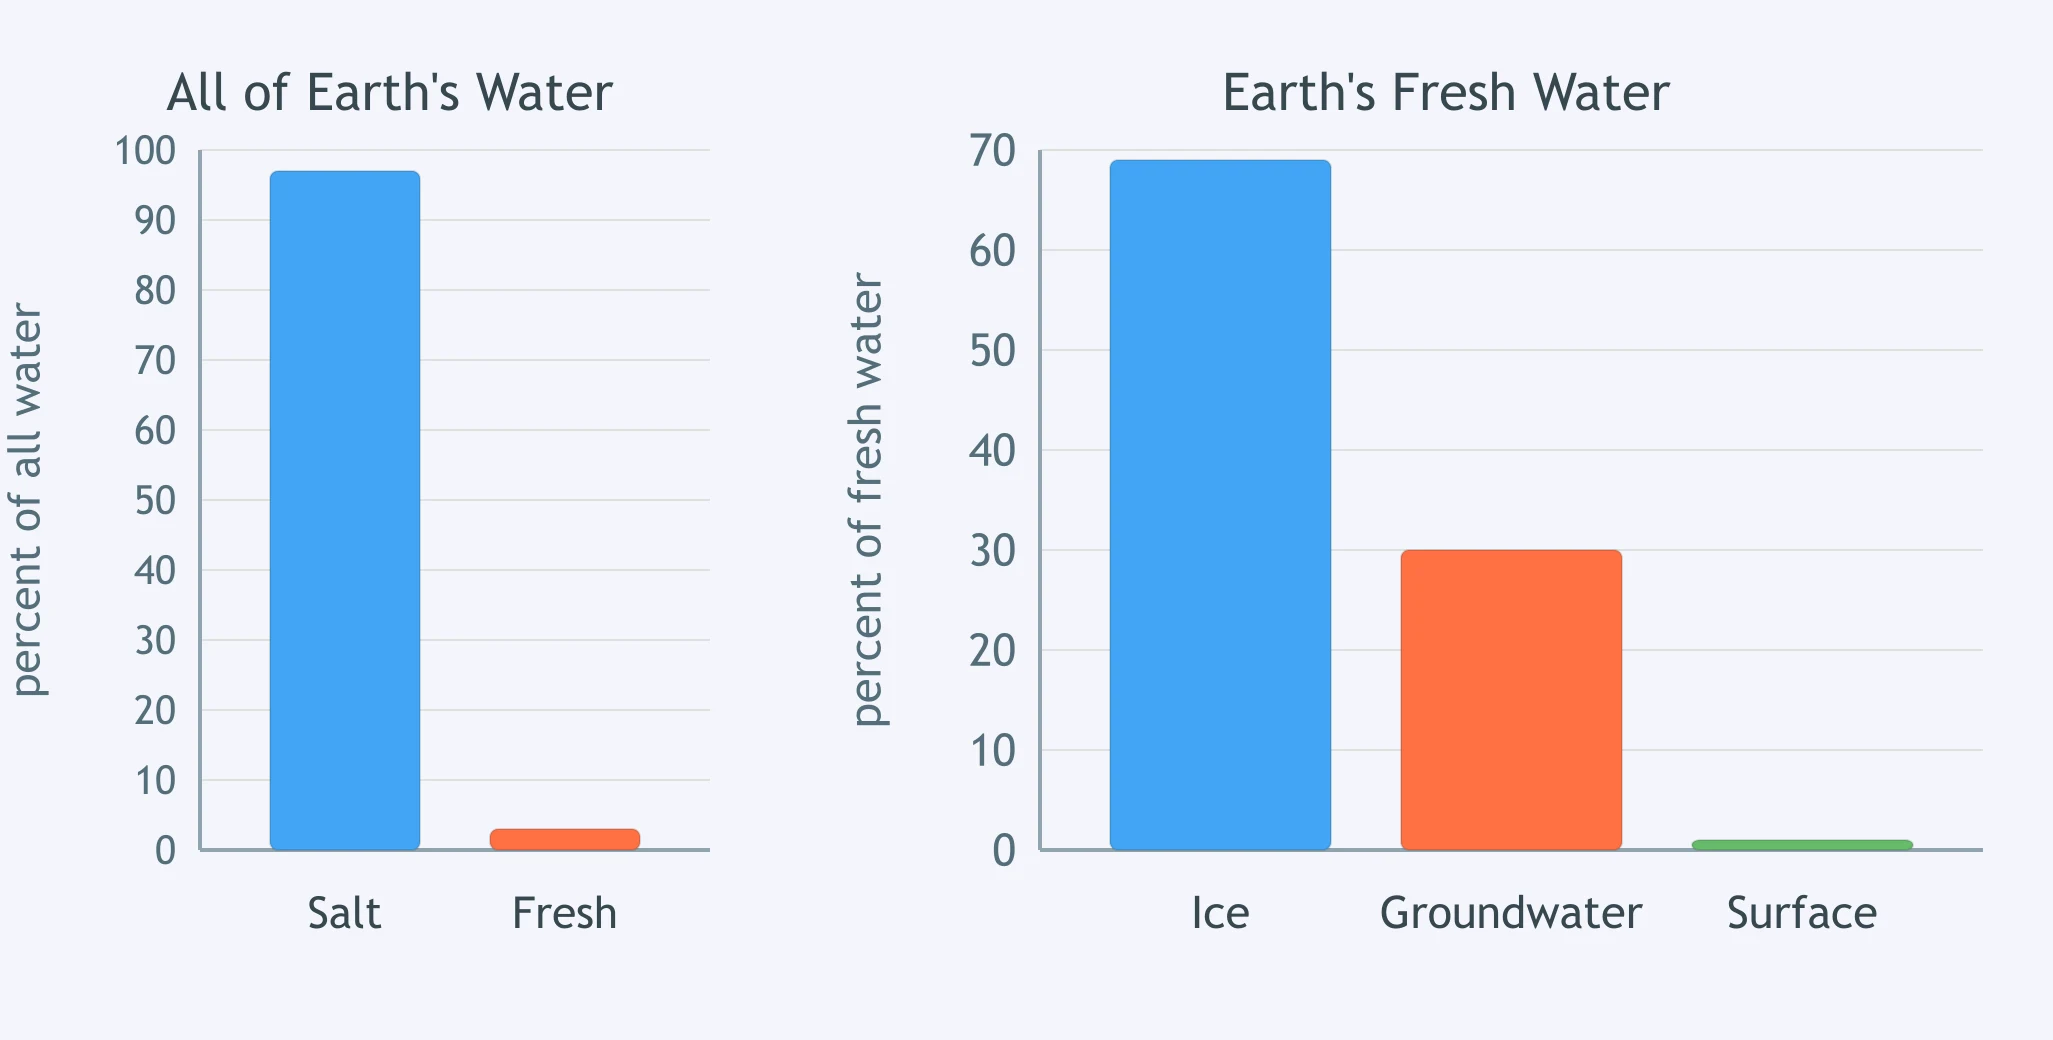
Look at the bar graph of all the water on Earth, then at the bar graph of Earth's fresh water. Which statement uses both graphs correctly?
Crack the passcode before the zombies get in.

Pick a tile, answer, hit bonuses and steals.
Weighing Community Resource Choices
20 questions