Loading
by BlastRoom
Build and read tables and graphs using repeated trials and means.
#us_grade_7_science
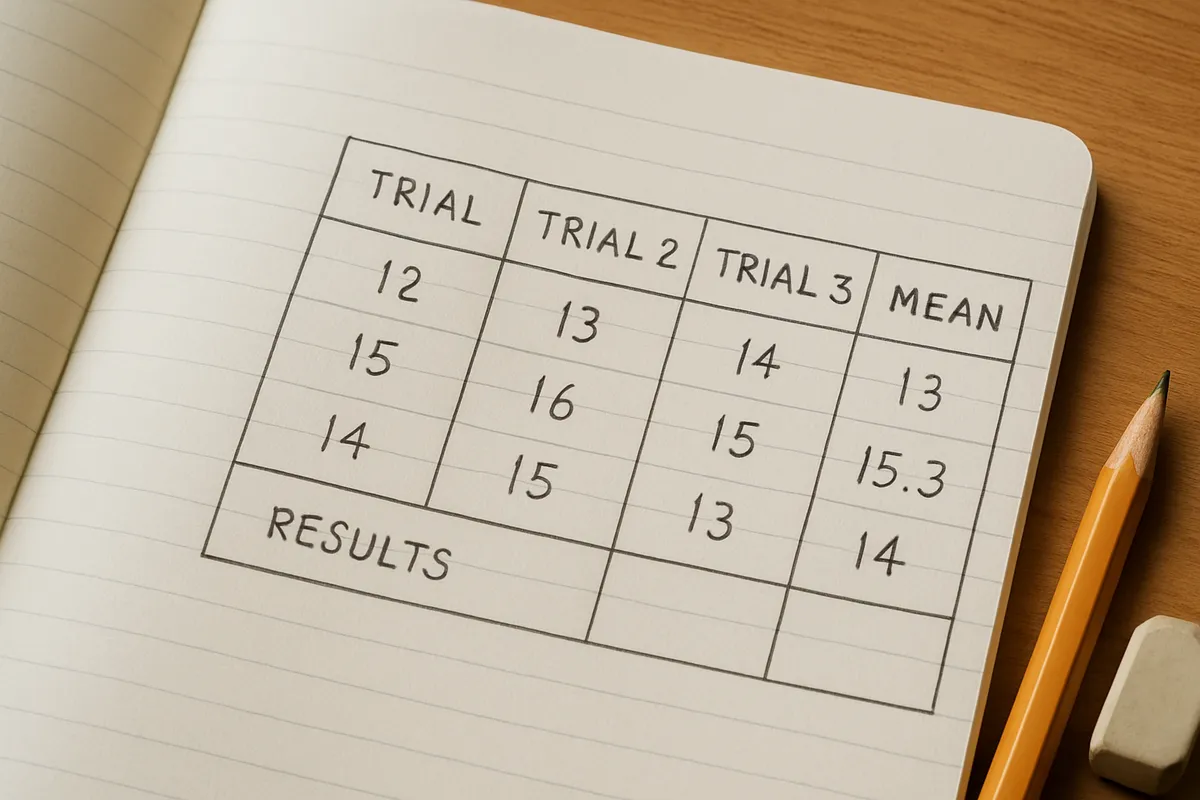
40 questions
One question set, multiple game modes. Tap any game to see it in action. Not sure which to pick?
Answer to place stones and capture territory.
Outrun the snow together.
Earn blasts, then hunt the other team.
Answer to earn energy, then climb.

The class blasts through walls together.
Bid on mystery lots. Most money wins.
Sell tours. Nice, standard, or a total scam.

Answer, restock, and serve the rush.
More correct answers pulls the rope your way.
Answer, then shoot down the alien wave.
Answer, then tap to leap the frozen ridge.
Use the table of car-distance trials. What mean distance should the class report?
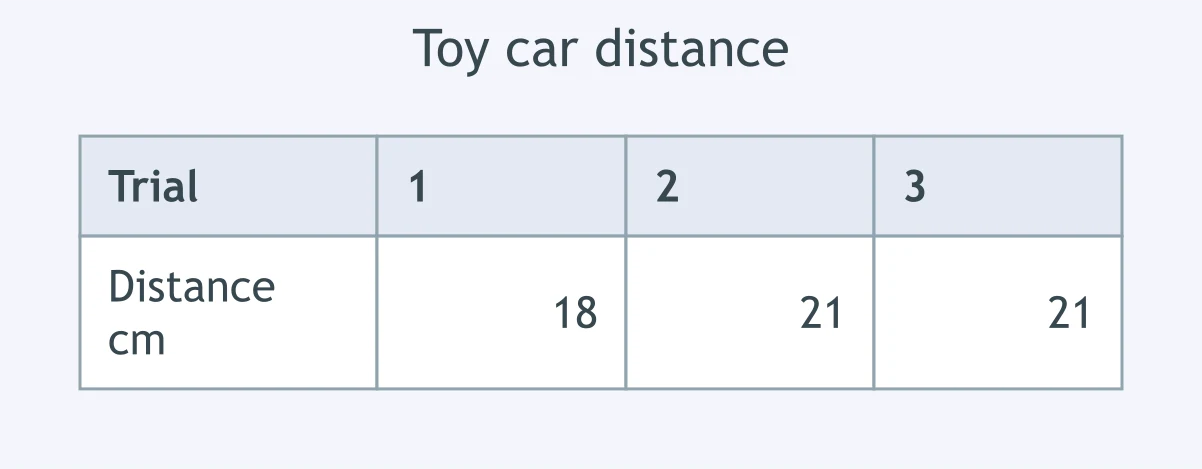
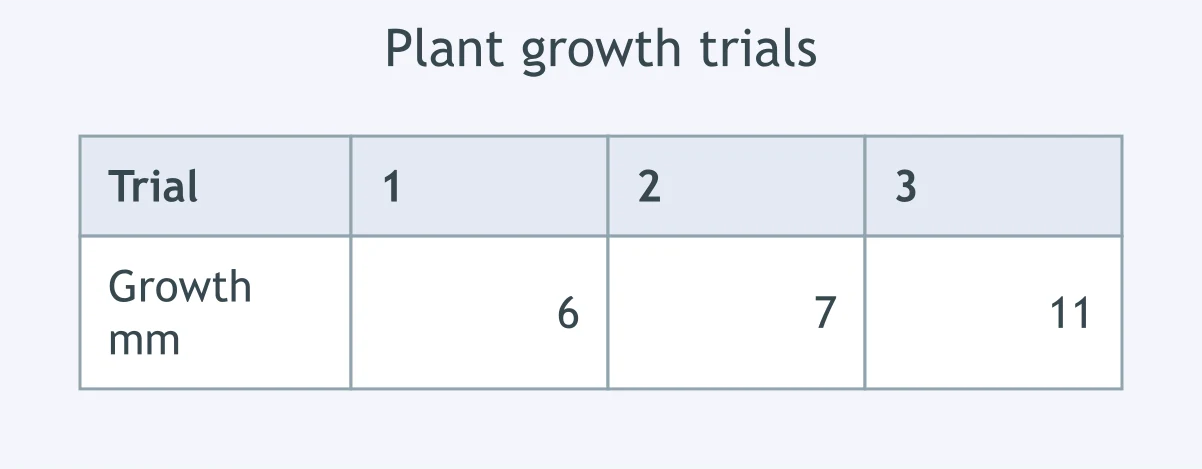
The table shows three growth trials for the same plant treatment. What is the mean growth?
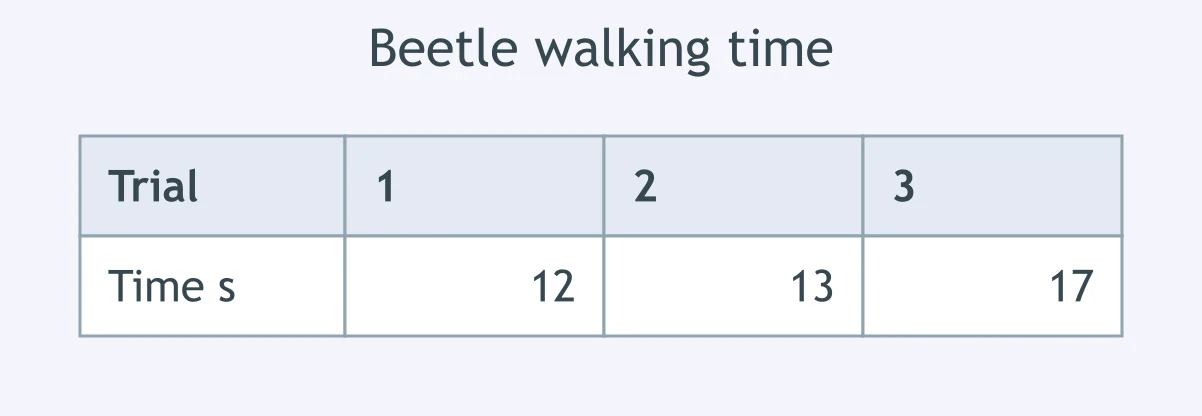
Use the beetle-time trial table. What mean time should be recorded?
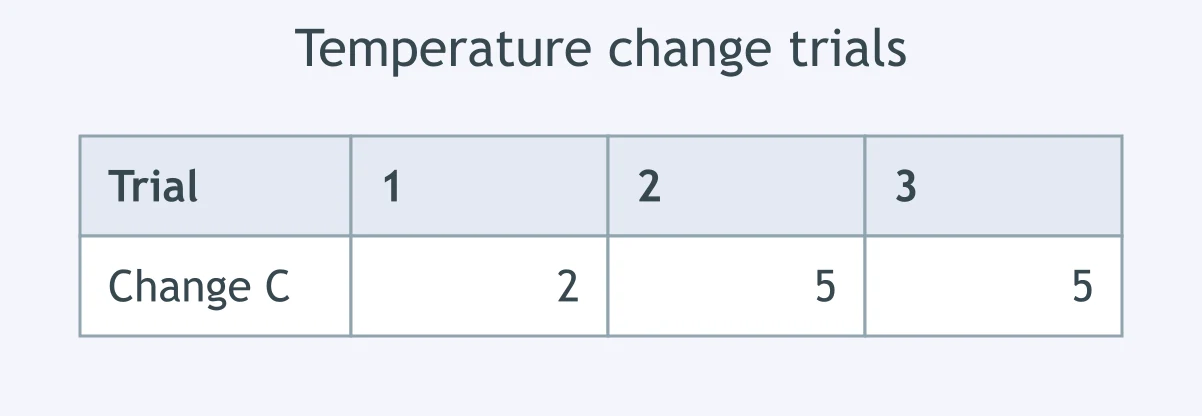
A table lists three temperature-change trials. What is the mean temperature change?
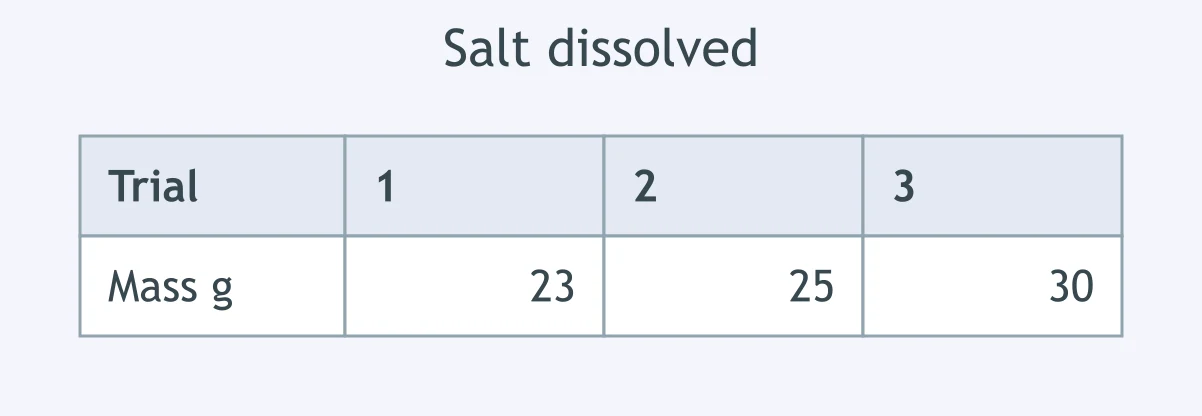
Use the table of salt-dissolving trials. What mean mass dissolved?
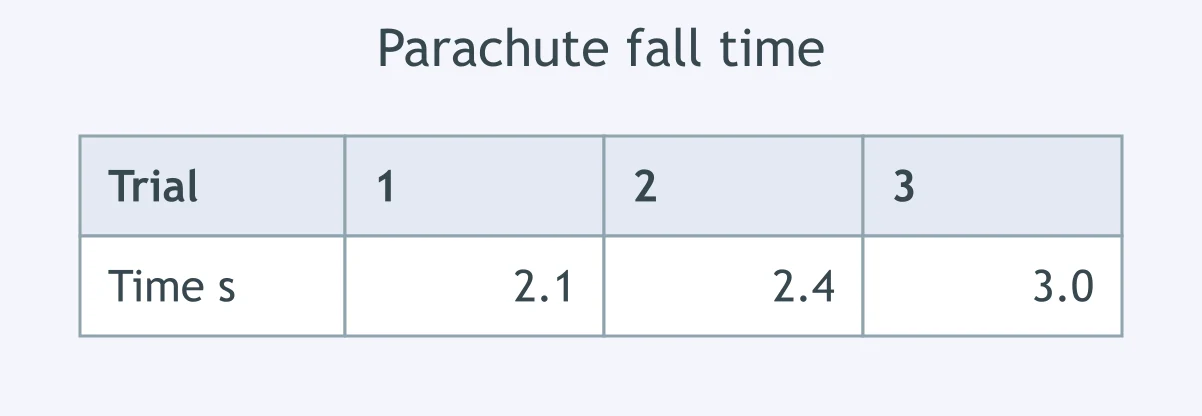
The table gives three parachute fall times. What is the mean fall time?
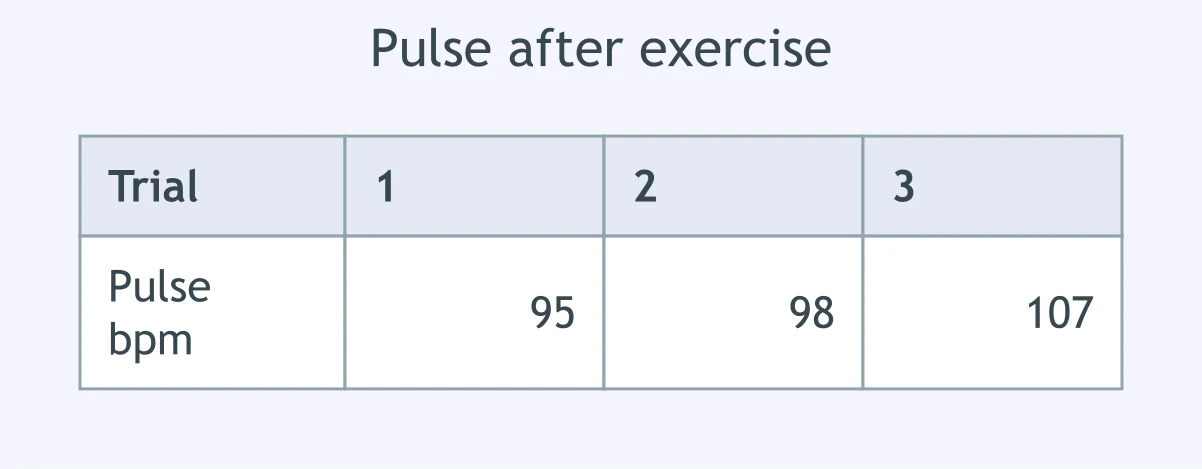
Use the pulse-rate trial table. What mean pulse rate should be graphed?
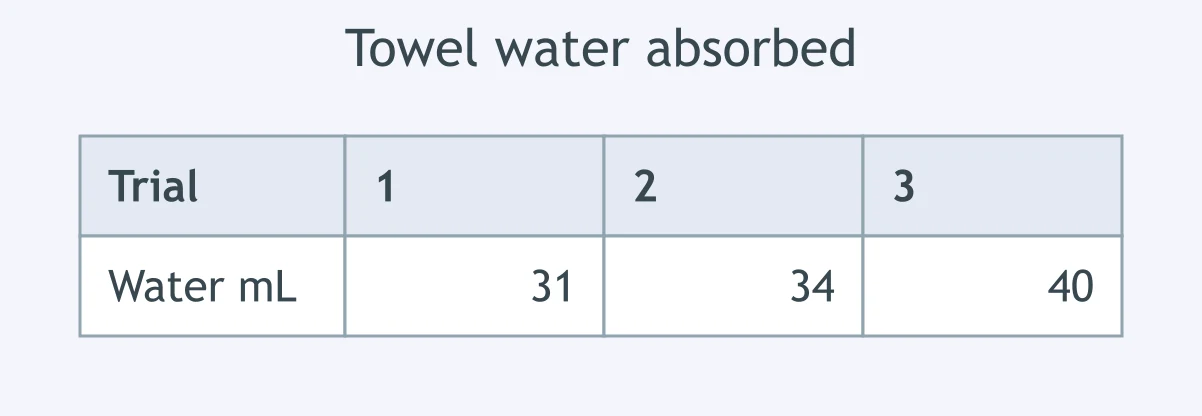
The table shows water absorbed by a towel in repeated trials. What is the mean amount absorbed?
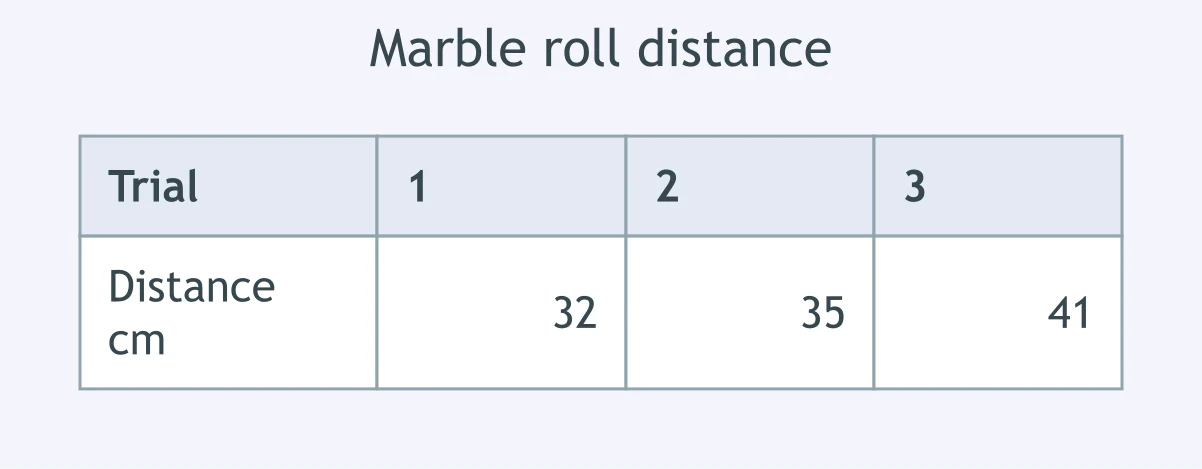
Use the marble-distance trials. What mean distance should the students report?
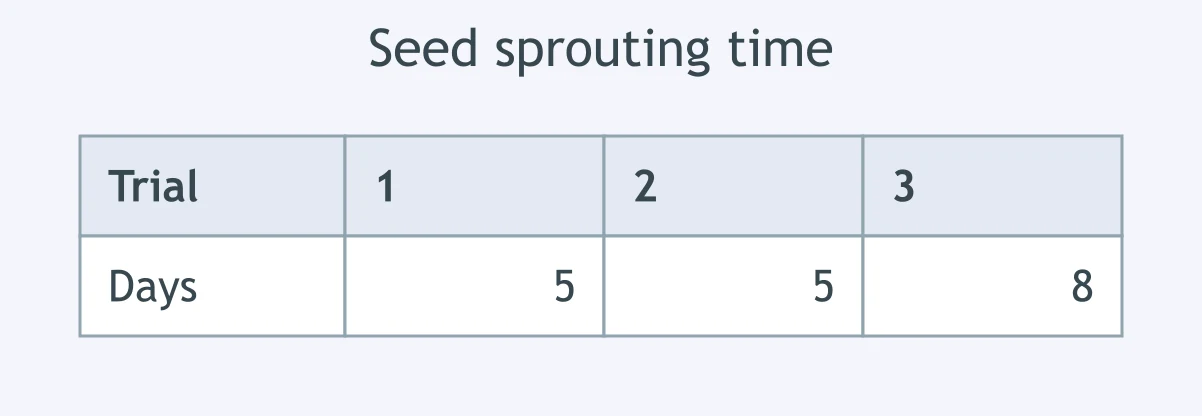
The table records days until seeds sprouted in three trials. What is the mean sprouting time?
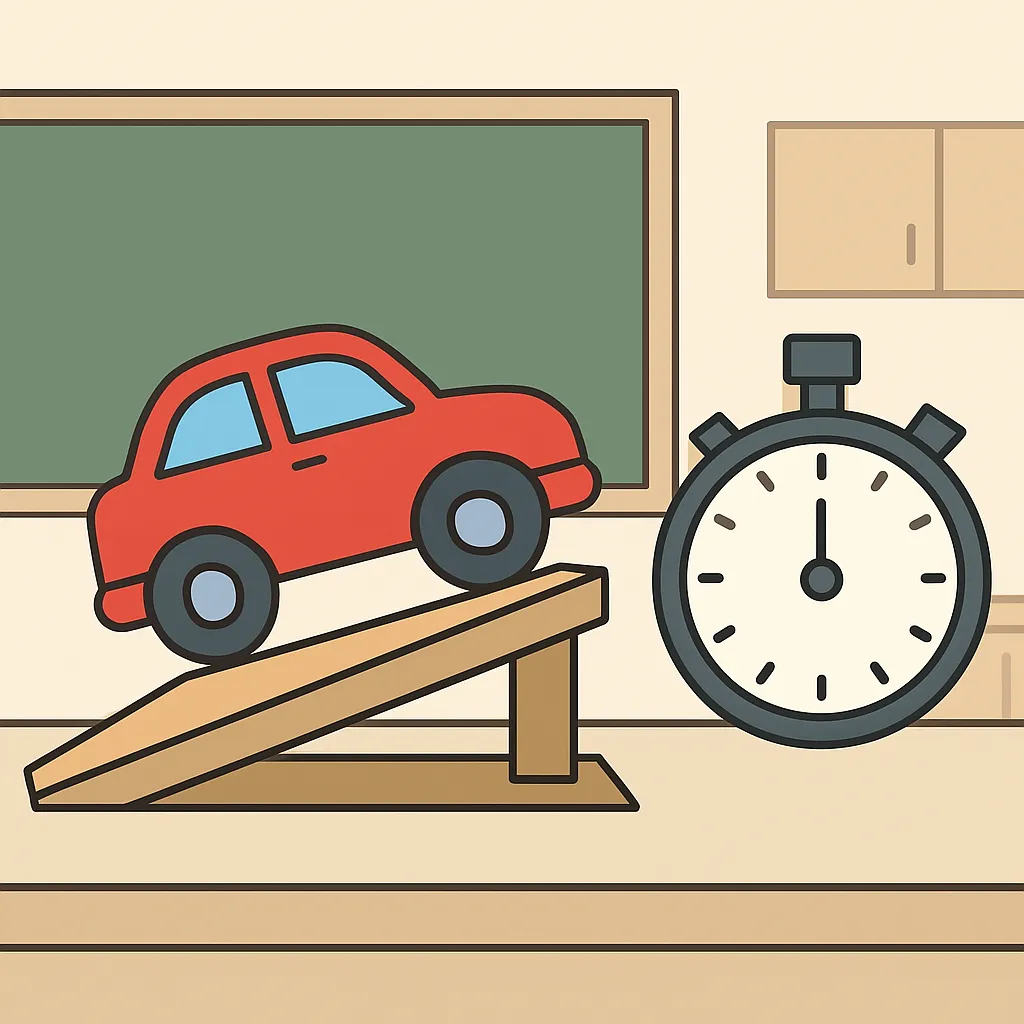
Students time a cart at each ramp height several times. What table layout should organize the trials and mean?
Bean plants get different fertilizer amounts, and height is measured in repeated trials. What layout makes the data useful?
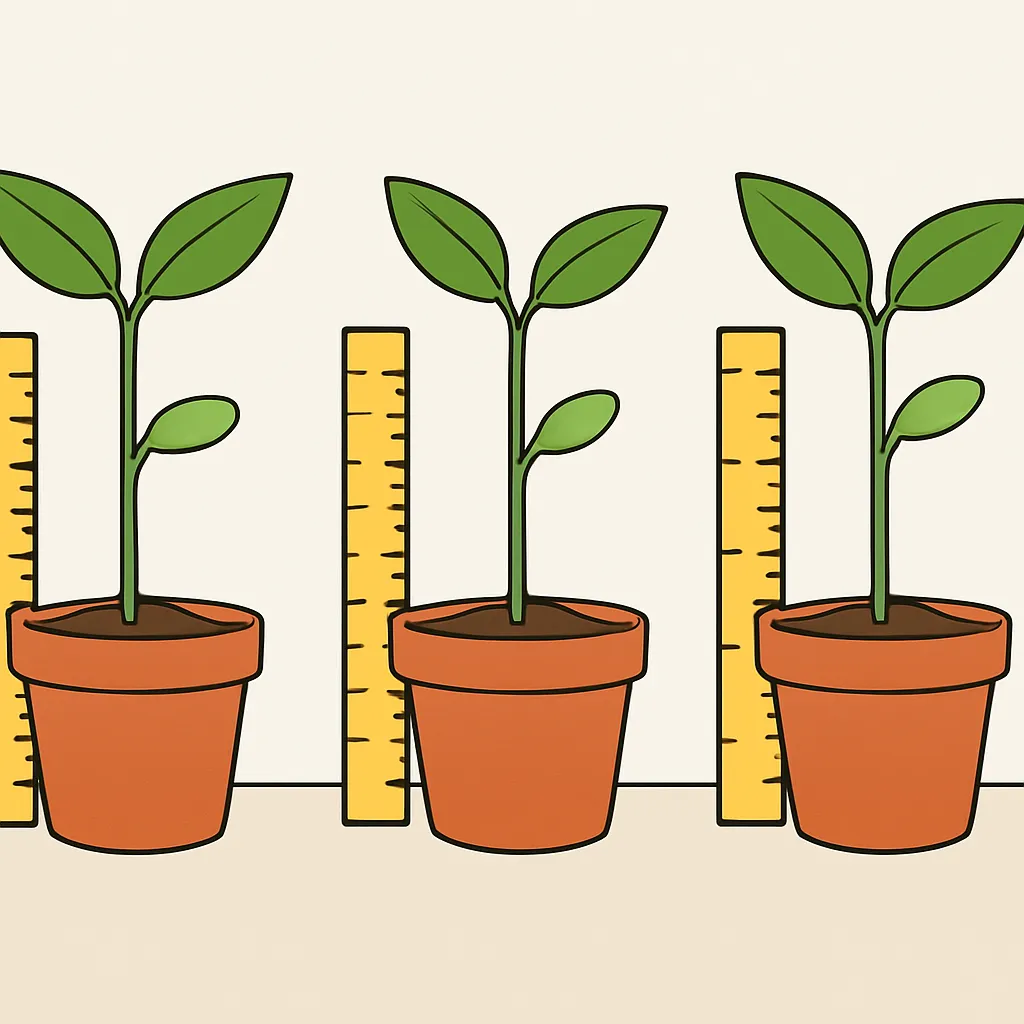
A class tests insulating materials and records water temperature three times for each material. What table structure fits?
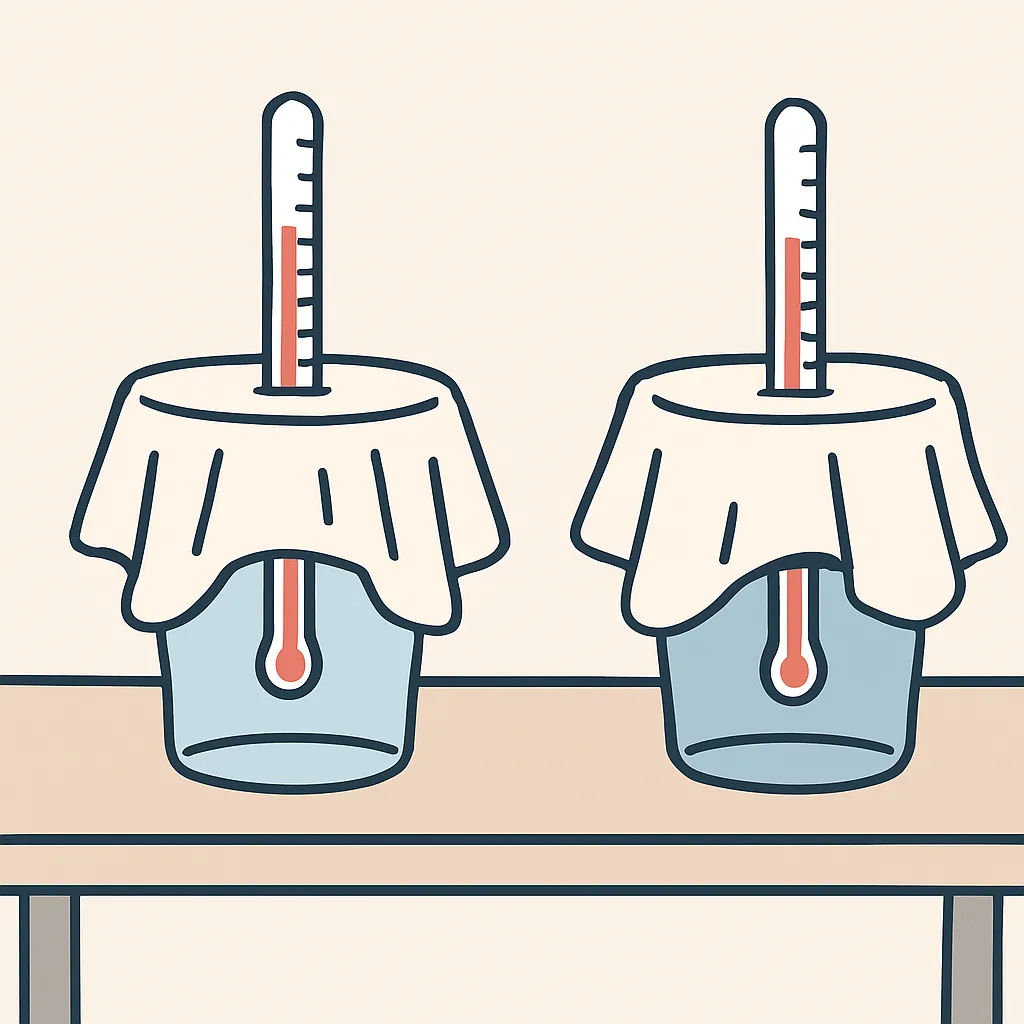
Students count bubbles from a pond plant under red, yellow, and blue light, with three trials for each color. What should they compare to decide which color gives the most bubbles?
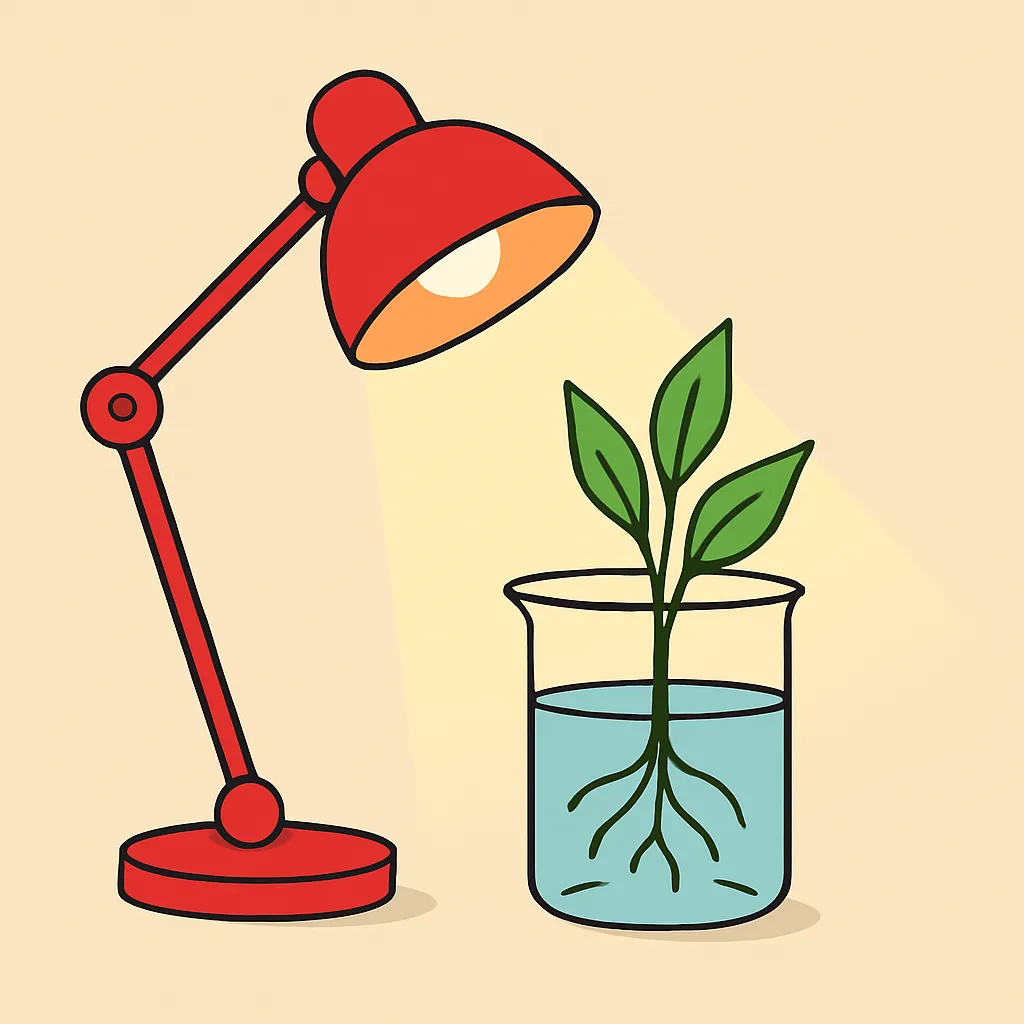
Soil samples are tested for water drained at several soil types. How should repeated-trial data be arranged?
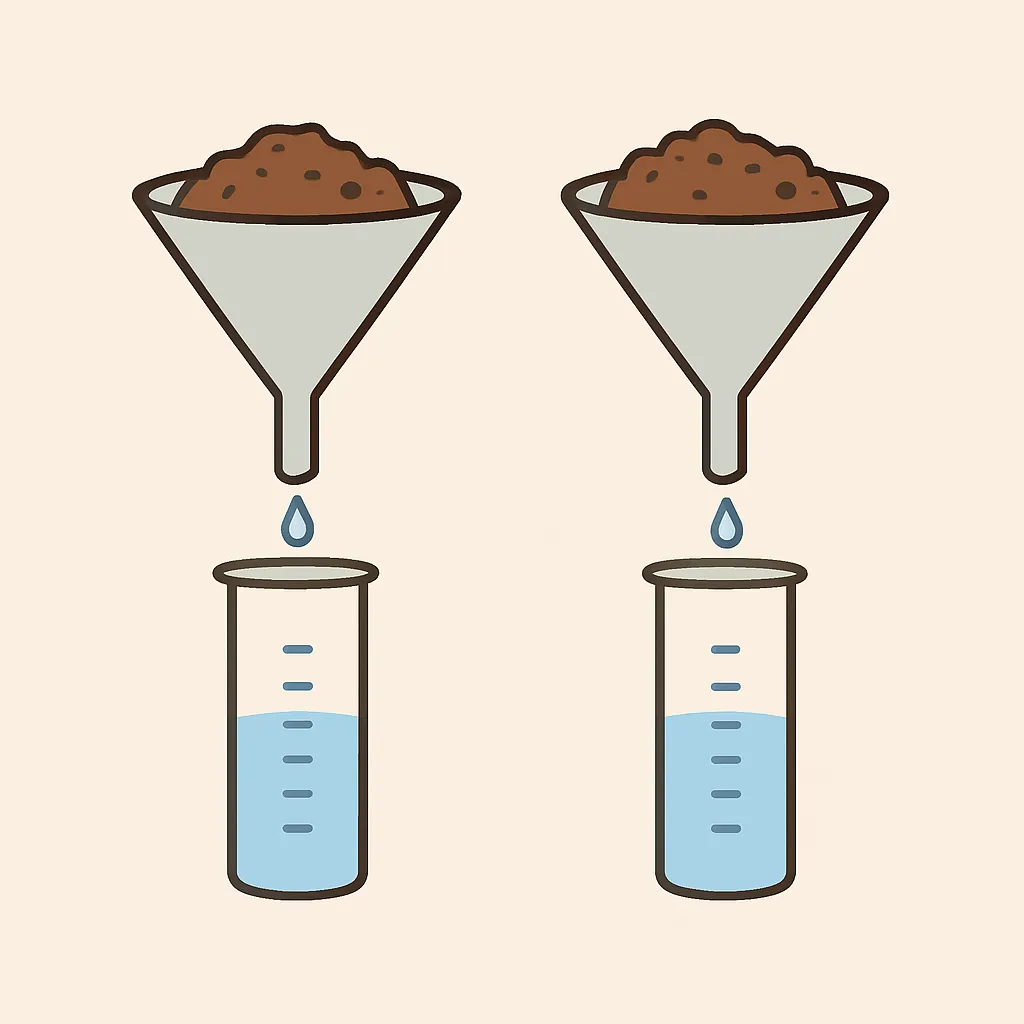
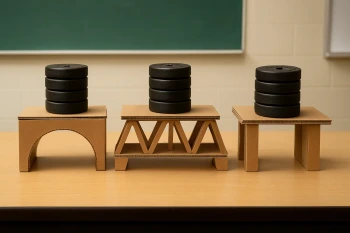
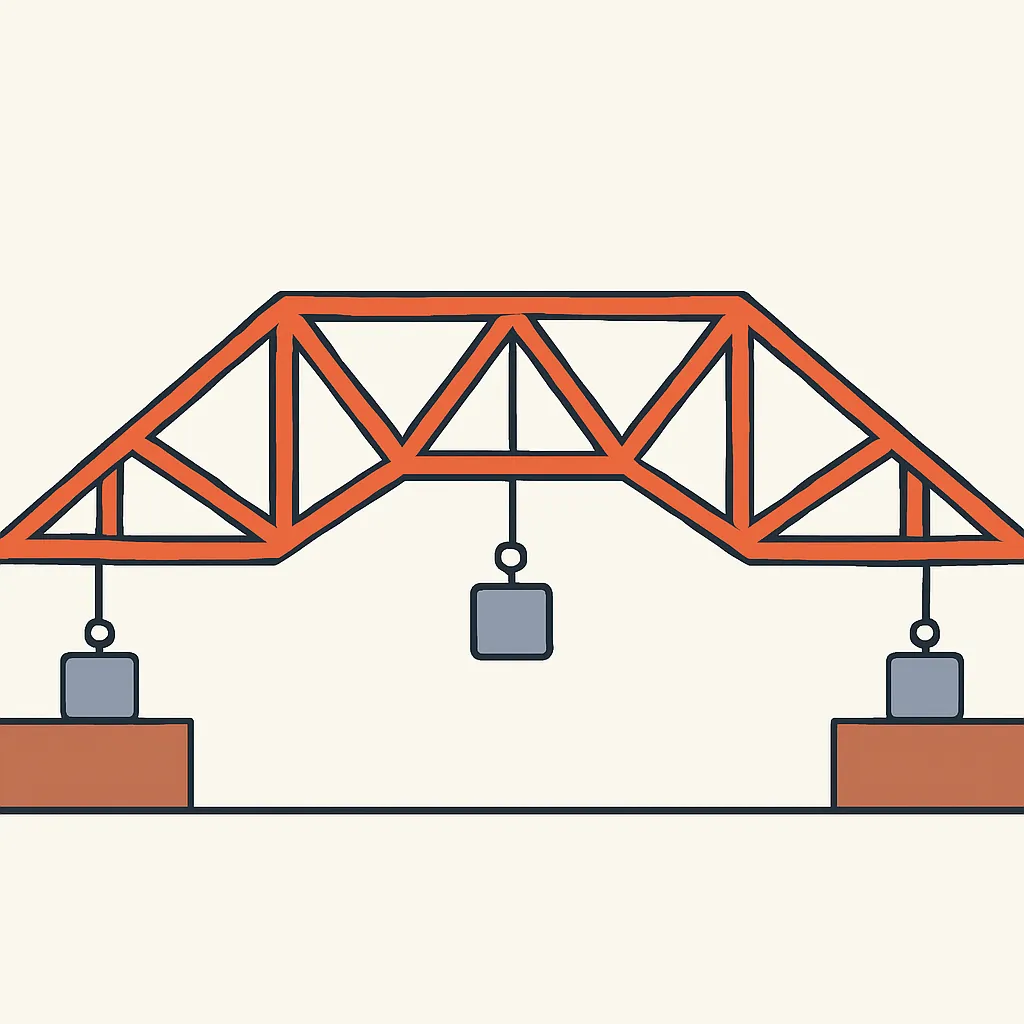
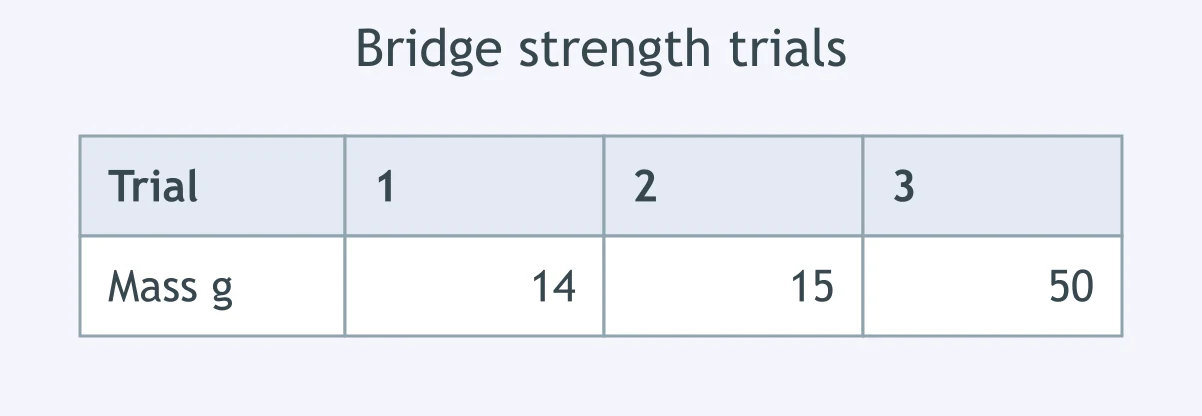
Teams test bridge designs by measuring mass held in repeated trials. What data table is most useful?
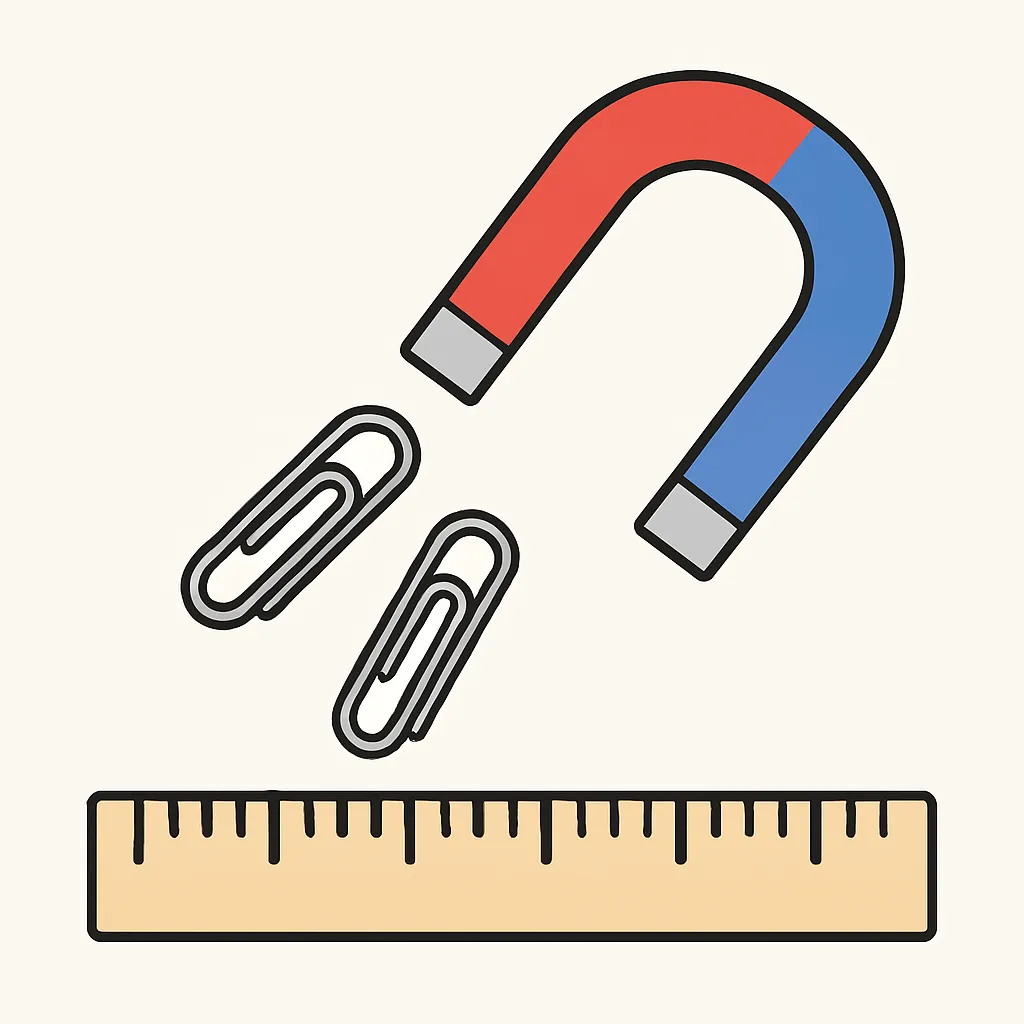
Students test how magnet distance affects paper clips picked up. What table should they build?
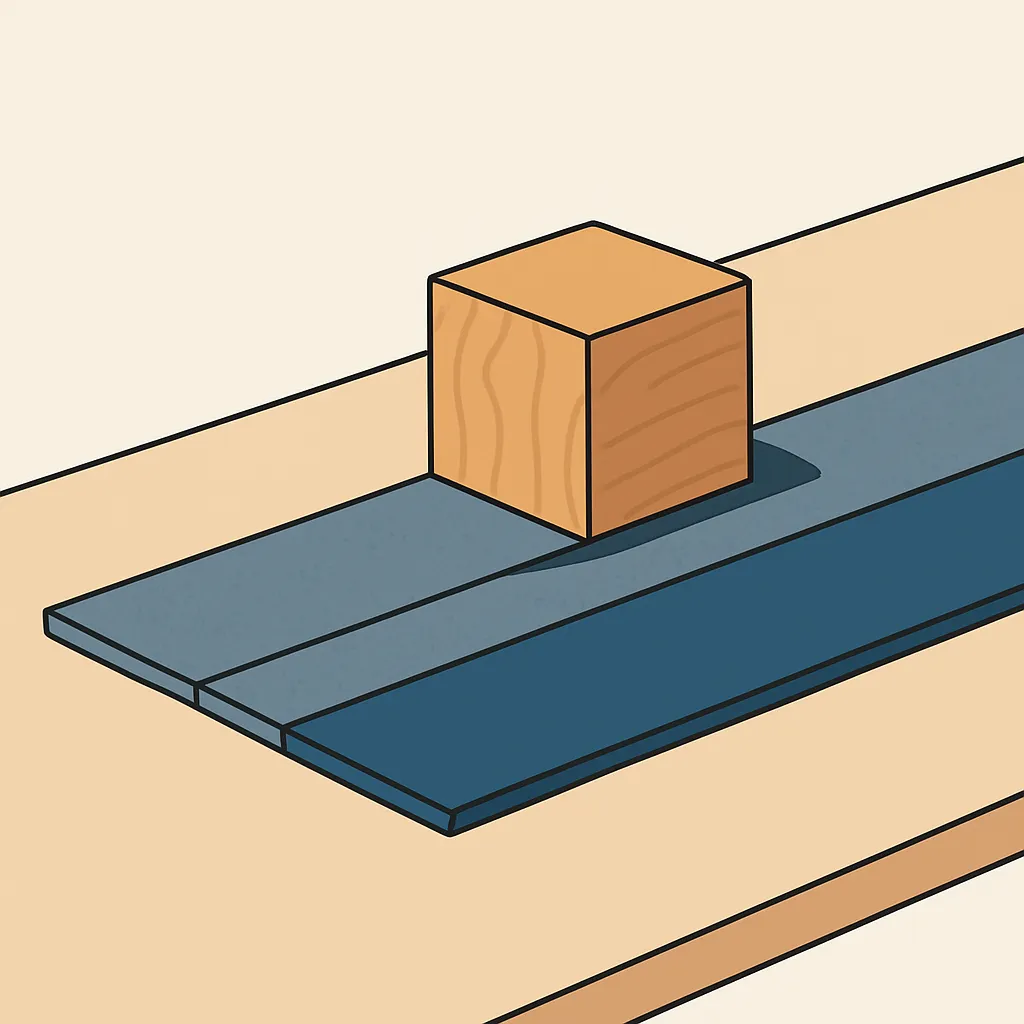
A sliding block is tested on different surfaces with repeated distance measurements. What table layout fits the investigation?
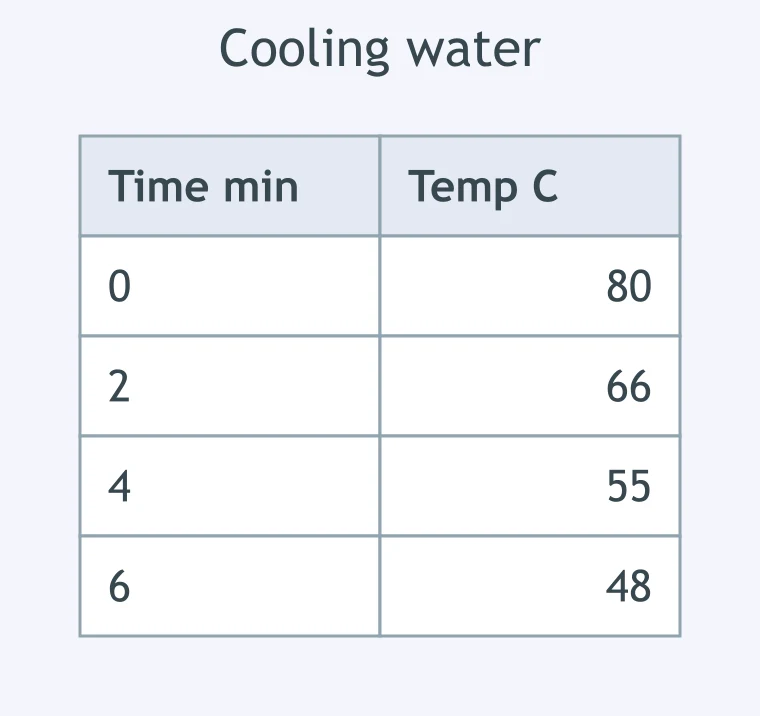
The table shows water temperature during cooling. What graph setup best displays this change over time?
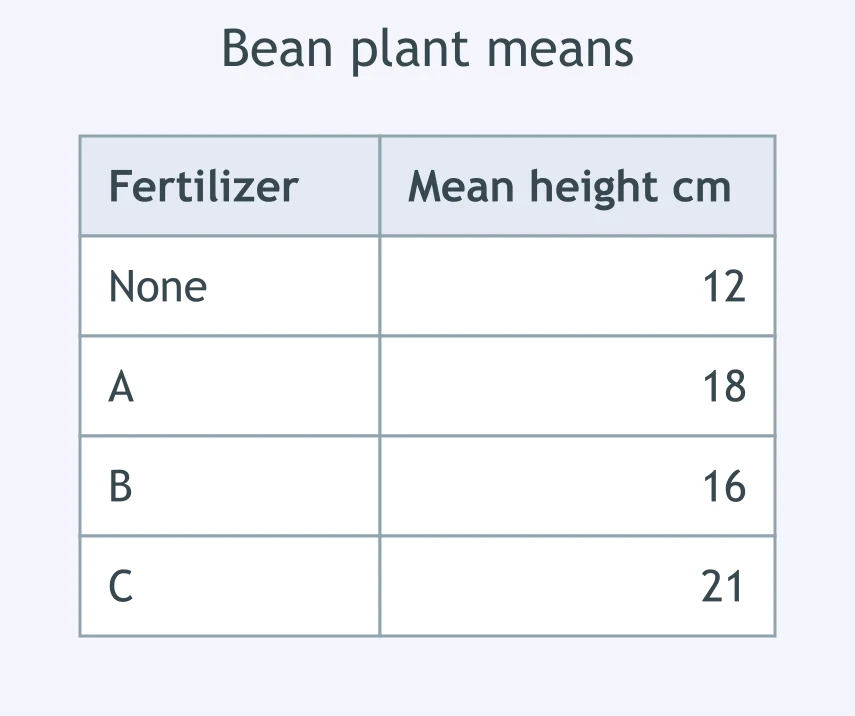
The table compares mean plant height for fertilizer types. What graph should present the results?
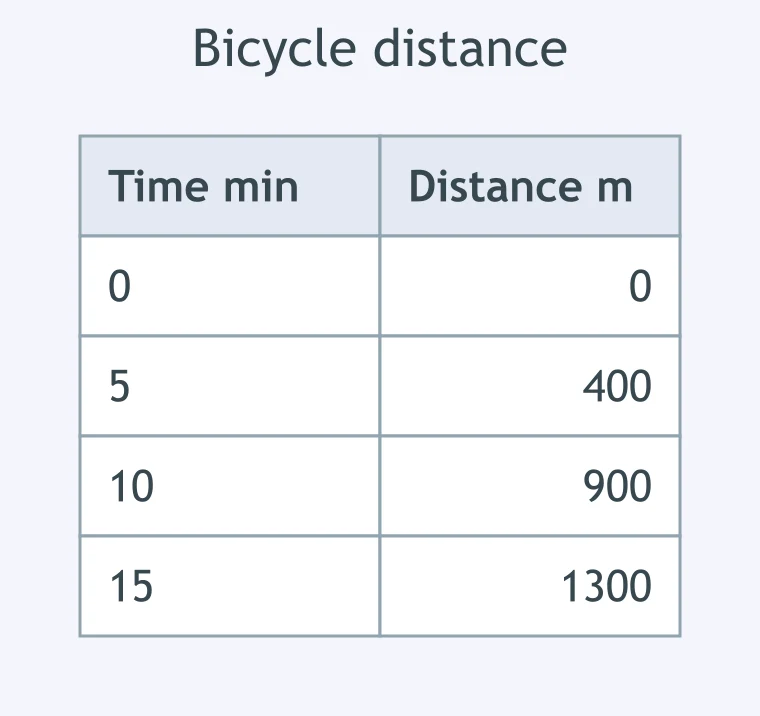
The table records bicycle distance at several times. What axis setup should be used?
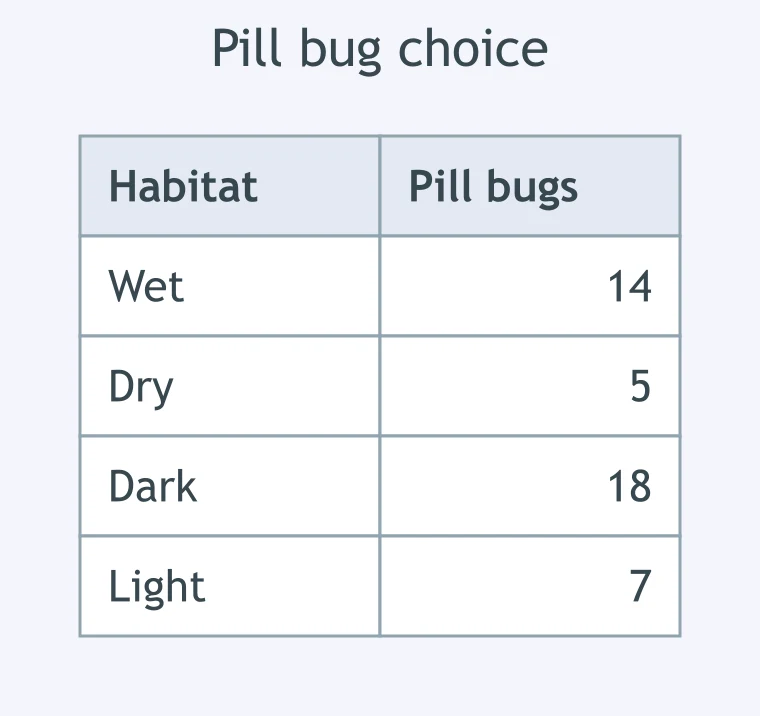
The table gives pill bug counts in different habitats. What graph type best compares the habitats?
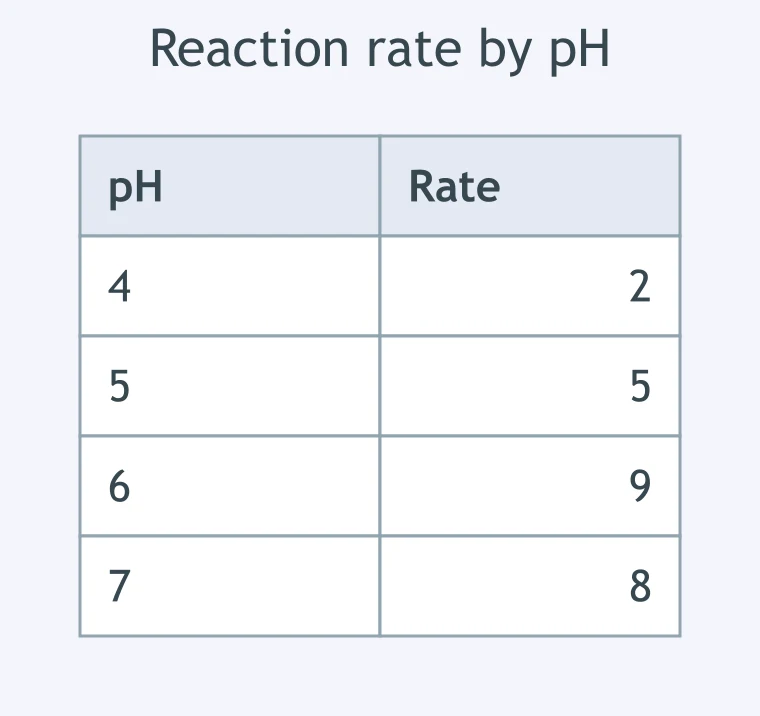
The table shows reaction rate at different pH values. What graph setup best shows the relationship?
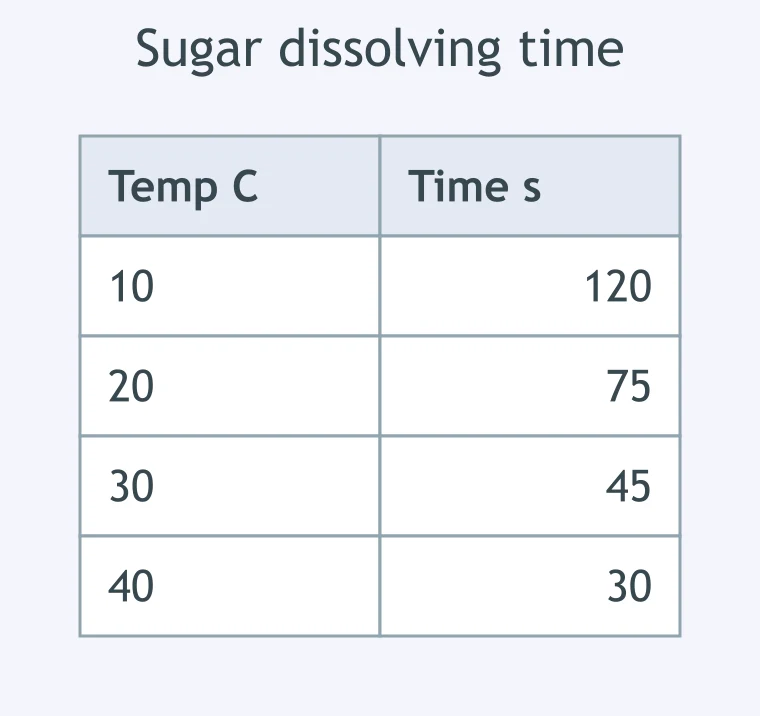
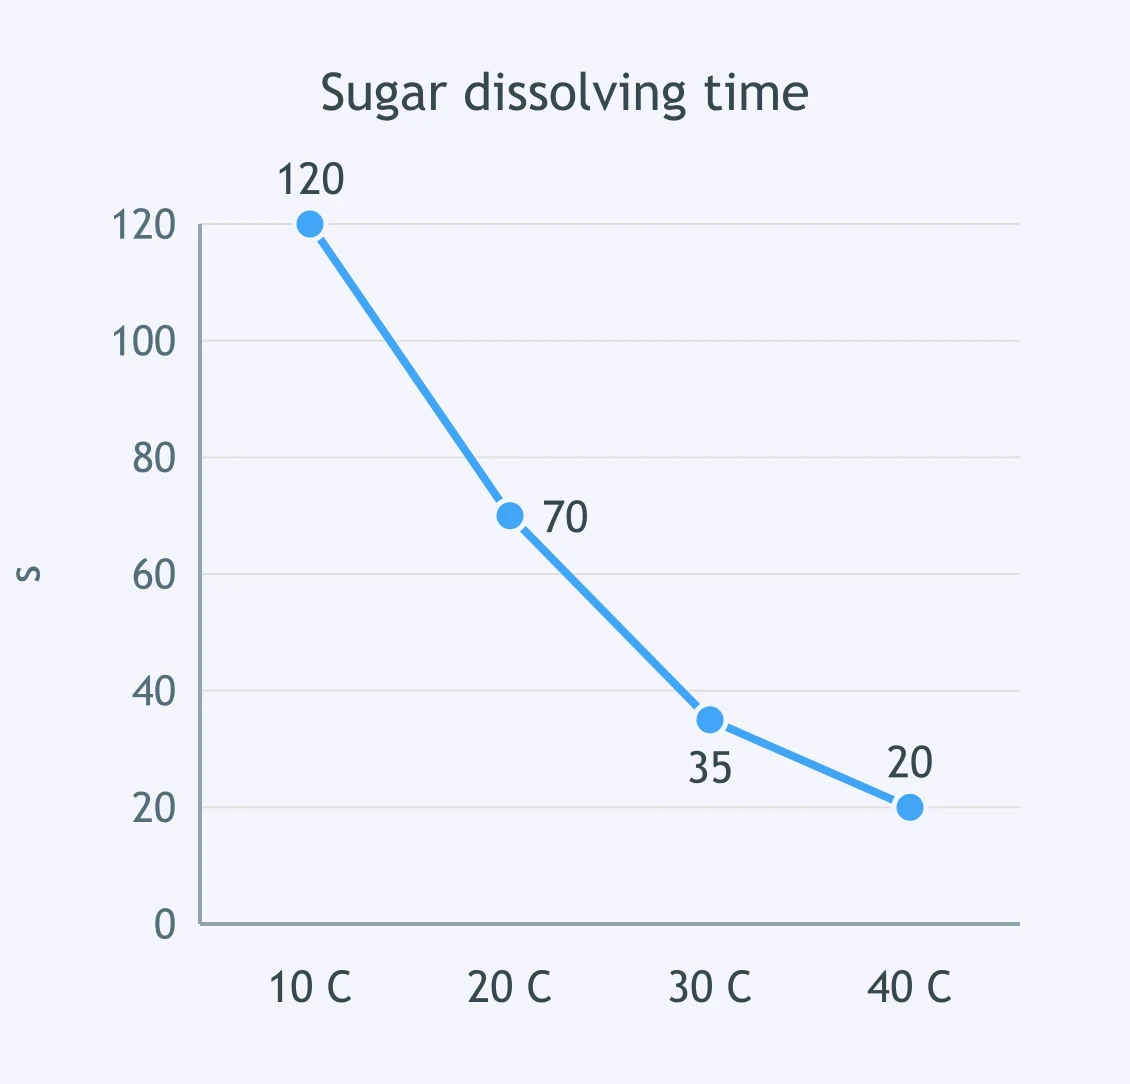
The table compares dissolving time at several water temperatures. What graph setup fits the investigation?
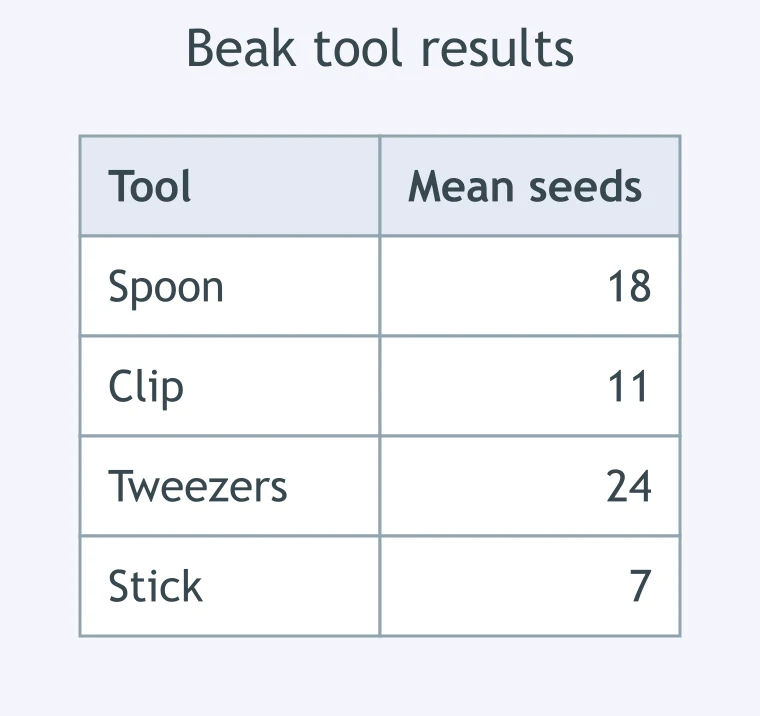
Bird-beak tools are compared by mean seeds picked up. What graph should show the class results?
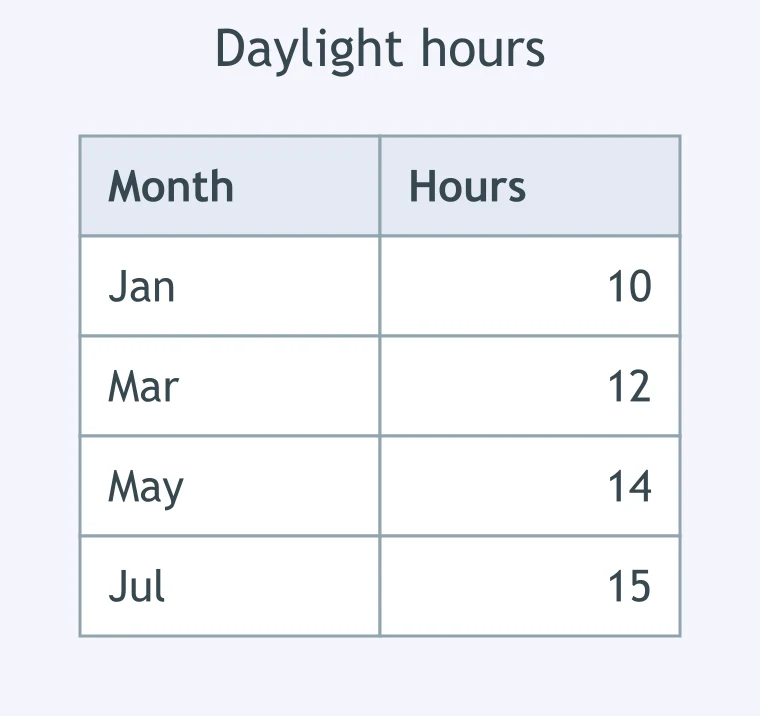
The table records daylight hours across months. What graph setup best shows the seasonal pattern?
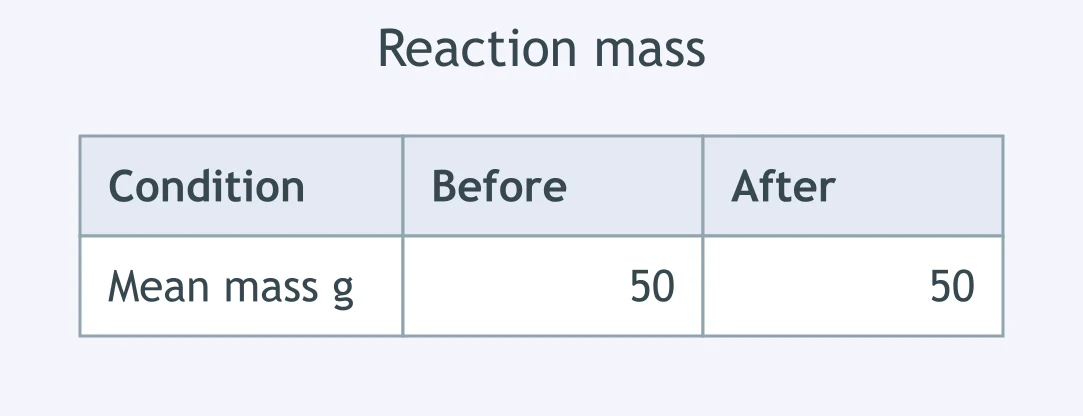
The table lists mean mass before and after a reaction. What graph would compare those two conditions clearly?
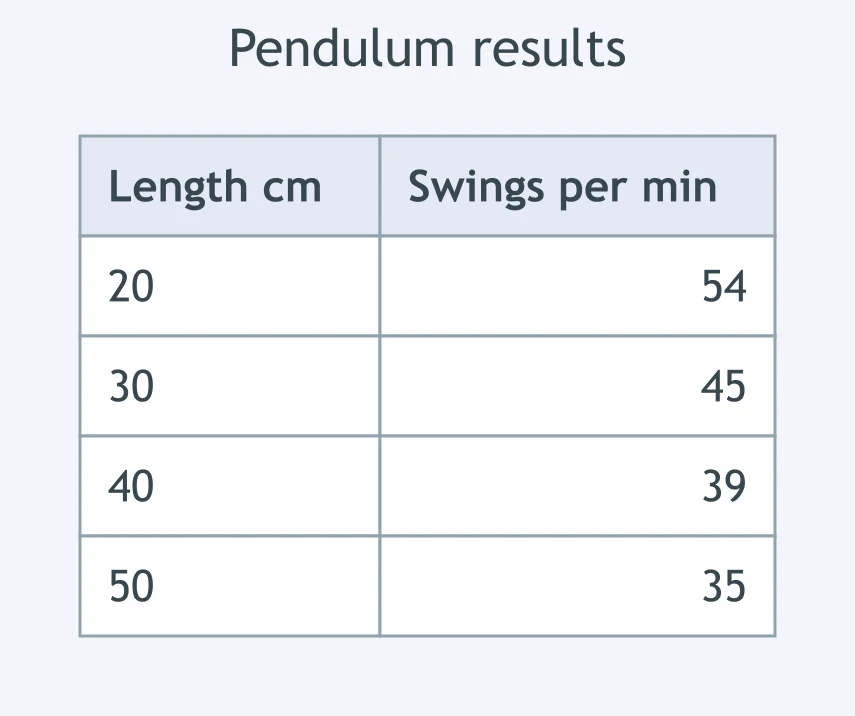
A pendulum table shows swings per minute at several string lengths. What axis setup should be chosen?
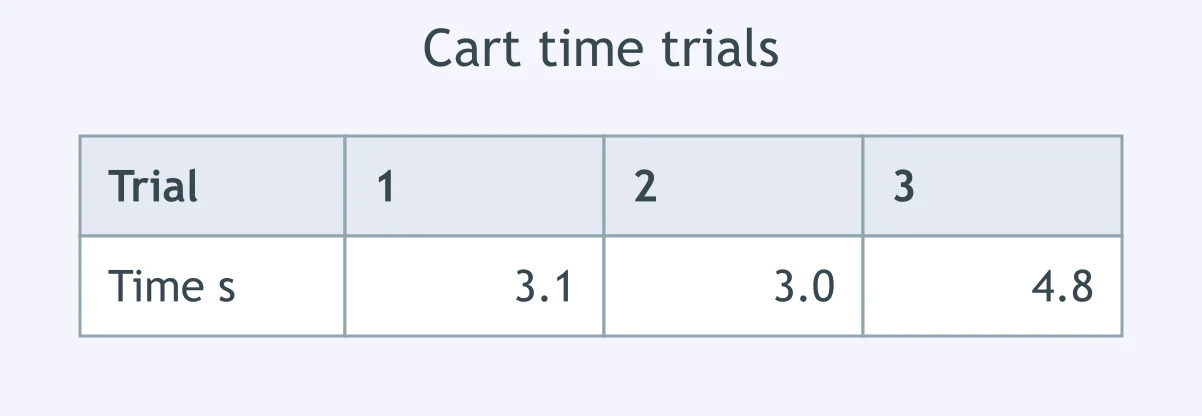
One cart trial is much slower than the others. Why calculate a mean from repeated trials?
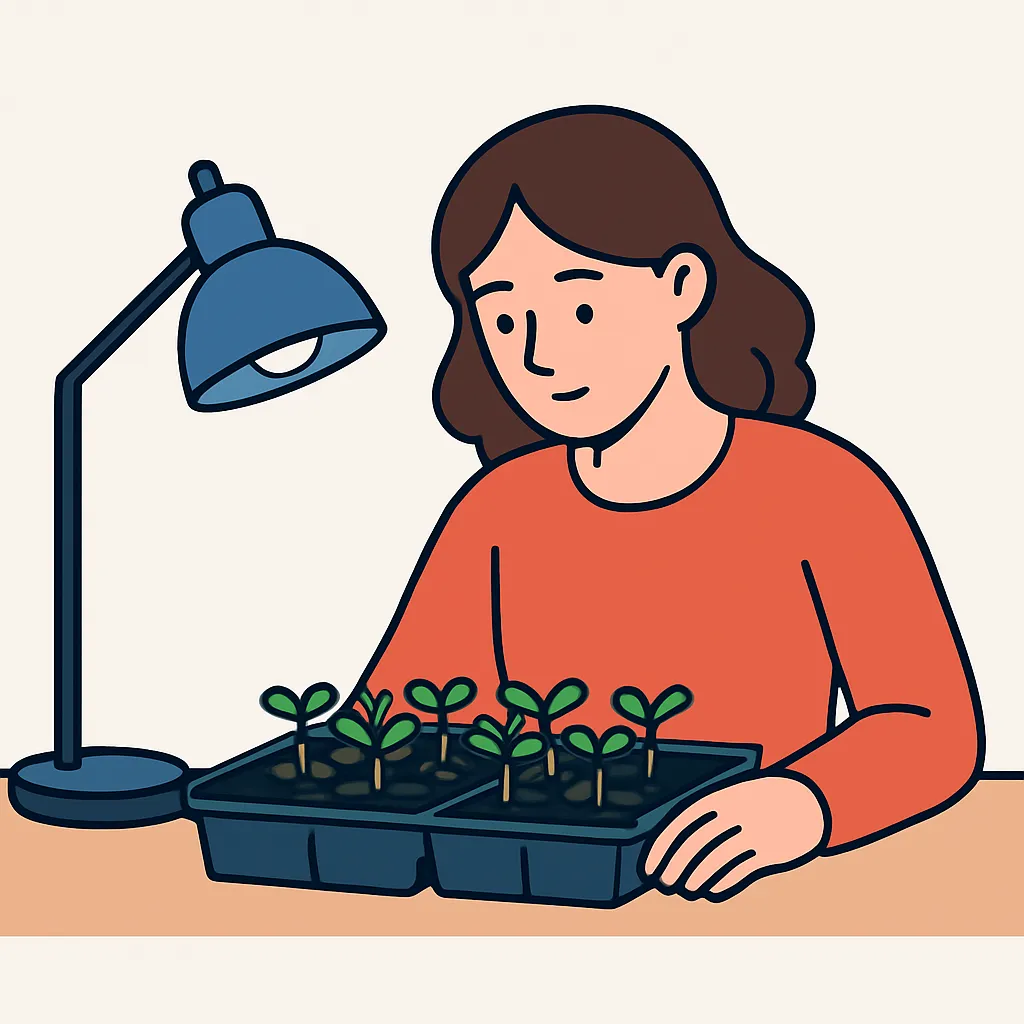
Maya repeats a blue-light plant test with several seed trays. What does repeating trials help her check?
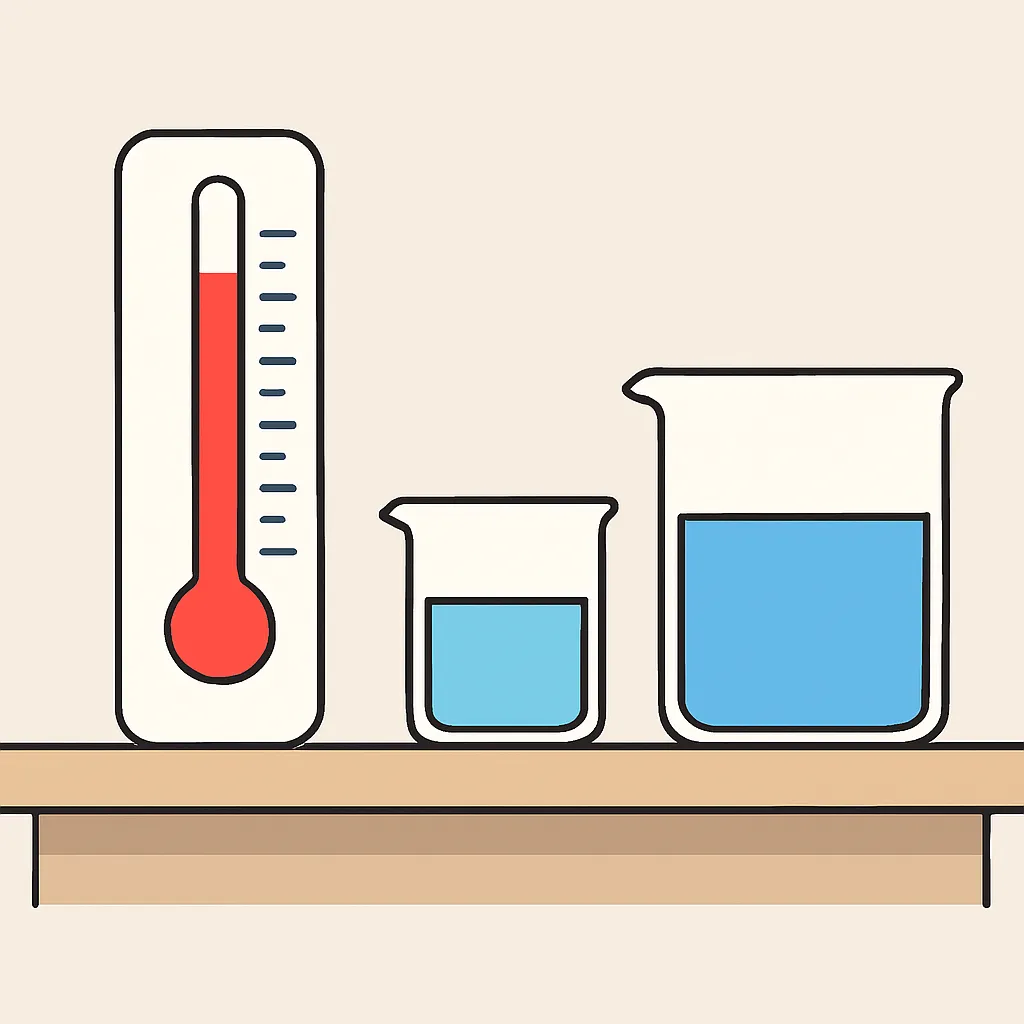
A thermometer reading is much higher than two earlier readings. How can repeated trials improve the conclusion?
Students compare paper towels by measuring water held in three trials for each brand. Why not use only the first trial?
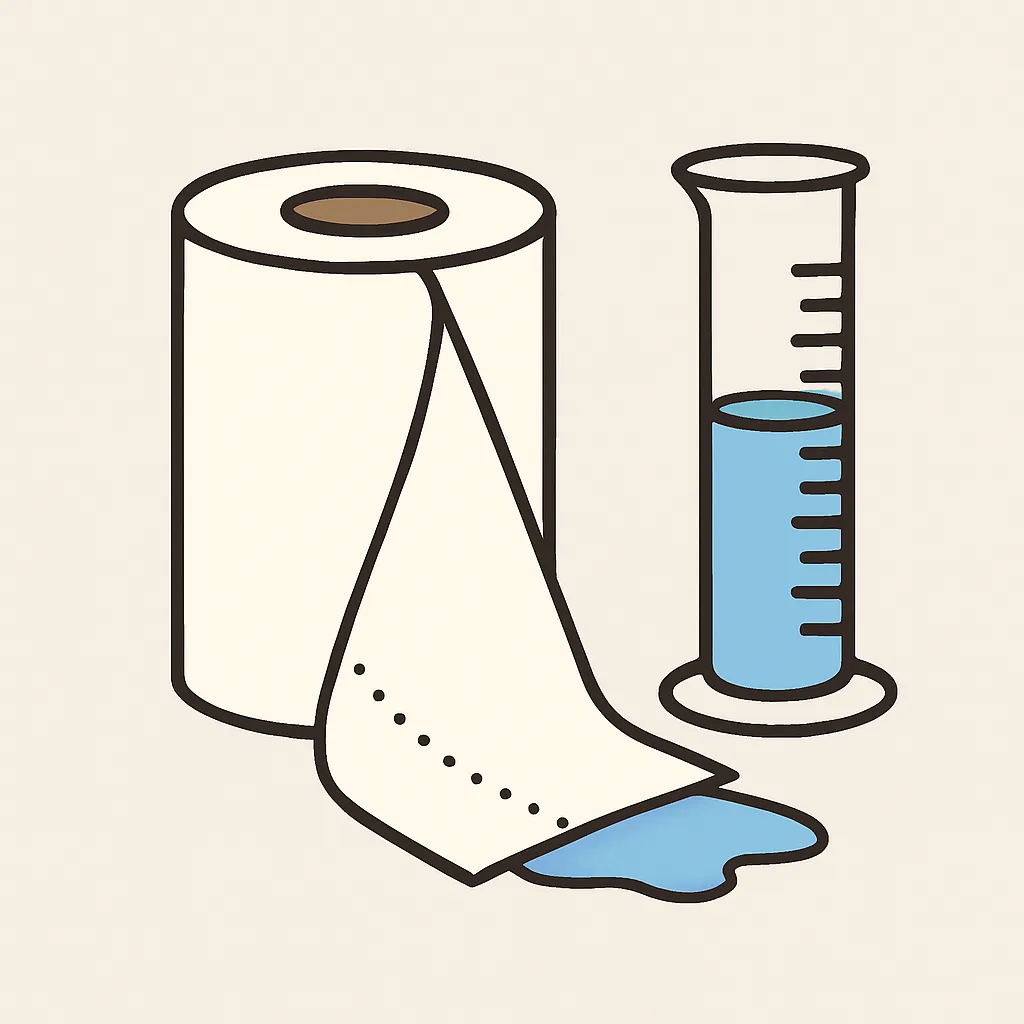
A class repeats a marble-roll test at each slope before graphing means. How does this help the graph?
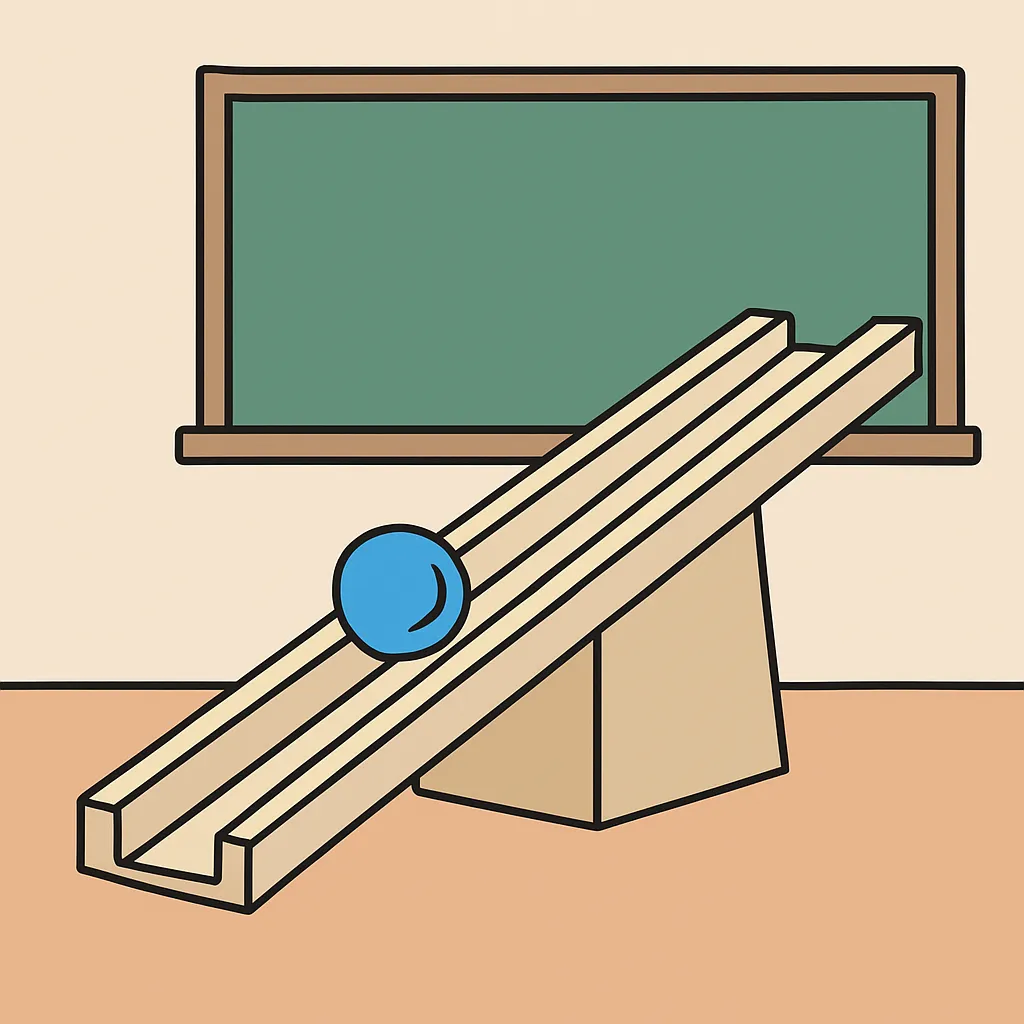
A bridge design has one trial far larger than the other two. What should the team do before making a claim?
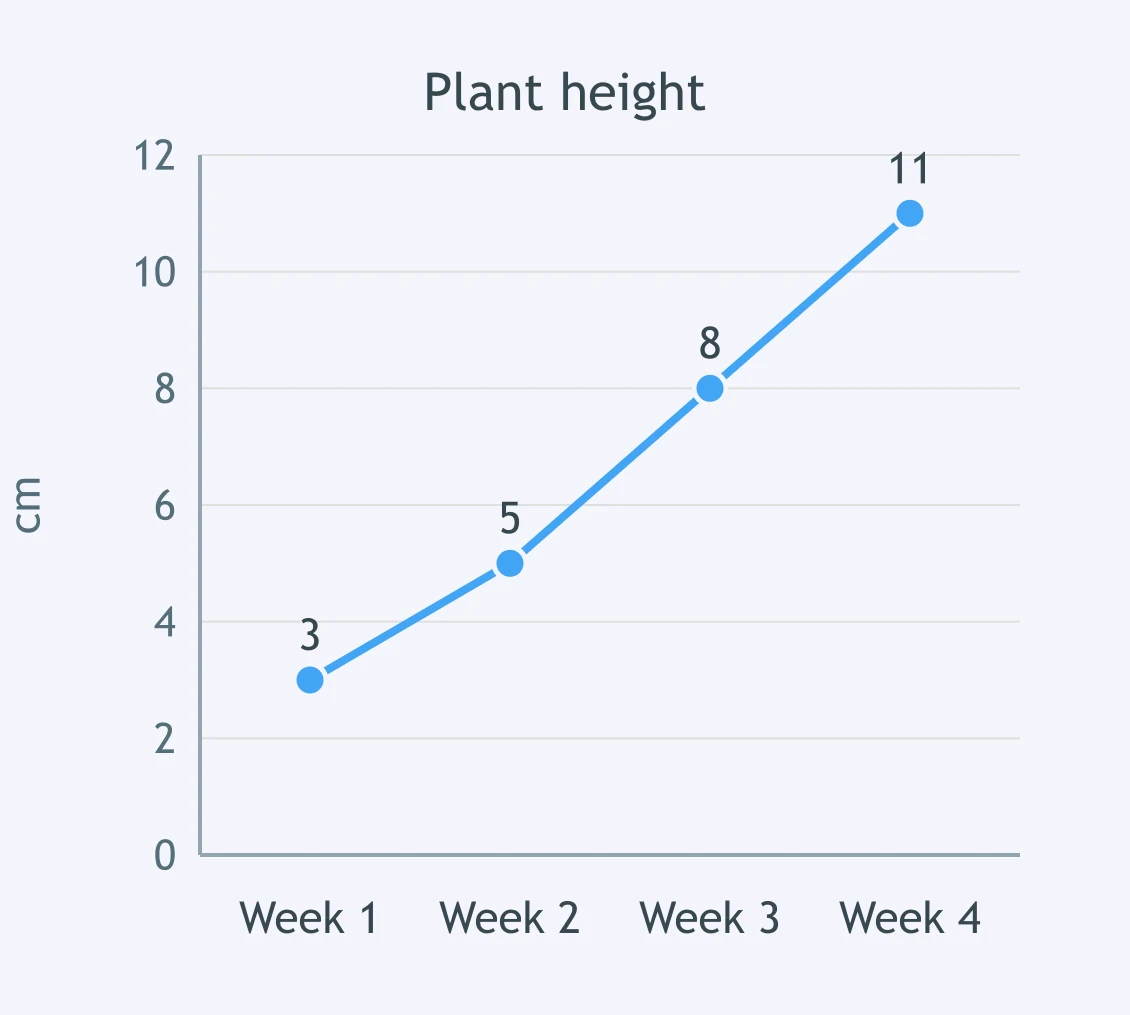
Use the line graph. What pattern does plant height show over the weeks?
Use the bar graph of fertilizer results. What pattern is shown?
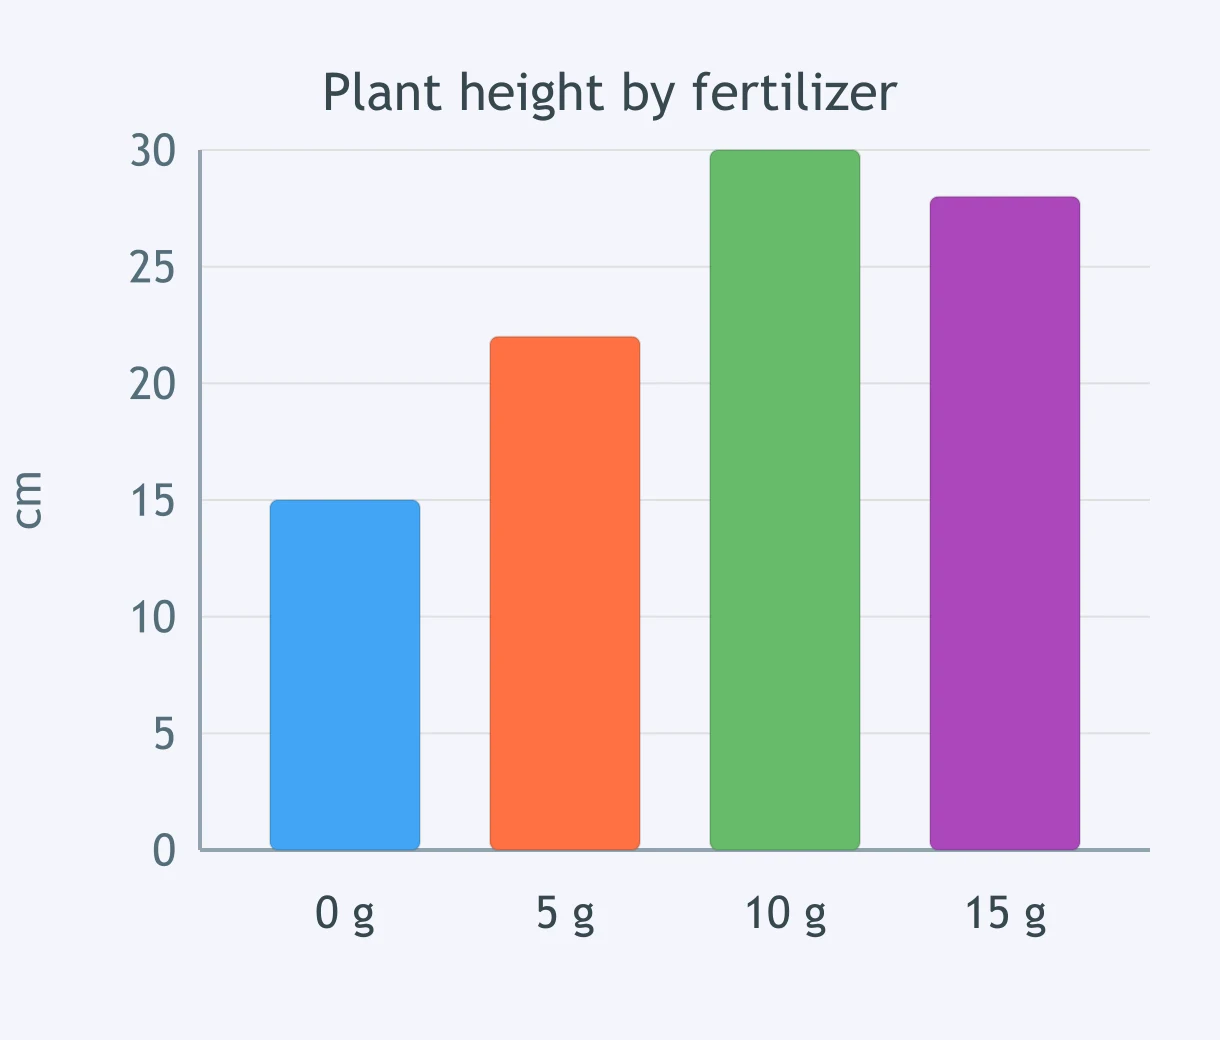
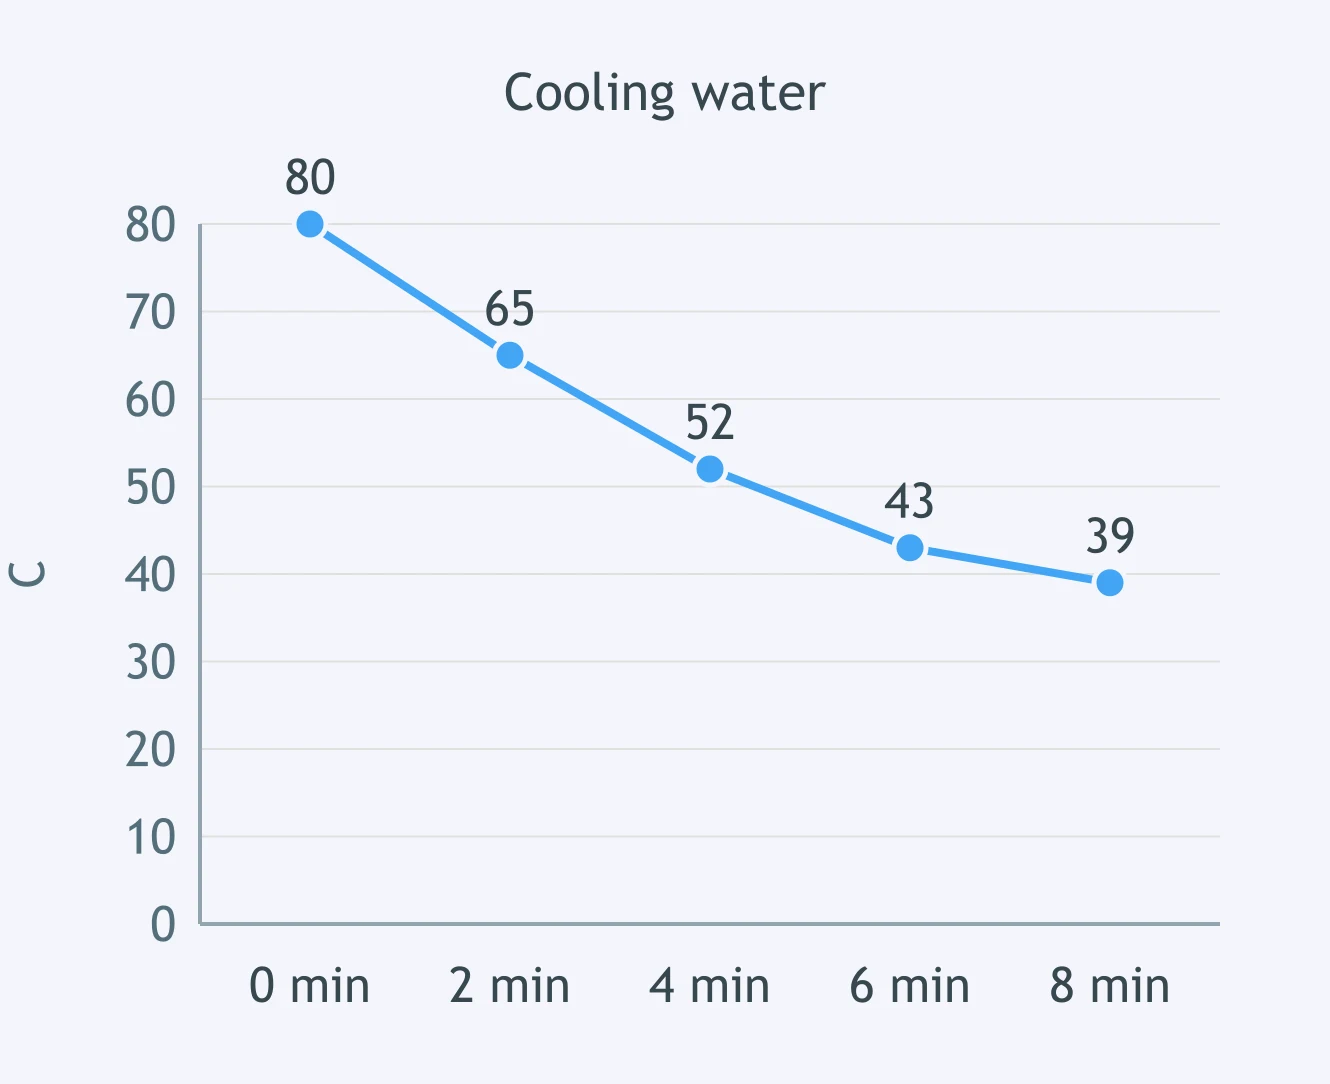
Use the cooling-water line graph. What trend does the data show?
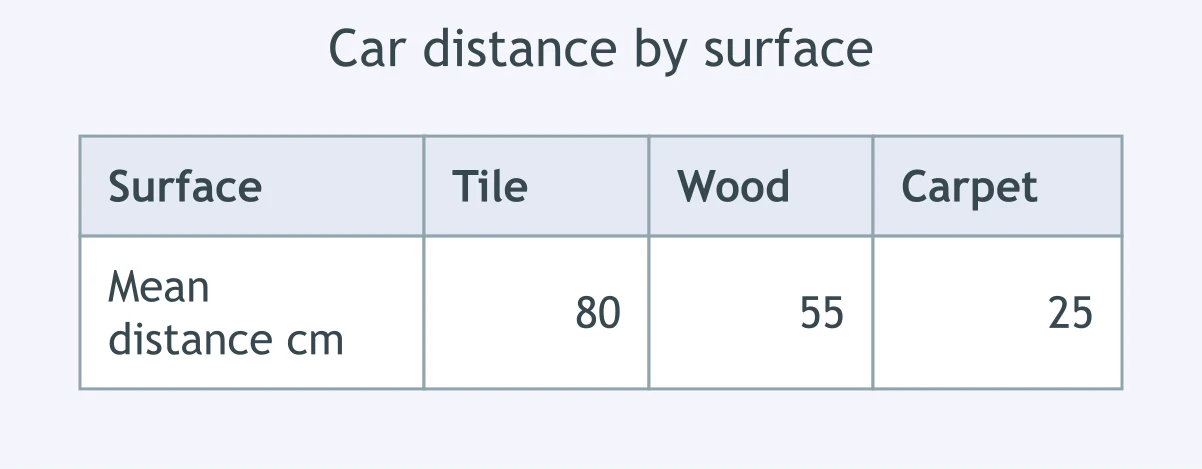
Use the table of mean car distances by surface. What does the data show?
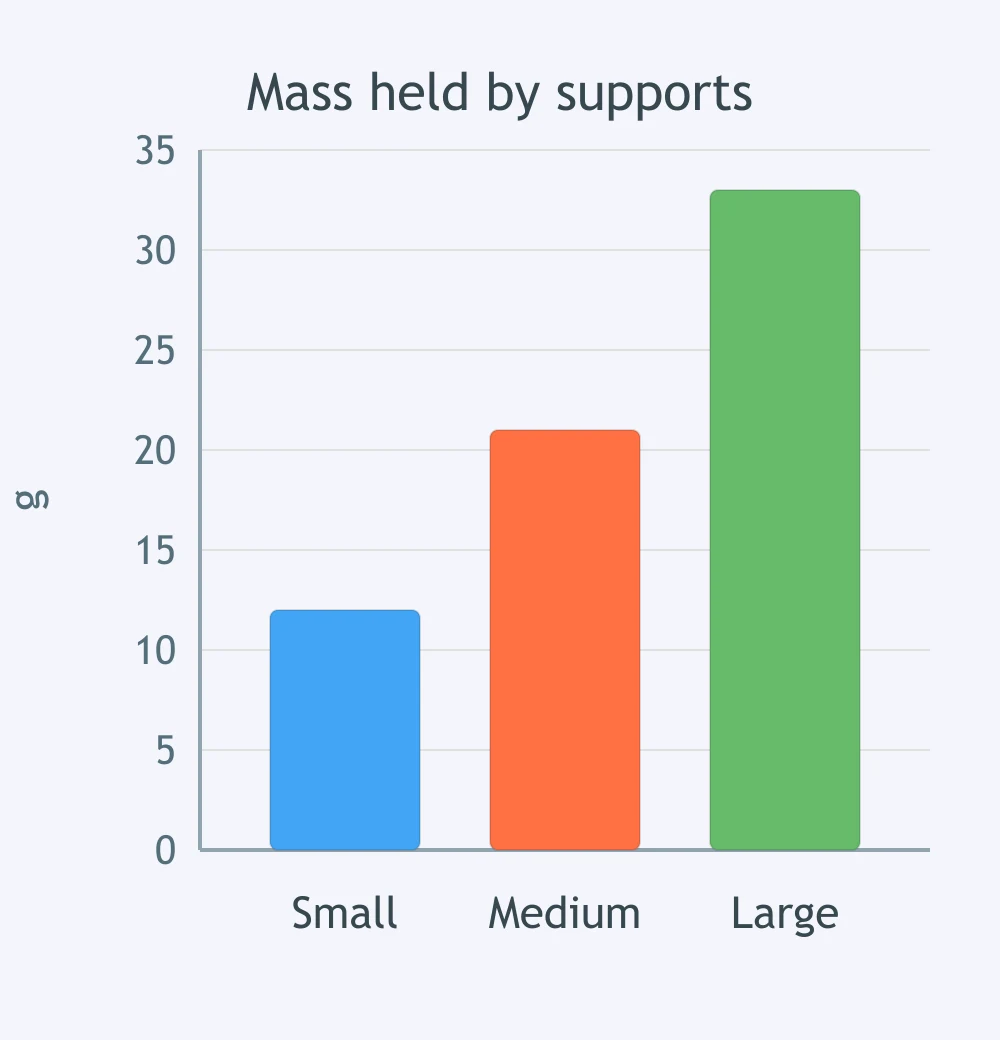
Use the bridge-support bar graph. What pattern appears as support size changes?
Use the sugar-dissolving line graph. What relationship does the data show?
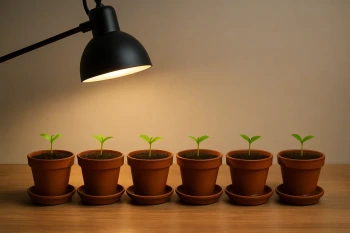
Independent, Dependent and Controlled Variables
40 questions
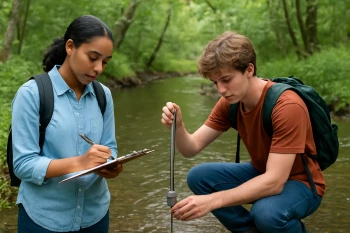
Descriptive, Comparative and Experimental Investigations
20 questions
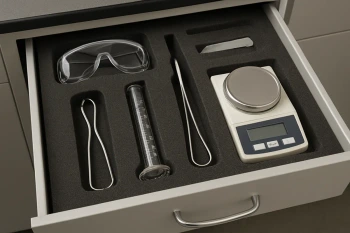
Lab Safety and Choosing the Right Tool
20 questions
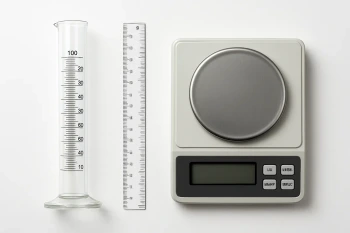
SI Units, and Quantitative versus Qualitative Data
40 questions
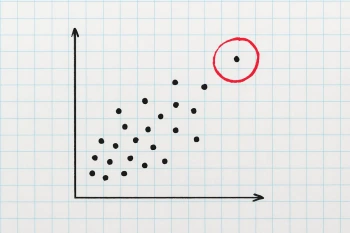
Patterns, Sources of Error and the Limits of Data
20 questions
Crack the passcode before the zombies get in.
Answer, then swat bugs for bonus points.
Race through questions at your own speed.
Same question on every screen. Fastest wins.

Pick a tile, answer, hit bonuses and steals.

Claim, Evidence and Reasoning
40 questions