Loading
by BlastRoom
Read the numbers behind the history: population, production, votes, casualties and prices.
#united_states_history

20 questions
One question set, multiple game modes. Tap any game to see it in action. Not sure which to pick?
Answer to place stones and capture territory.
Outrun the snow together.
Earn blasts, then hunt the other team.
Answer to earn energy, then climb.

The class blasts through walls together.
Bid on mystery lots. Most money wins.
Sell tours. Nice, standard, or a total scam.

Answer, restock, and serve the rush.
More correct answers pulls the rope your way.
Answer, then shoot down the alien wave.
Answer, then tap to leap the frozen ridge.
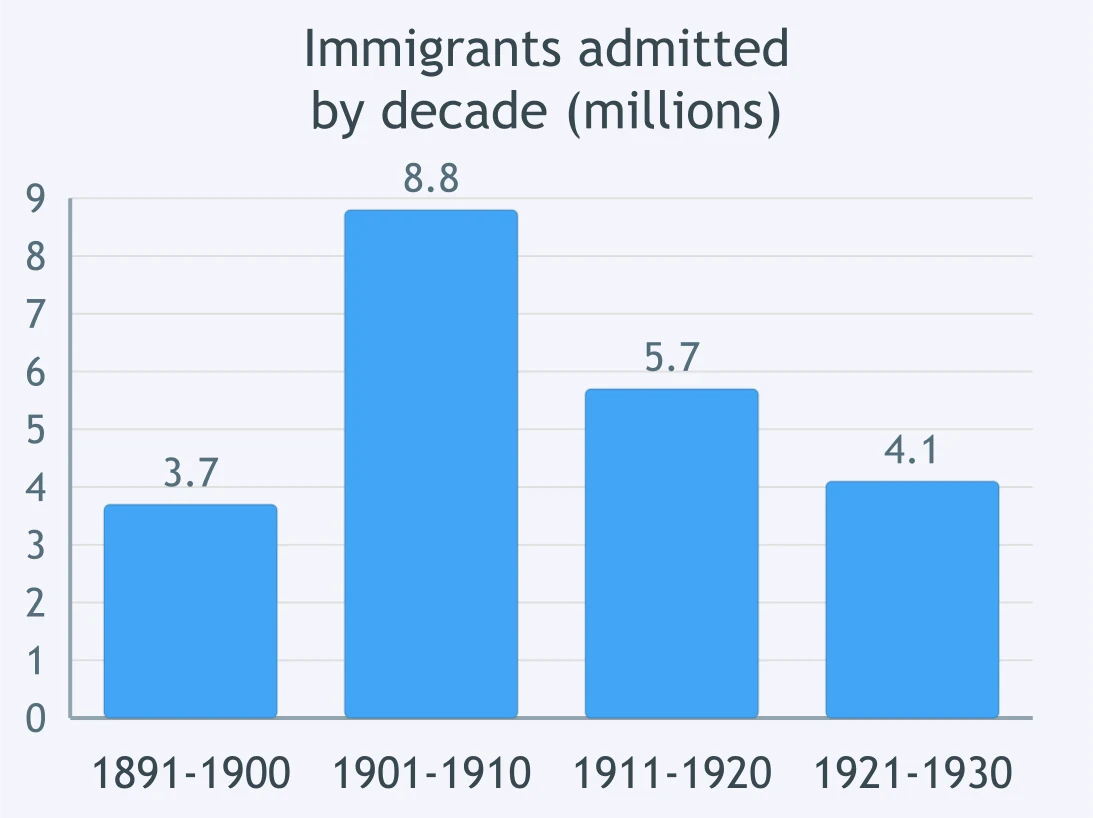
The bar graph shows immigrants admitted to the United States by decade. About how many were admitted in the decade 1901-1910?
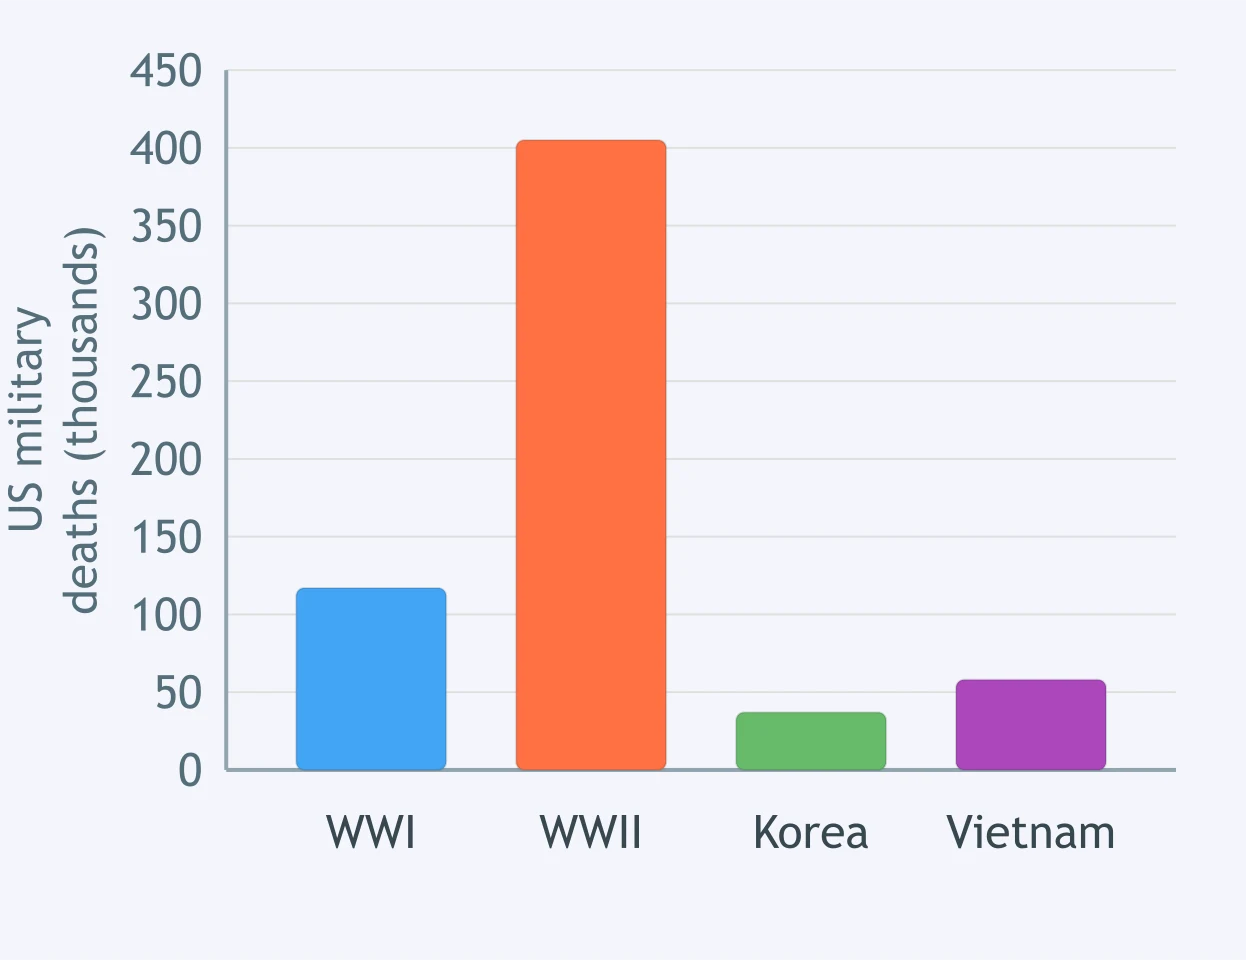
Use the bar graph of United States military deaths by conflict. About how many deaths does it show for the Korean War?
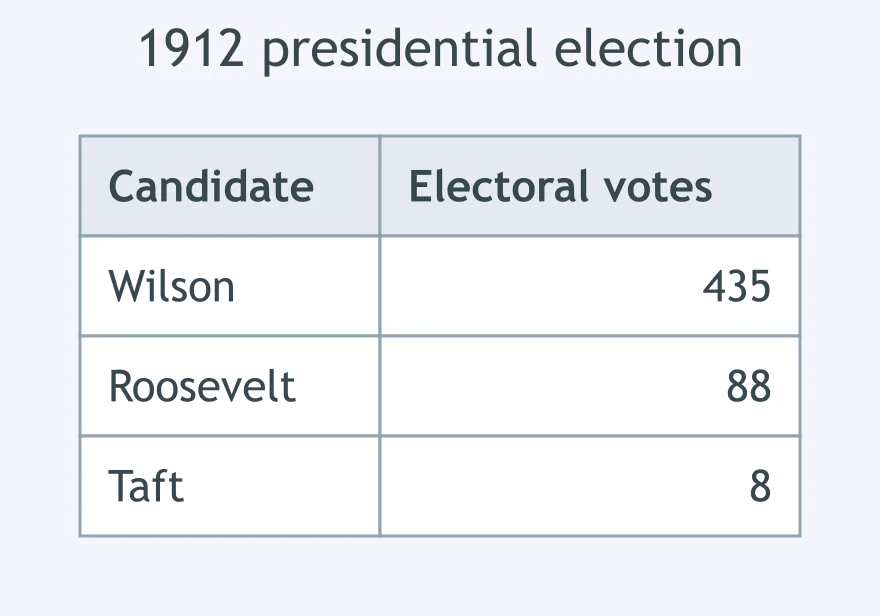
The table gives the electoral votes cast in the 1912 presidential election. How many did William Howard Taft receive?
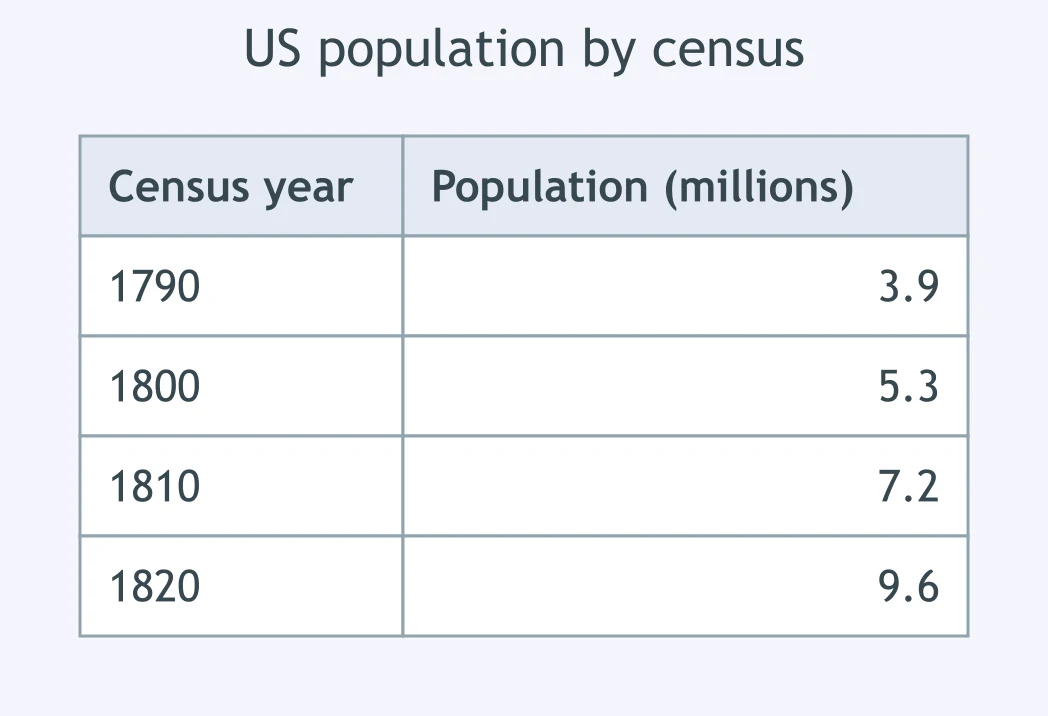
The table gives the population recorded by the first four federal censuses. What figure does it give for the census of 1810?
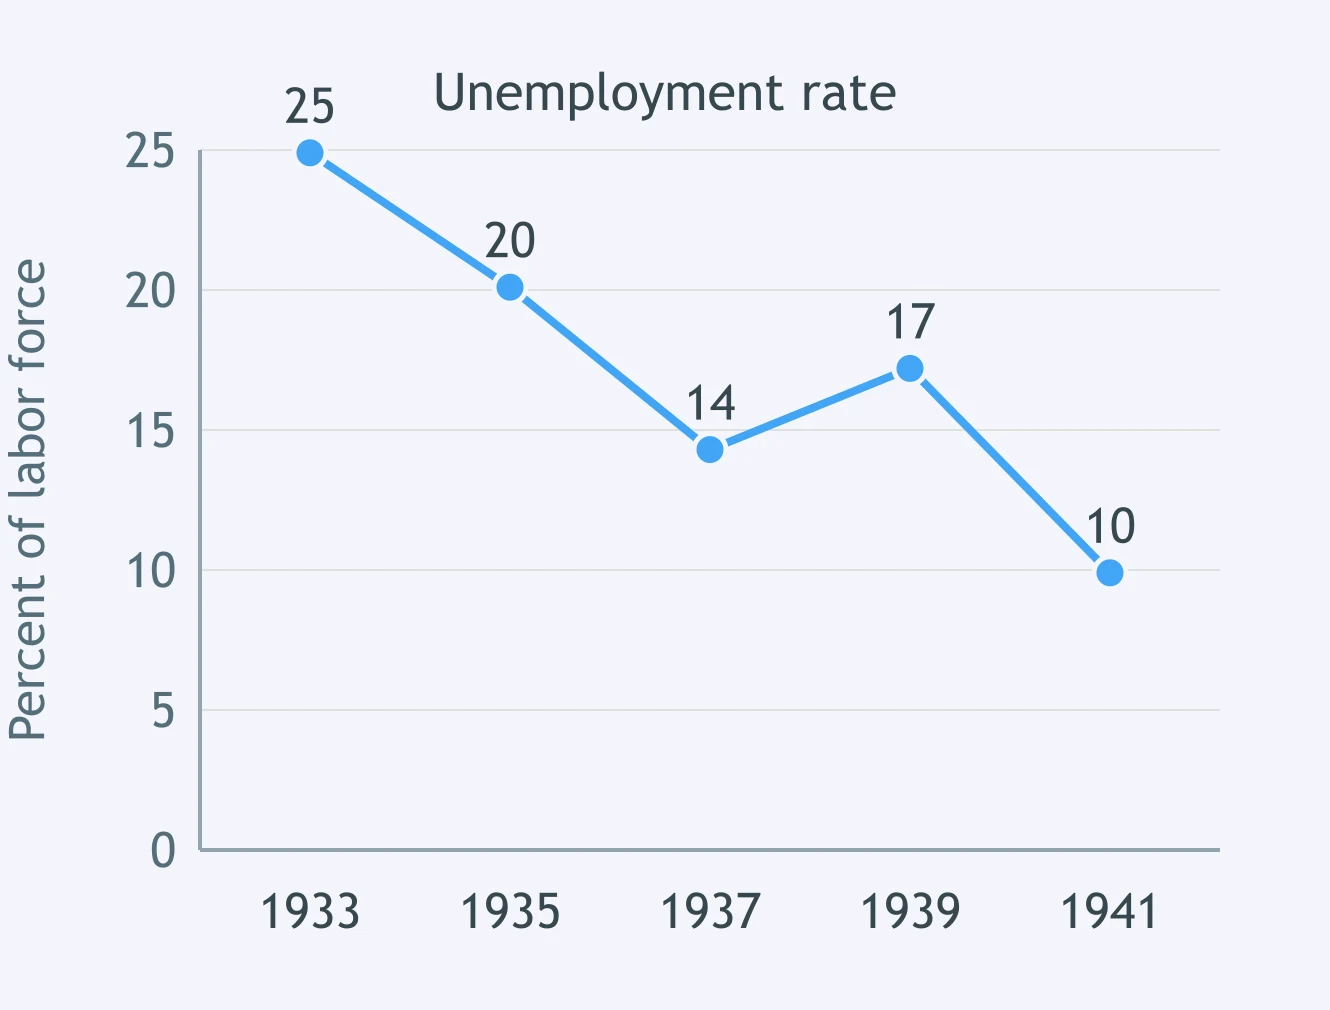
The line graph plots the United States unemployment rate. Between which two plotted years did the rate fall the most?
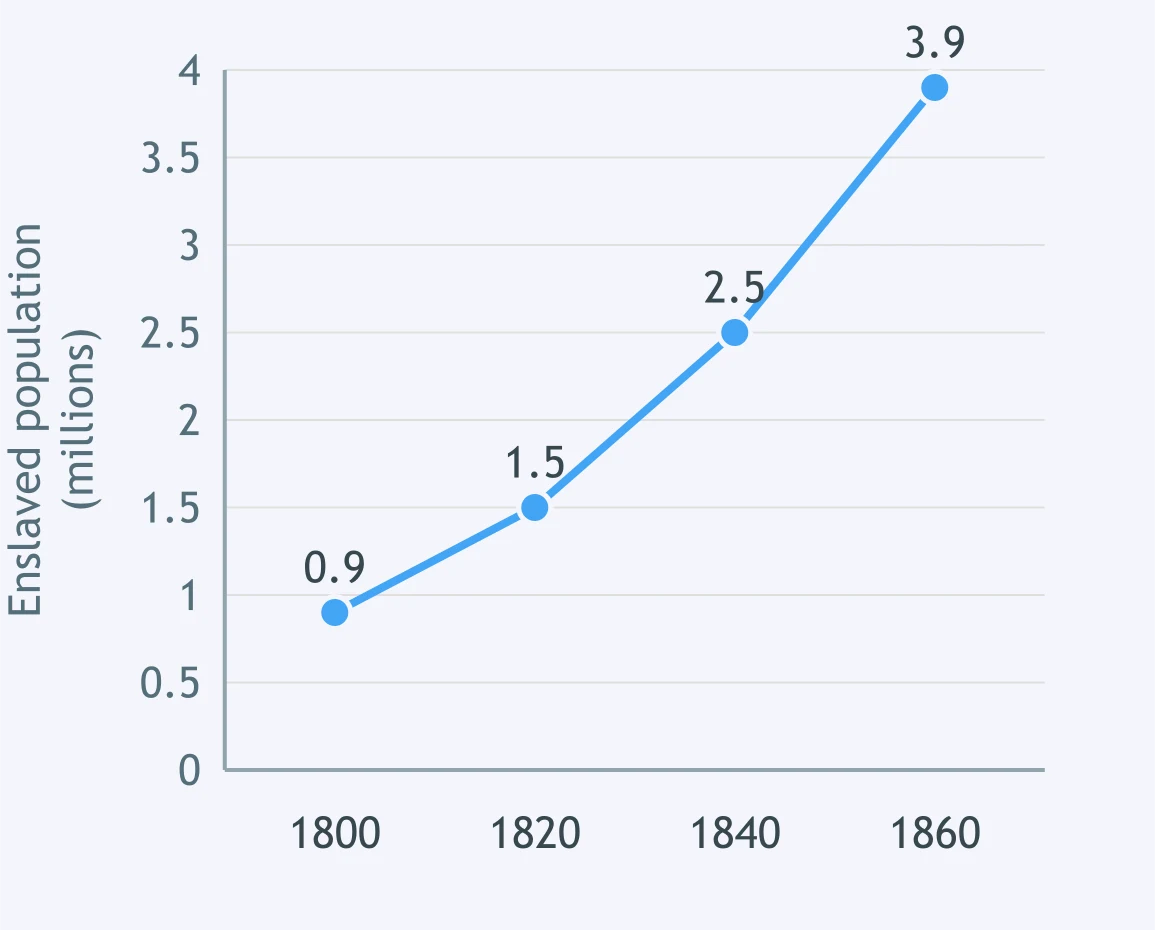
The line graph plots the enslaved population counted by the federal census. Between which two census years plotted did that population grow the most?
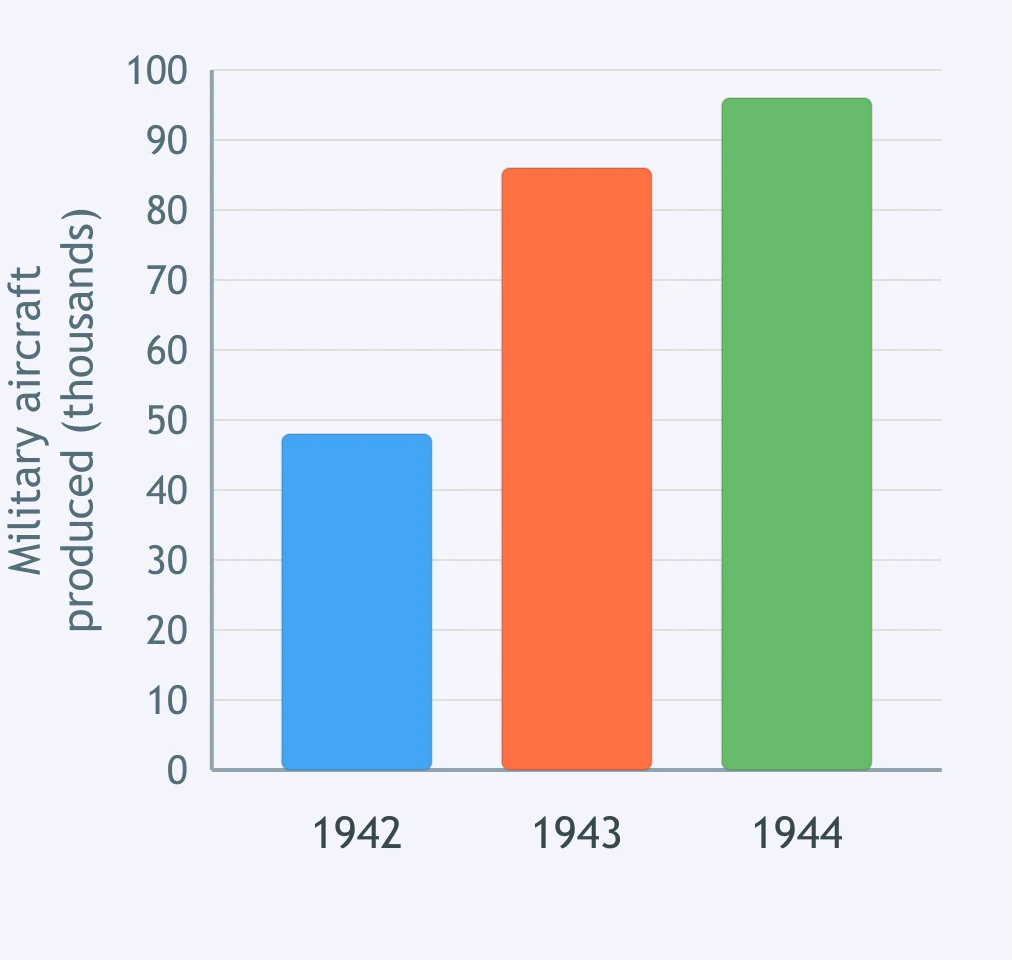
Use the bar graph of American military aircraft production. About how many more aircraft were built in 1943 than in 1942?
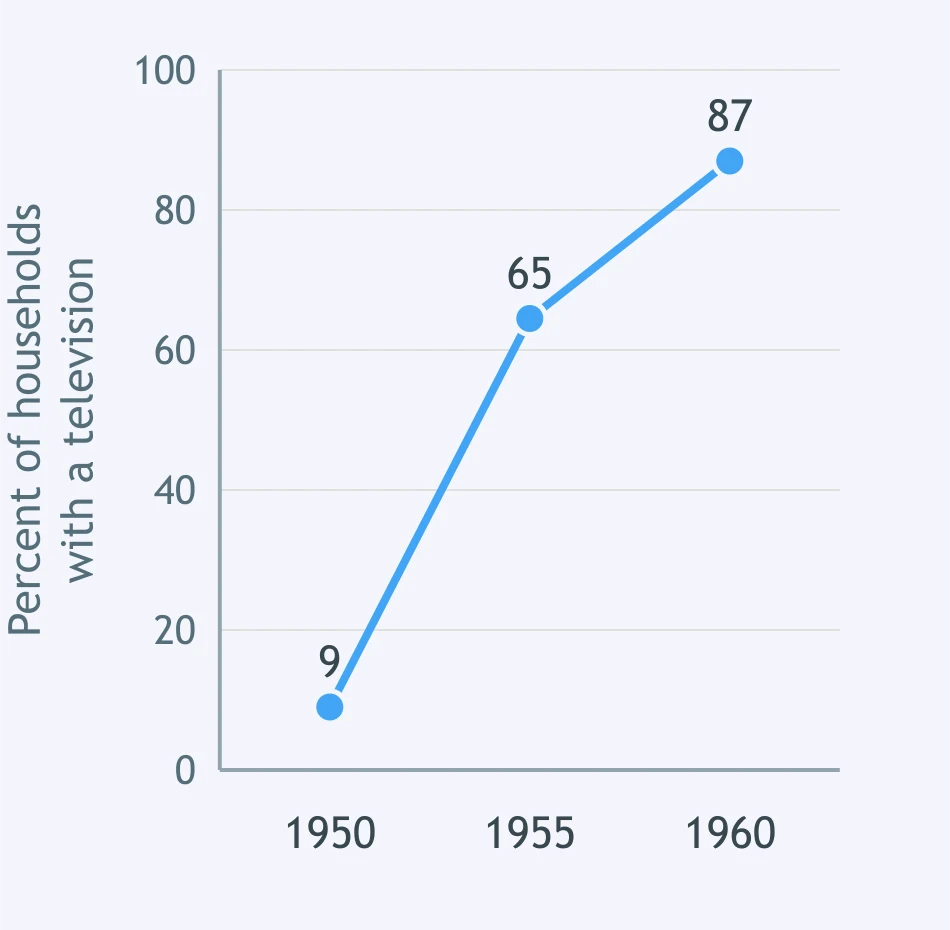
The line graph plots the share of American households owning a television set. About how many percentage points higher was that share in 1960 than in 1950?
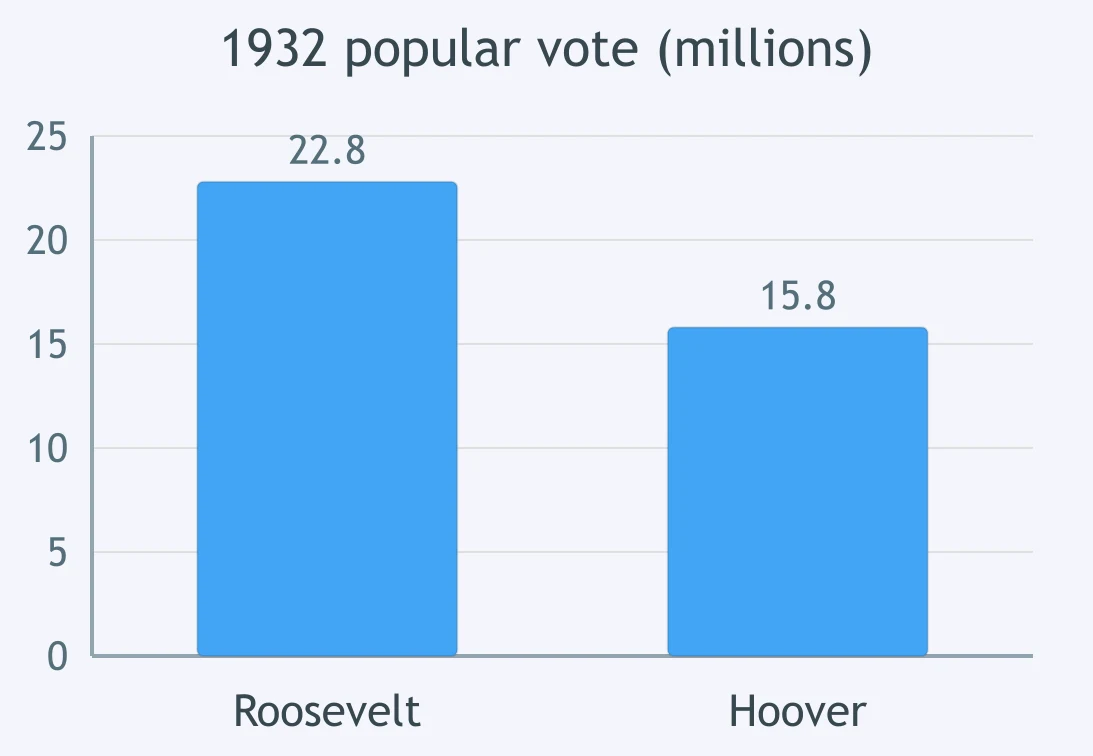
The bar graph shows the popular vote in the 1932 presidential election. About how many more votes did the winner receive than his opponent?
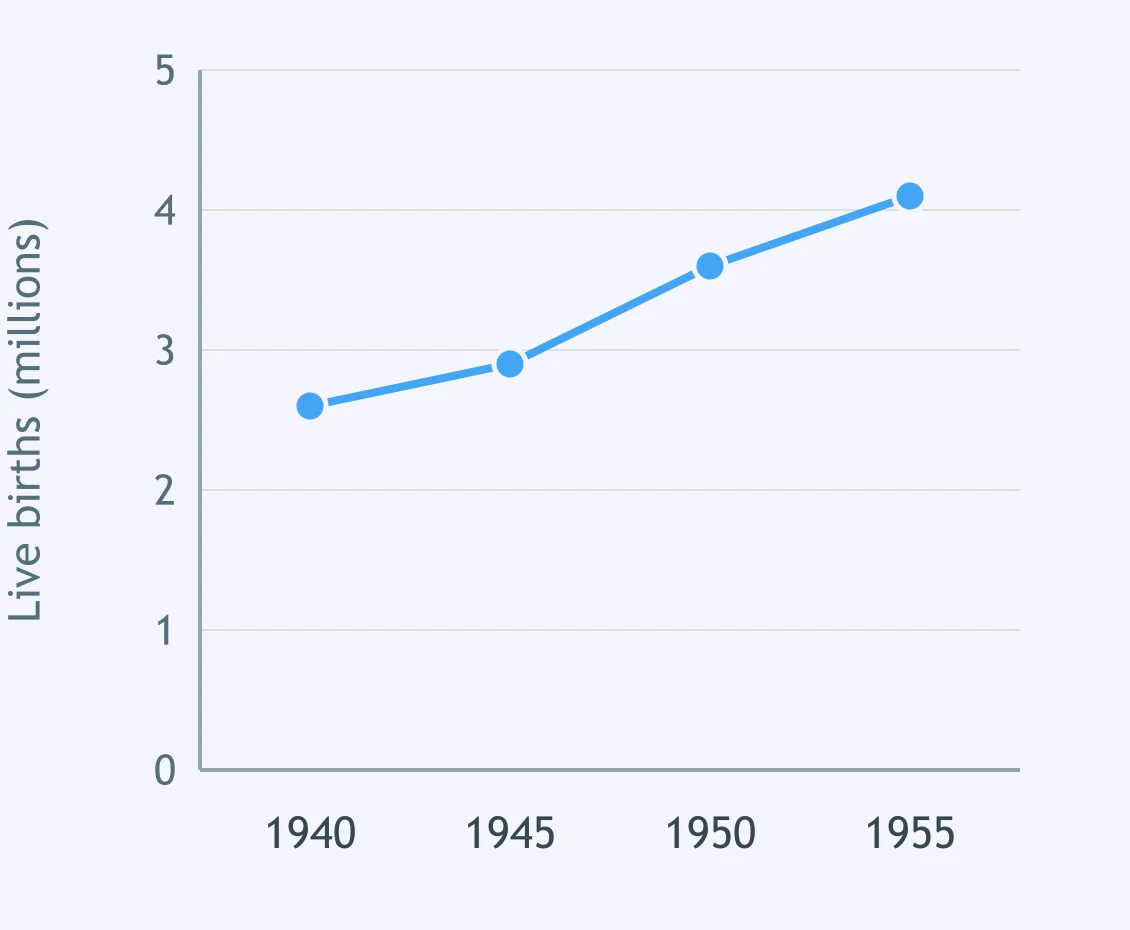
The line graph plots live births in the United States. What does the plotted change describe?
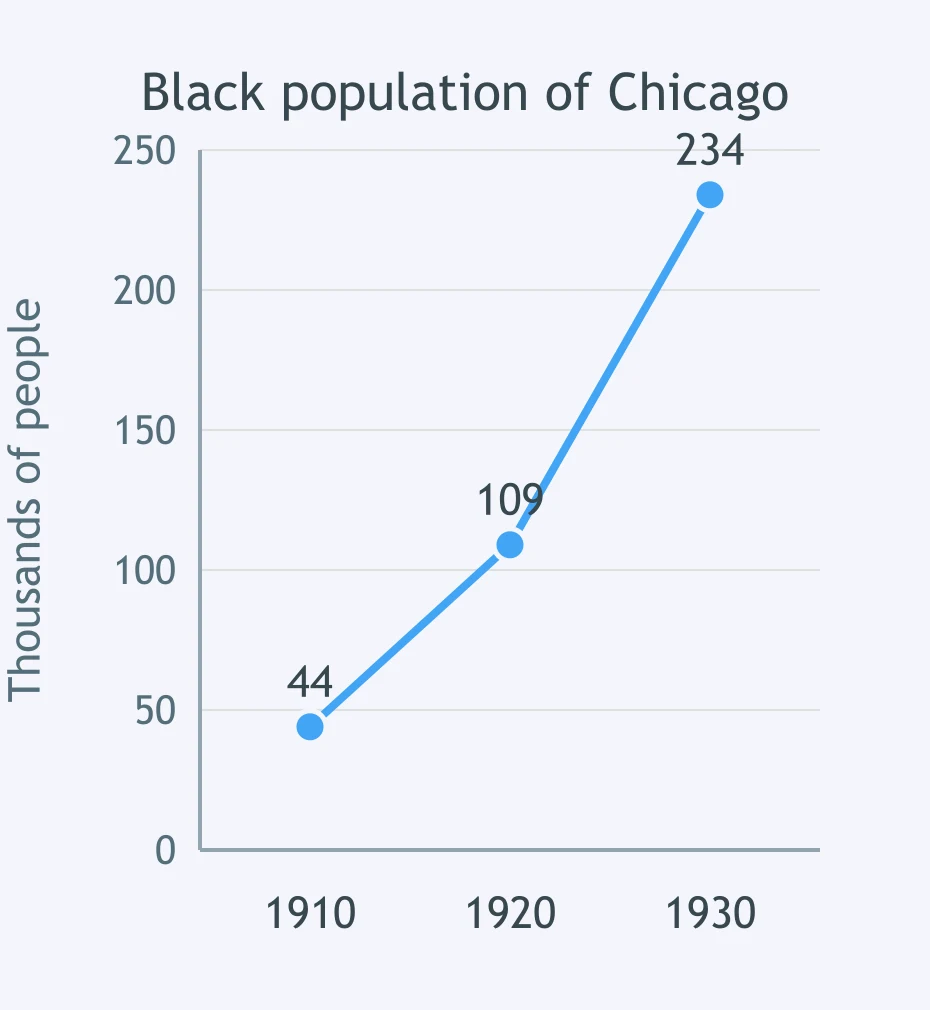
The line graph plots the Black population of Chicago recorded by the census. What development does the plotted change show?
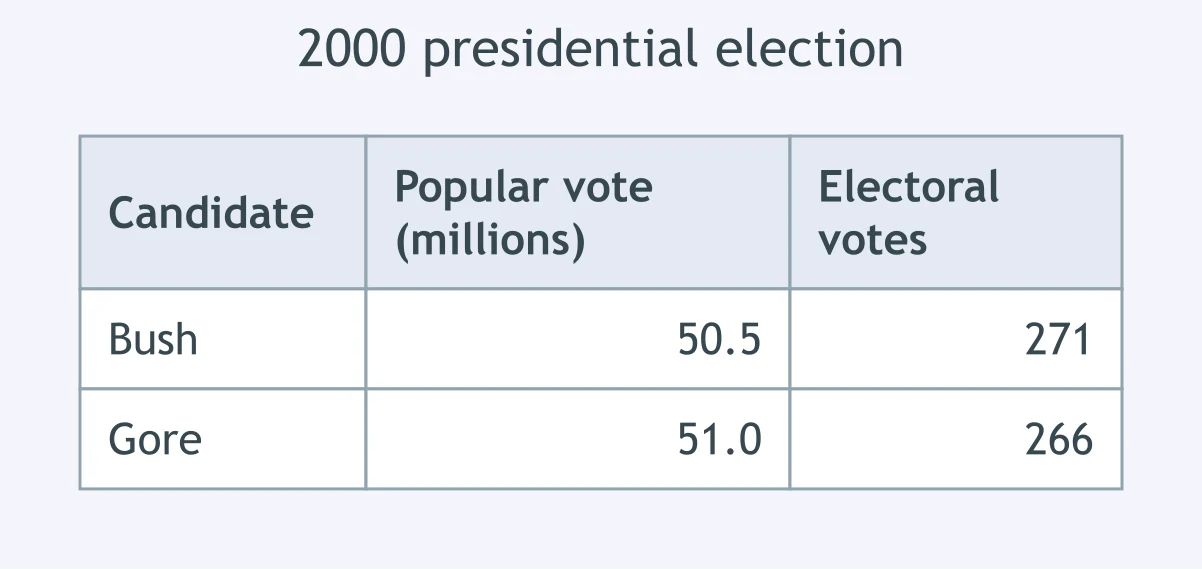
The table gives the national popular vote and the electoral vote in the 2000 presidential election. What does it show about how a president is chosen?
Federal figures show unemployment falling from about 14 percent of the labor force in 1940 to under 2 percent by 1943. What accounts for that drop?
Census figures show California, Oregon and Washington gaining population far faster than the nation as a whole during the 1940s. What best explains that pattern?
Between 1950 and 1970 the suburbs around American cities grew far faster than the central cities themselves. Which pair of federal policies most directly enabled that growth?
Between 1800 and 1860 both cotton output and the enslaved population of the Deep South rose steeply. What links those two trends?
Union membership more than doubled between 1935 and 1941. Which law most directly accounts for that increase?
A student has each 1912 candidate's share of the national popular vote, and the shares together account for the whole vote. Which display fits that data?
A table lists the number of immigrants admitted to the United States in each decade from 1880 to 1920. Which question can the table alone NOT answer?
A chart shows the unemployment rate falling between 1933 and 1937, the years the first New Deal programs were running. What does the chart by itself establish?
Crack the passcode before the zombies get in.
Answer, then swat bugs for bonus points.
Race through questions at your own speed.
Same question on every screen. Fastest wins.

Pick a tile, answer, hit bonuses and steals.

The Thirteen Colonies: Regions and Economies
30 questions