Loading
by BlastRoom
Students read speed, stops, and direction changes from distance-time graphs.
#us_grade_7_science

40 questions
One question set, multiple game modes. Tap any game to see it in action. Not sure which to pick?
Answer to place stones and capture territory.
Outrun the snow together.
Earn blasts, then hunt the other team.
Answer to earn energy, then climb.

The class blasts through walls together.
Bid on mystery lots. Most money wins.
Sell tours. Nice, standard, or a total scam.

Answer, restock, and serve the rush.
More correct answers pulls the rope your way.
Answer, then shoot down the alien wave.
Answer, then tap to leap the frozen ridge.
Use the distance-time graph. What distance from the start is shown at 4 s?
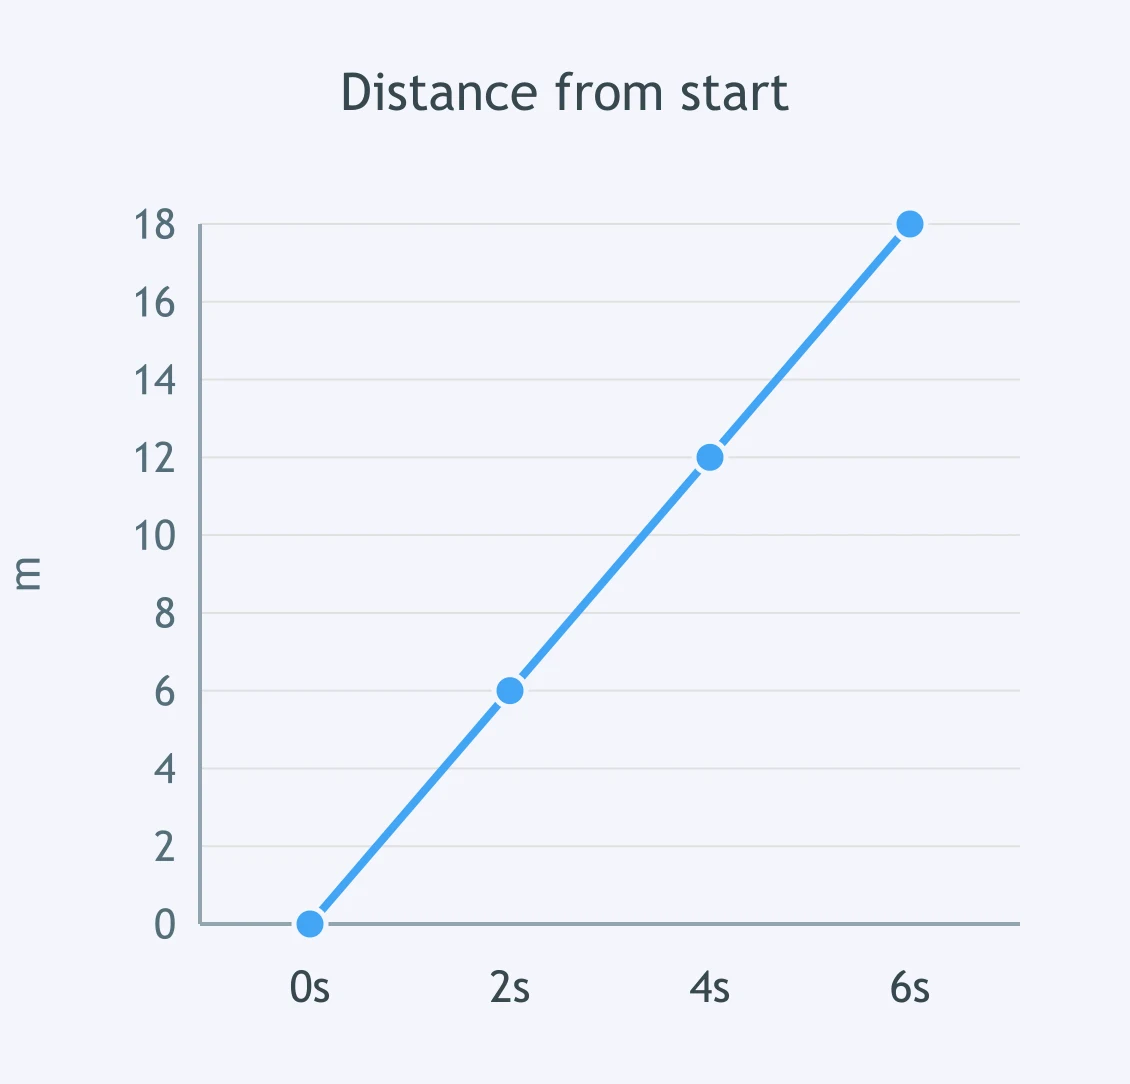
Study the graph of distance from the start. At what time is the object 20 m from the start?
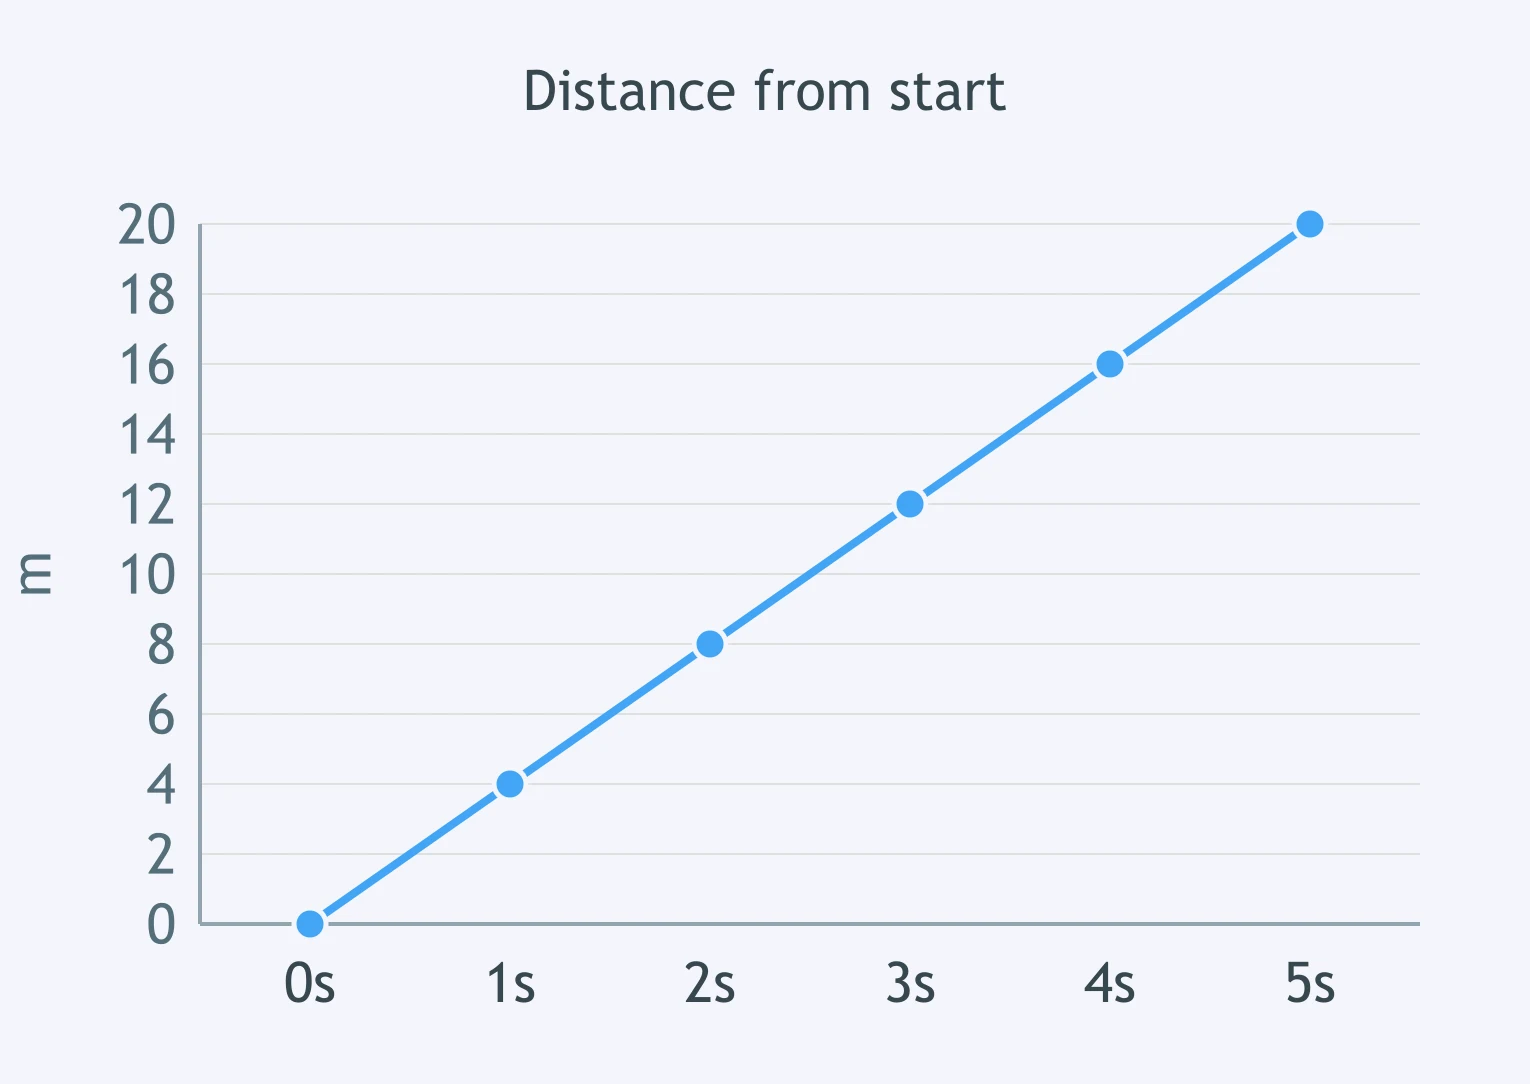
On the graph, the object's distance is read at 3 s. What distance does the graph show then?
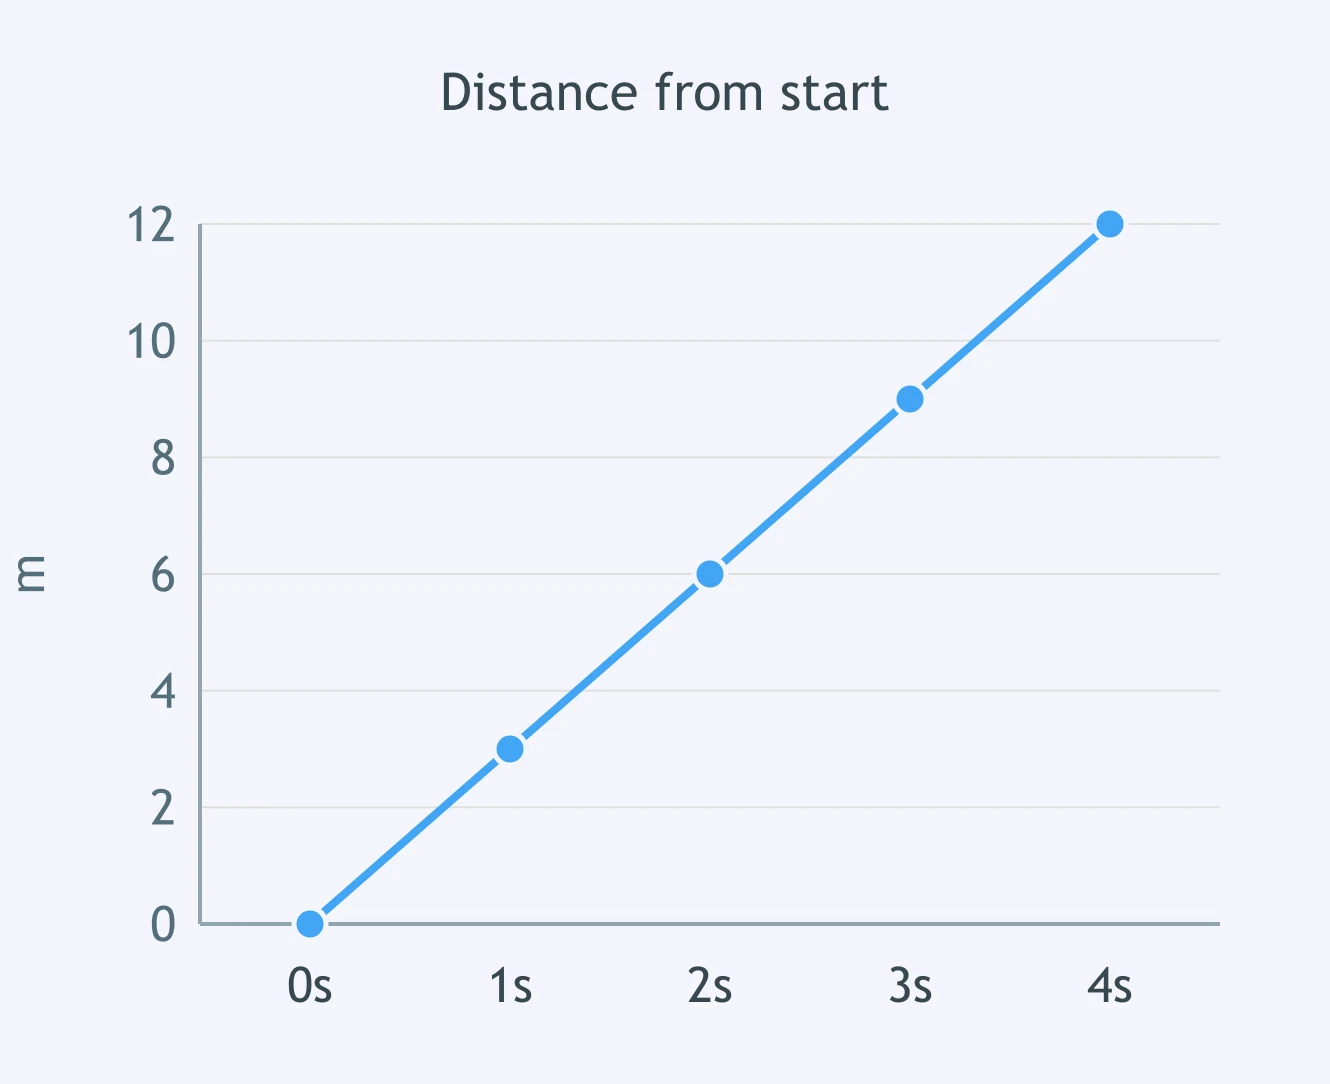
Use the graph. When does the object first reach 15 m from the start?
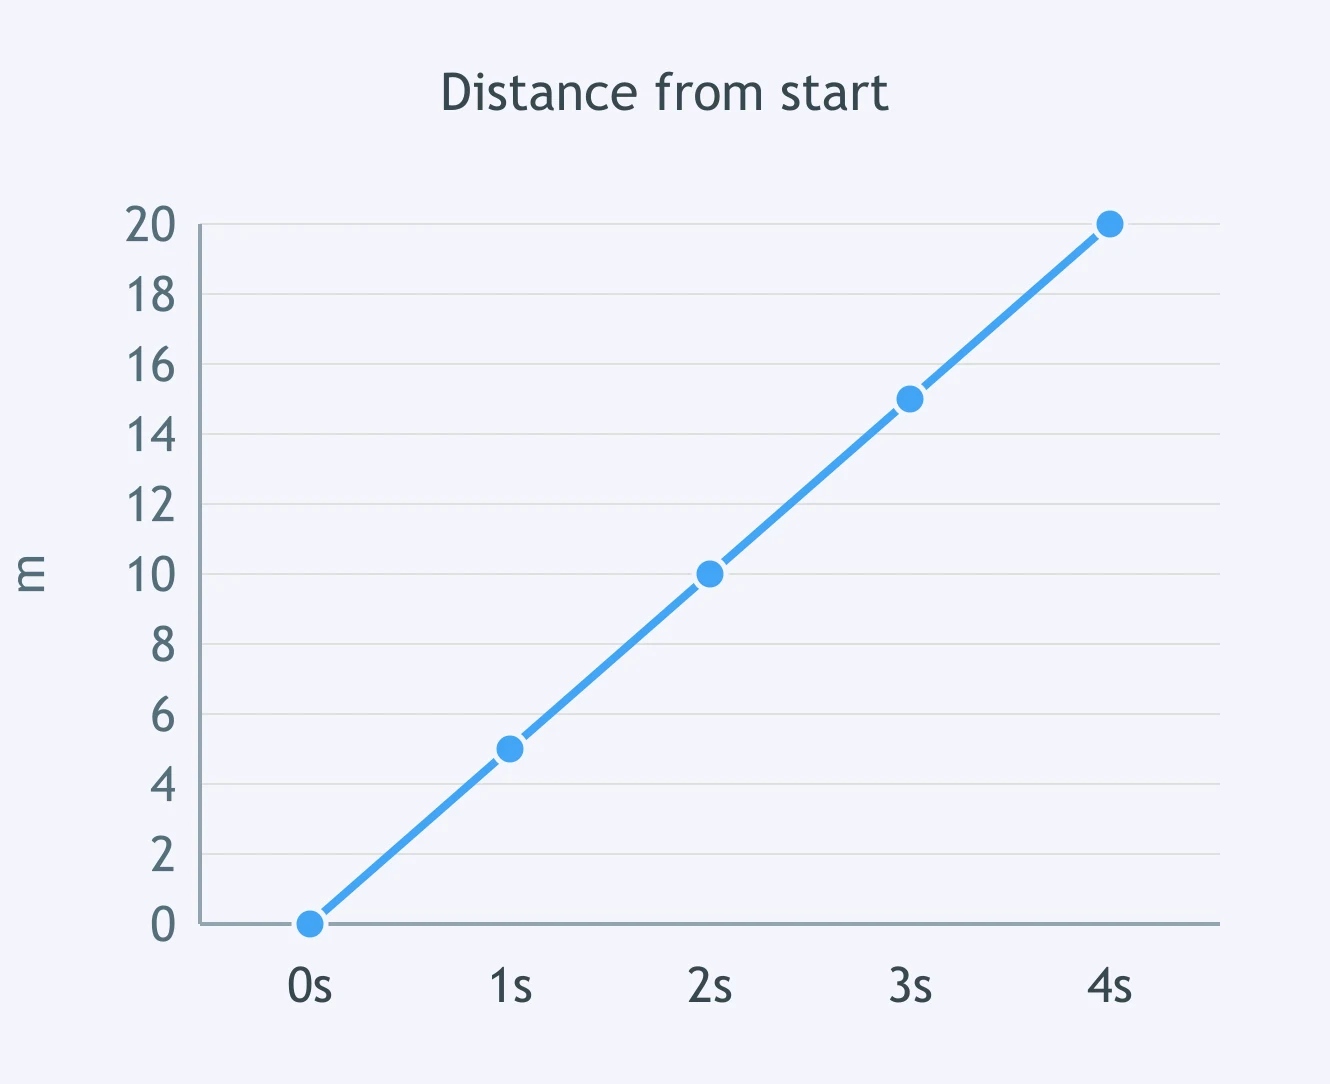
Read the graph of distance from the start. What distance is shown at 6 s?
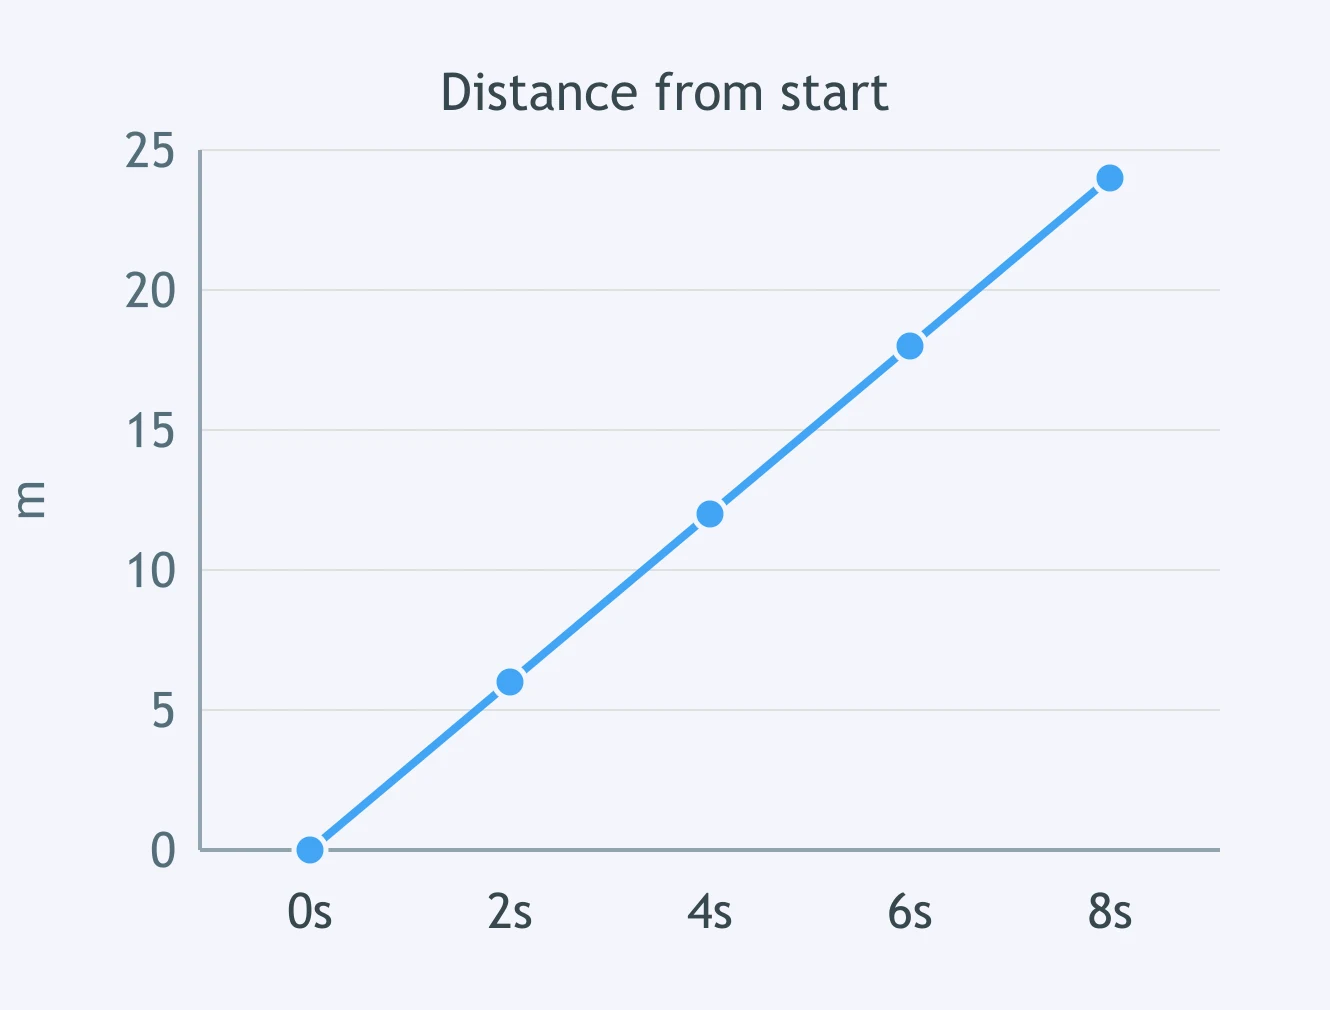
A cart's distance-time graph is shown. At what time is the cart 8 m from the start?
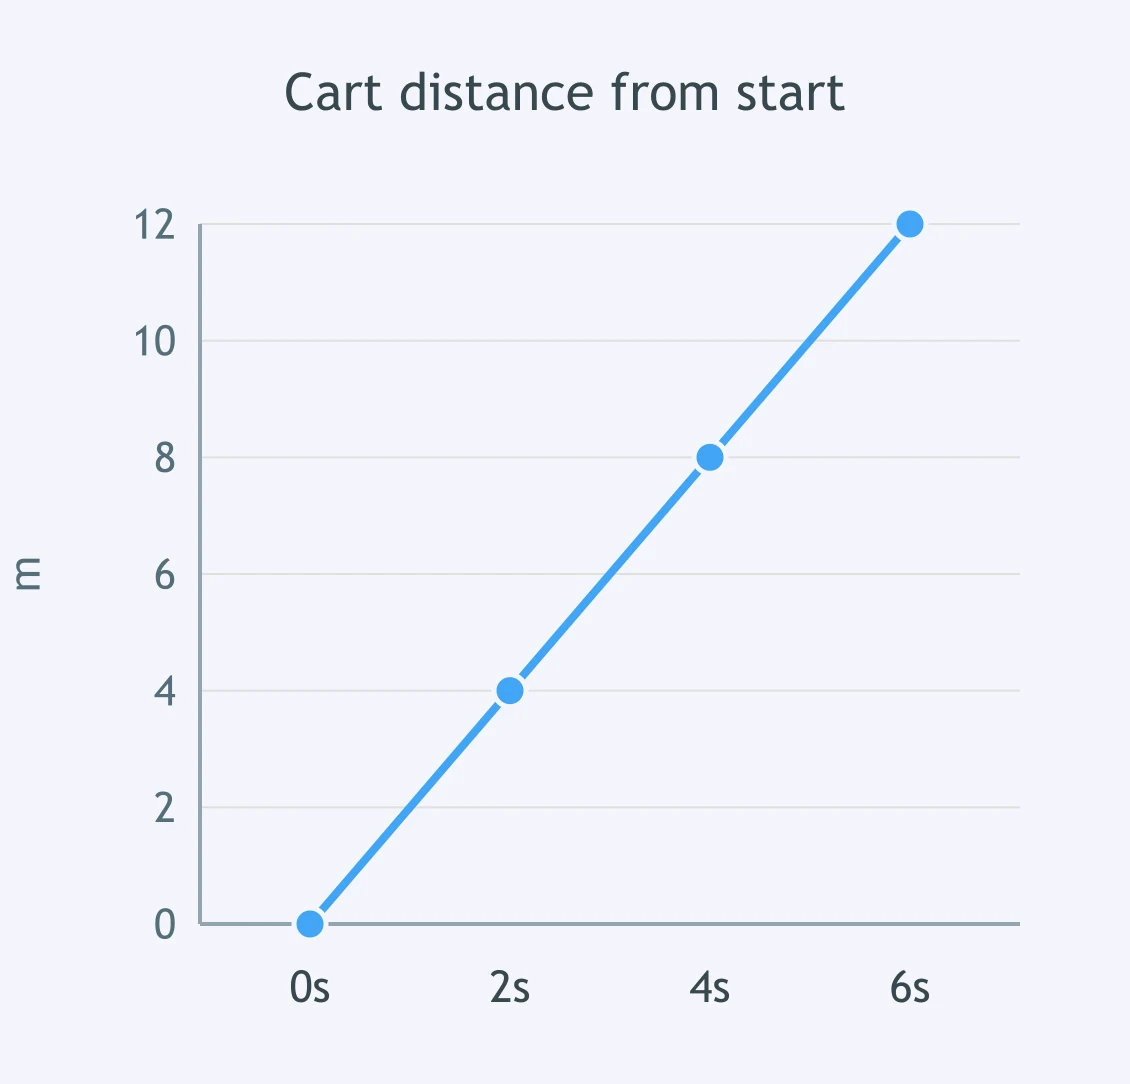
Use the graph. What distance from the start does the runner have at 2 s?
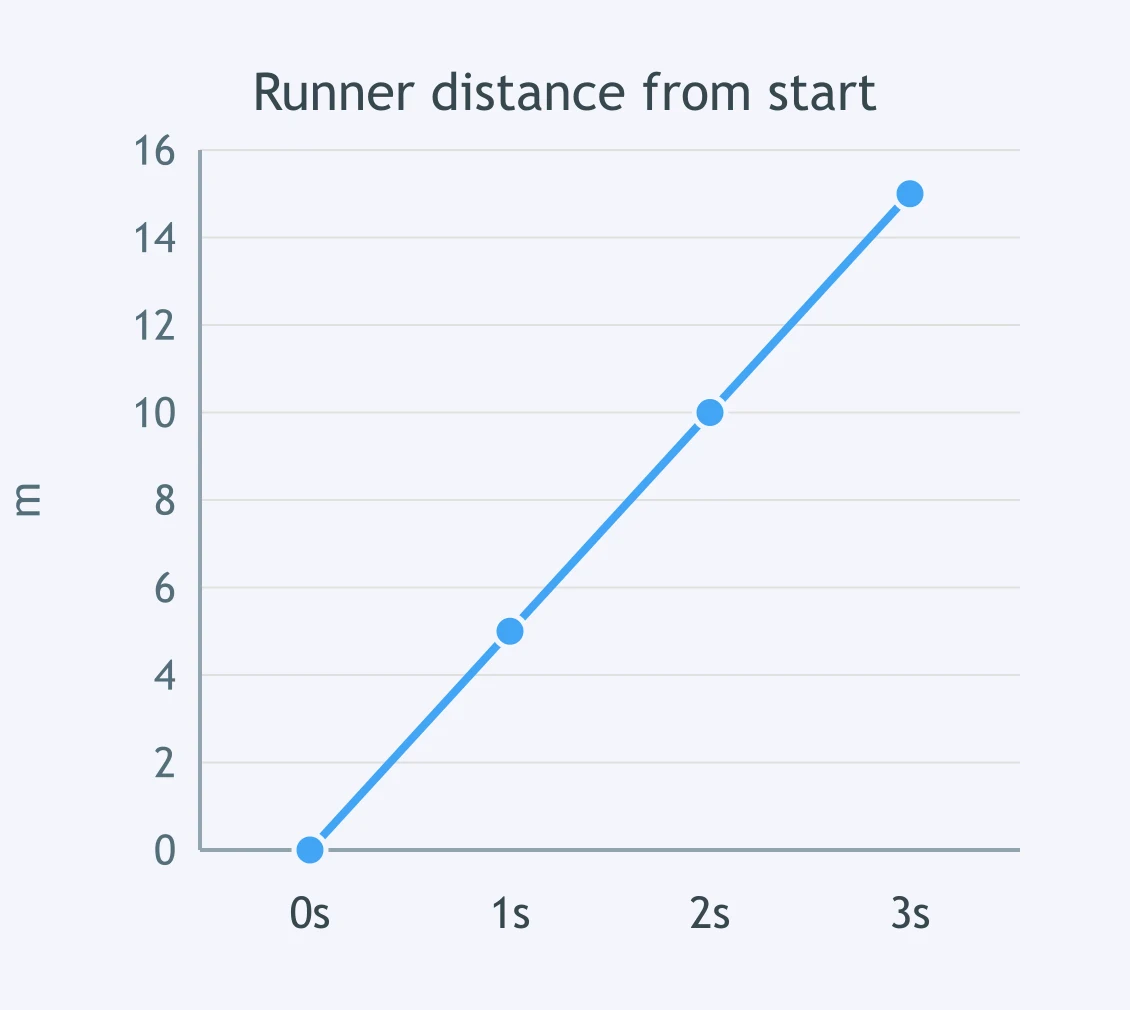
Look at the graph. When is the object's distance from the start 24 m?
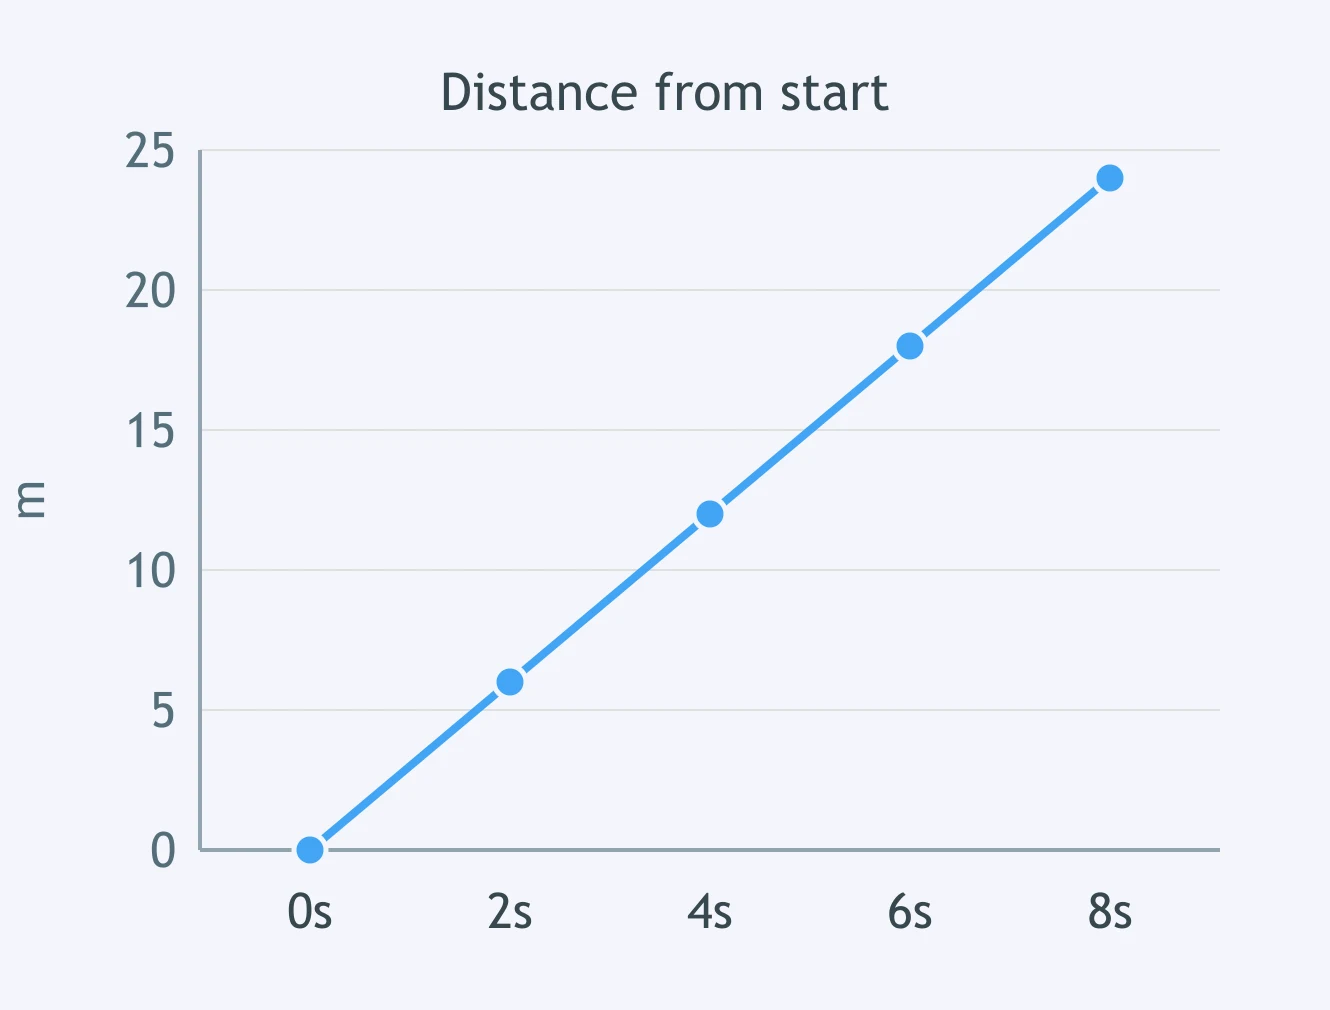
Use the straight segment from 0 s to 4 s. What is the object's average speed during that segment?
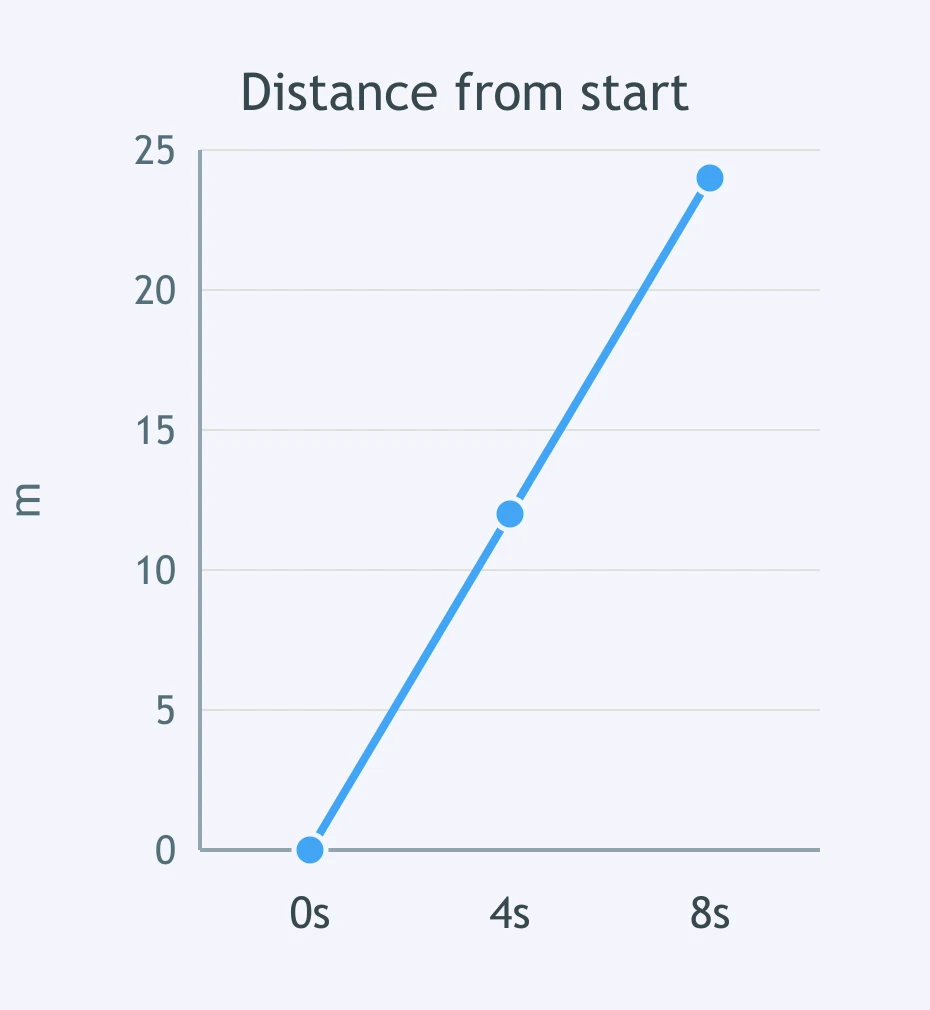
The graph shows one straight rising line. What speed does its slope represent?
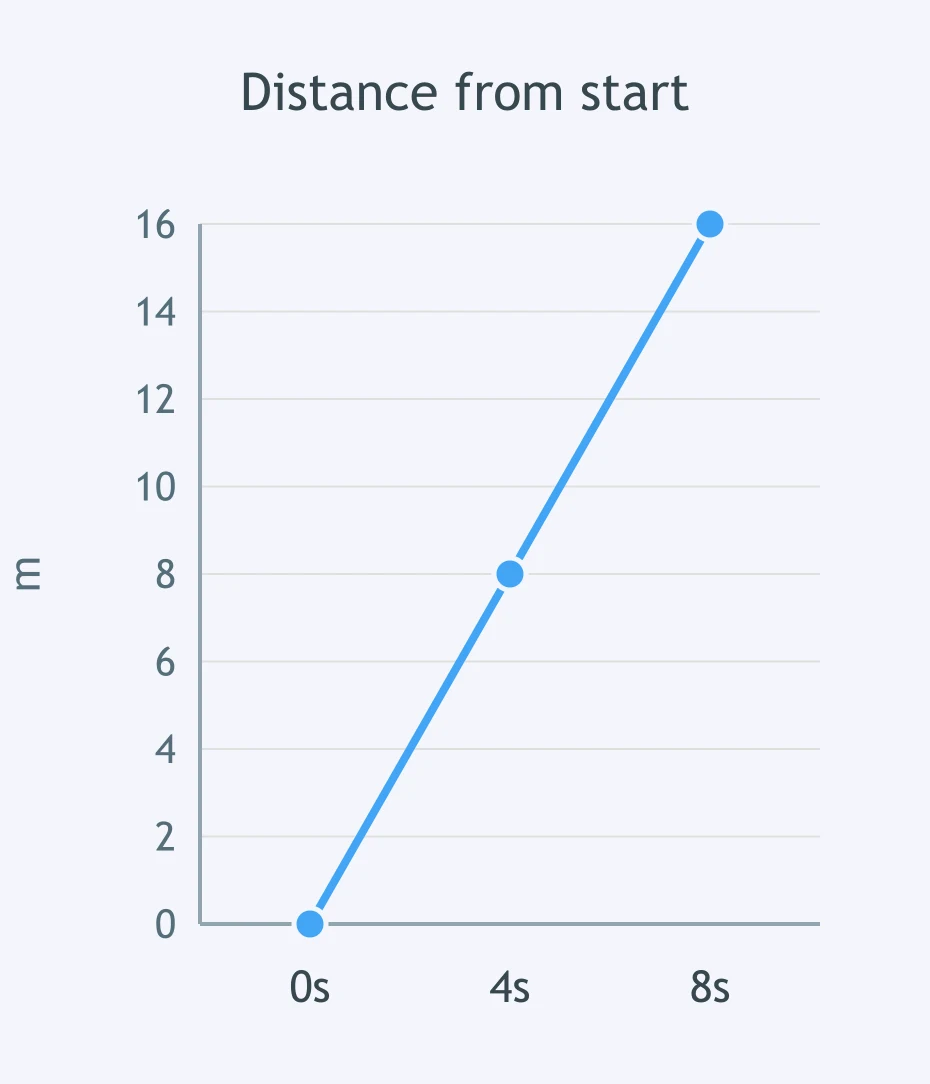
From 2 s to 6 s, use the graph to calculate average speed for that segment.
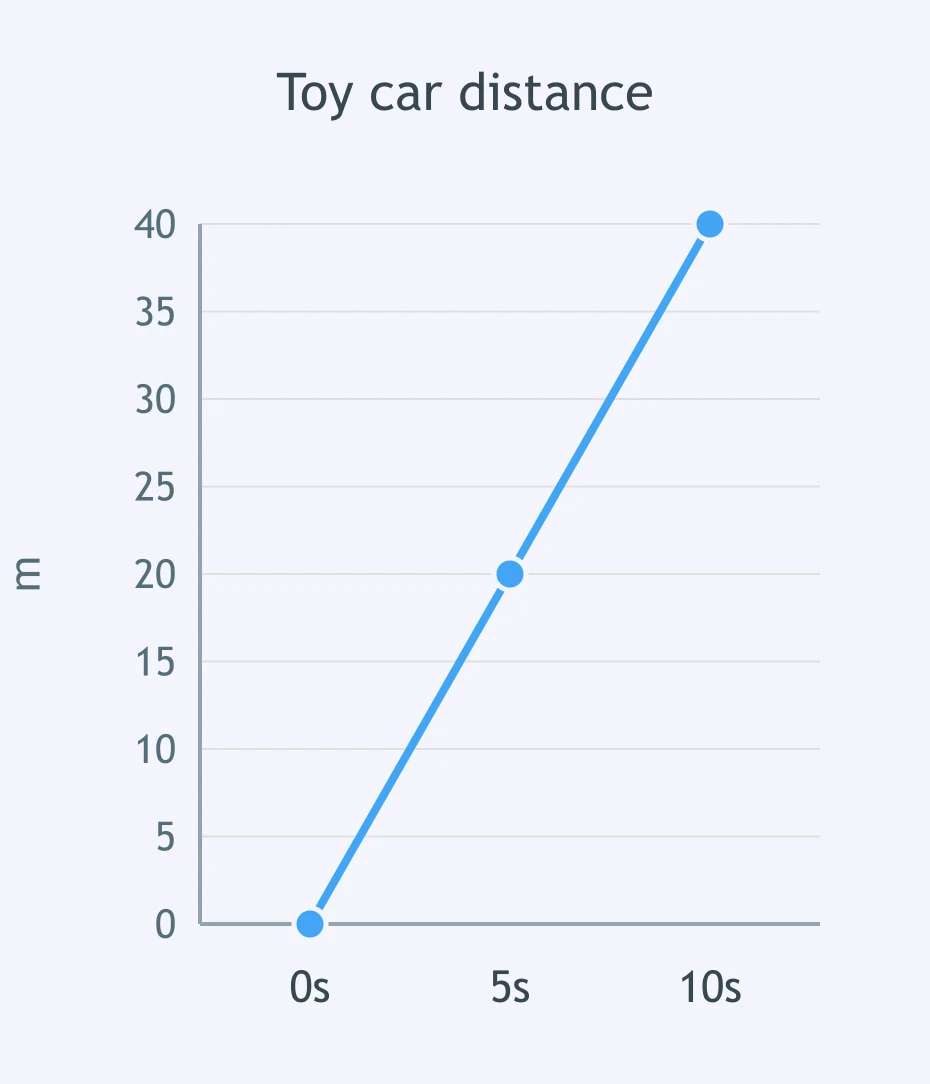
A toy car's graph has a straight segment from 0 s to 5 s. What is the car's speed there?
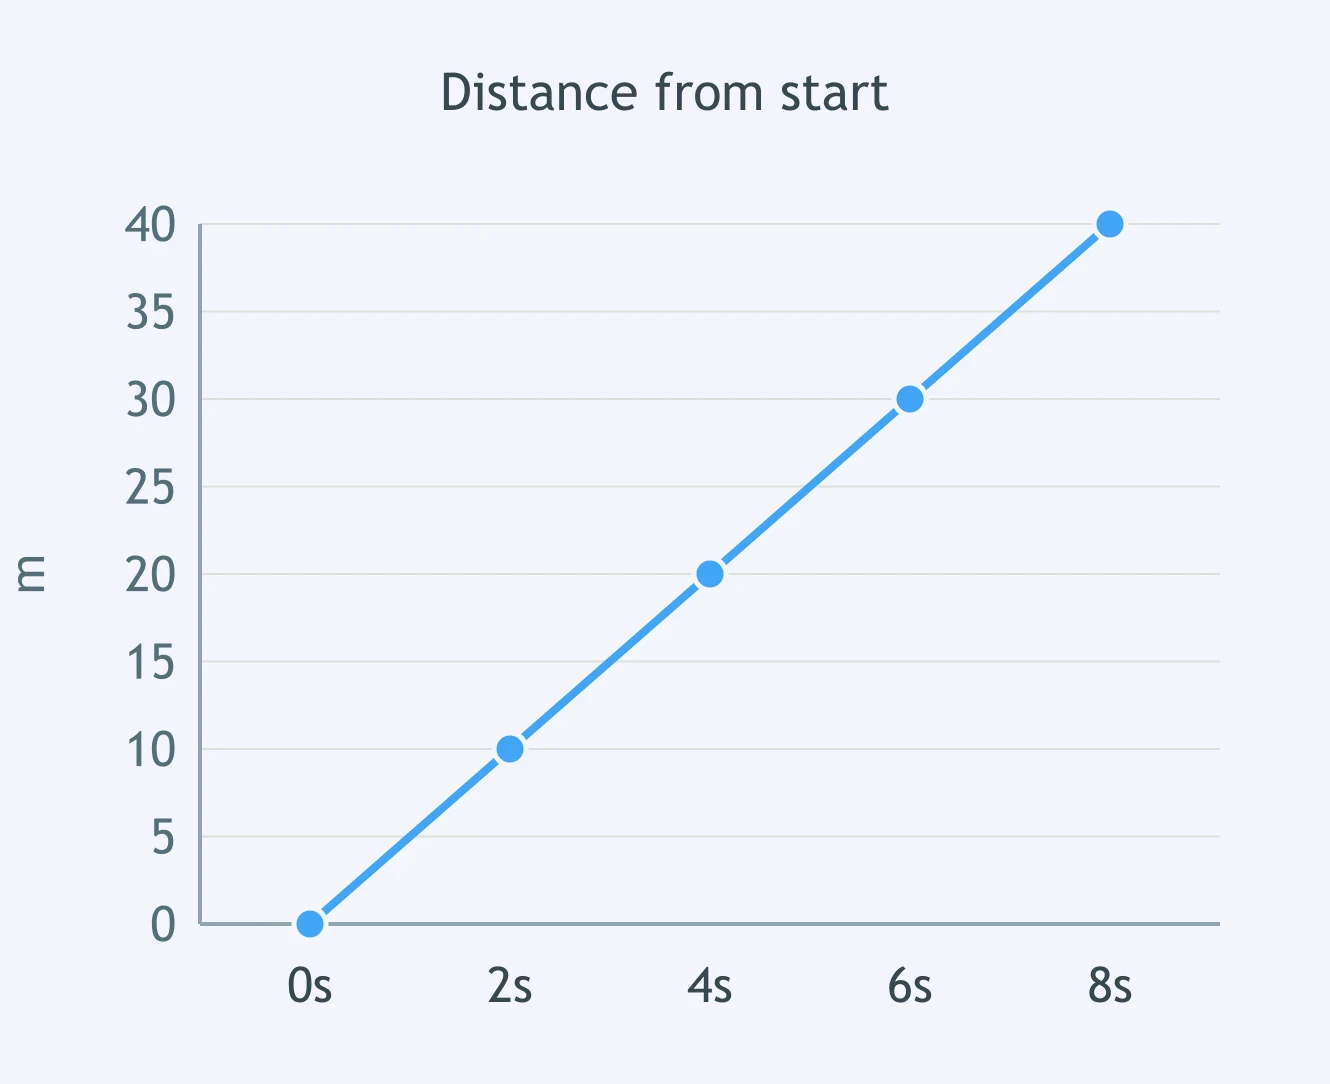
Use the first rising segment of the graph. What average speed is shown from 0 s to 3 s?
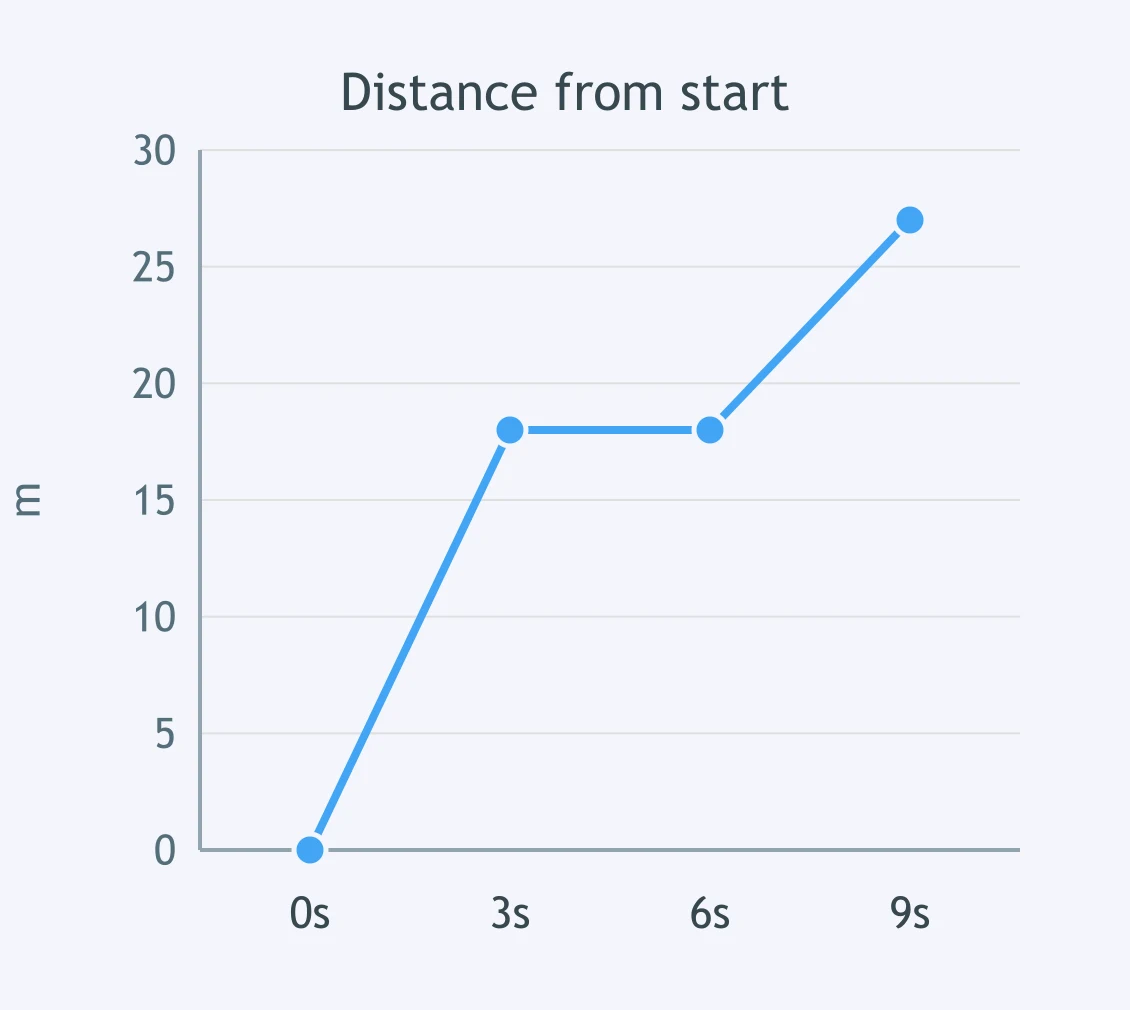
For the segment from 4 s to 8 s, what average speed does the graph show?
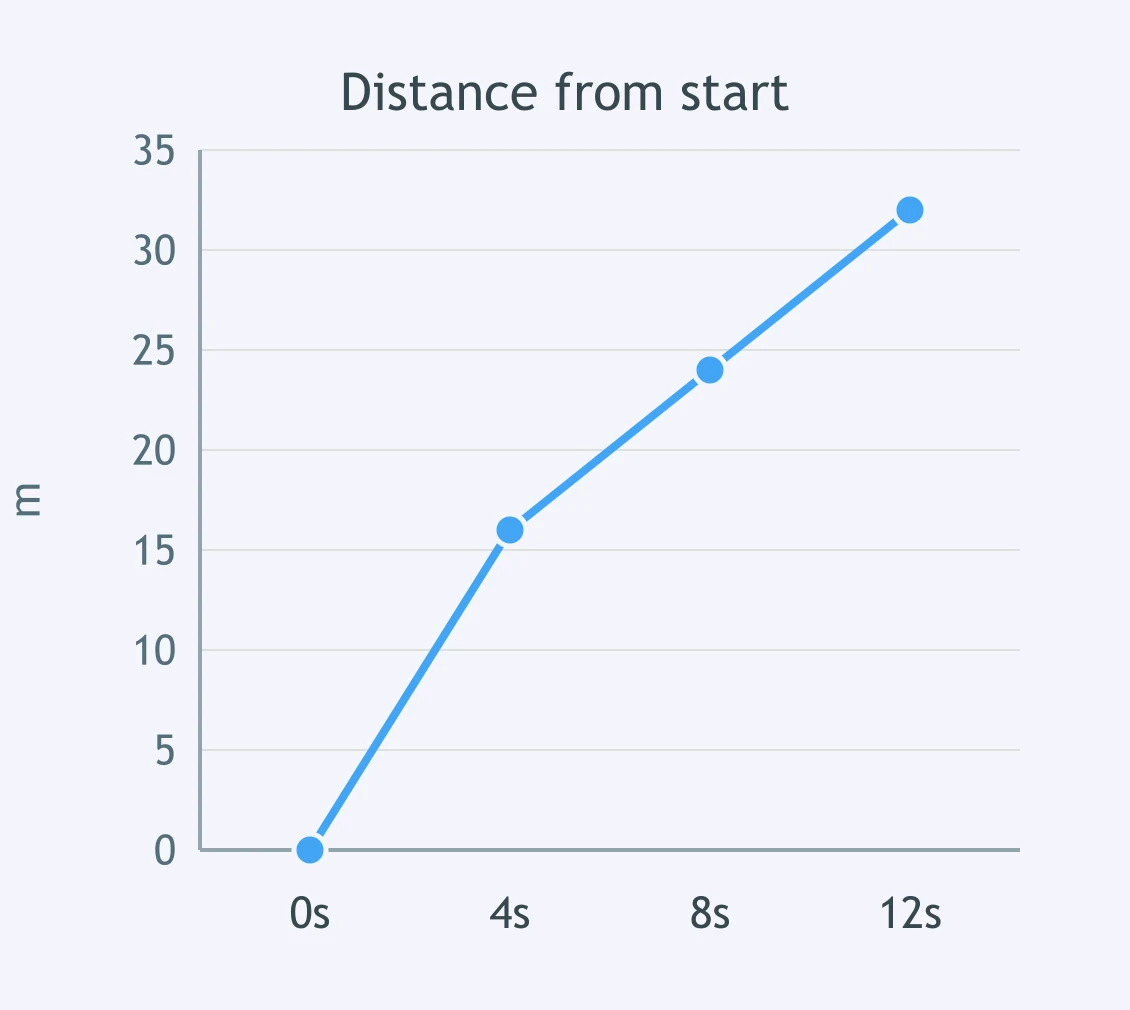
The graph's line rises evenly from the start to 6 s. What is the object's speed?
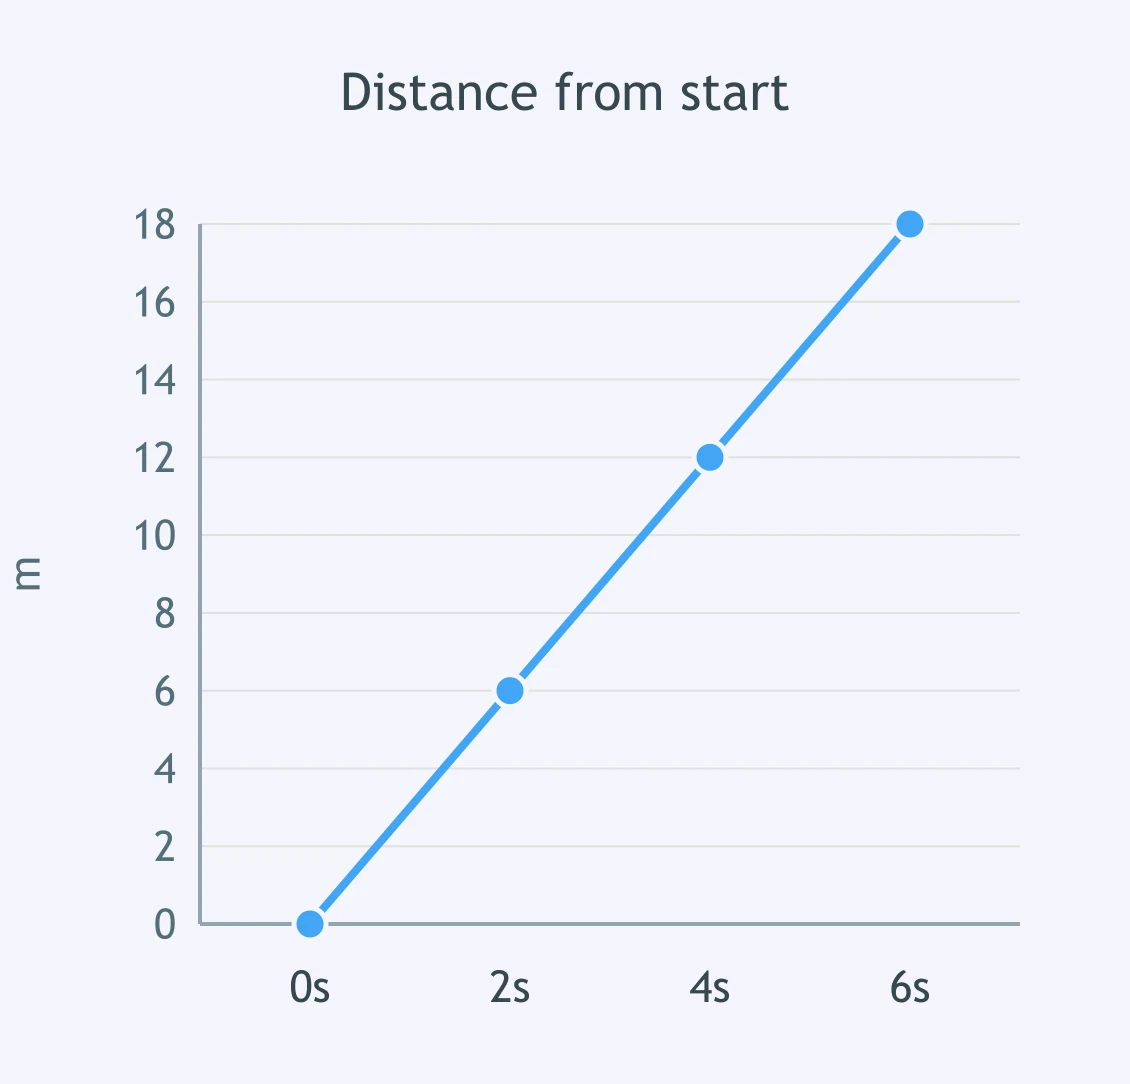
Calculate the average speed from 1 s to 5 s using the graph.
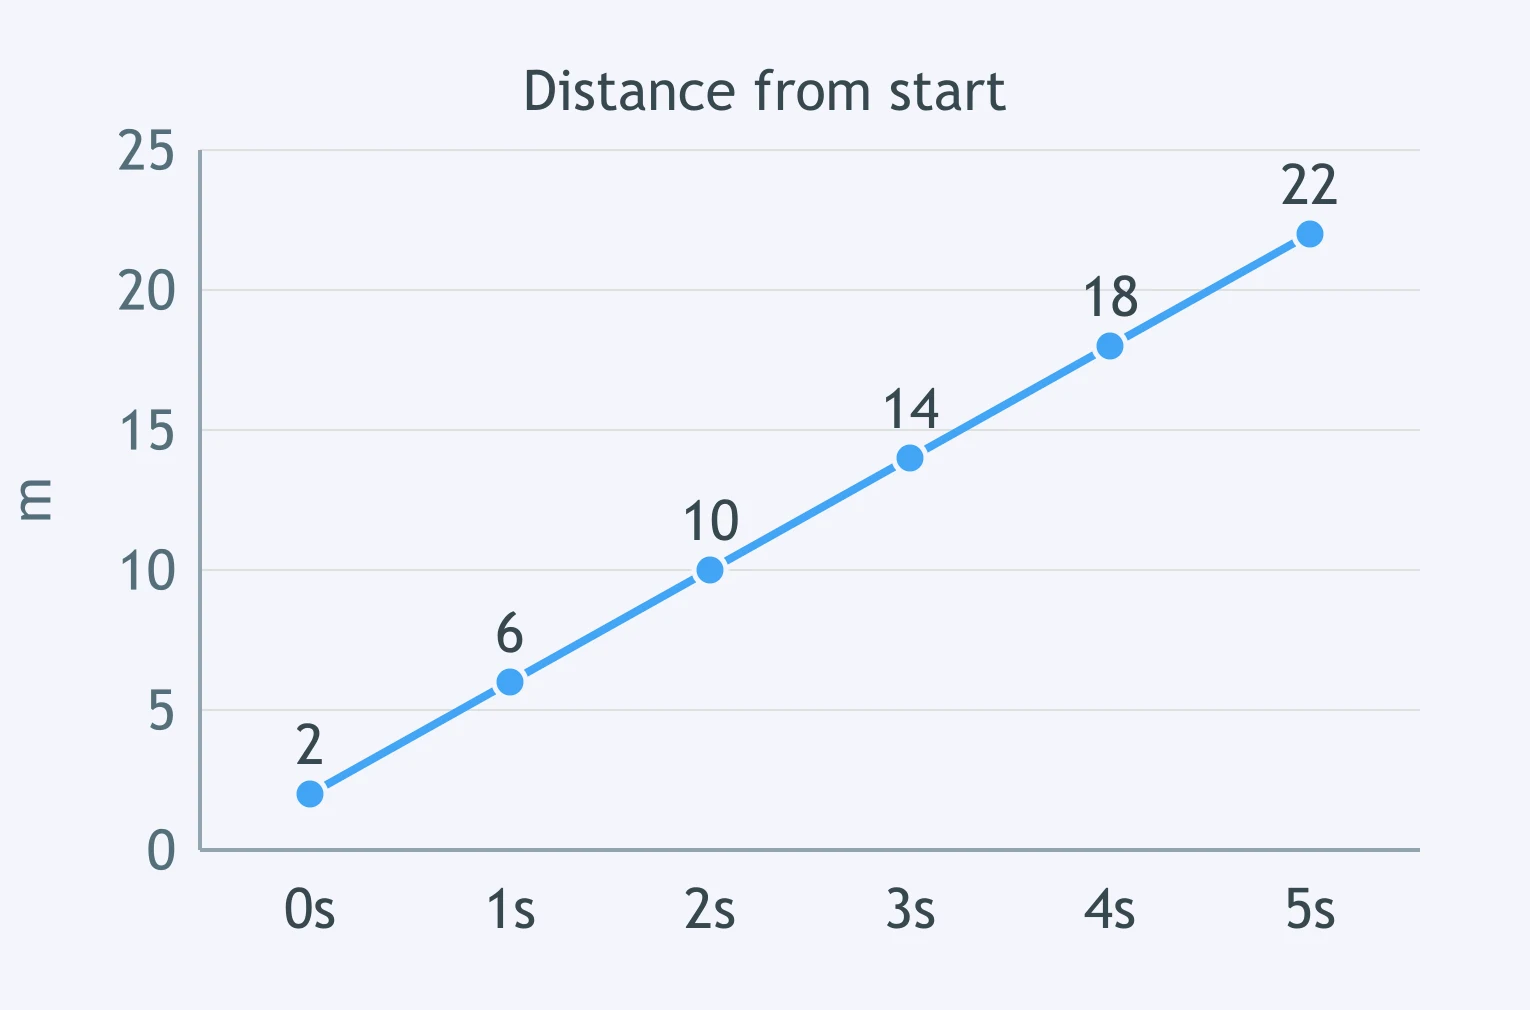
Use the rising segment from 6 s to 10 s. What average speed is shown?
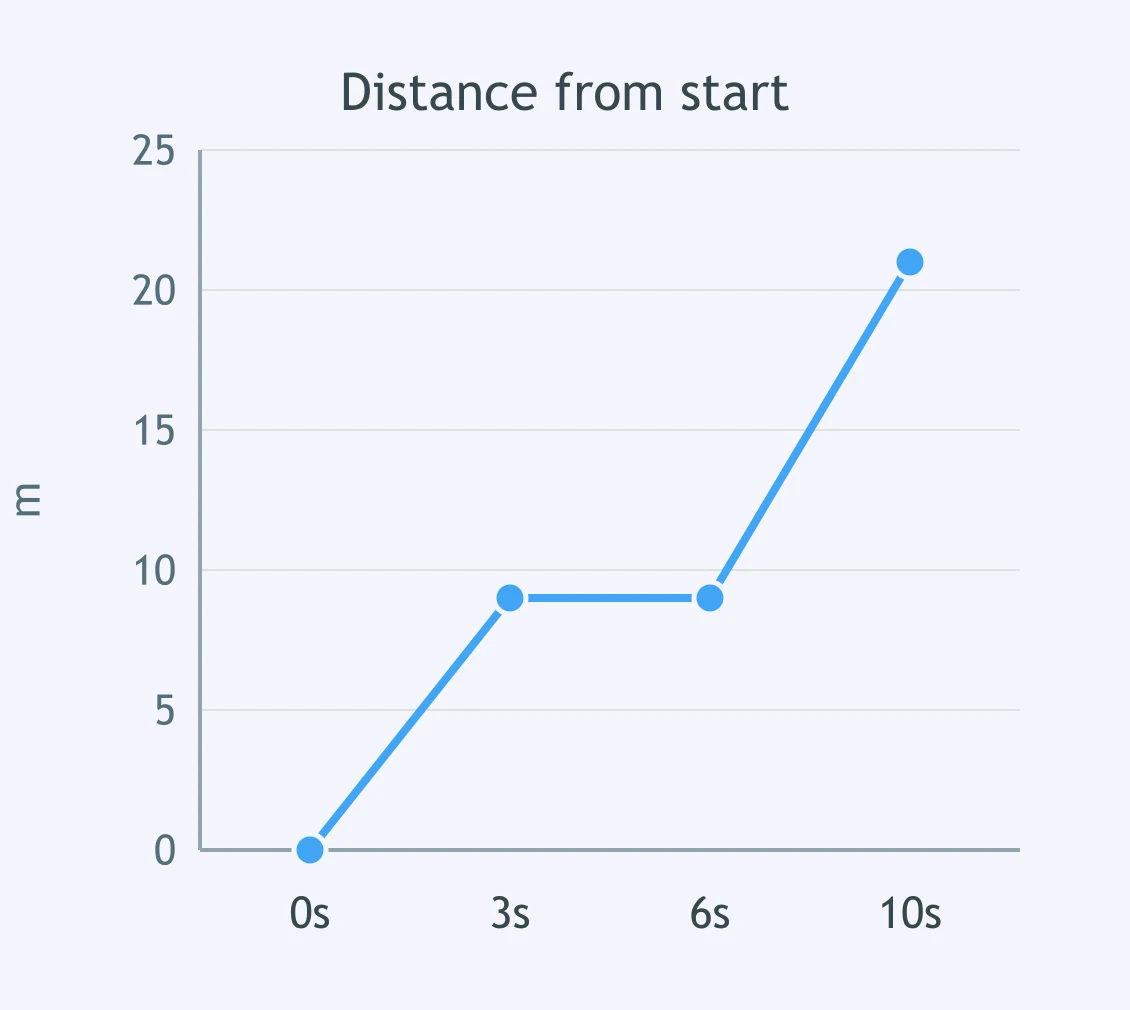
A robot's distance-time graph is shown. What speed is shown from 0 s to 2 s?
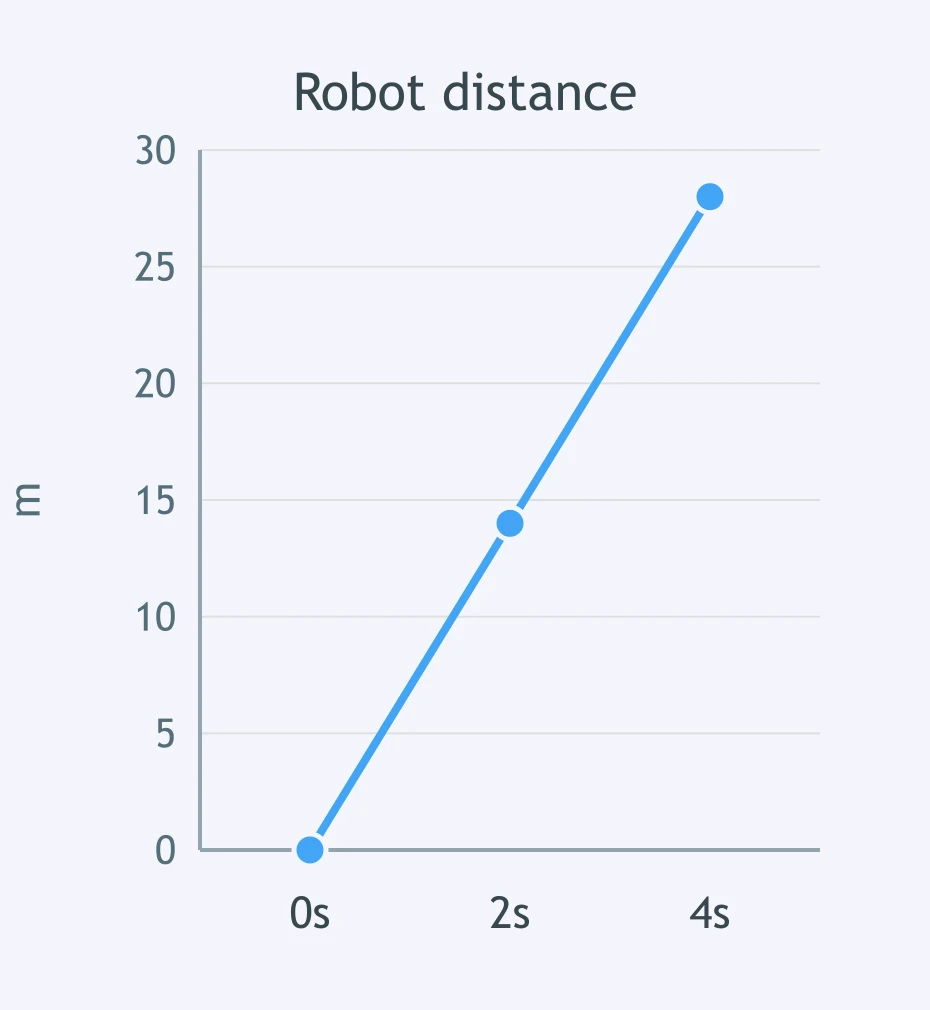
Use the last rising segment. What average speed does the graph show from 8 s to 12 s?
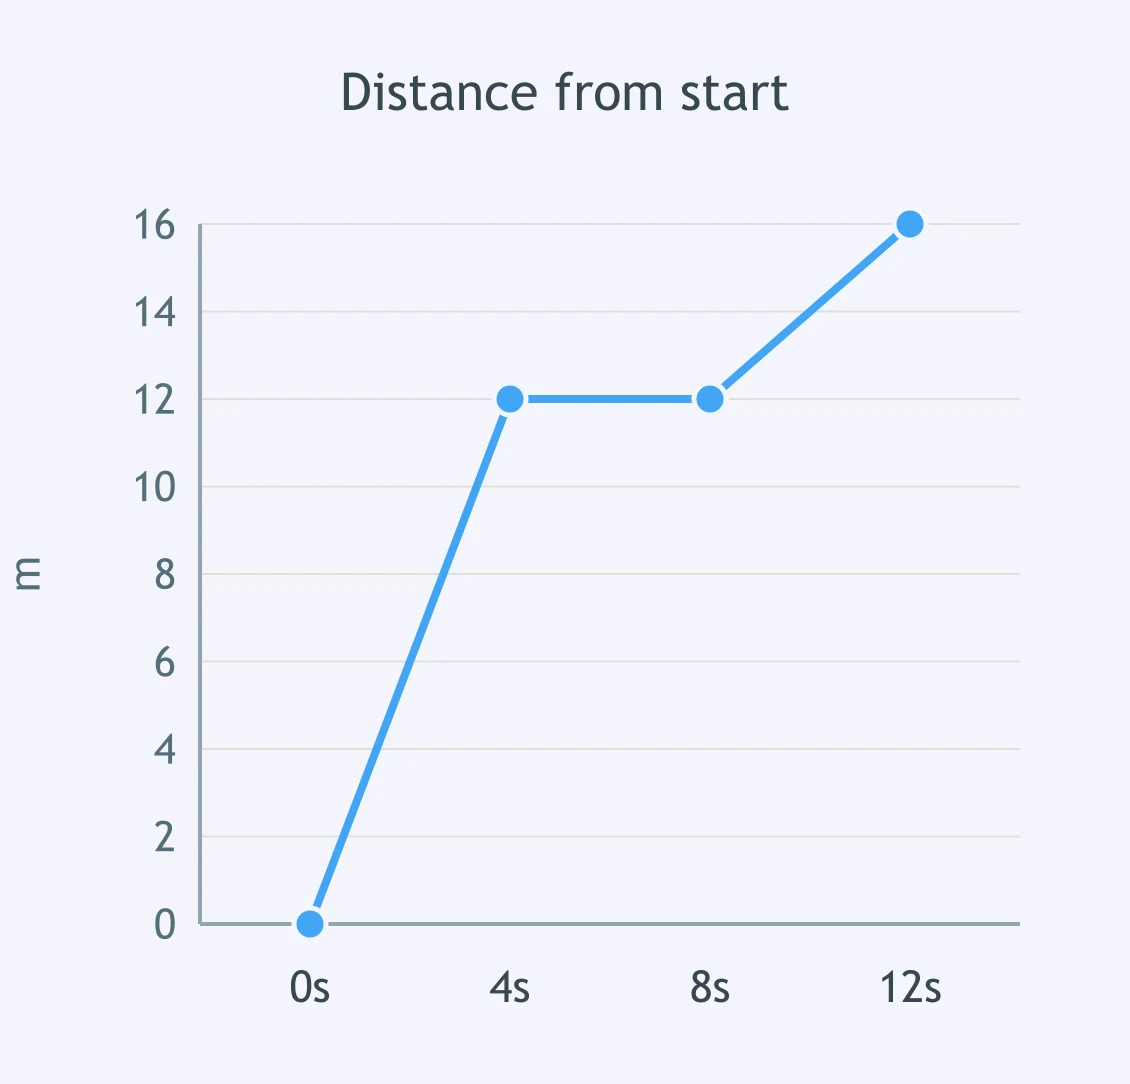
A straight line on the graph shows steady motion from 0 s to 9 s. What is the speed?
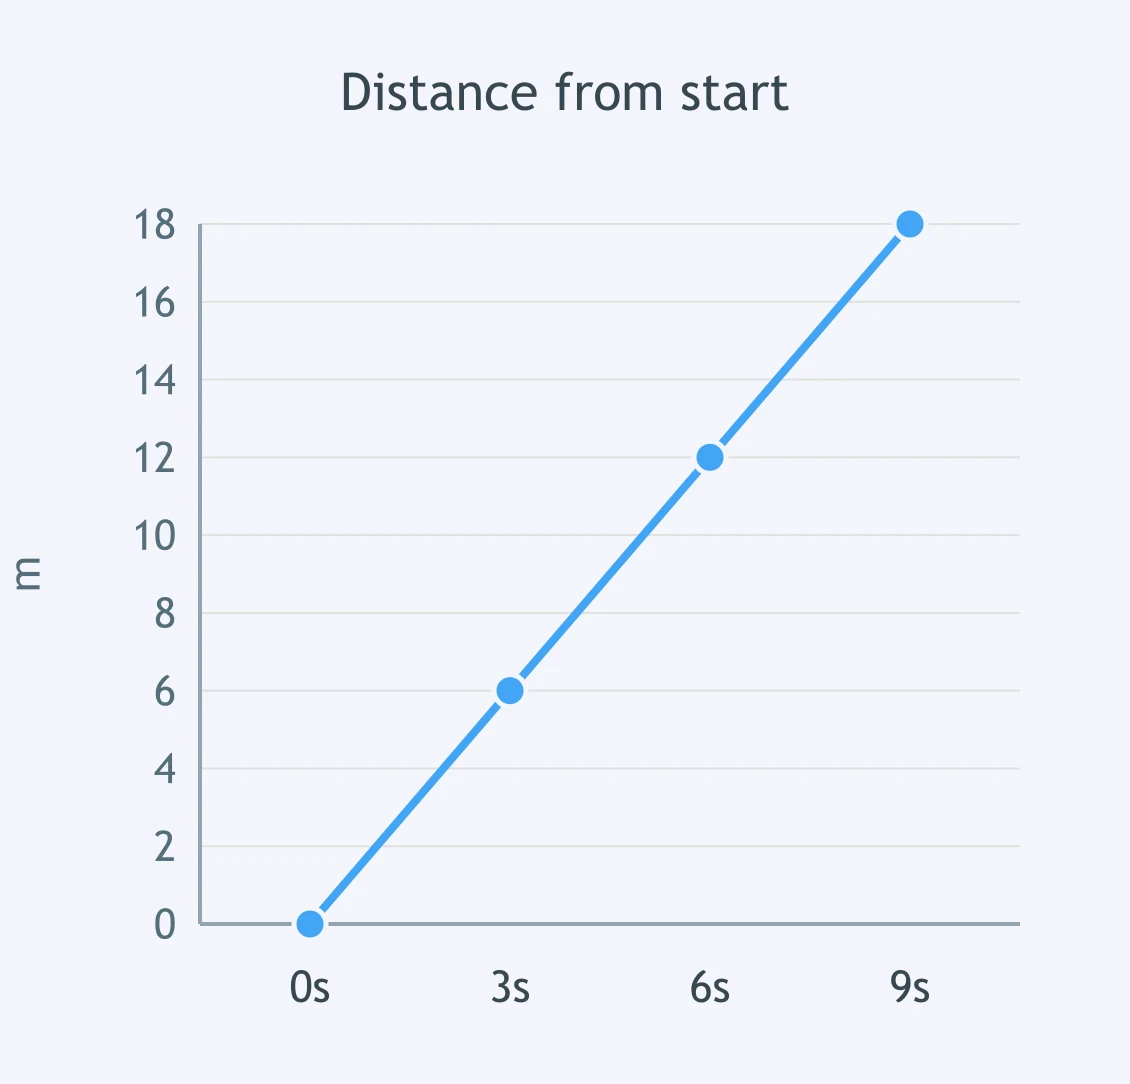
Use the graph. What was the object doing from 3 s to 7 s?
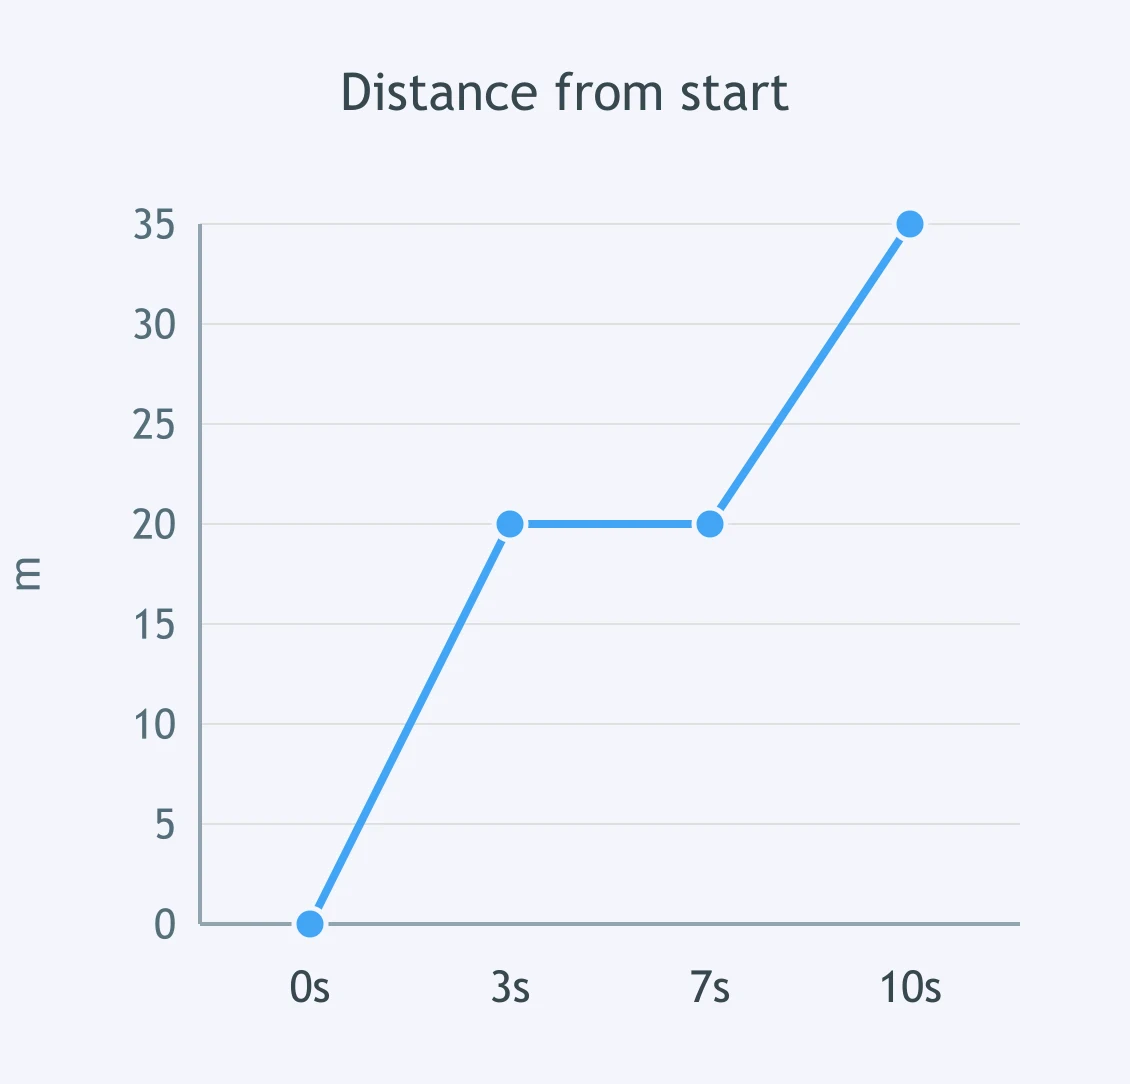
The distance-time graph has a flat section in the middle. What does that section show?
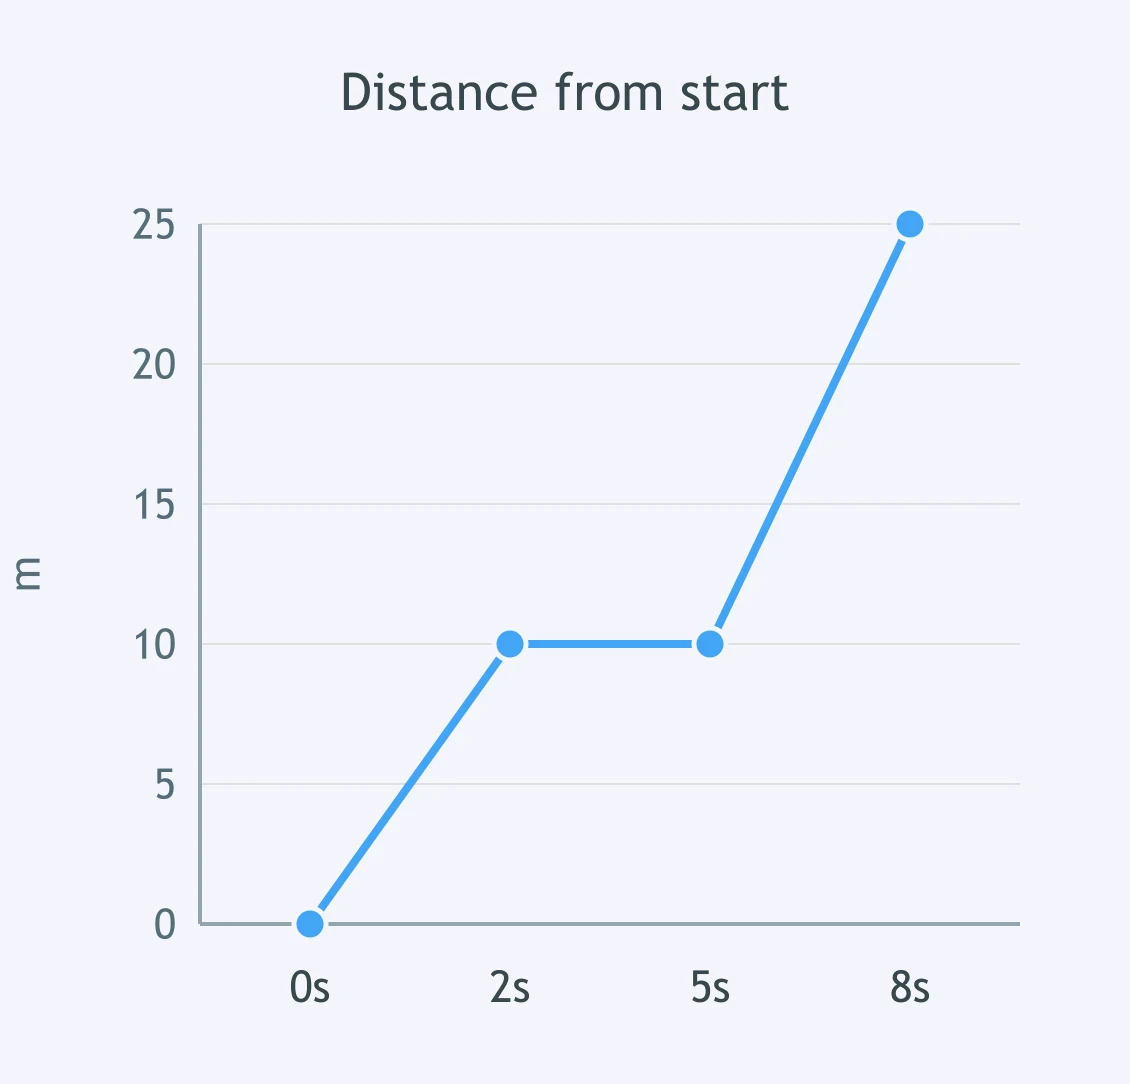
During which time interval was the object stopped, according to the graph?
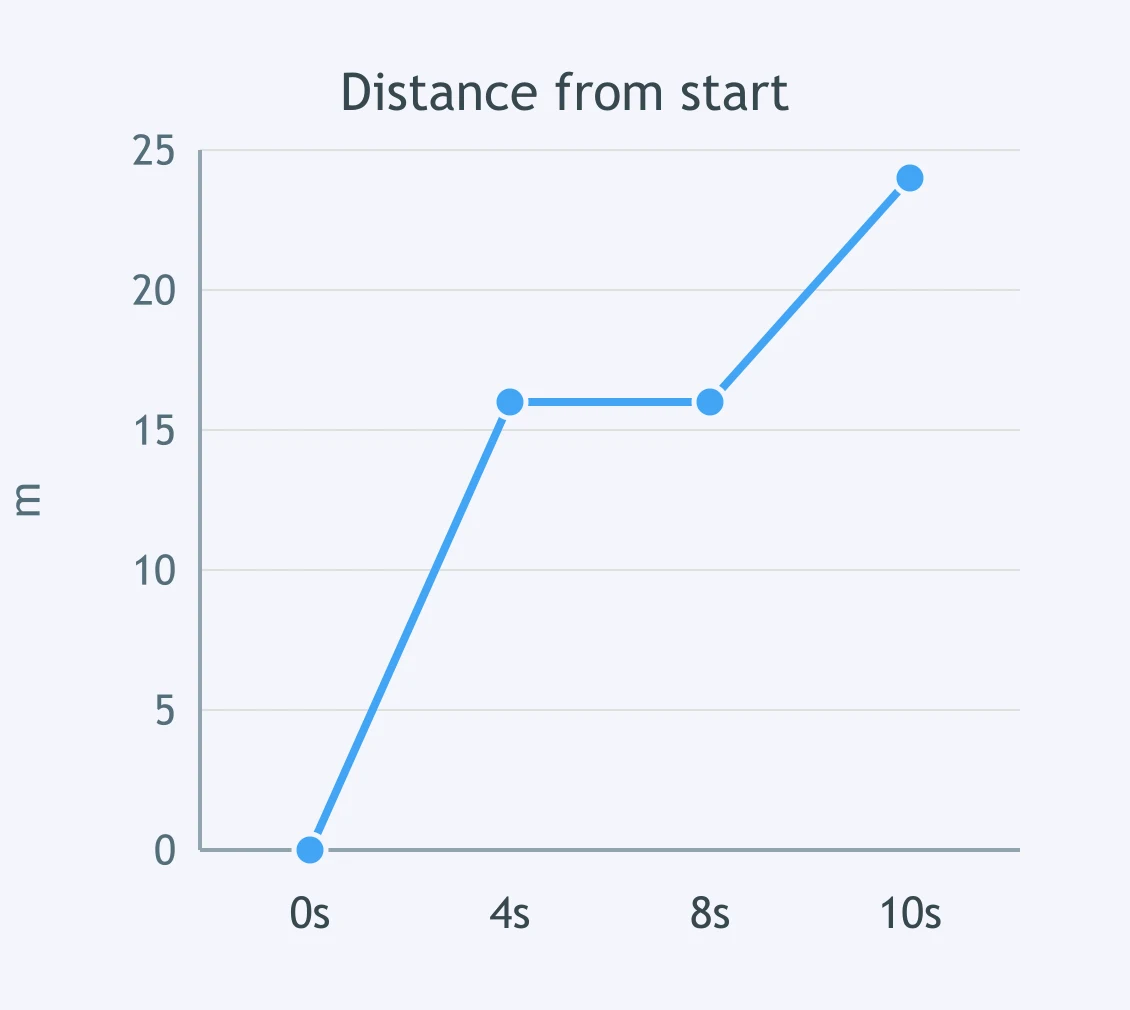
Look for the horizontal part of the graph. What happened between 6 s and 9 s?
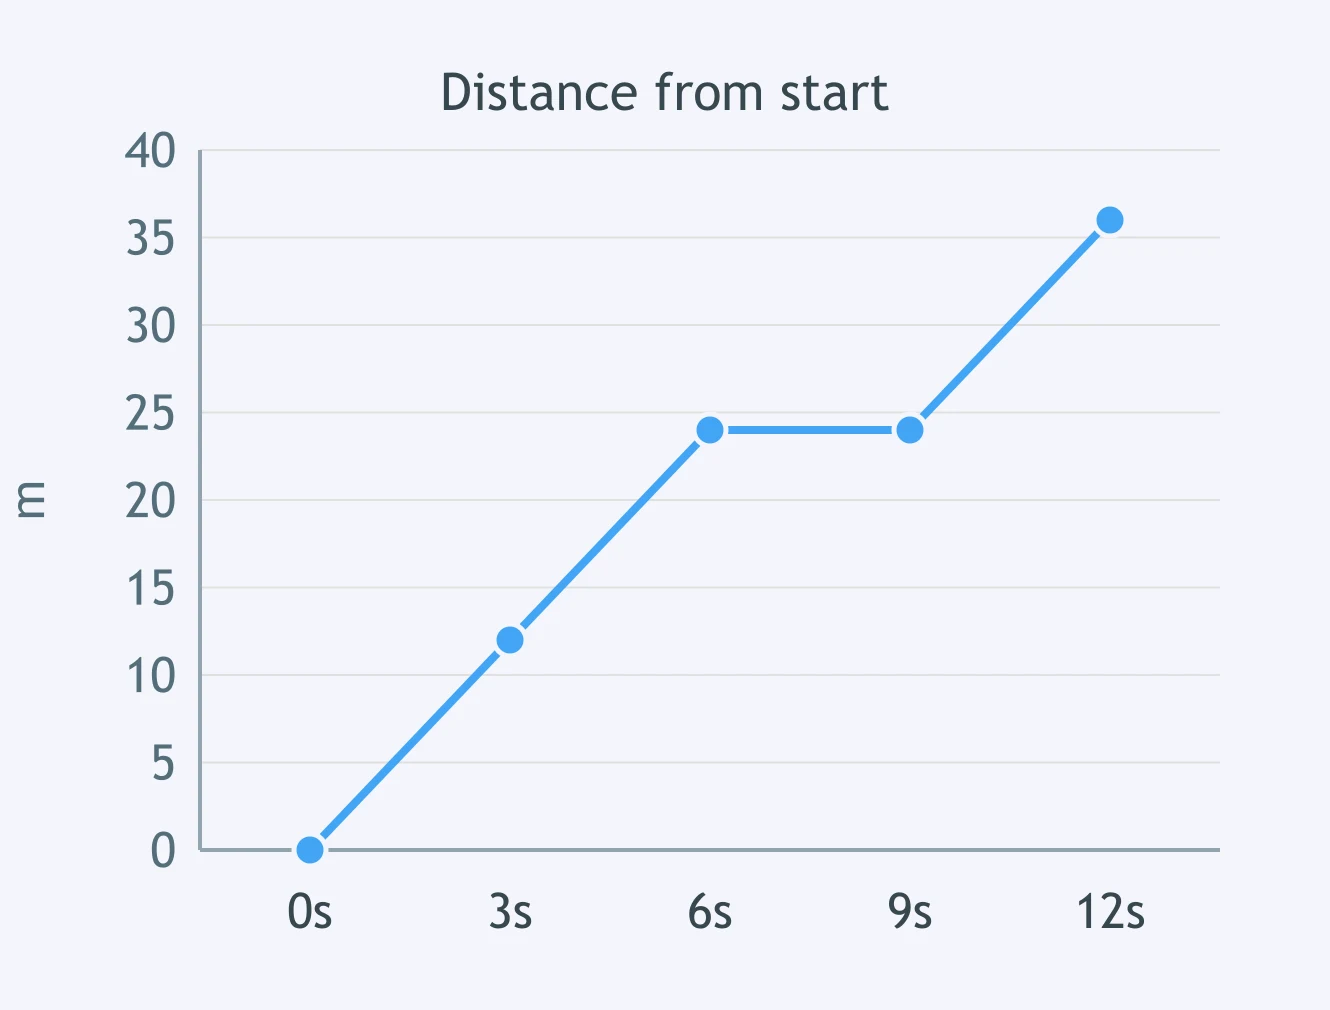
A scooter's graph is flat from 2 s to 5 s. What motion does that show?
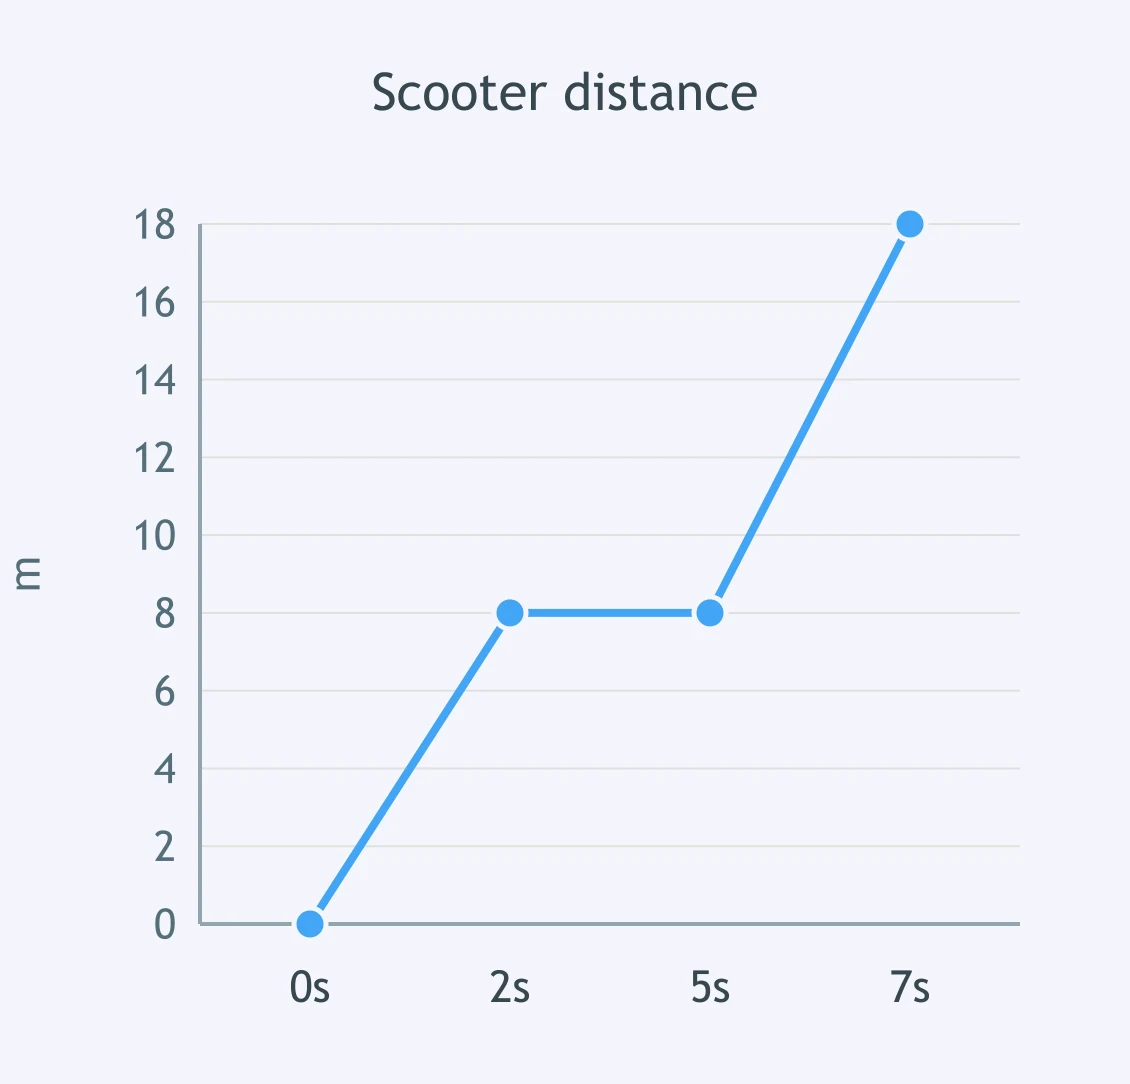
Which interval on the graph shows no change in distance from the start?
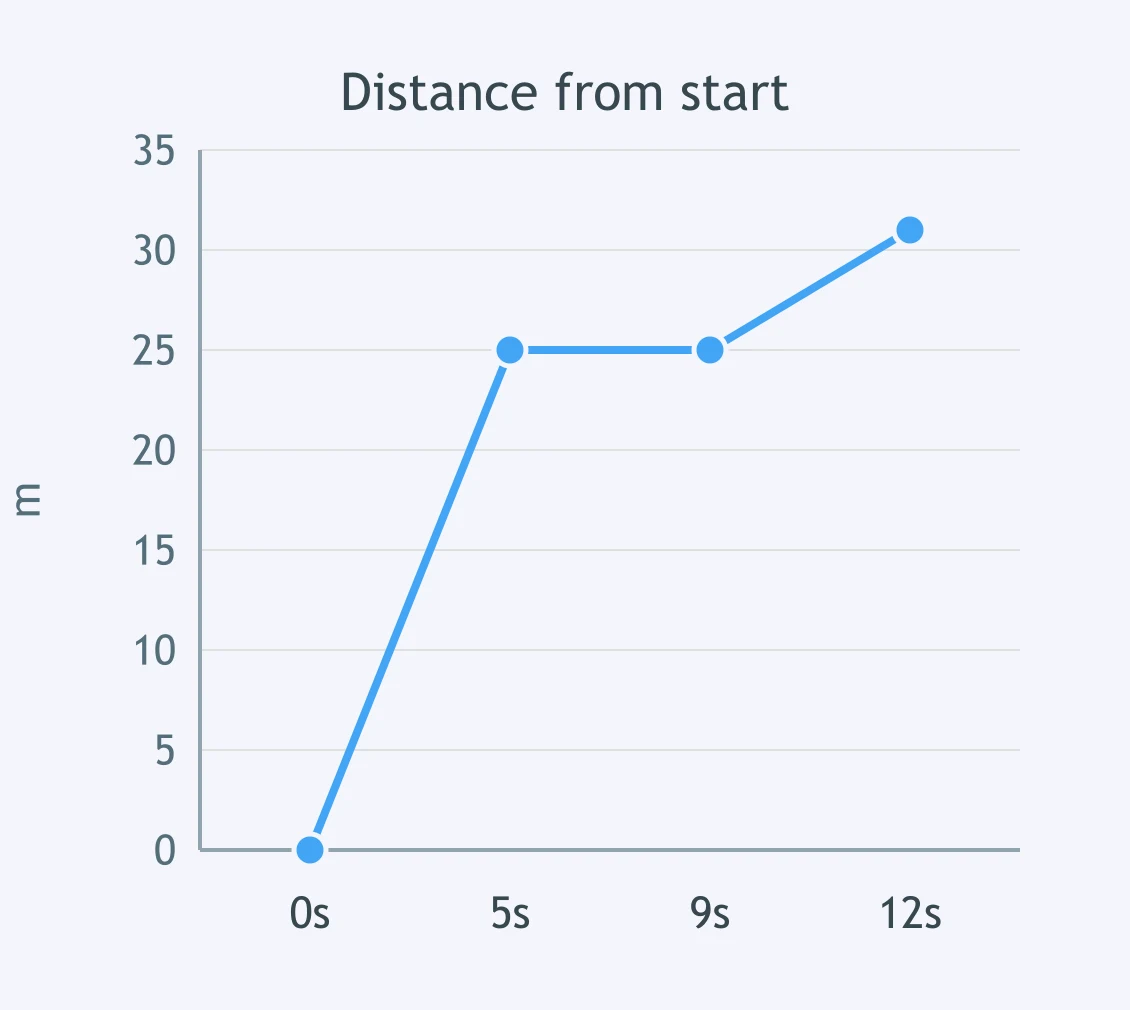
The graph shows a runner's distance from the start. When was the runner resting?
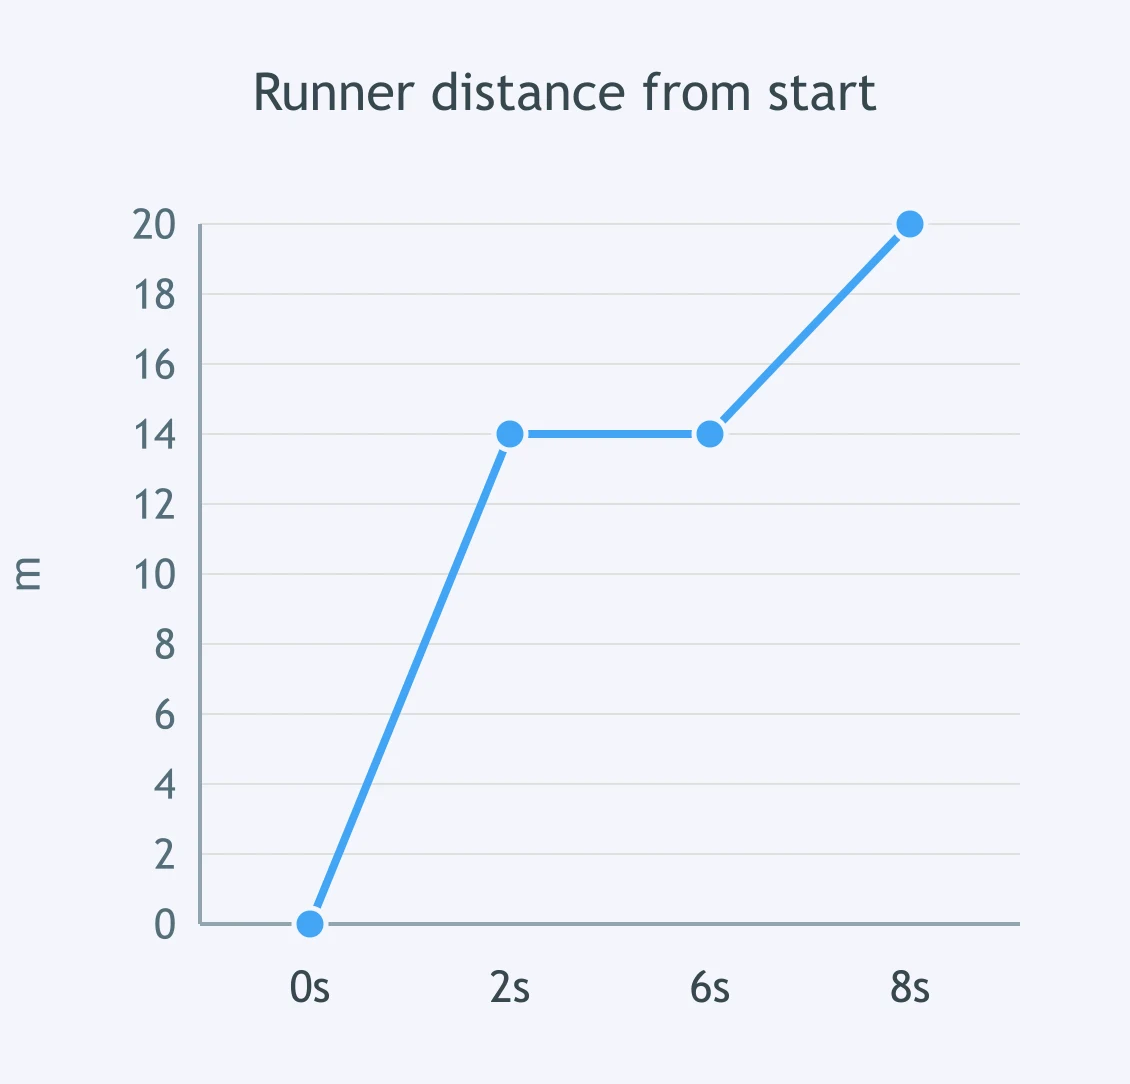
What does the graph show from 1 s to 4 s?
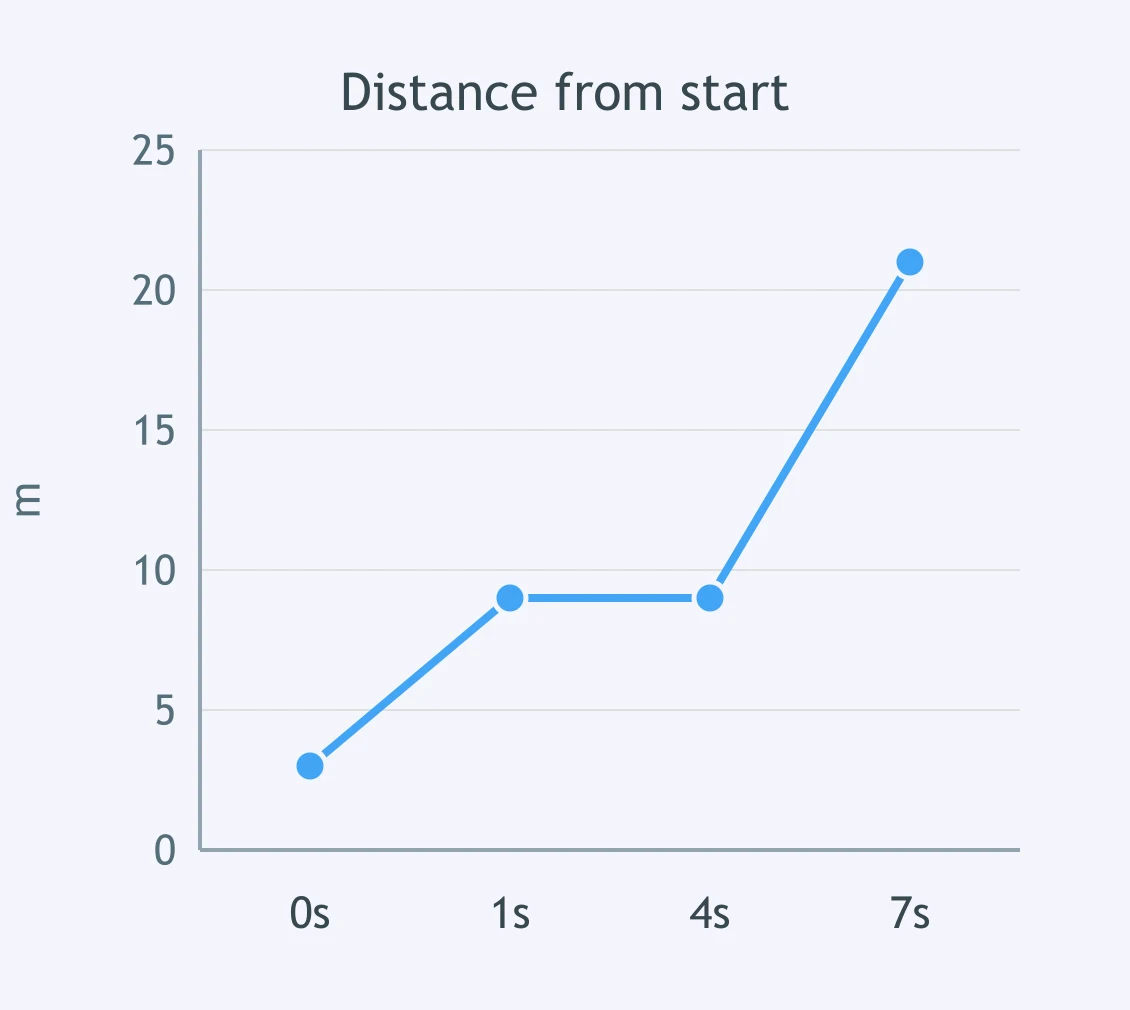
Compare the segment from 0 s to 5 s with the segment from 5 s to 10 s. Which segment shows faster motion?
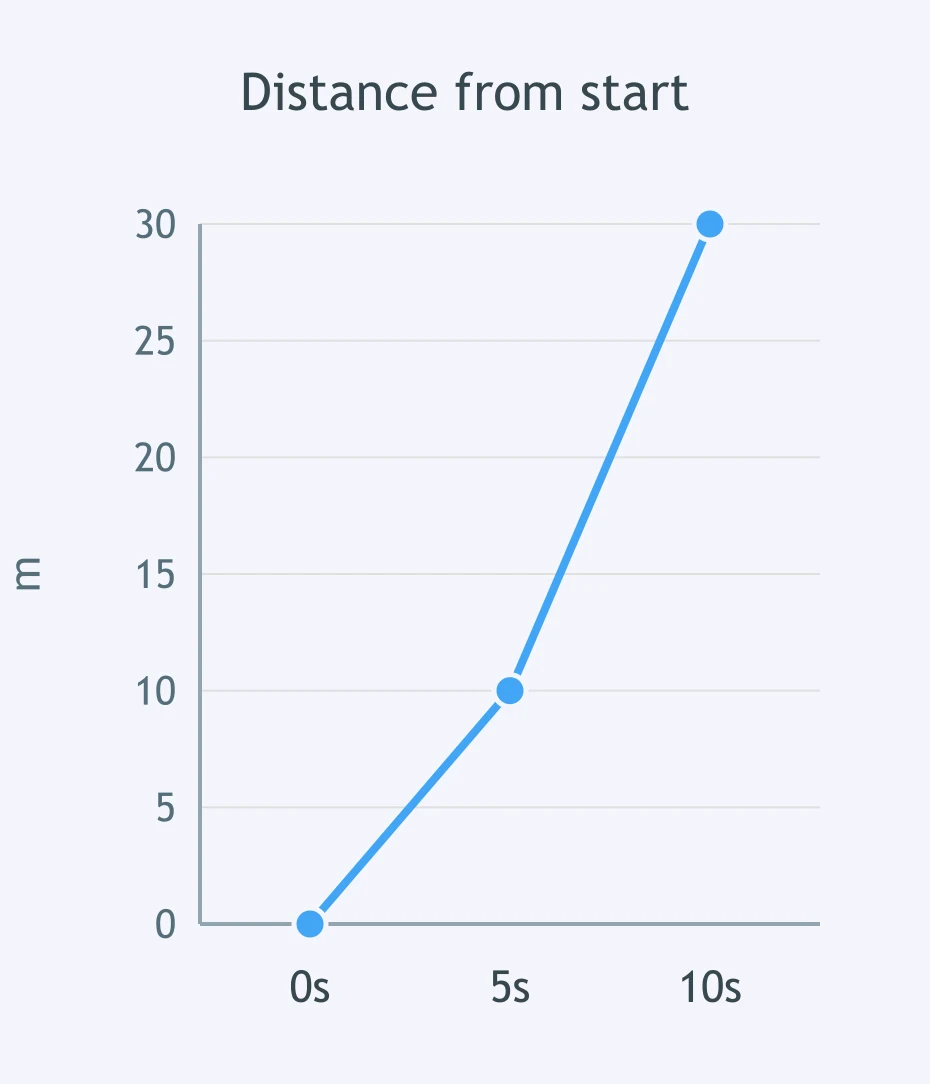
The graph has two rising sections. Which section shows the greater speed?
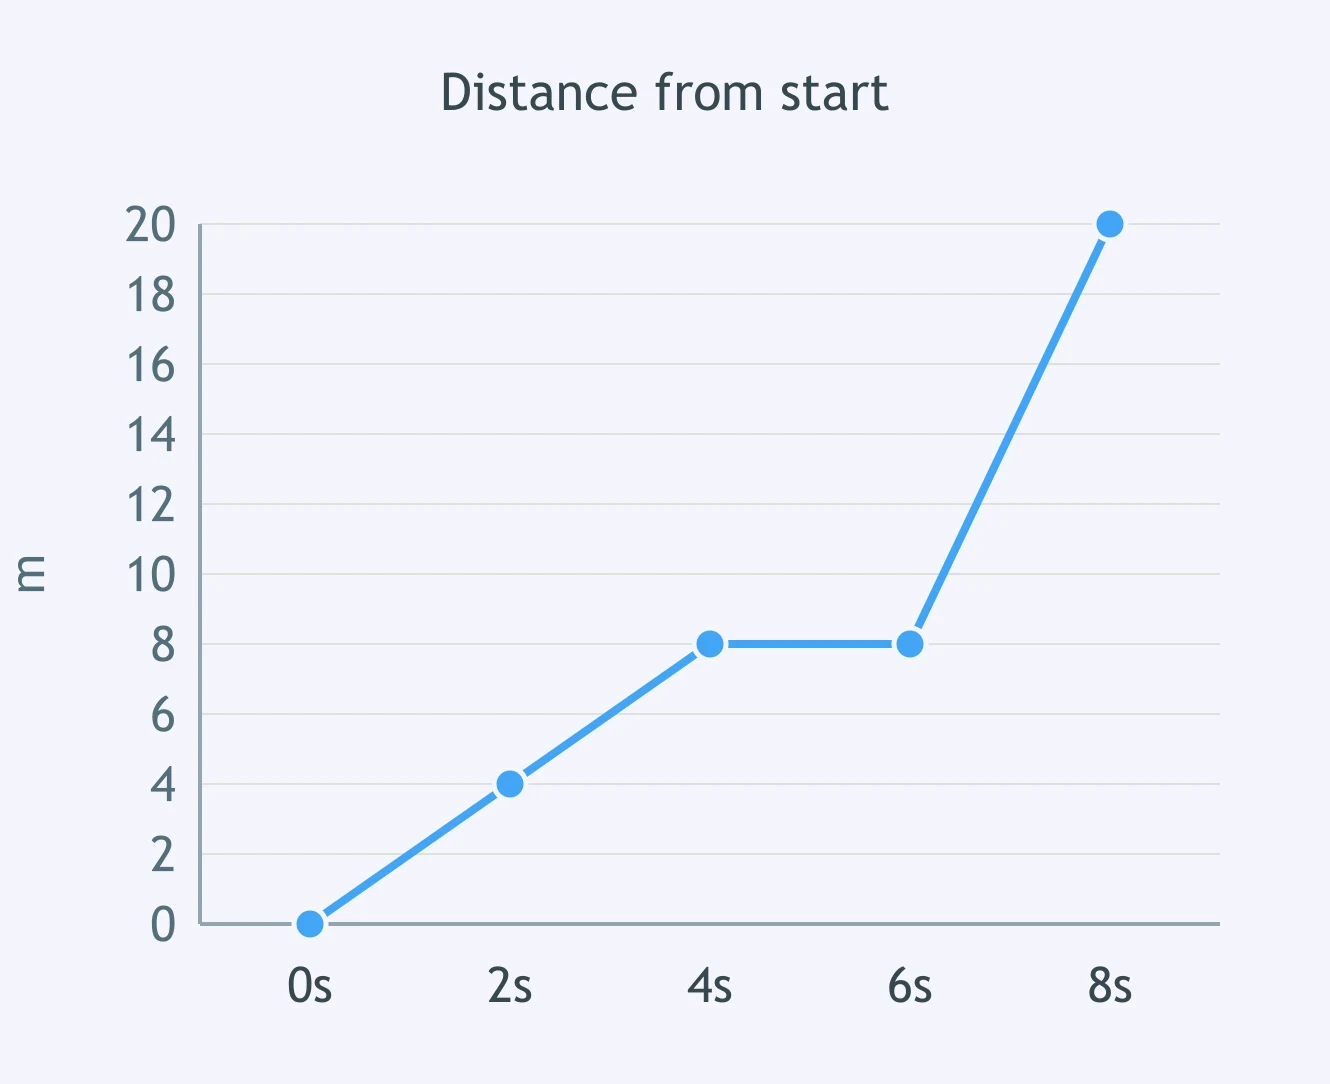
Use the graph to compare the cart's motion before and after the stop. When was it faster?
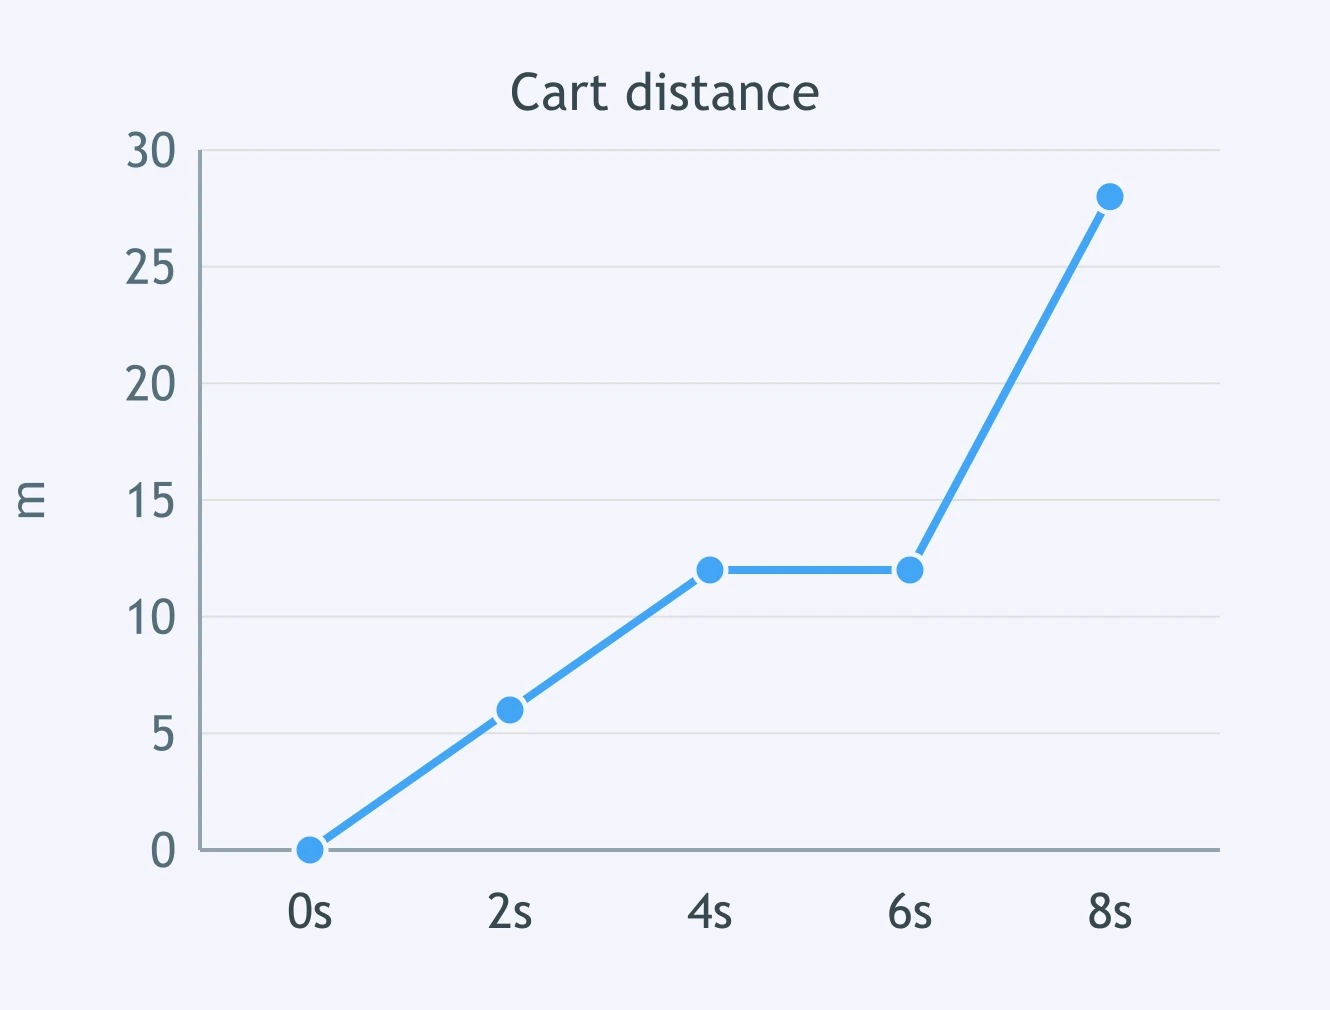
Two straight segments are shown. Which segment has the smaller speed?
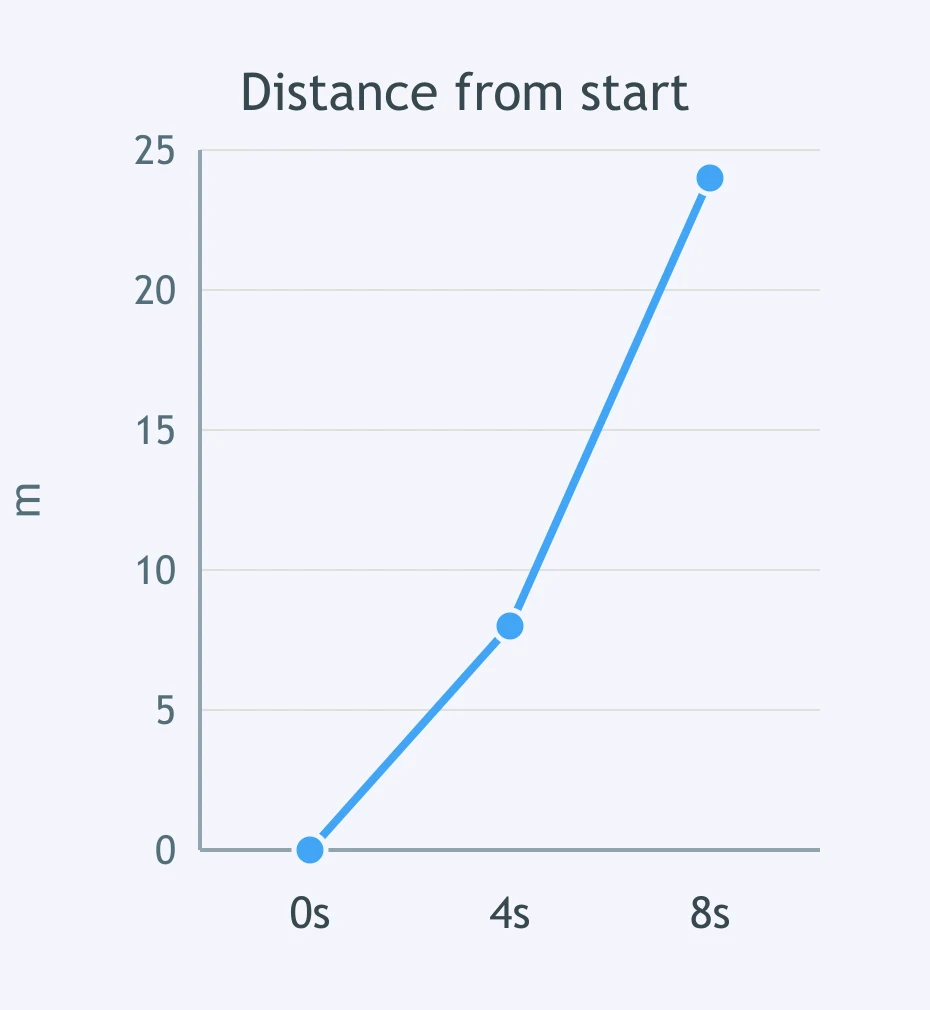
Which part of the graph shows the fastest motion away from the start?
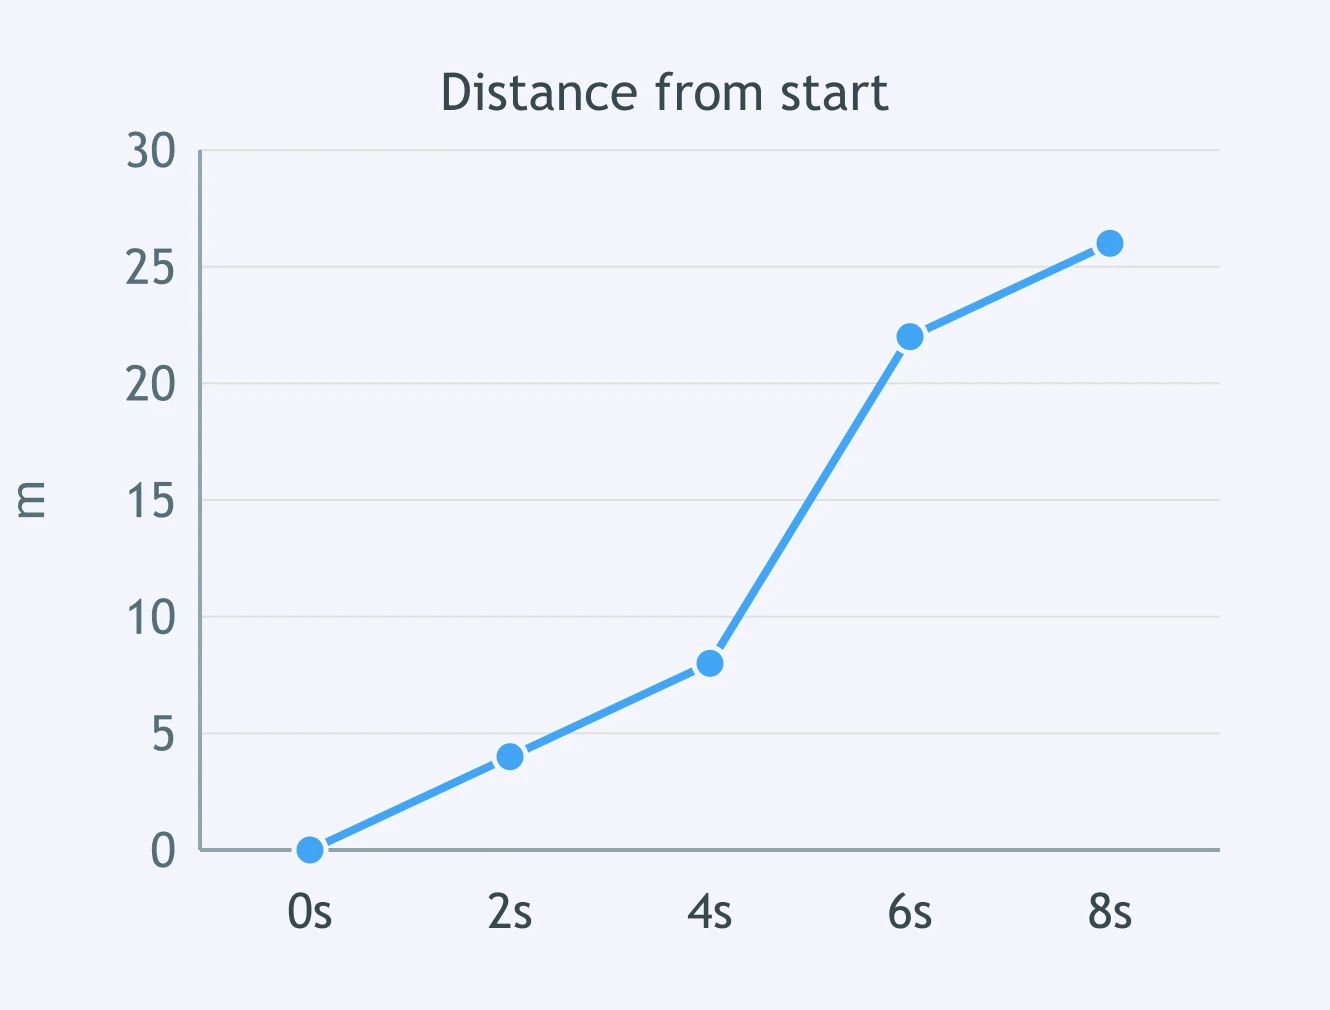
Compare the first and last rising segments. Which statement matches the graph?
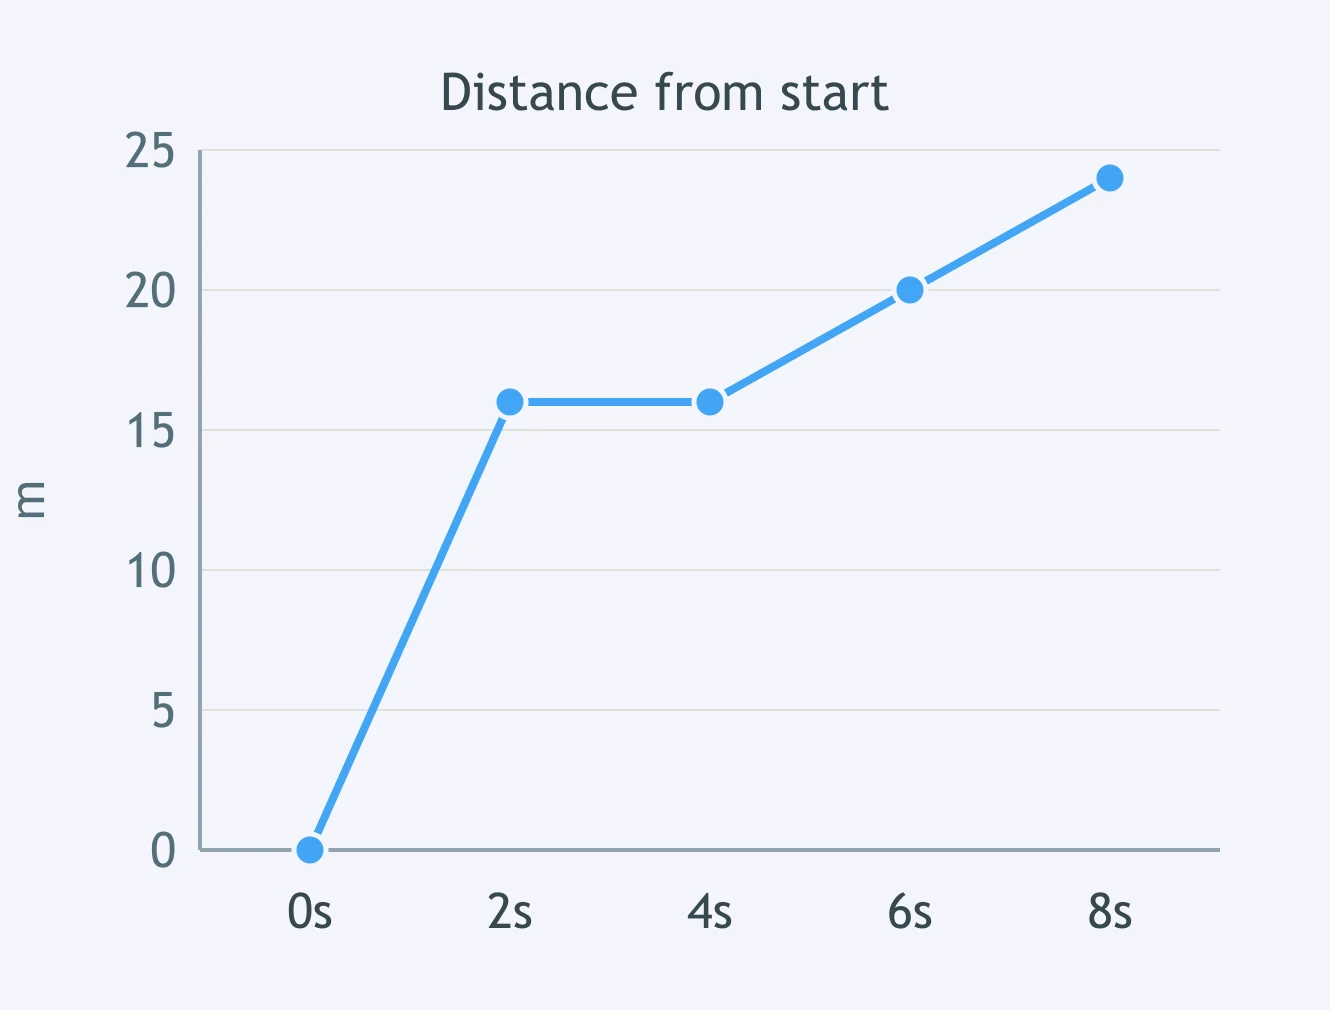
The graph drops during the last segment. What does that change in distance show?
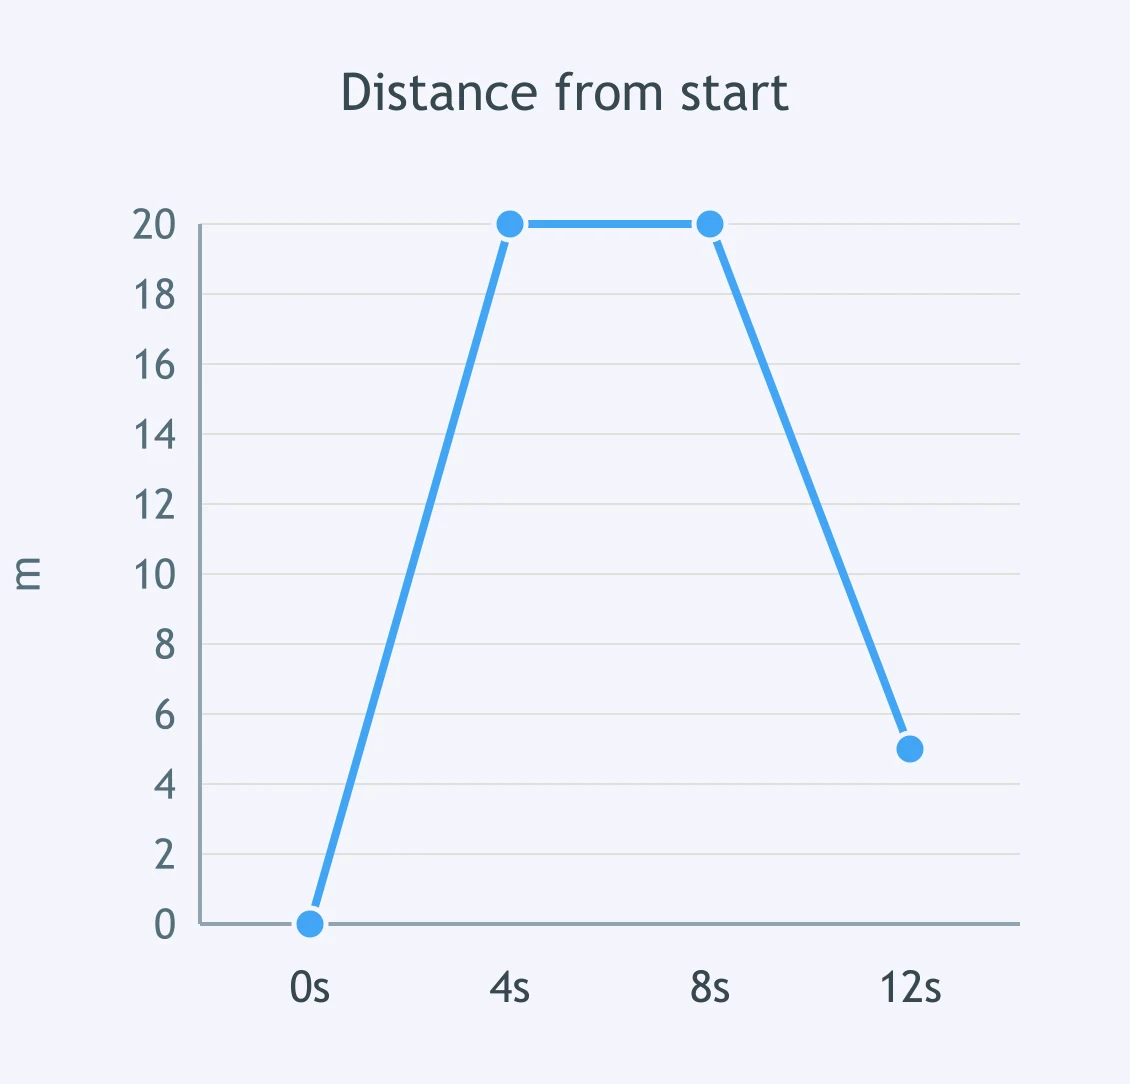
Use the graph. What was happening from 6 s to 10 s?
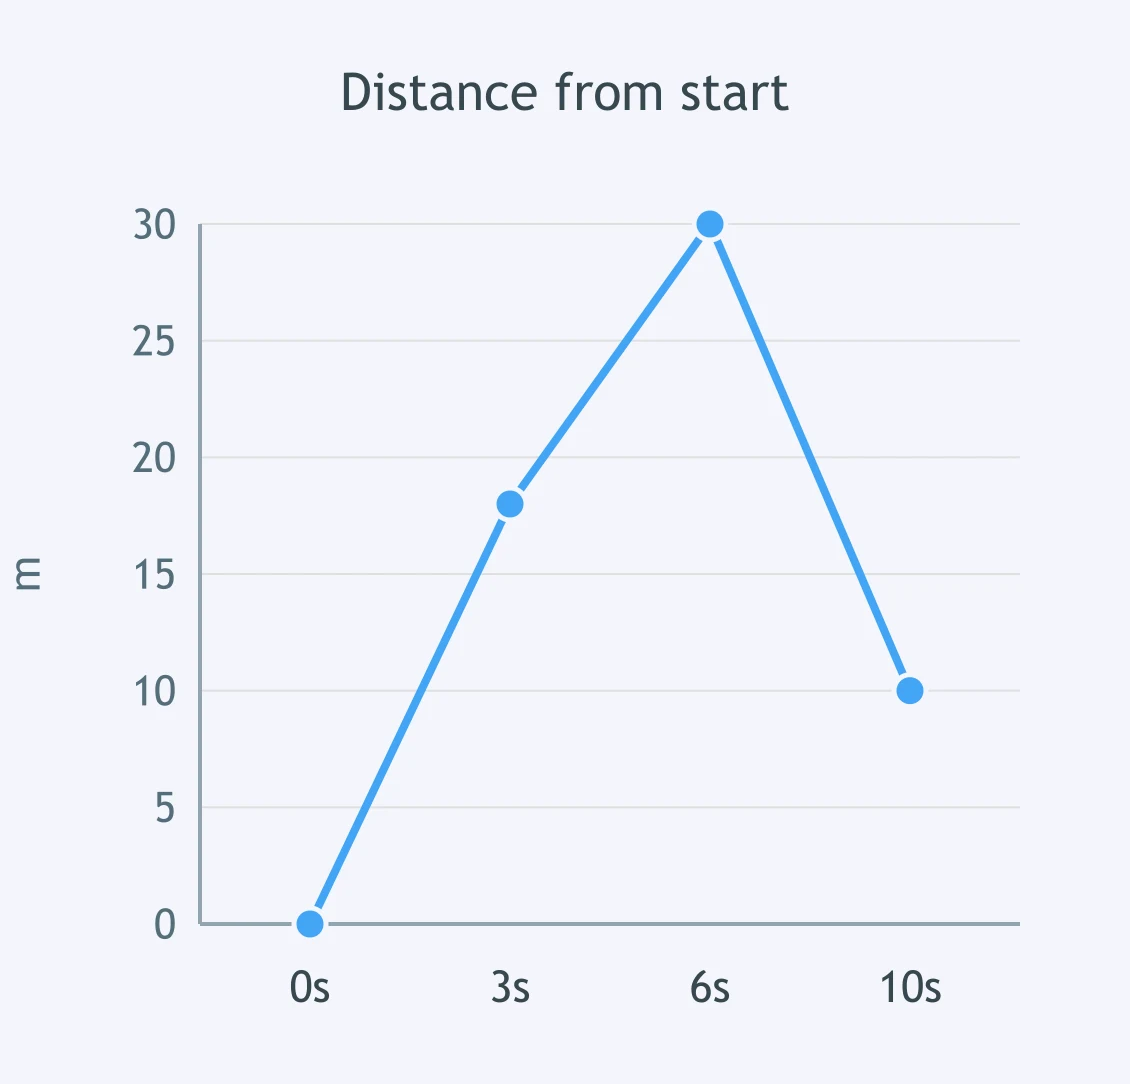
A ball's distance from the start decreases in one segment. What does that segment mean?
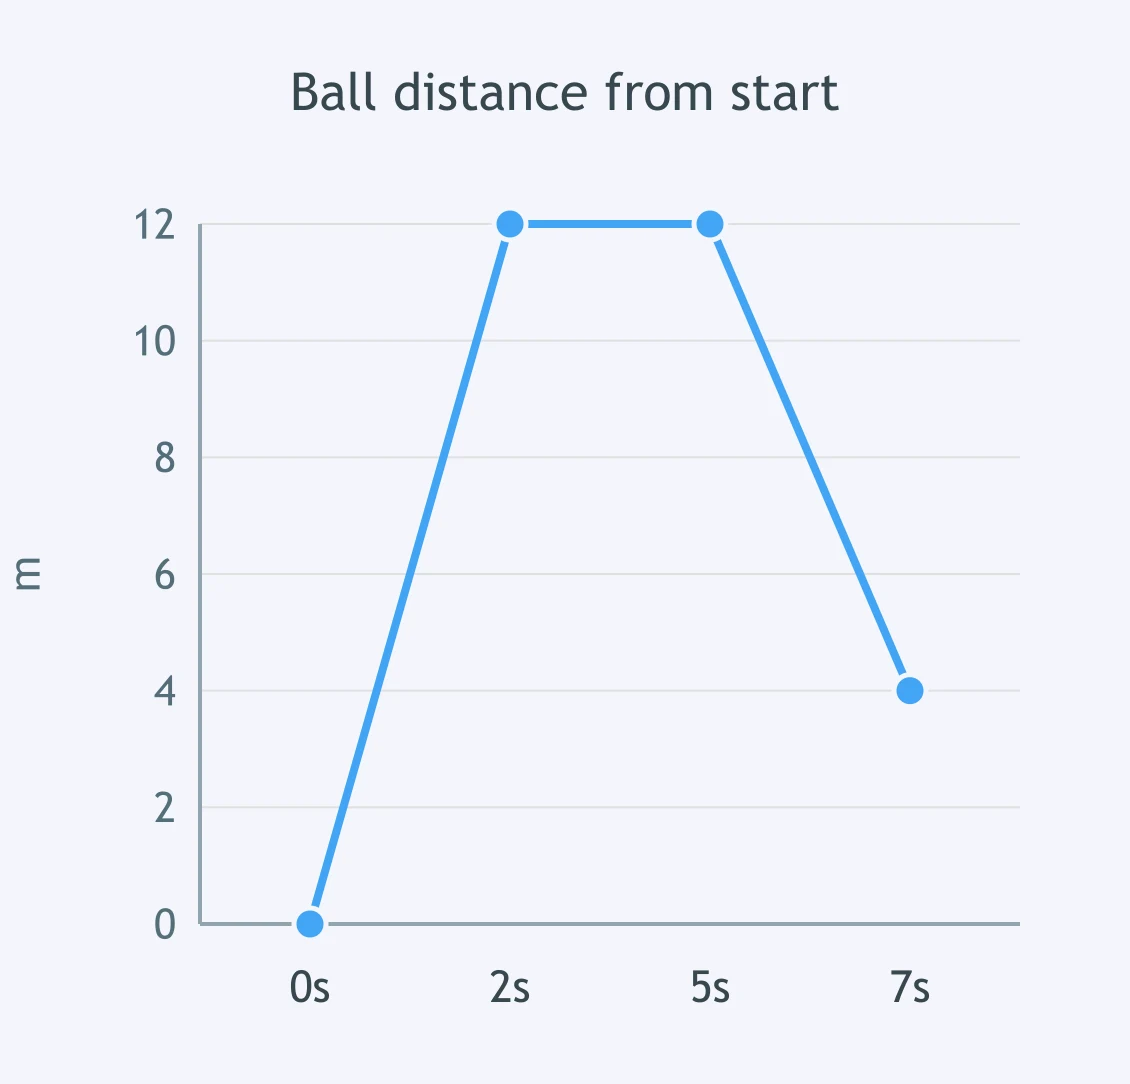
Which interval shows the object moving back toward the start?
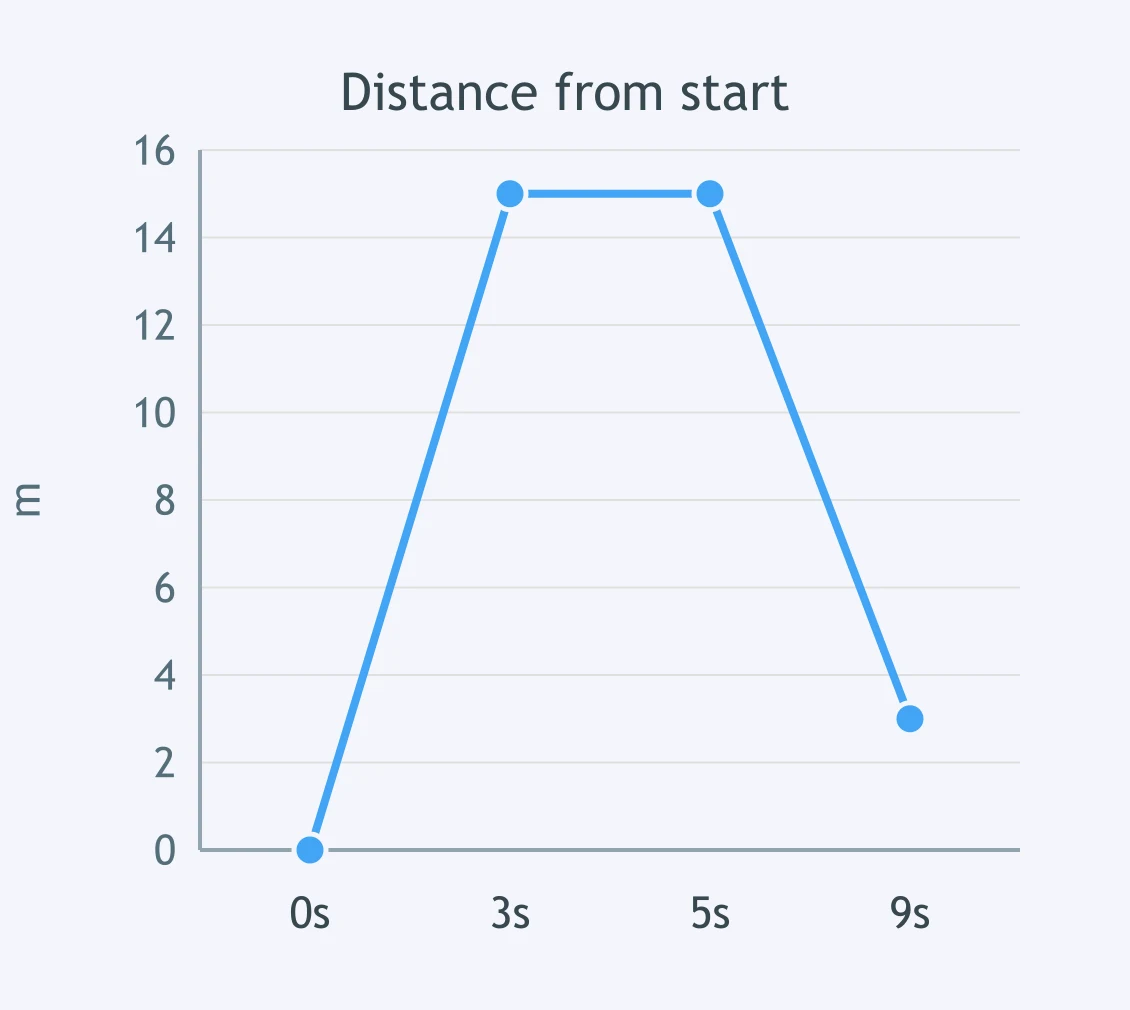
The runner's graph rises, becomes flat, then slopes downward. What does the downward slope show?
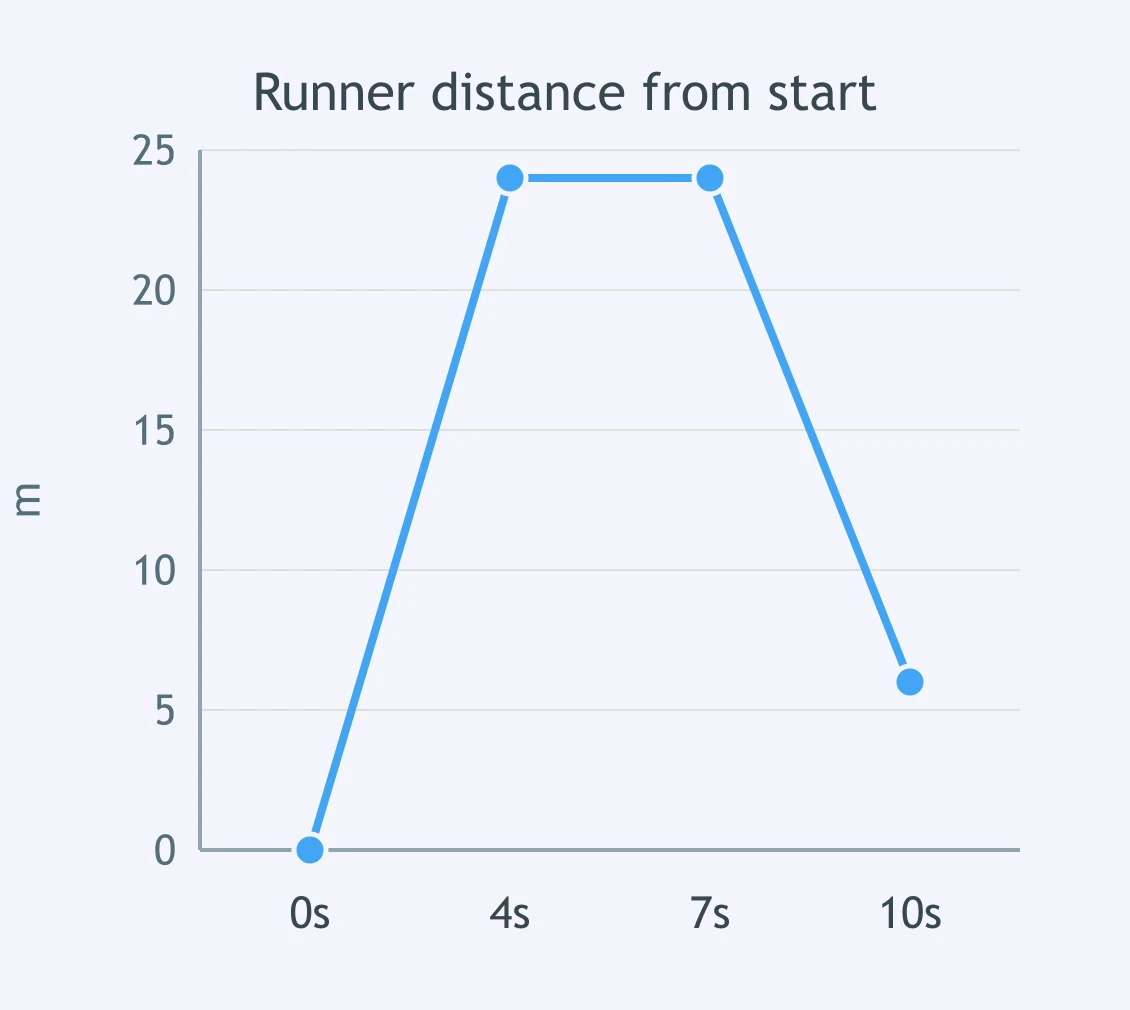
From the graph, what best describes the motion after 8 s?
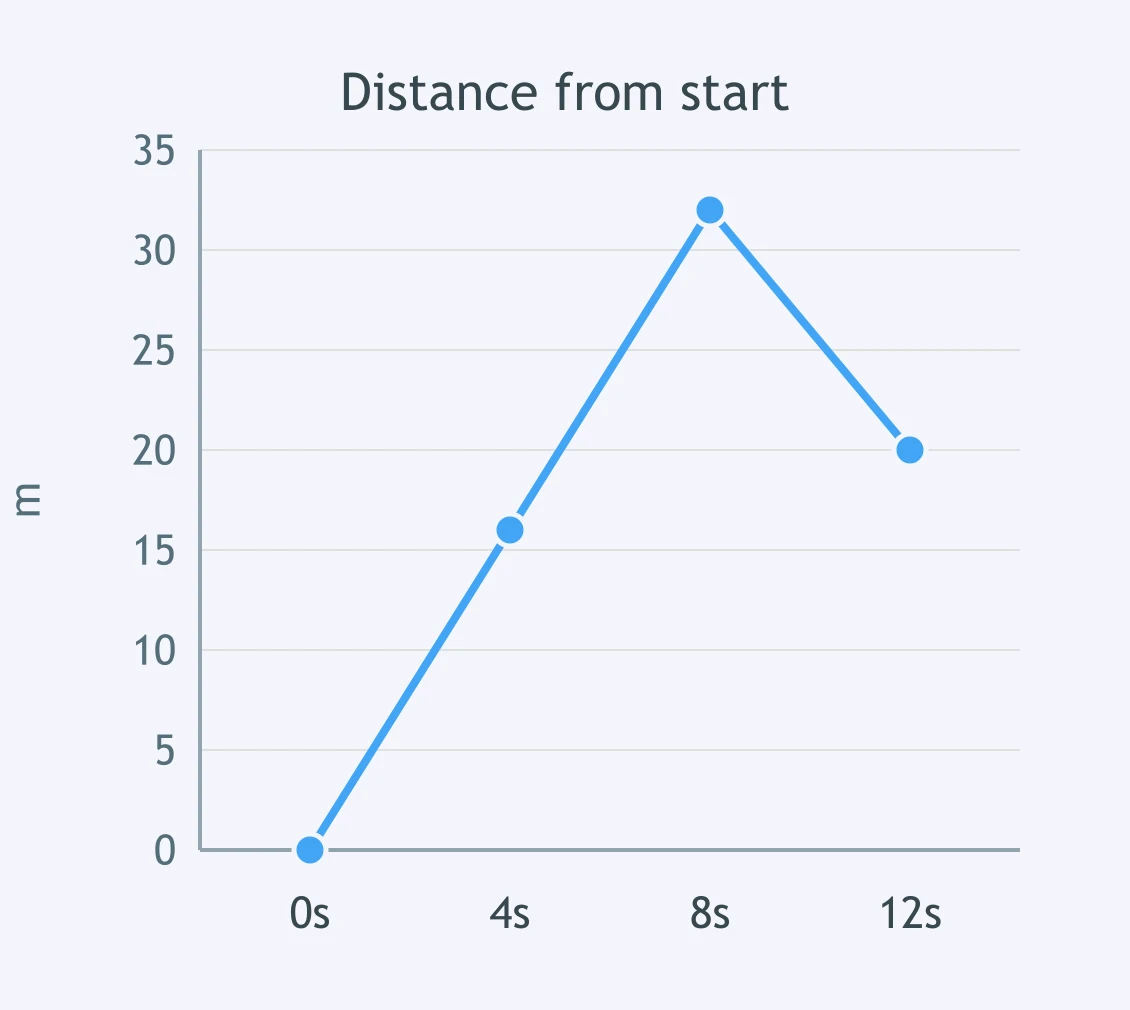
Crack the passcode before the zombies get in.
Answer, then swat bugs for bonus points.
Race through questions at your own speed.
Same question on every screen. Fastest wins.

Pick a tile, answer, hit bonuses and steals.
The Solar System
40 questions