Loading
by BlastRoom
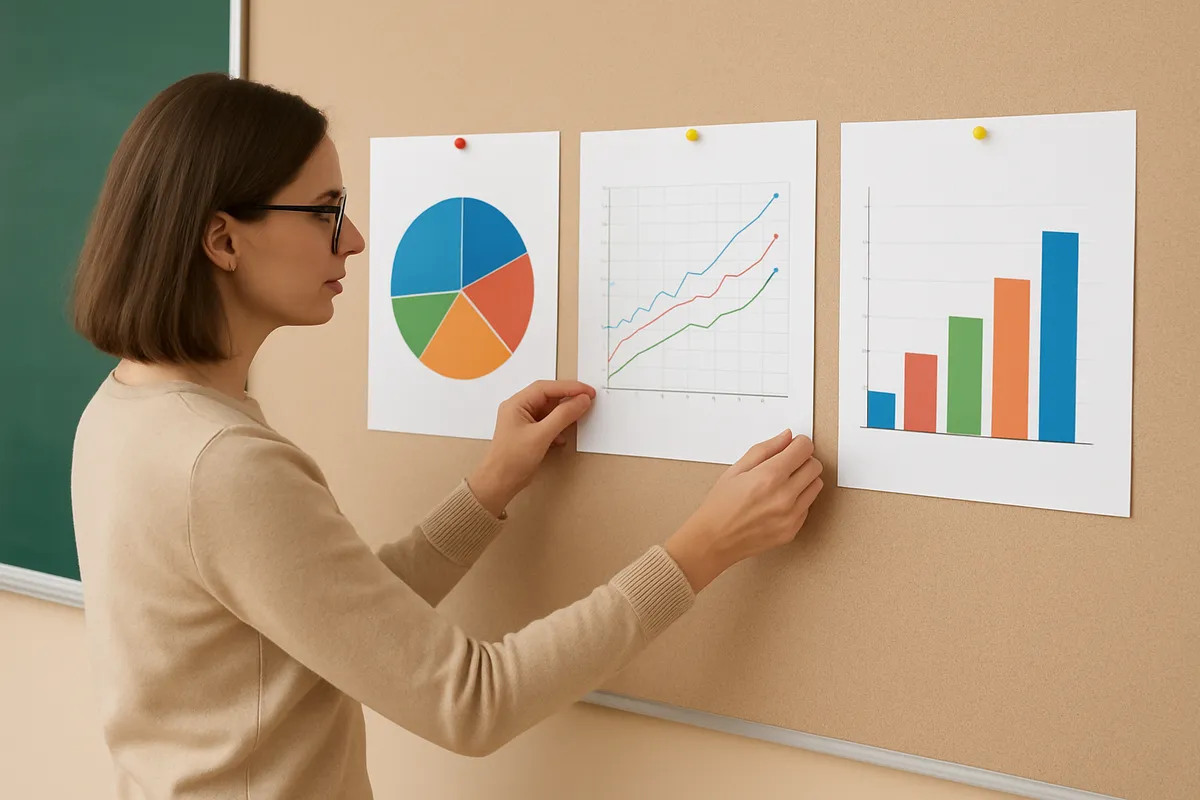
Choose displays that fit data questions and know what each display cannot show.
#us_grade_6_math
20 questions
One question set, multiple game modes. Tap any game to see it in action. Not sure which to pick?
Answer to place stones and capture territory.
Outrun the snow together.
Earn blasts, then hunt the other team.
Answer to earn energy, then climb.

The class blasts through walls together.
Bid on mystery lots. Most money wins.
Sell tours. Nice, standard, or a total scam.

Answer, restock, and serve the rush.
More correct answers pulls the rope your way.
Answer, then shoot down the alien wave.
Answer, then tap to leap the frozen ridge.
A class records 60 test scores, from 40 to 100 points. What display best shows how the scores are spread across intervals?
A coach records 24 jump distances, from 110 to 190 centimeters. What display best shows each exact distance and clusters?
A survey records 120 students' favorite school lunch choices, with 5 categories. What display best shows each category's share of the total?
A store records 80 backpack masses, from 1 to 9 kilograms. What display best summarizes median, range, and quartiles?
A club records 45 members' T-shirt colors, with 6 color categories. What display best compares how many chose each color?
A teacher records 35 quiz times, from 2 to 18 minutes. What display best shows every time when many values repeat?
A box plot summarizes 50 plant heights, from 12 to 48 centimeters. What cannot be found from the box plot?
A histogram groups 72 lap times, from 40 to 100 seconds, in 10-second intervals. What cannot be found from it?
A circle graph shows 200 students' favorite sports, across 5 categories. What cannot be found from the circle graph alone?
A bar graph shows 90 pets by type, from fish to dogs, across 6 categories. What cannot be found from it?
A dot plot shows 28 water-bottle volumes, from 200 to 900 milliliters. What cannot be found from the dot plot?
A box plot shows 64 homework times, from 0 to 80 minutes. What cannot be found from it?
A histogram will group 90 temperatures, from 0 to 45 degrees Celsius. What interval width gives about 9 clear intervals?
A histogram groups 40 book lengths, from 80 to 320 pages. What does it lose that a dot plot could keep?
A teacher groups 48 plant masses, from 0 to 24 grams, for a histogram. Which interval width is most useful?
A histogram groups 55 ride wait times, from 0 to 60 minutes. What question is better answered by a dot plot?
A survey asks 75 students their favorite fruit and the grams of fruit eaten, from 0 to 300 grams. Which display fits favorite fruit?
A survey asks 100 runners their shoe brand and race time, from 12 to 30 minutes. Which display fits race time spread?
A survey records 60 students' instrument choice and practice minutes, from 0 to 90 minutes. Which display fits instrument choice shares?
A survey records 36 students' bus route and backpack mass, from 1 to 8 kilograms. Which display fits backpack mass by exact value?
Crack the passcode before the zombies get in.
Answer, then swat bugs for bonus points.
Race through questions at your own speed.
Same question on every screen. Fastest wins.

Pick a tile, answer, hit bonuses and steals.
Writing a Problem from an Equation
20 questions