Loading
by BlastRoom
Practice reading categorical displays and summarizing categories with mode and relative frequency.
#us_grade_6_math
20 questions
One question set, multiple game modes. Tap any game to see it in action. Not sure which to pick?
Answer to place stones and capture territory.
Outrun the snow together.
Earn blasts, then hunt the other team.
Answer to earn energy, then climb.

The class blasts through walls together.
Bid on mystery lots. Most money wins.
Sell tours. Nice, standard, or a total scam.

Answer, restock, and serve the rush.
More correct answers pulls the rope your way.
Answer, then shoot down the alien wave.
Answer, then tap to leap the frozen ridge.
Look at the bar graph. What category has the greatest count?
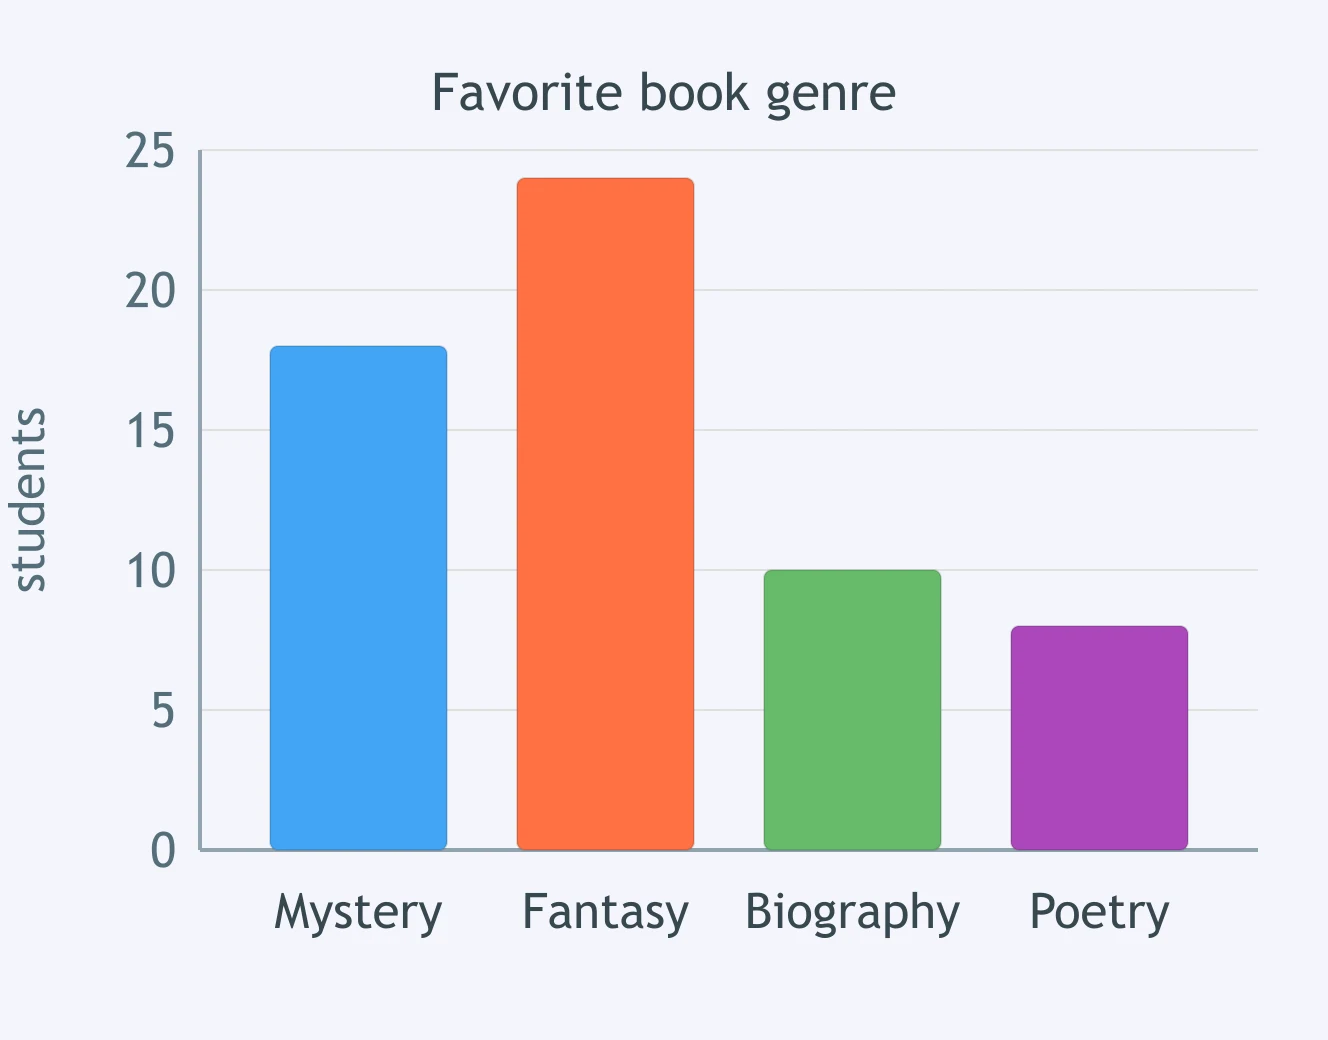
Use the bar graph. How many more students chose Tacos than Soup?
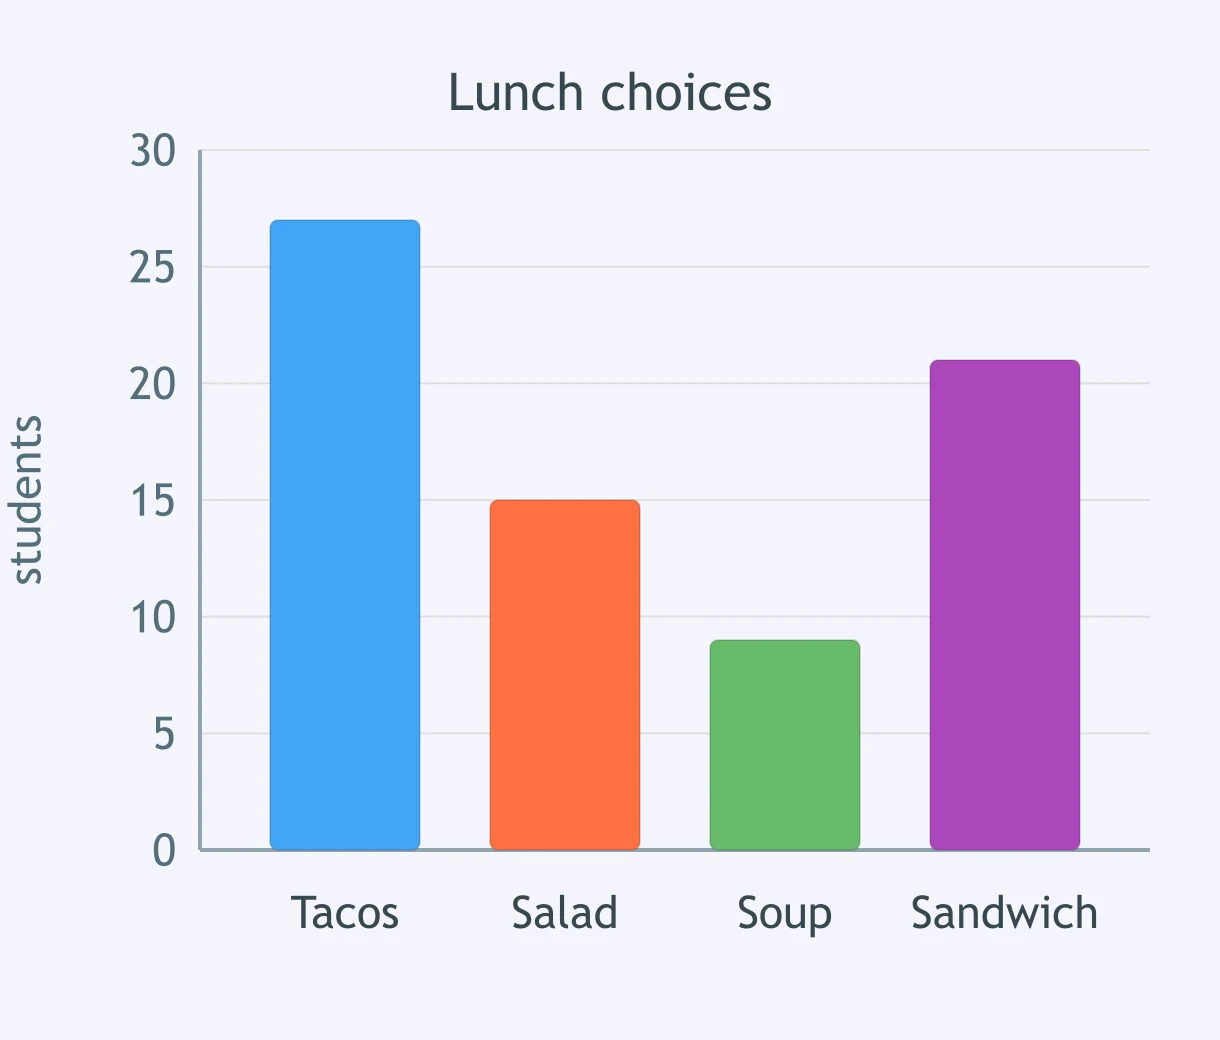
Look at the bar graph. What club received the most votes?
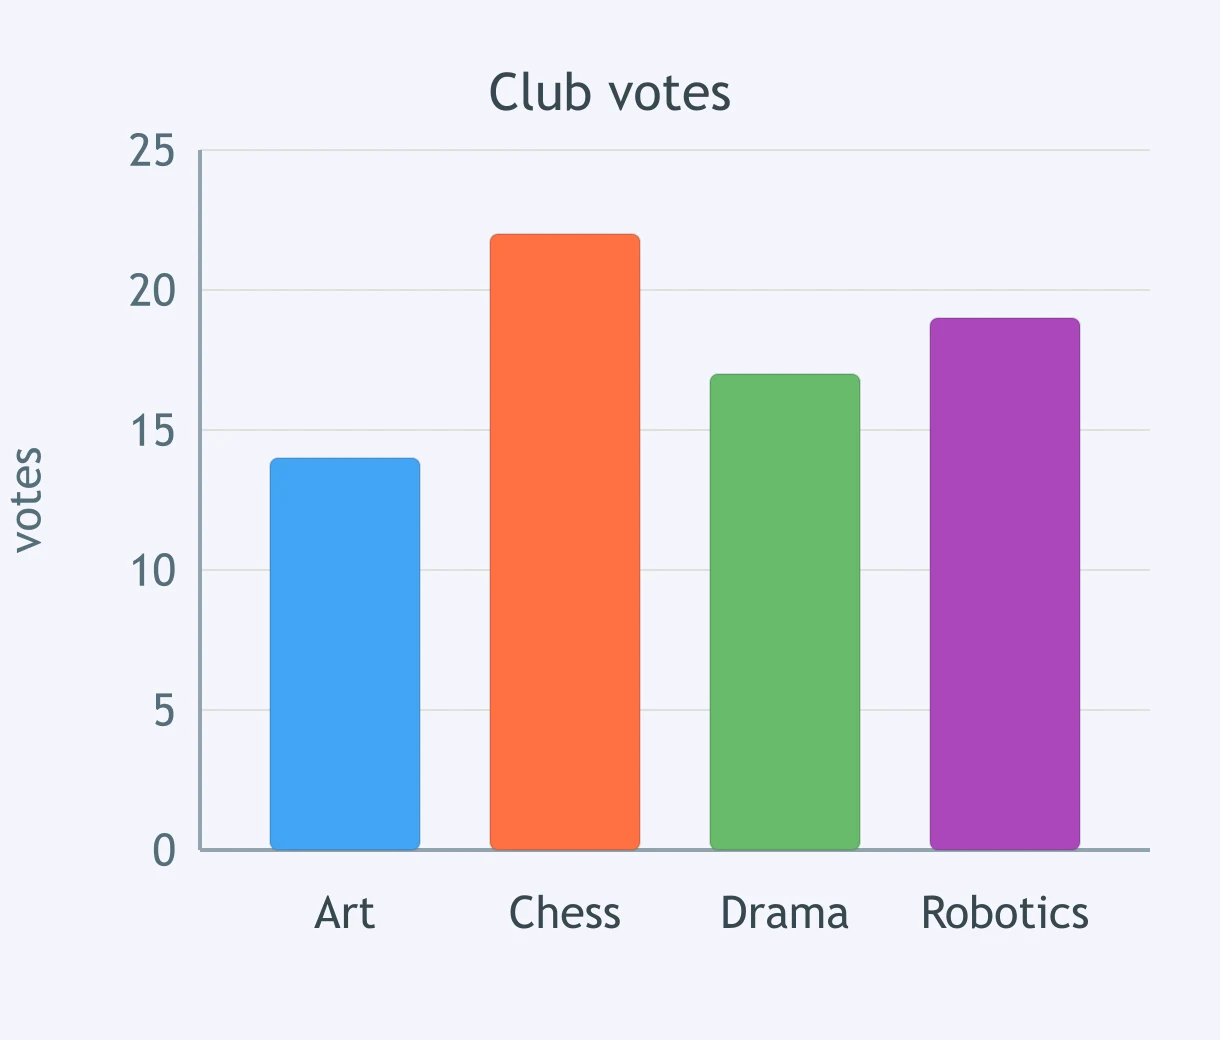
Use the bar graph. How many more students chose Dogs than Cats?
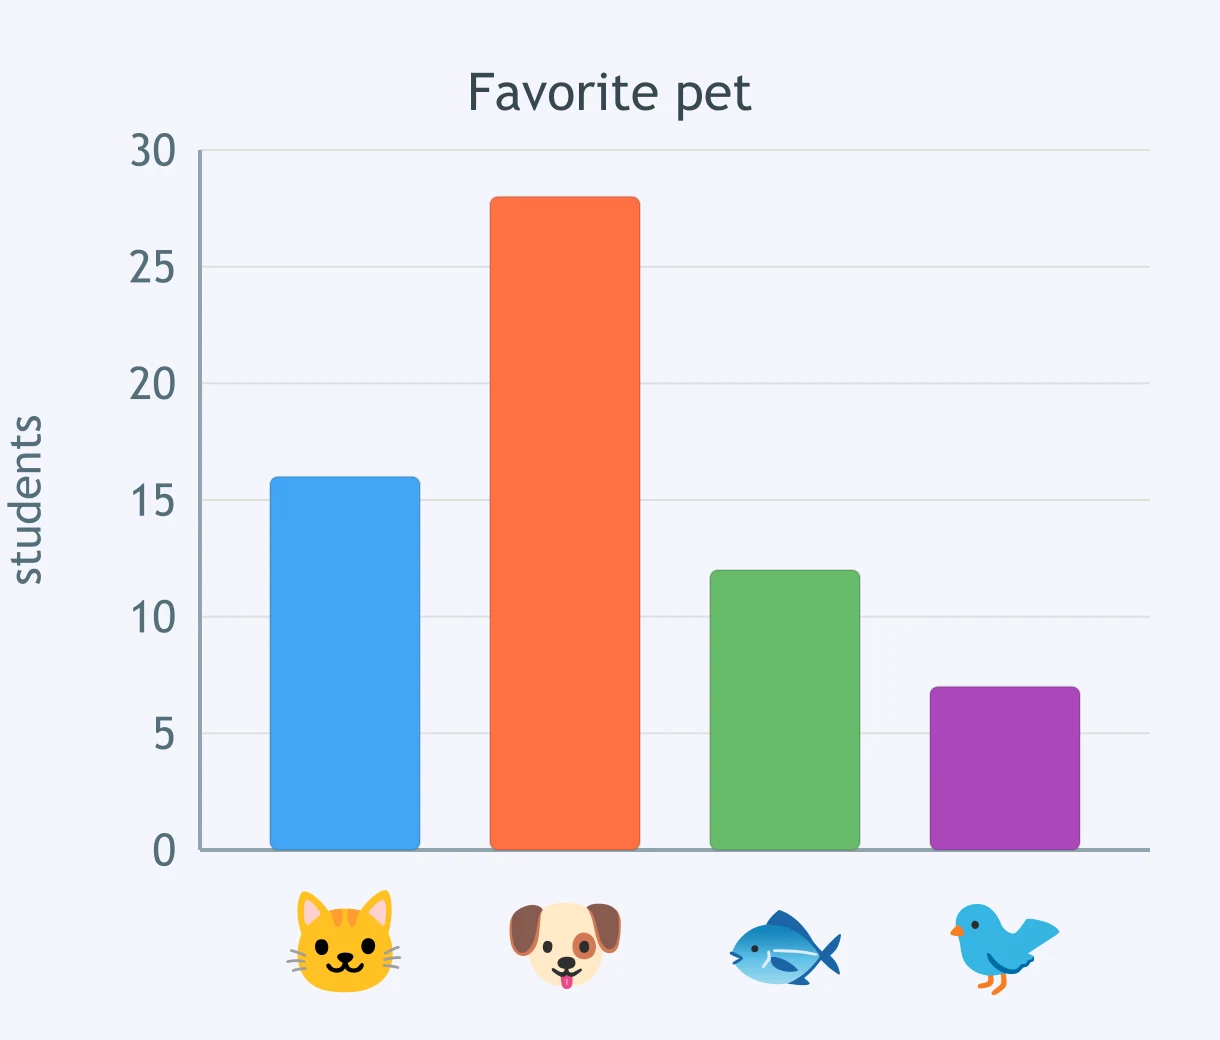
Look at the bar graph. What categories are tied for greatest count?
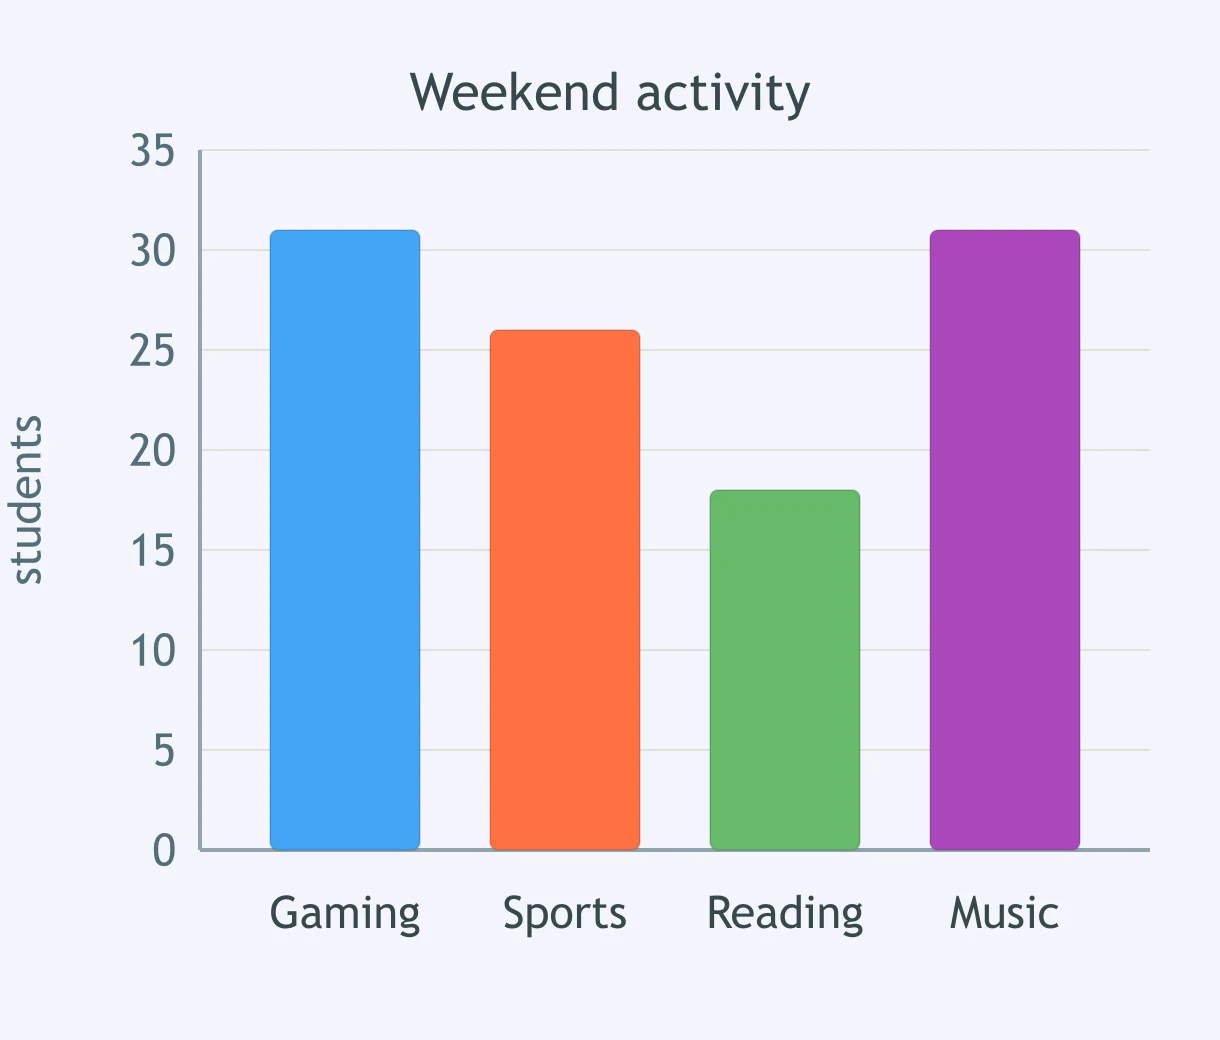
Use the bar graph. How many more students chose Fruit than Granola?
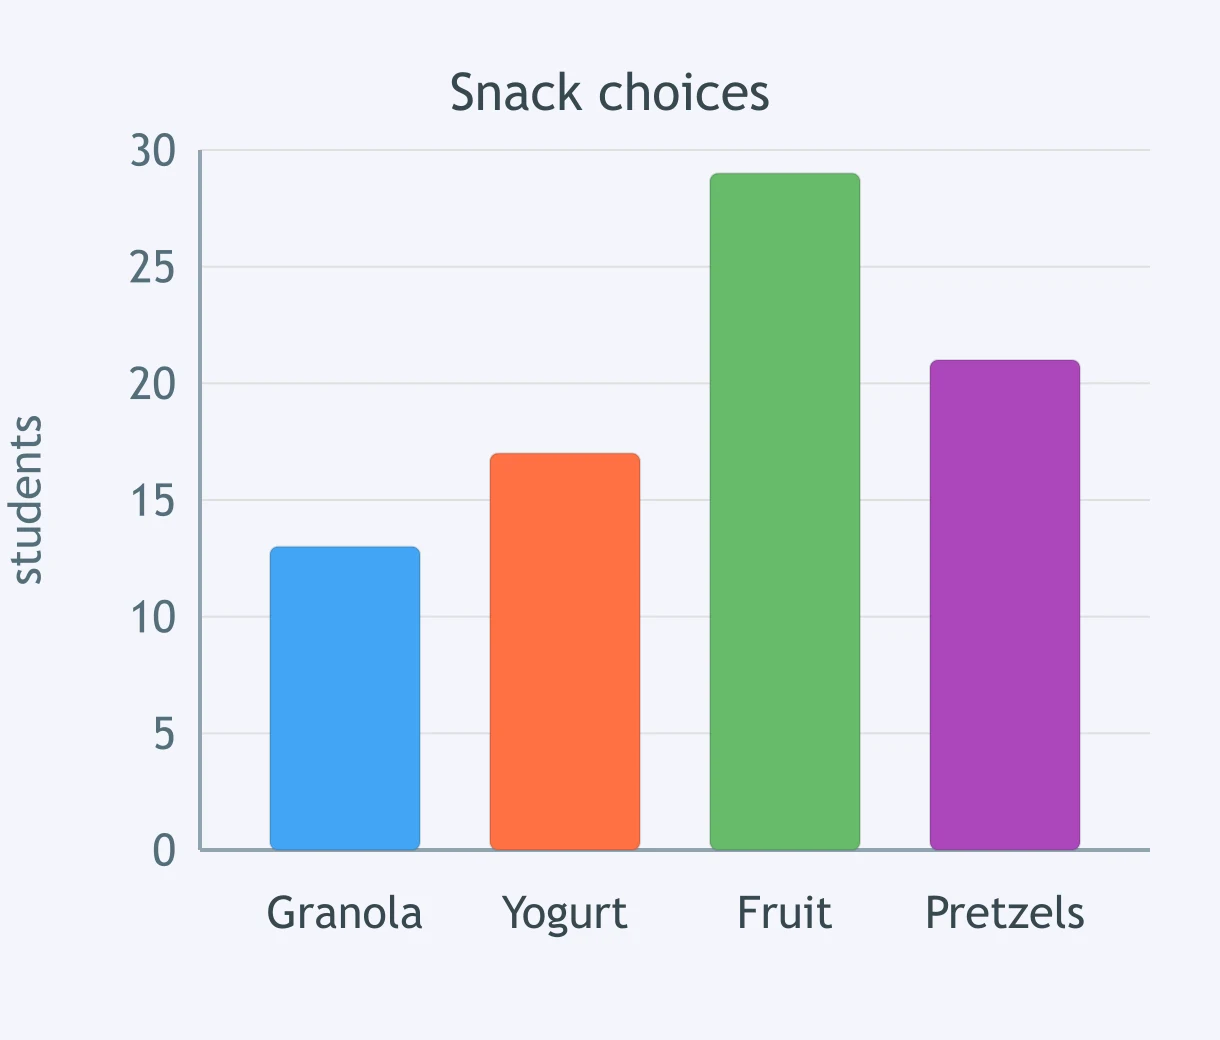
In a survey of 40 students, 12 chose soccer. What is the relative frequency for soccer?
In a survey of 50 students, 20 chose blue. What is the relative frequency for blue?
In a survey of 32 students, 8 chose the science fair. What is the relative frequency for the science fair?
In a survey of 30 students, 6 walk to school. What is the relative frequency for walking?
In a survey of 48 students, 18 chose dogs. What is the relative frequency for dogs?
In a survey of 60 students, 45 chose comedy movies. What is the relative frequency for comedy movies?
T-shirt colors were black, red, black, blue, red, black, yellow. What is the mode?
Fruit choices were apple, pear, banana, apple, banana, pear, banana, apple. What is the mode?
Music choices were pop, jazz, pop, rock, pop, jazz, country, rock. What is the mode?
Pet types were dog, cat, lizard, cat, dog, dog, fish, cat. What is the mode?
A survey records each student's favorite fruit. What summary is meaningful for this categorical data?
A table counts votes for class T-shirt color. What can be determined from these categories?
A bar graph displays favorite field-trip choices. What summary can it support?
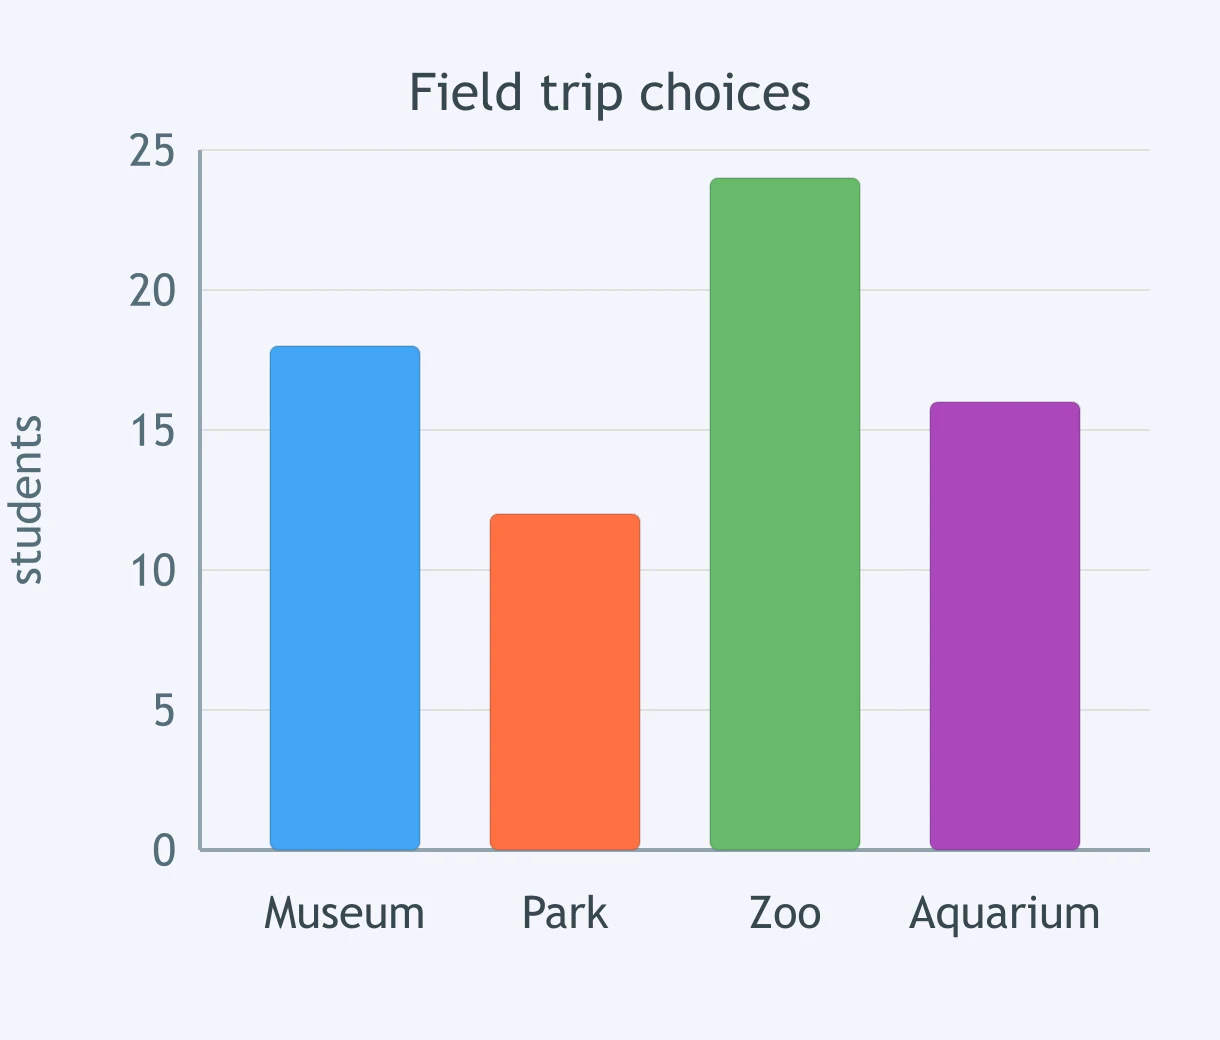
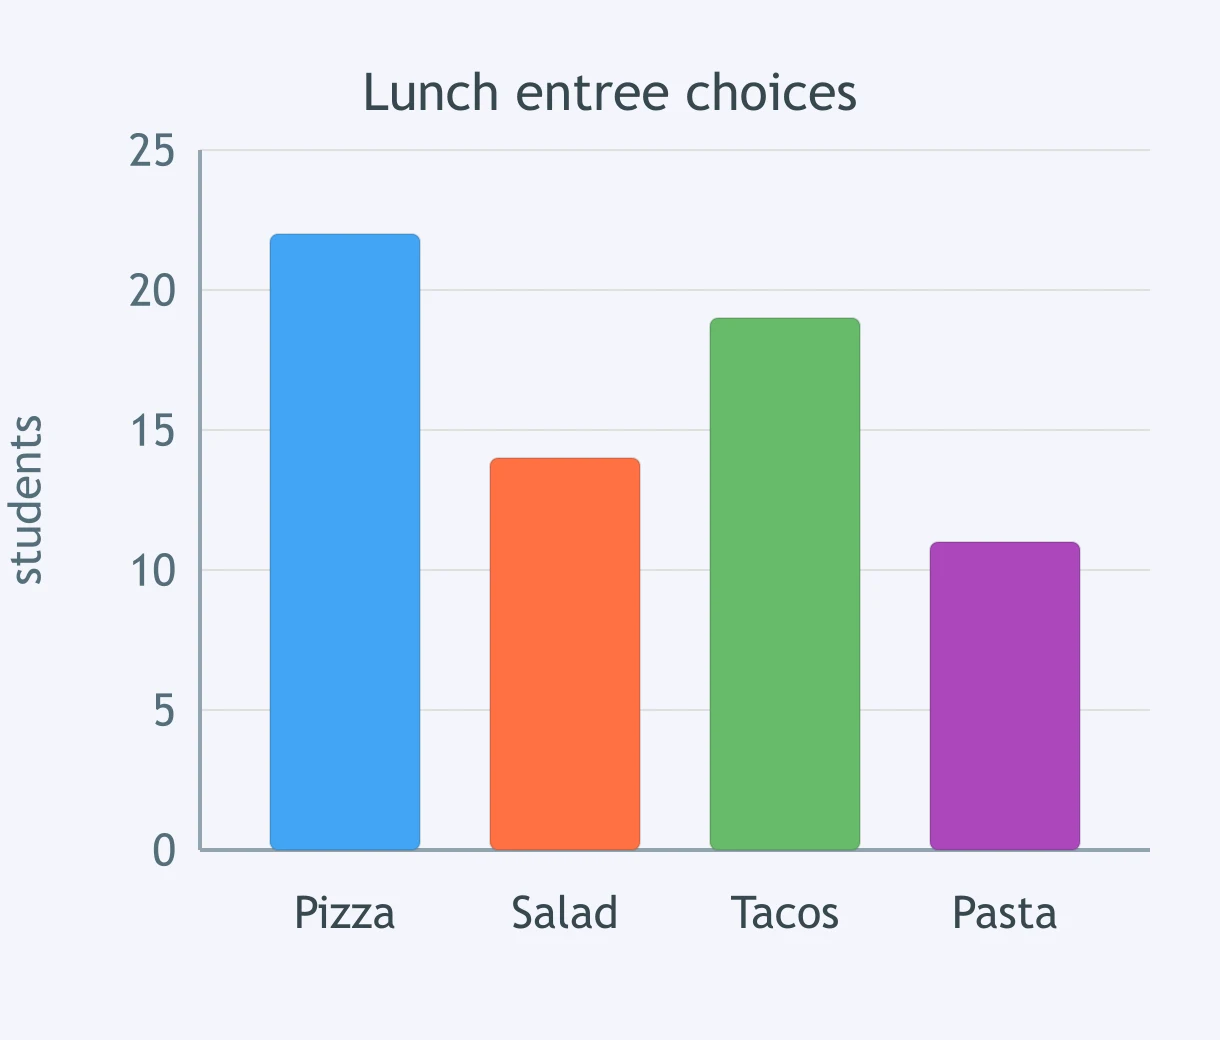
A bar graph displays lunch entree choices. What conclusion is valid for categorical data?
Crack the passcode before the zombies get in.
Answer, then swat bugs for bonus points.
Race through questions at your own speed.
Same question on every screen. Fastest wins.

Pick a tile, answer, hit bonuses and steals.
Reading Circle Graphs
20 questions