Loading
by BlastRoom
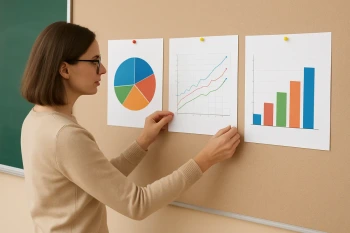
Use percentages in described circle graphs to find parts, wholes, and combined shares.
#us_grade_6_math
20 questions
One question set, multiple game modes. Tap any game to see it in action. Not sure which to pick?
Answer to place stones and capture territory.
Outrun the snow together.
Earn blasts, then hunt the other team.
Answer to earn energy, then climb.

The class blasts through walls together.
Bid on mystery lots. Most money wins.
Sell tours. Nice, standard, or a total scam.

Answer, restock, and serve the rush.
More correct answers pulls the rope your way.
Answer, then shoot down the alien wave.
Answer, then tap to leap the frozen ridge.
A circle graph of 300 votes shows Blue is 45%. How many votes are for Blue?
A circle graph of 250 students shows Soccer is 32%. How many students chose Soccer?
A circle graph of 480 minutes shows Reading is 25%. How many minutes are Reading?
A circle graph of 60 snacks shows Granola is 40%. How many snacks are Granola?
A circle graph of 900 books shows Mystery is 18%. How many books are Mystery?
A circle graph of 1,200 responses shows Online games is 35%. How many responses chose Online games?
A circle graph shows Travel is 20% of a budget, or $340. What is the whole budget?
A circle graph shows Sixth graders are 15% of a club, or 24 members. How many members are in the club?
A circle graph shows Vegetables are 40% of a garden, or 72 square meters. What is the whole garden area?
A circle graph shows Animal stickers are 30% of a collection, or 45 stickers. How many stickers are in the collection?
A circle graph shows Woods are 12% of a race distance, or 6 kilometers. What is the whole race distance?
A circle graph shows Pop songs are 75% of a playlist, or 90 songs. How many songs are in the playlist?
A circle graph shows travel methods: walking 25%, bus 40%, car 20%, bike 15%. What percent is walking and bike together?
A circle graph shows class pets: dogs 36%, cats 28%, fish 16%, other missing. What percent is other?
A circle graph shows snacks: fruit 22%, yogurt 18%, crackers 35%, nuts 25%. What percent chose fruit or yogurt?
A circle graph shows a school day: math 20%, reading 25%, science 15%, specials 10%, other missing. What percent is other?
A circle graph shows club choices for 180 students: drama 30%, art 25%, sports 45%. What does the whole circle represent?
A circle graph shows monthly spending: food 30%, rent 40%, savings 20%, supplies 10%. What does the rent sector represent?
A circle graph shows one hour: homework 50%, chores 25%, games 25%. What does the homework sector mean?
A circle graph shows 240 books by genre: fantasy 35%, history 25%, science 40%. What does each sector show?
Crack the passcode before the zombies get in.
Answer, then swat bugs for bonus points.
Race through questions at your own speed.
Same question on every screen. Fastest wins.

Pick a tile, answer, hit bonuses and steals.
Expressions Against Equations
40 questions