Loading
by BlastRoom
Determine the main idea a described chart, timeline, transcript or display presents and how it clarifies the text beside it.
#us_grade_7_english

40 questions
One question set, multiple game modes. Tap any game to see it in action. Not sure which to pick?
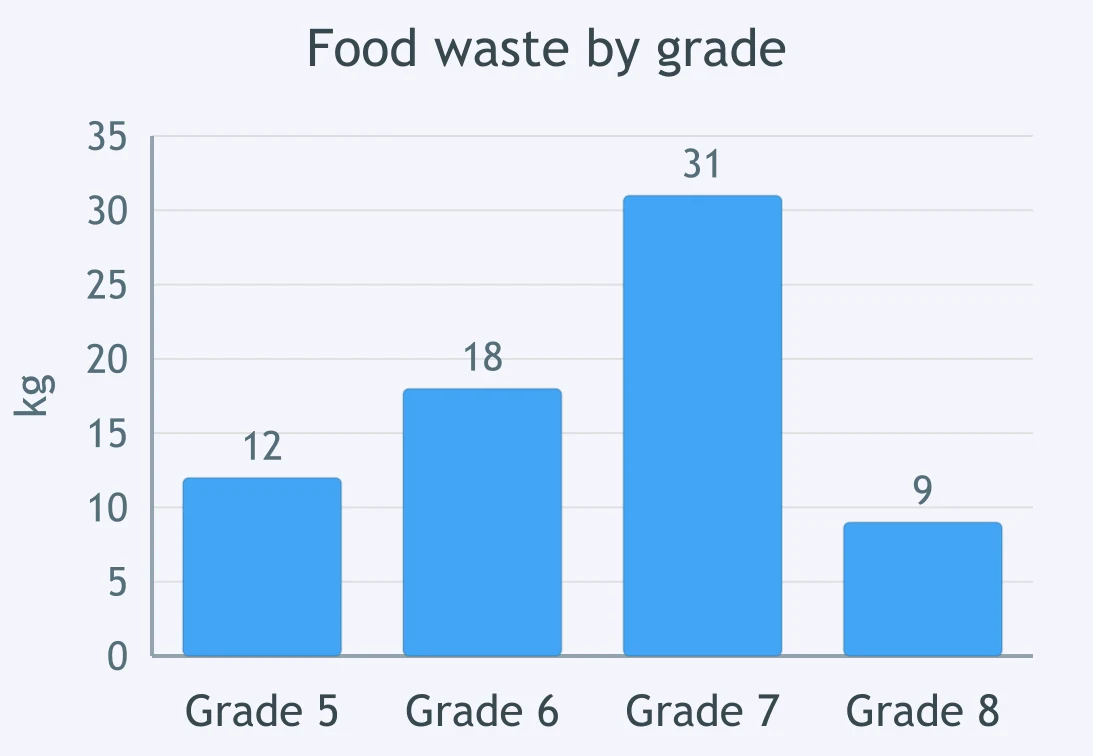
A bar chart beside an article on school lunches gives food waste per grade. What main idea does the chart present?
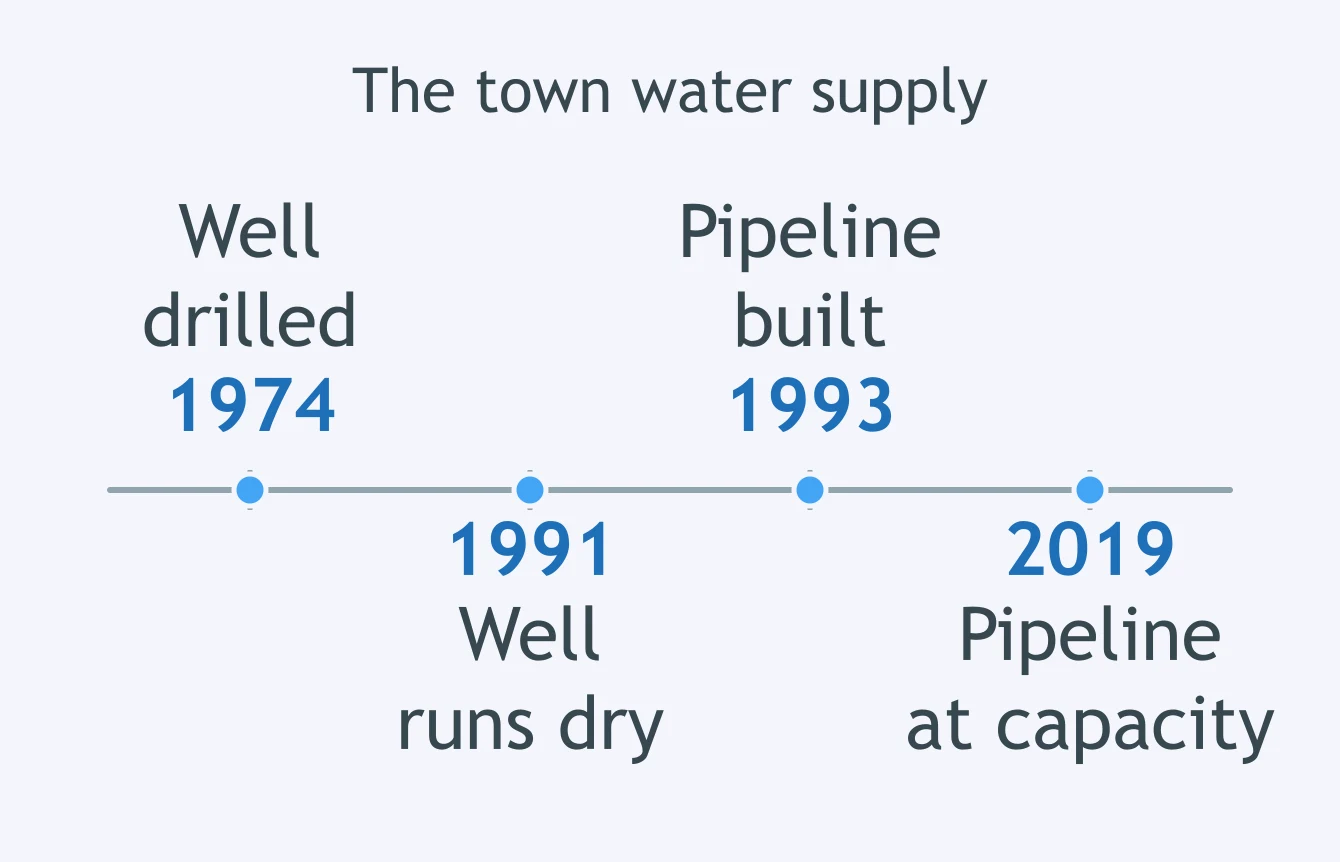
A timeline beside an article on a town's water supply marks its four milestones. What main idea does the timeline present?
Clip transcript: "We tagged forty turtles here. Thirty-one came back to this same beach to nest. The other nine we never found again, but not one of them turned up nesting anywhere else." What main idea does the speaker present?
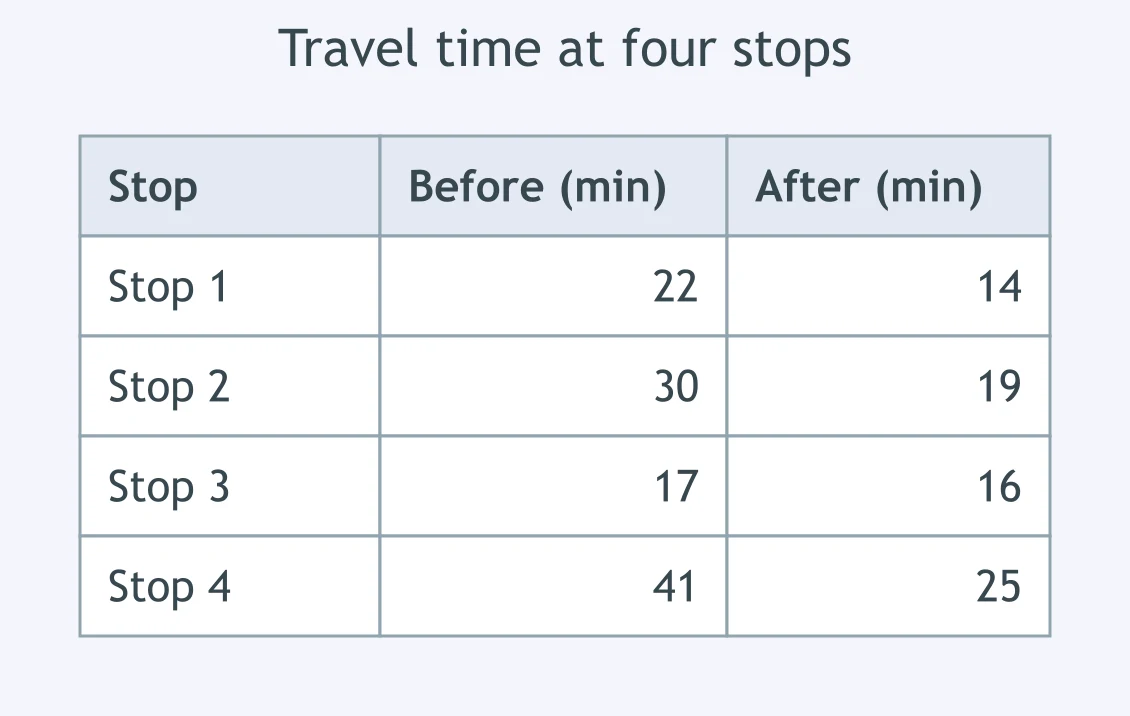
An article says a new bus route "cut travel time for most riders." A table beside it gives the minutes before and after at four stops. What does the table add to the article?
Text 1 (article): "The lake's fish count fell after the paper mill opened in 2015." Clip transcript: "Counts were already falling in 2013, two years before that mill opened." How does the clip's claim relate to the written account?
An article explains in one paragraph that a bridge project moved through five stages over eleven years. The same information is redrawn as a timeline. What does the timeline format contribute?
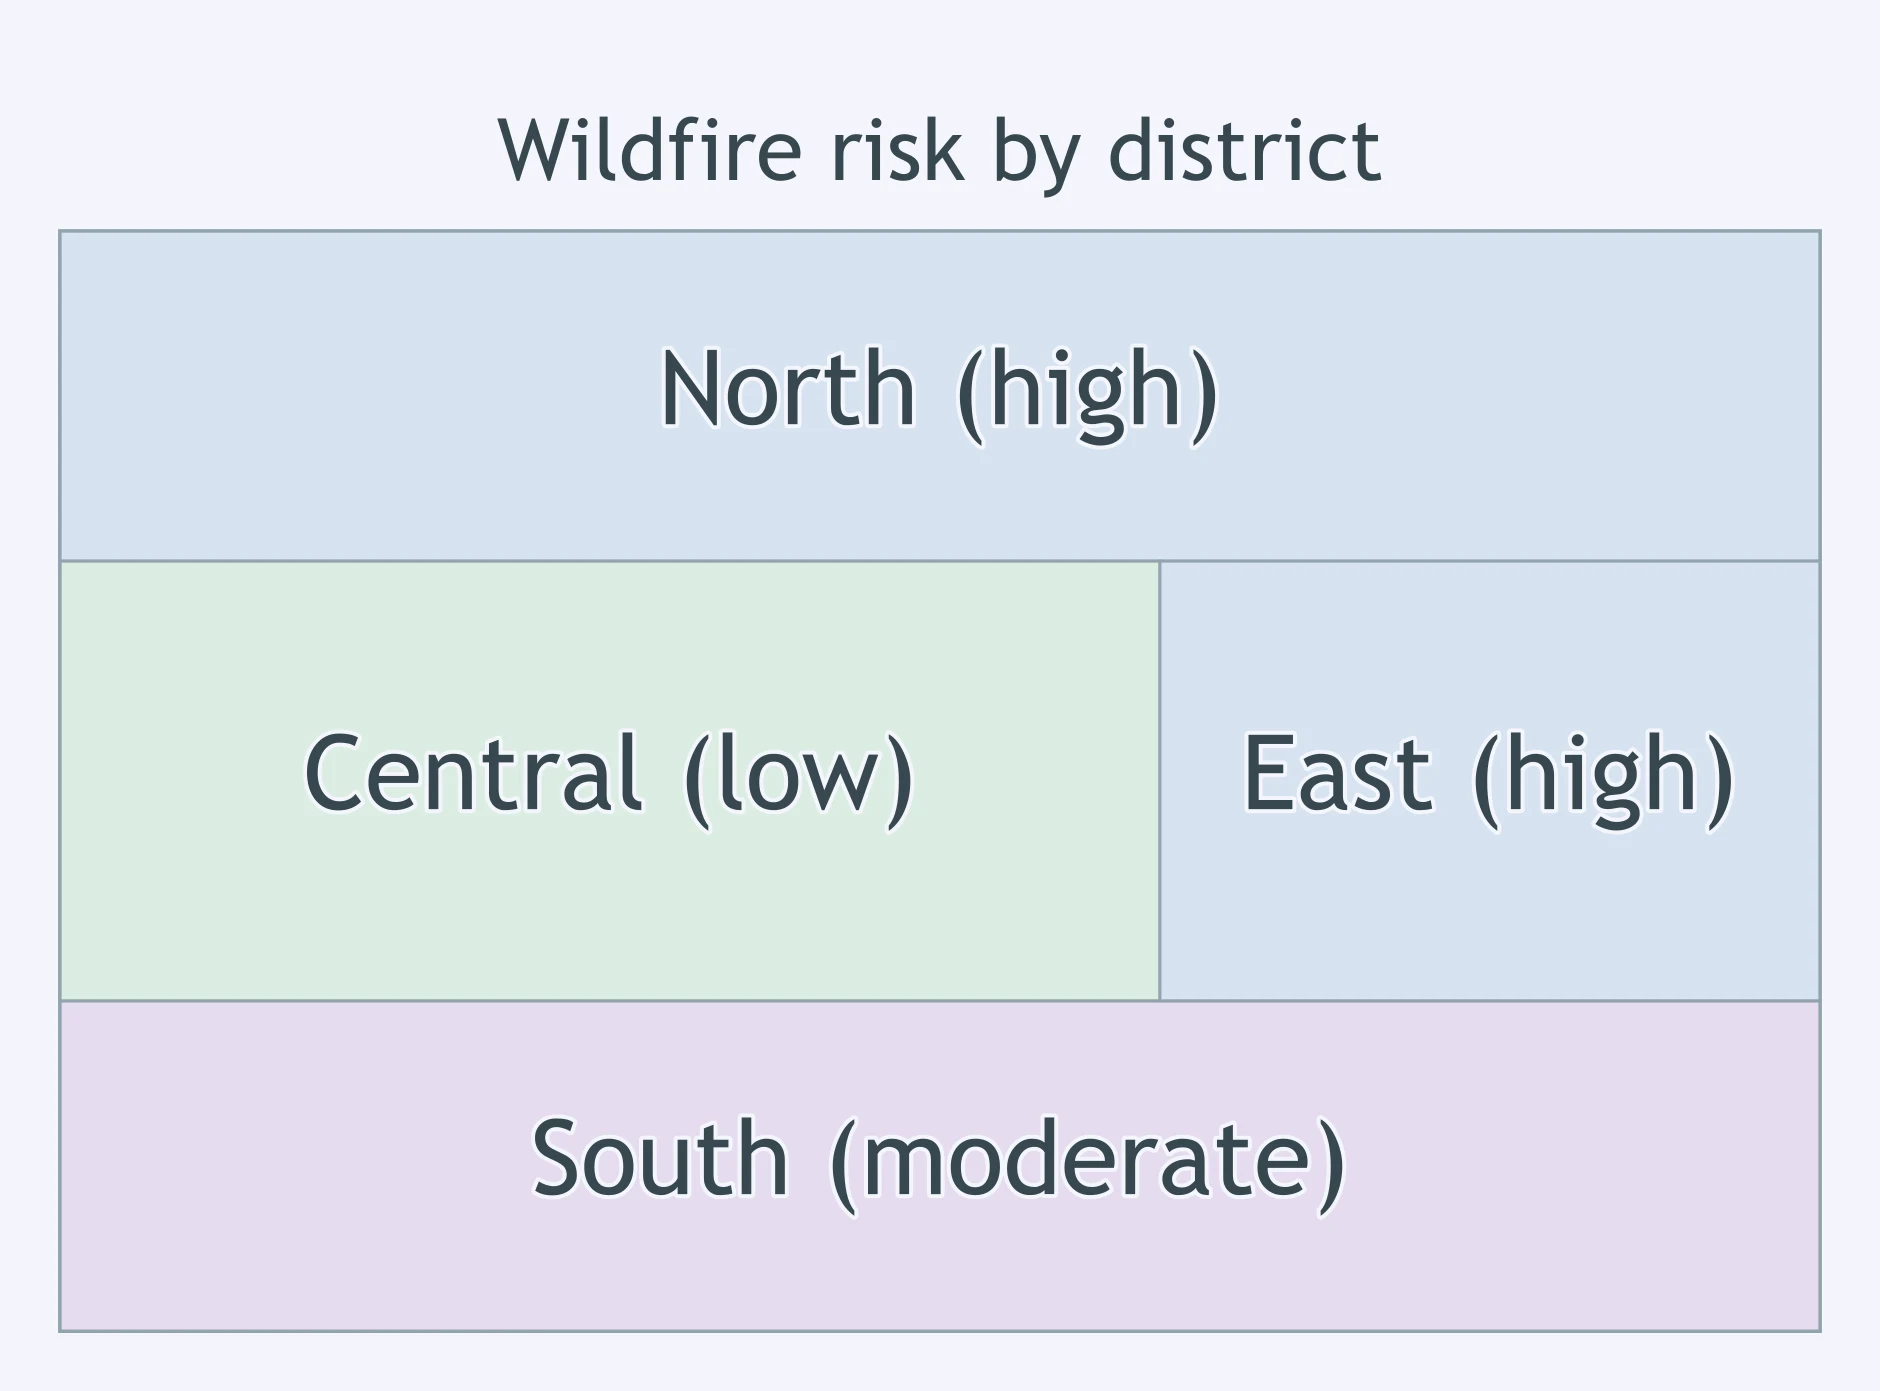
A map beside a wildfire report shades four districts by risk. The report says risk "is concentrated, not spread evenly." What does the map contribute to that sentence?
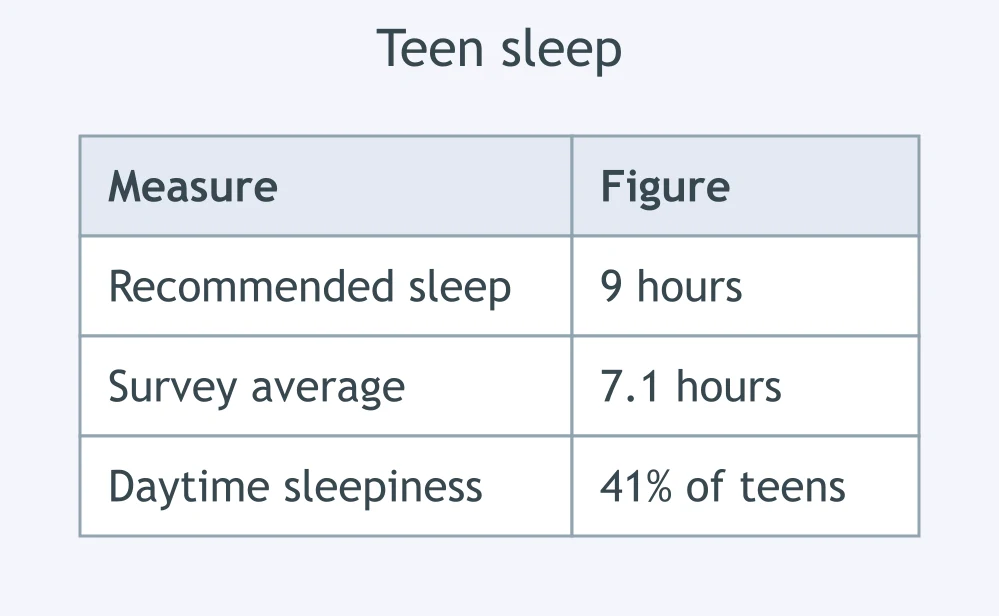
An infographic on teen sleep gives three figures. What main idea does the infographic present?
Interview transcript: "Q: Did the bag ban work? A: Litter on the beach fell 60 percent. But we counted more litter in the parking lot than before. People moved it, mostly." What main idea does the speaker present?
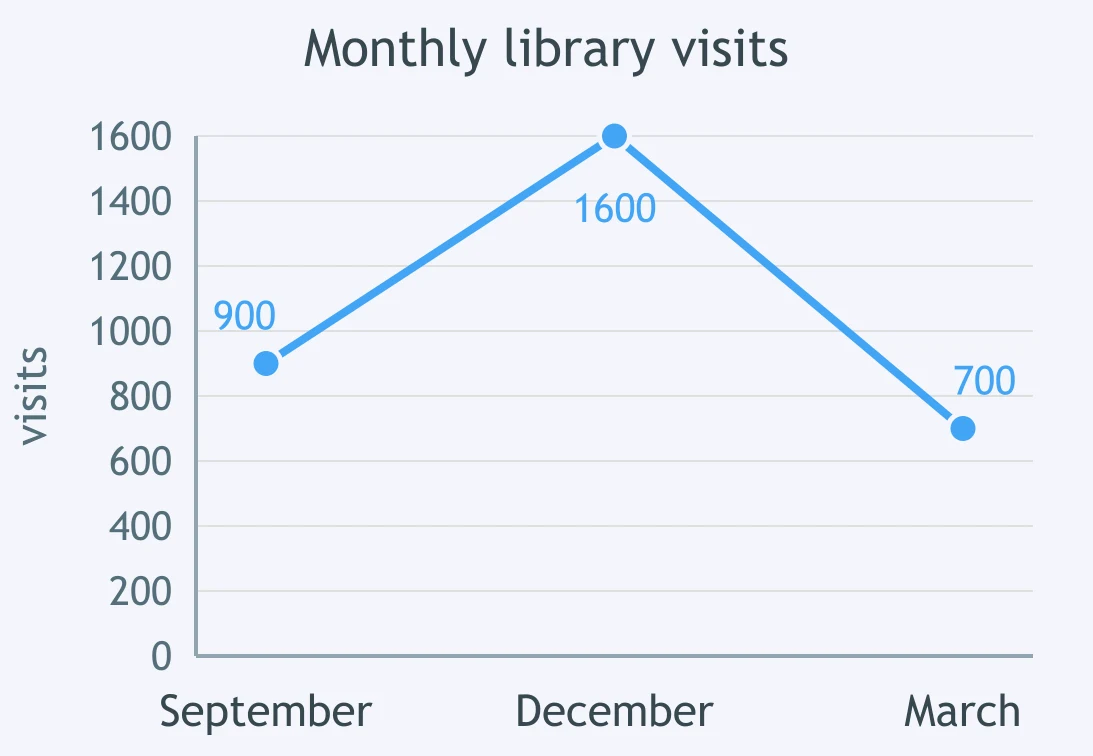
A line graph beside an article tracks monthly library visits. What main idea does the graph present?
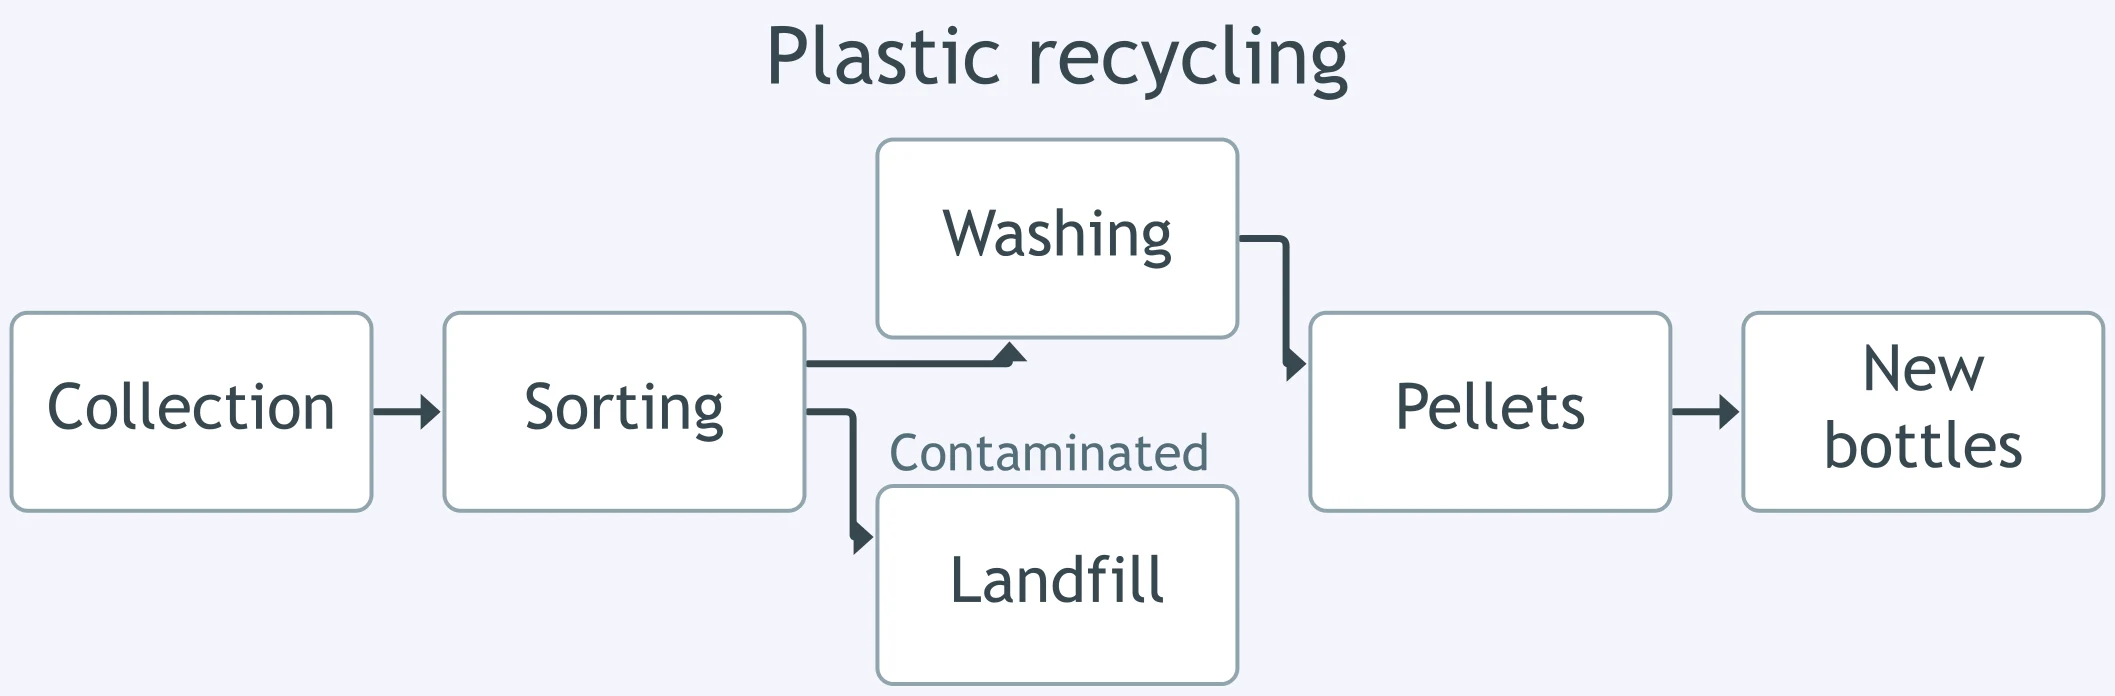
A flowchart beside a recycling article traces what happens to collected plastic. What main idea does the flowchart present?
Text 1 (article): "The storm damaged forty homes in the village." Clip transcript: "Forty homes were damaged, and thirty-eight of those stood on a single street." How does the clip relate to the written account?
A written report prints a mayor's speech in full. A recording of the same speech is described as delivered to a crowd that cheers after each of the three promises. What does the recorded version add?
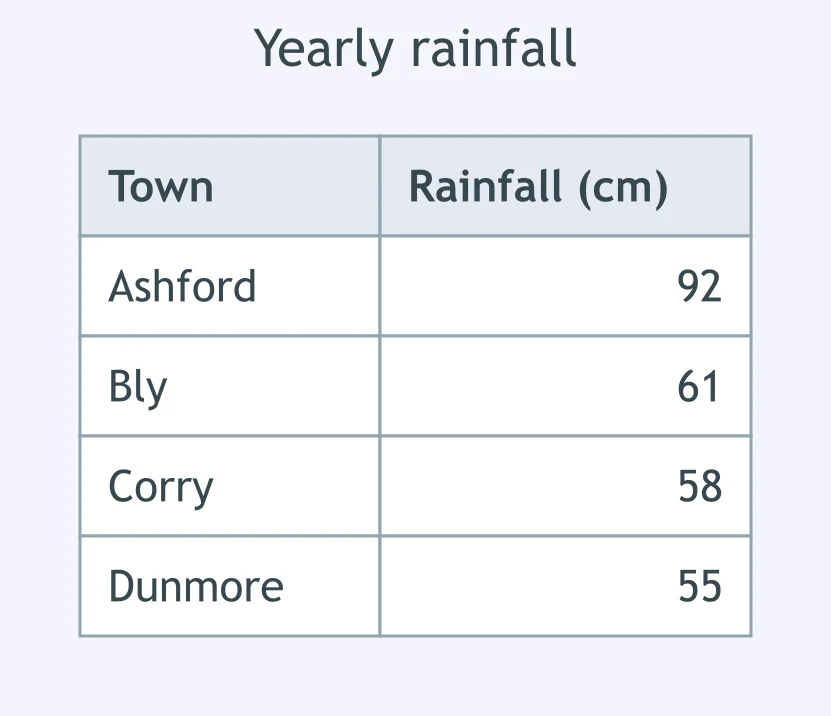
A table beside an article gives yearly rainfall for four towns. The article calls the region "uniformly dry." What does the table do to that claim?
A three-panel infographic on plastic waste is headed, in order: "Where it comes from," "Where it ends up," and "What one town changed." What does the third panel contribute to the whole display?
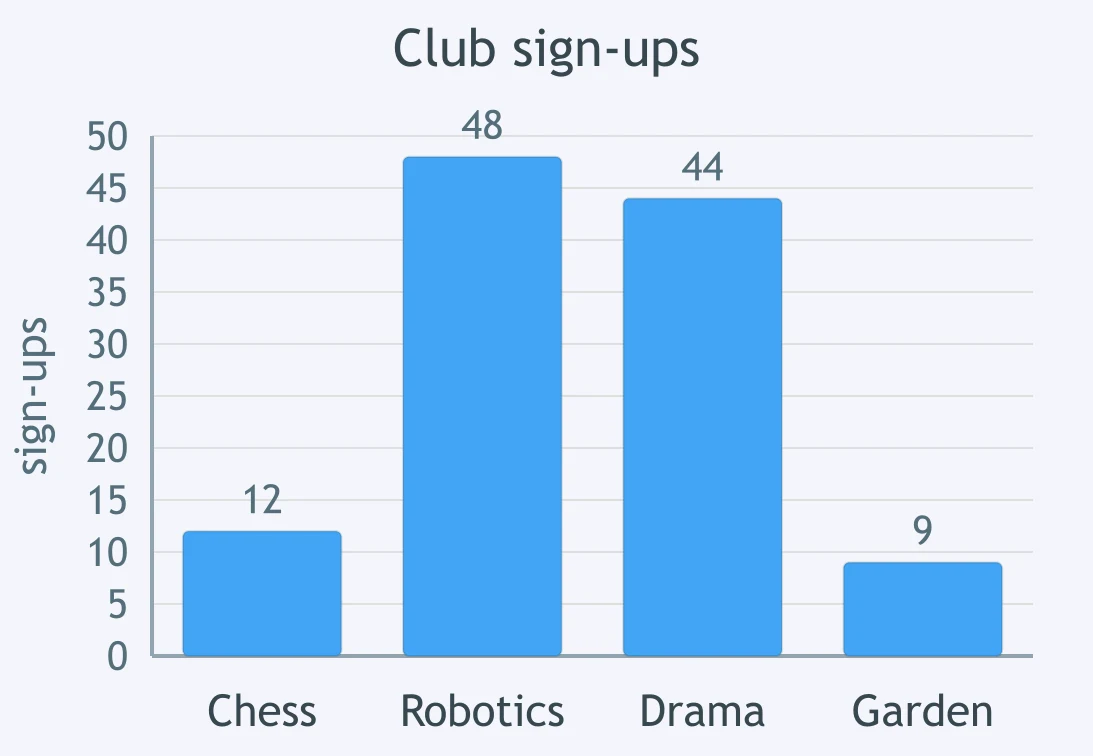
A chart of club sign-ups sits under a caption saying sign-ups "split into two very different tiers." Which figures best support that caption?
News clip transcript: "The river bridge closes Monday for eight weeks of repairs. Two bus routes will take a detour. The transit office says the ferry will add trips each morning." What main idea does the clip present?
Text 1 (article) reports that a new park cost $2 million and opened a year late. A slideshow on the same park gives visitor counts for each of its first six months. Which emphasis does each choose?
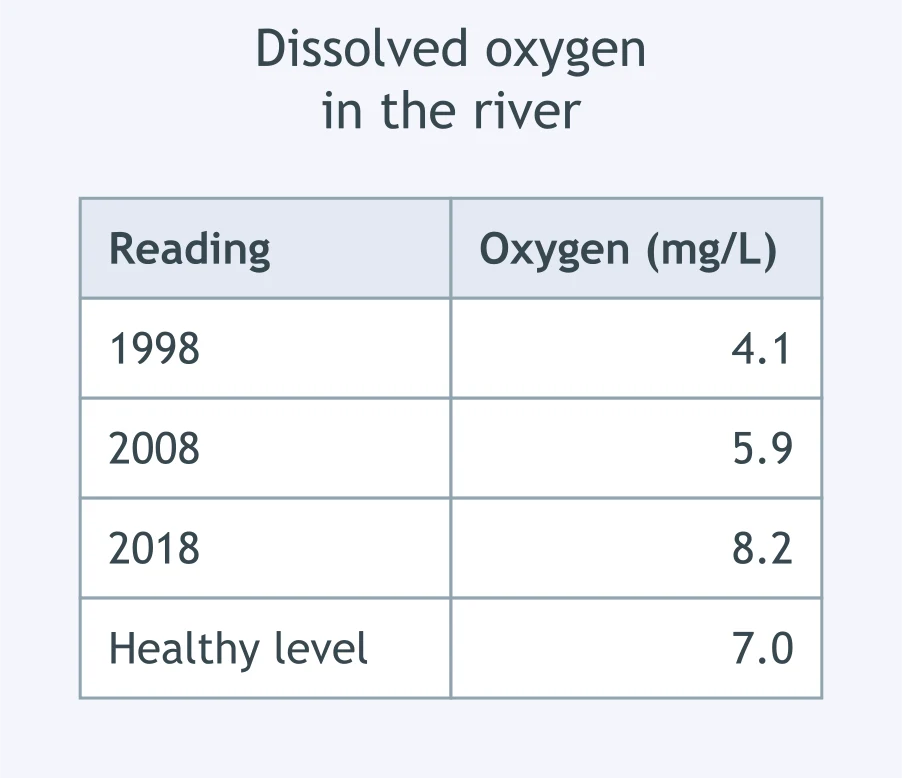
An article says a river "has recovered." A table beside it gives the river's dissolved oxygen at three dates, against the healthy level. What does the table clarify?
Narration transcript from a science program: "Each spring the pond fills. Each August it is dust. The tadpoles have eleven weeks to become frogs, and the pond grants no extension." What main idea does the narration present?
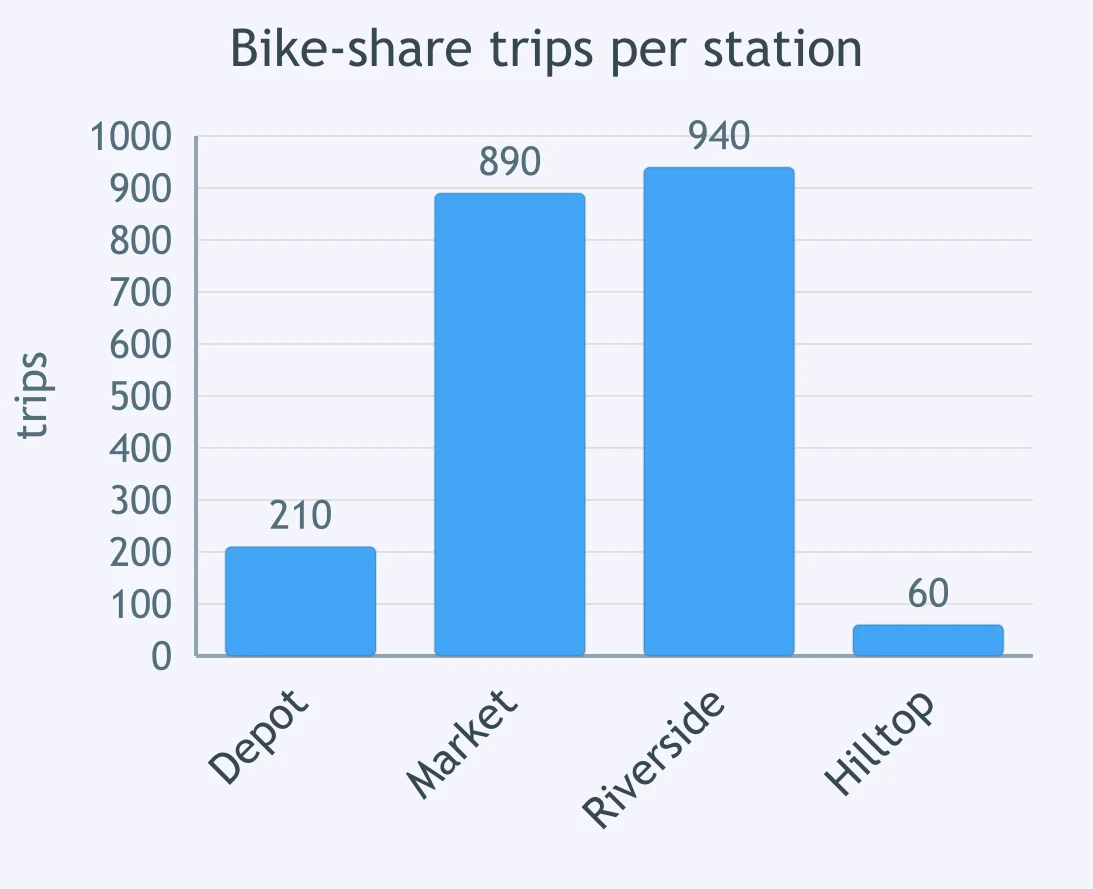
A bar chart beside an article on a bike-share program gives trips per station. What main idea does the chart present?
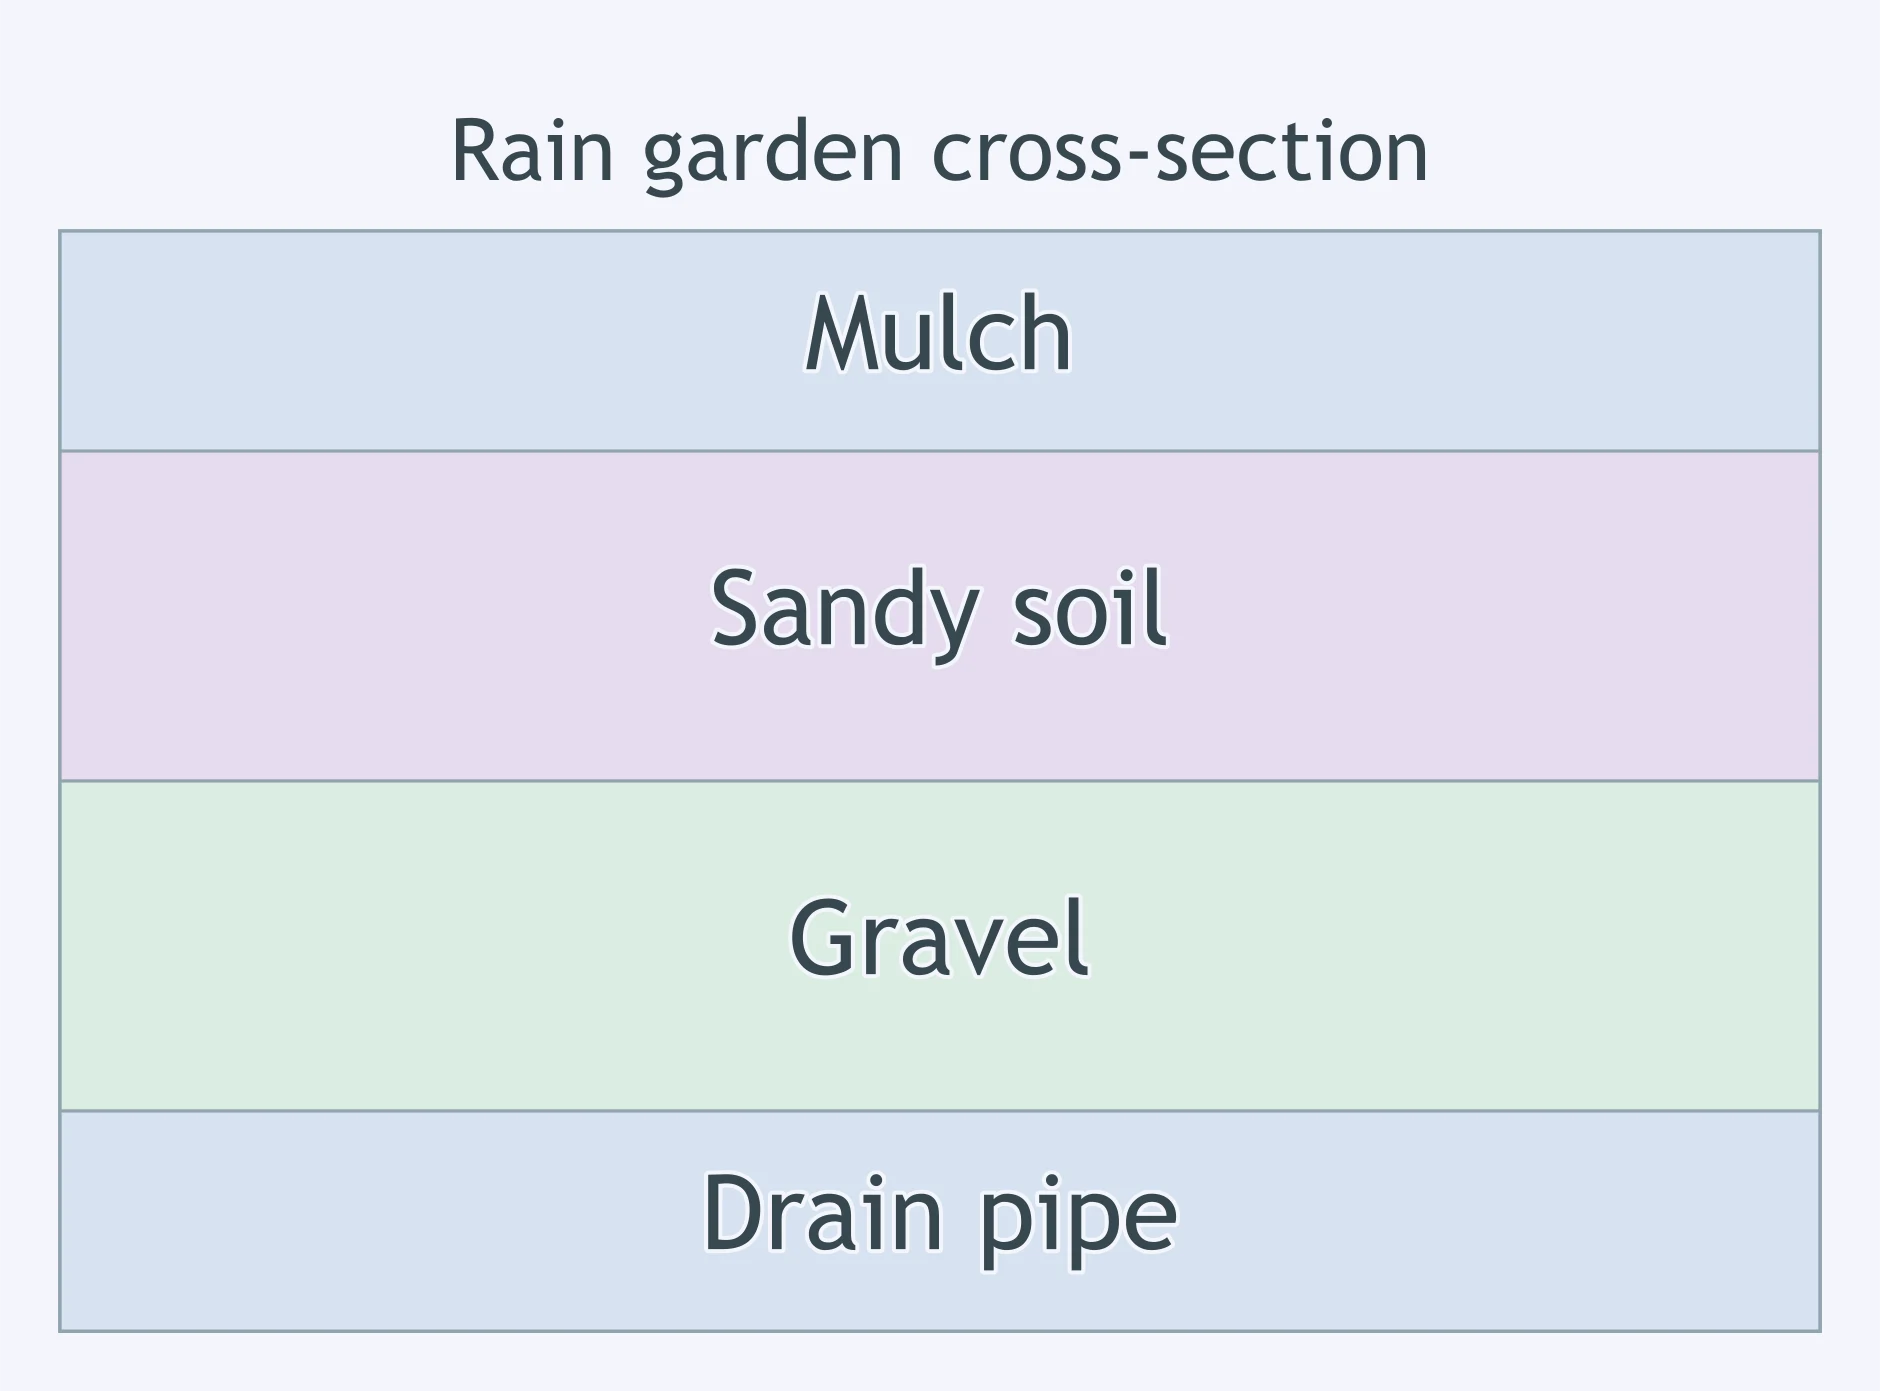
An article describes a rain garden in one paragraph. A cross-section diagram beside it shows its layers. What does the diagram add to the paragraph?
Podcast transcript: "We planted two hundred trees downtown. Six years on, the sidewalks under them read nine degrees cooler on an August afternoon than the bare block one street over." What main idea does the speaker present?
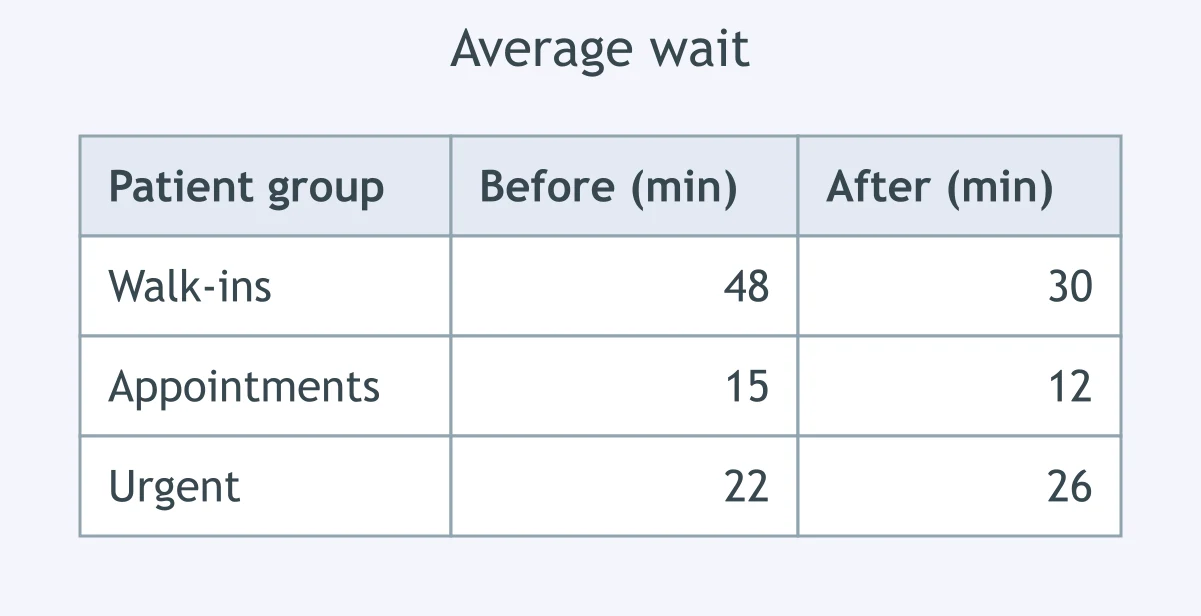
An article says a clinic's new check-in system "helped every patient group." A table beside it gives the average wait before and after for each group. What does the table do to that claim?
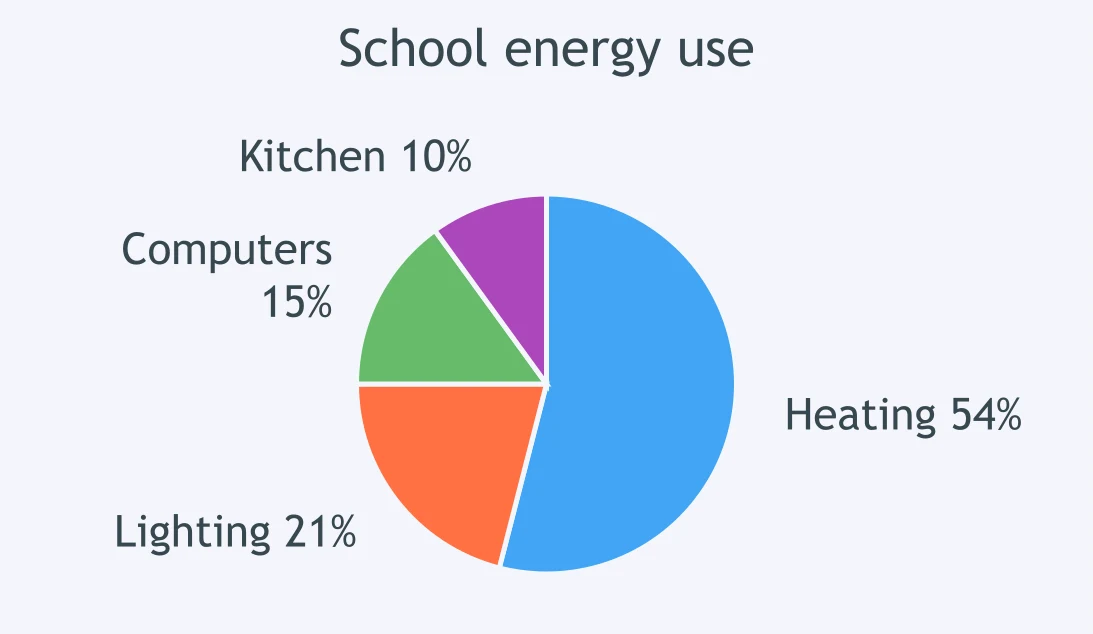
A circle graph beside an article divides the school's energy use for the year. What main idea does the graph present?
Text 1 (article): "The wind farm powers 12,000 homes." An infographic on the same farm gives bird deaths per year, plus a note that the turbines now pause during peak migration weeks. What does the infographic add?
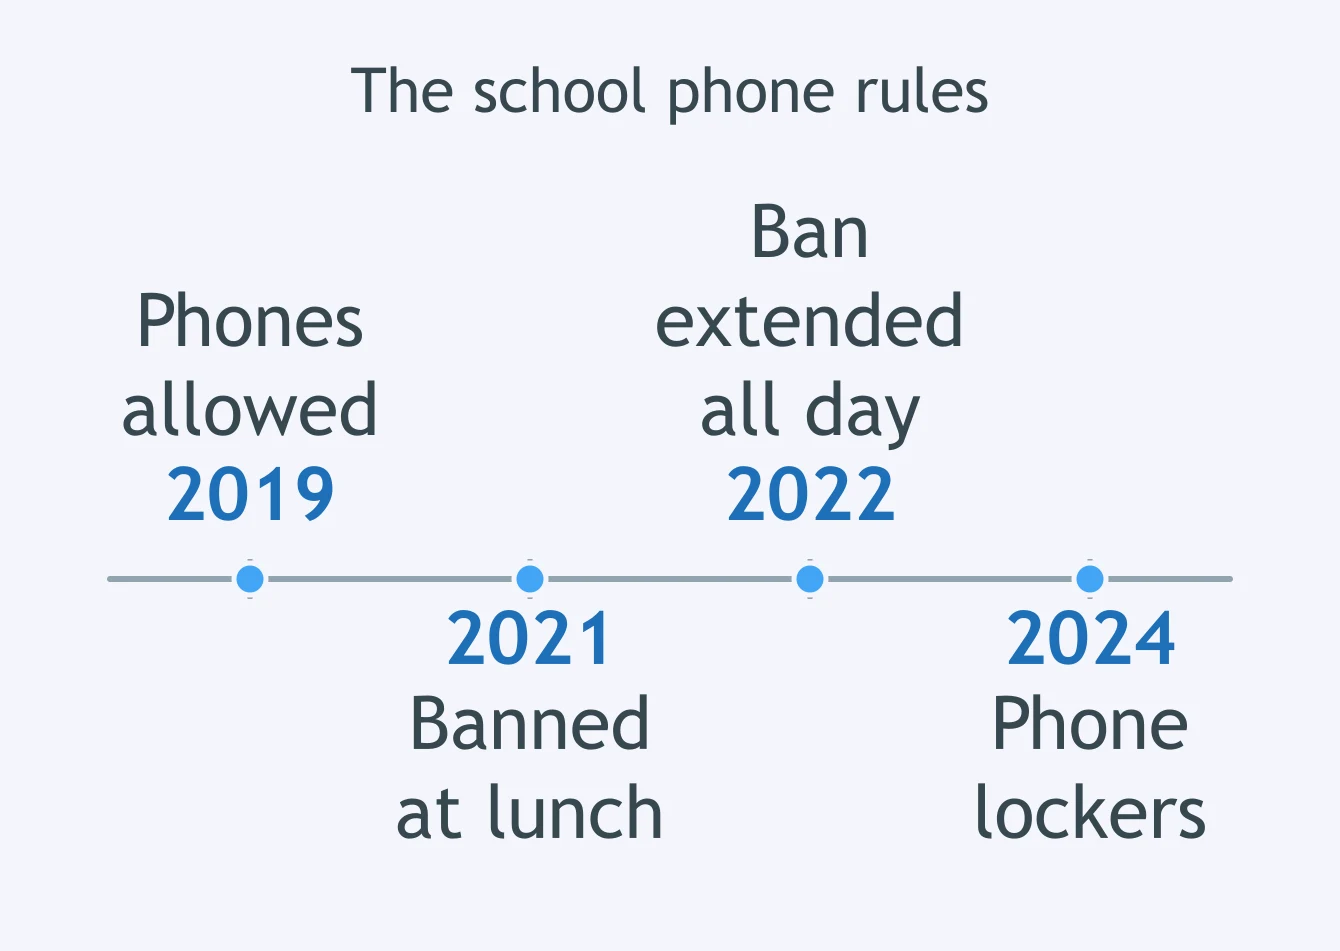
A timeline beside an article marks the changes to a school's phone rules. What main idea does the timeline present?
Interview transcript: "Q: Are the wolves back? A: We count nineteen, up from four. But every one of them lives in the same valley. One bad winter there and the number is four again." What main idea does the speaker present?
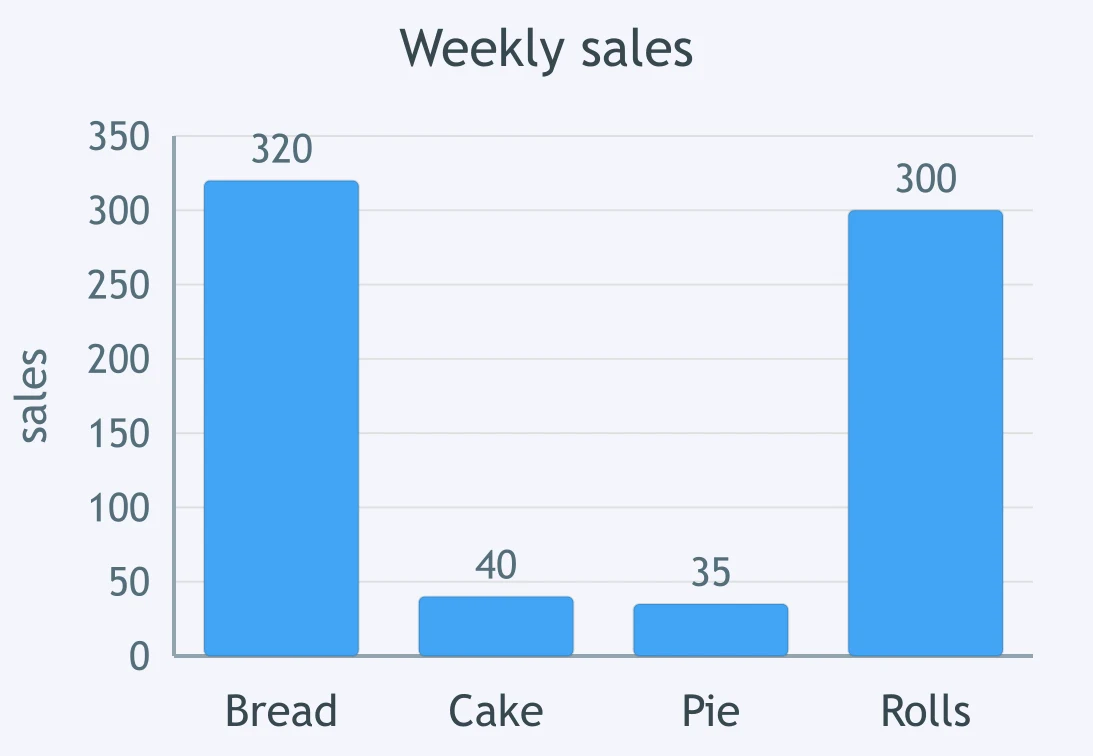
A chart of a bakery's weekly sales sits under a caption saying sales are "spread evenly across the four items." What does the chart do to that caption?
A written article prints a wildfire survivor's account in full. A recording of the same account is described as pausing for six seconds before she names her street, then finishing in a lower voice. What does the recorded version add?
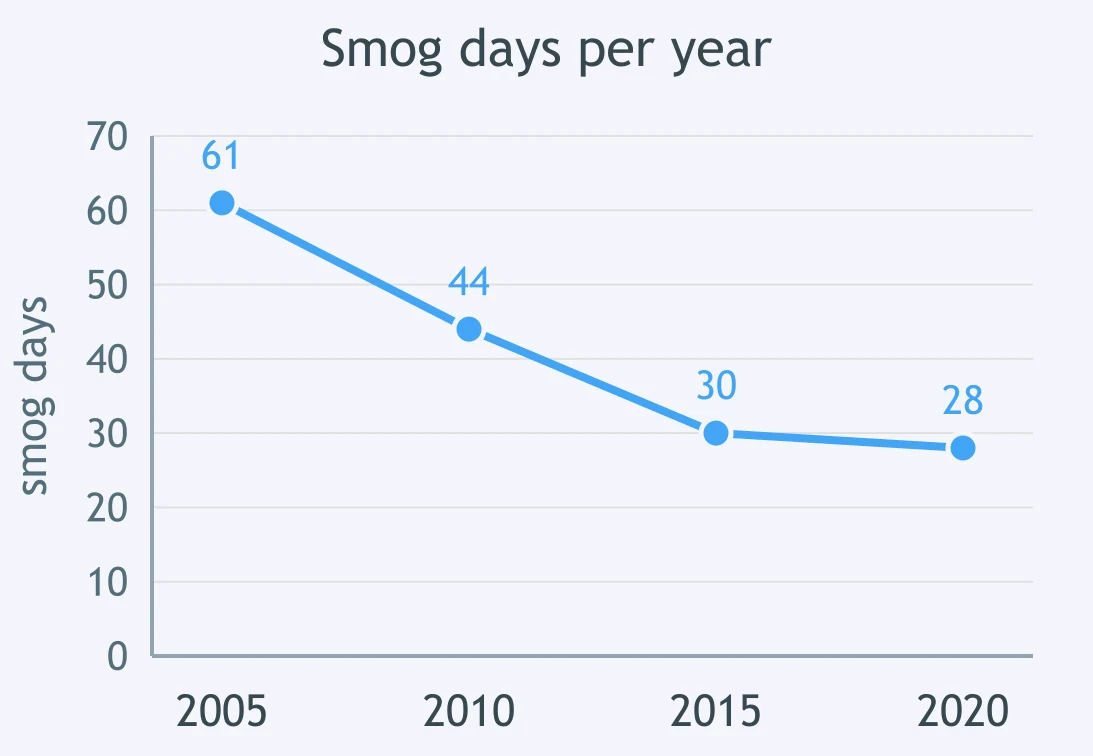
A line graph beside an article on city air quality tracks smog days per year. What main idea does the graph present?
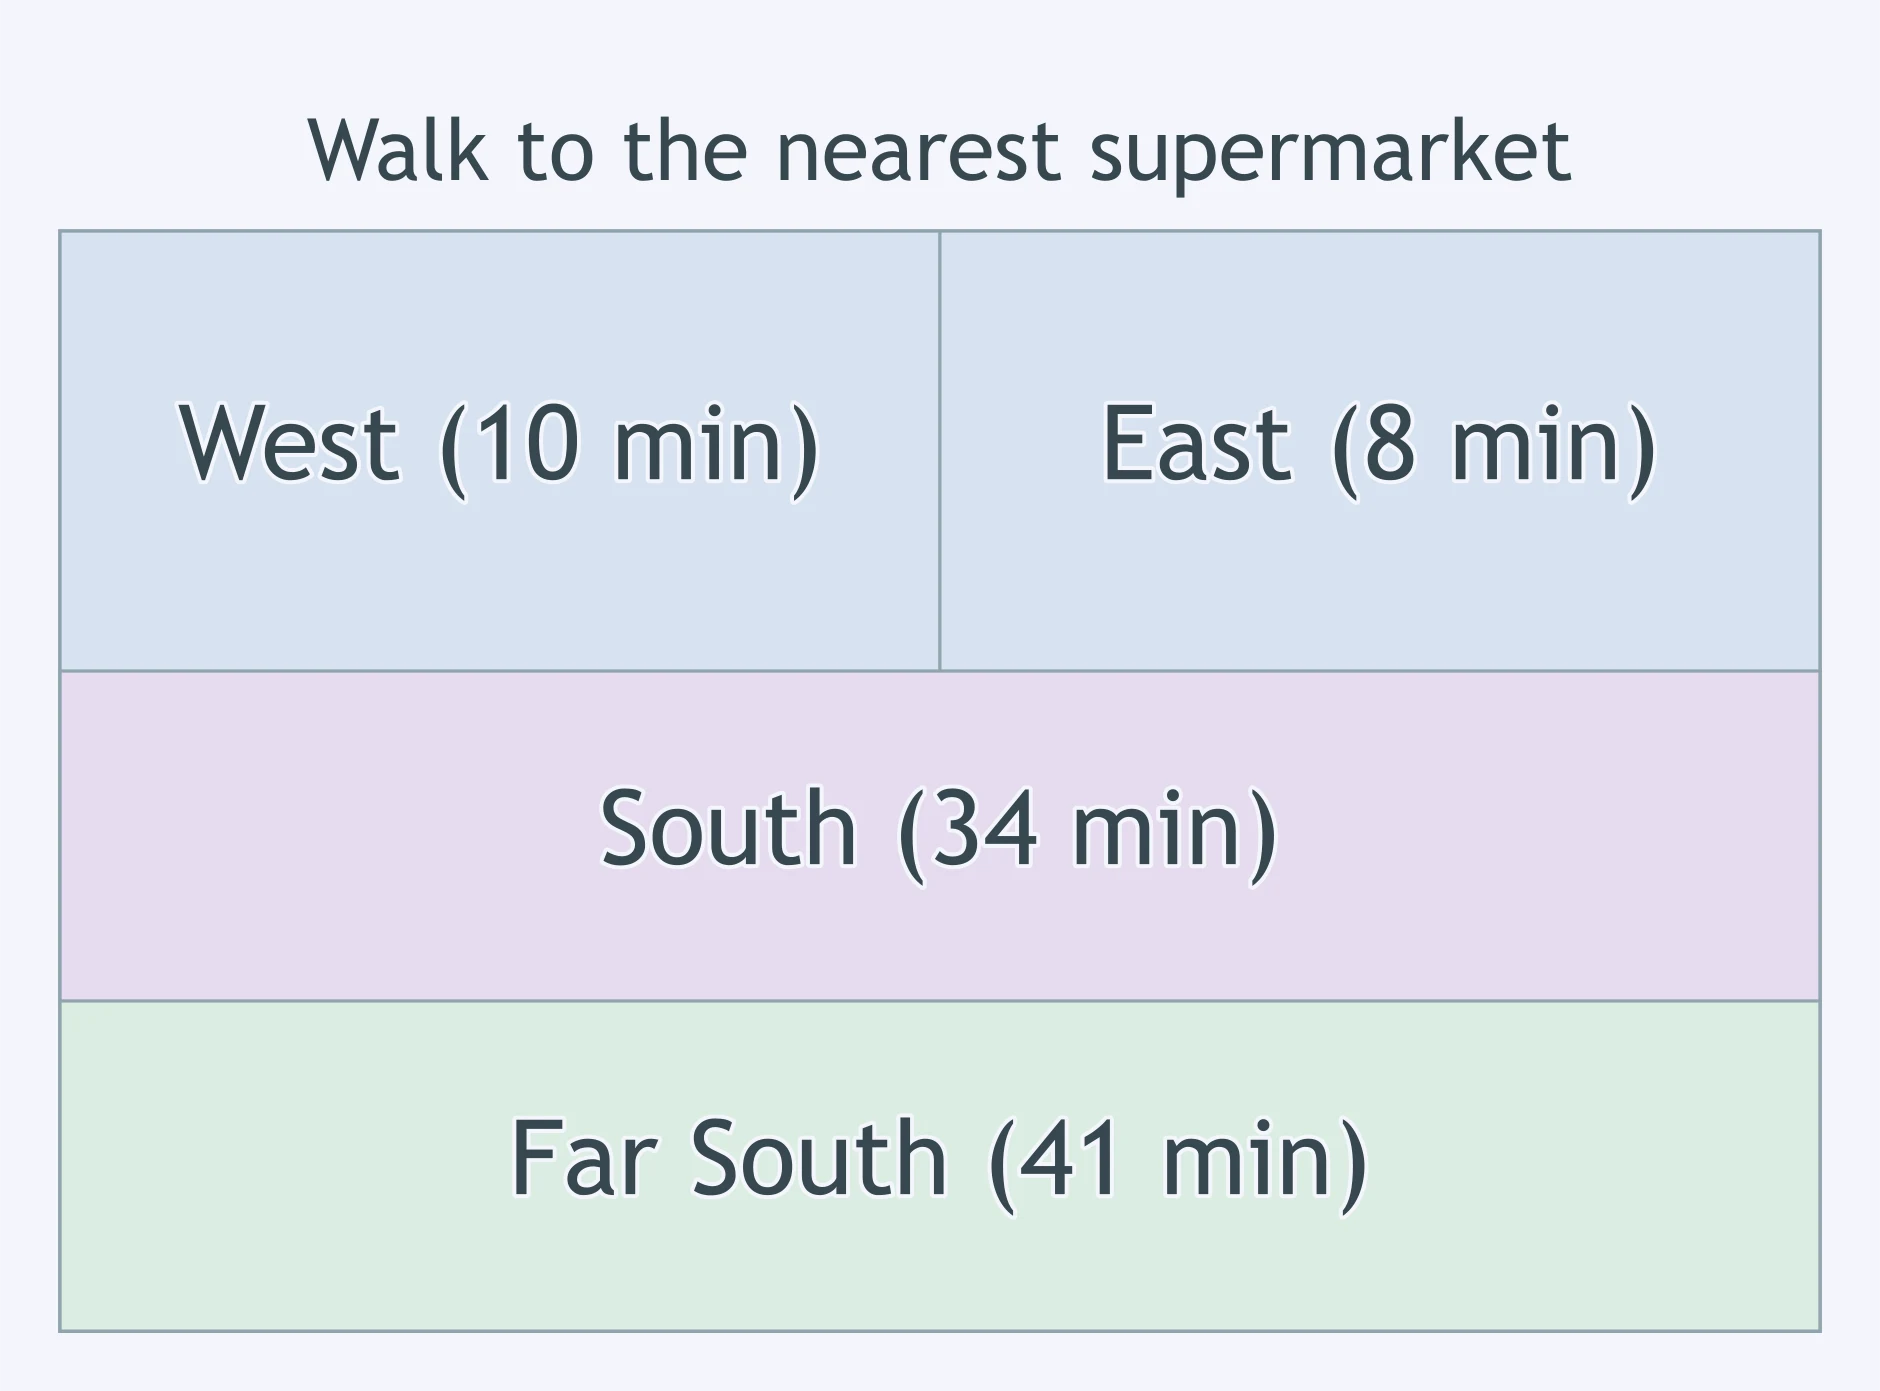
A map beside an article on grocery access shades neighborhoods by walking time to a supermarket. What does the map clarify about the article's phrase "a divided city"?
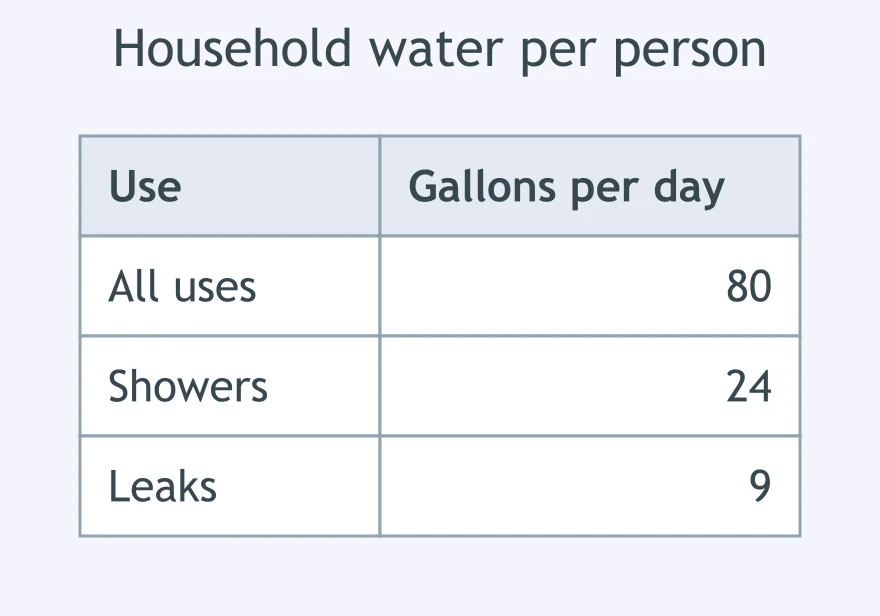
An infographic on household water use gives three figures. What main idea does the infographic present?
A slideshow beside an article on a school garden shows the same bed in four seasons and gives the pounds harvested in each month. The article calls the garden "a spring project." What does the slideshow do to that phrase?
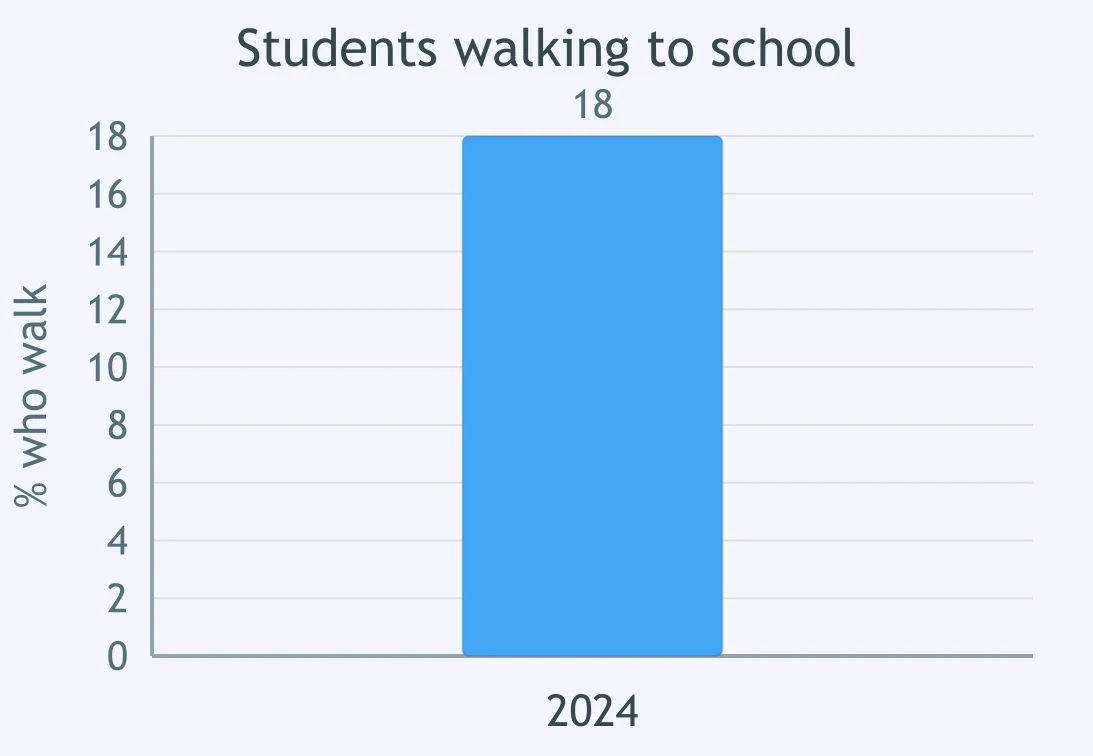
An article claims students "walk to school less than they used to." A bar chart beside it gives the share of students who walk. What does the chart do for that claim?
News clip transcript: "The library opens on Sundays starting in March. Two branches will close an hour earlier on weekdays to pay for it. Staff numbers stay the same." What main idea does the clip present?
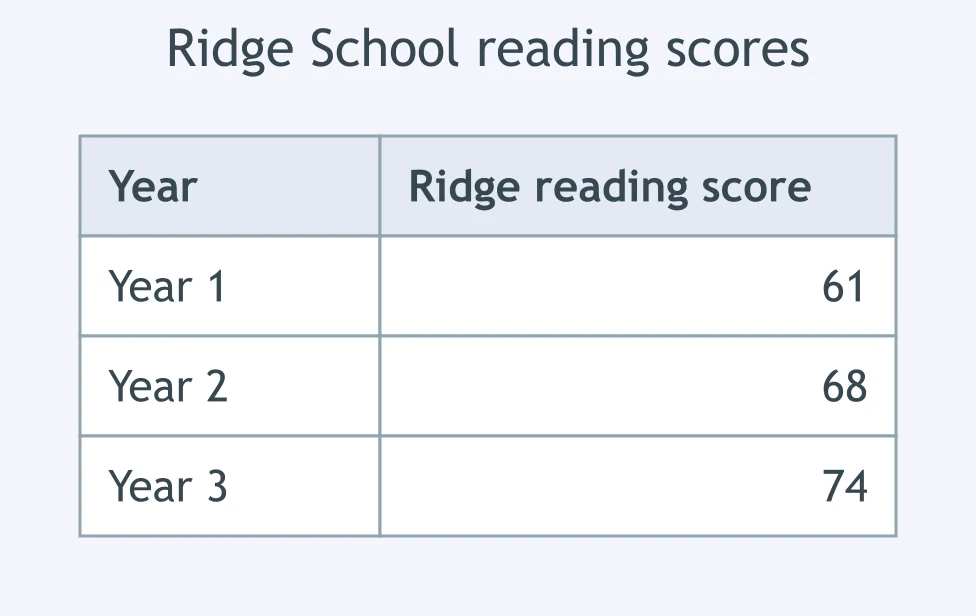
An article claims Ridge School's new tutoring worked better than Hale School's. A table of reading scores runs beside it. What does the table fail to supply?
An article says a glacier "has retreated." Two dated photographs from the same overlook are described beside it: in 1985 ice fills the valley to a marked rock. In 2020 the ice ends half a mile above that rock. What do the photographs clarify?
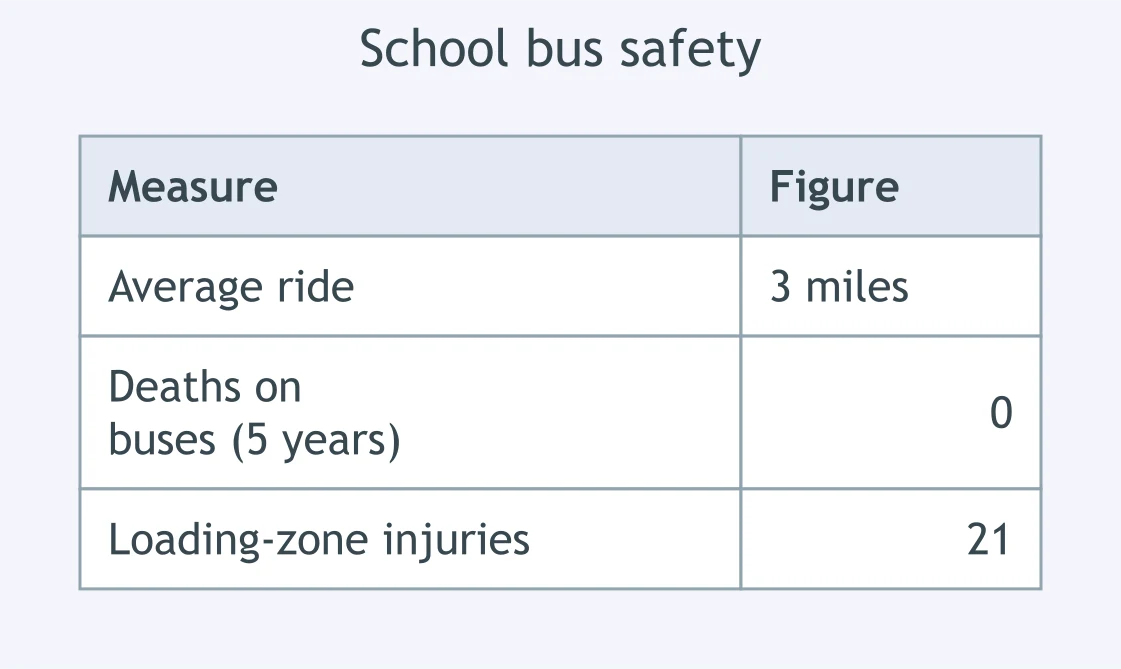
An infographic on school bus safety gives three figures. What main idea does the infographic present?
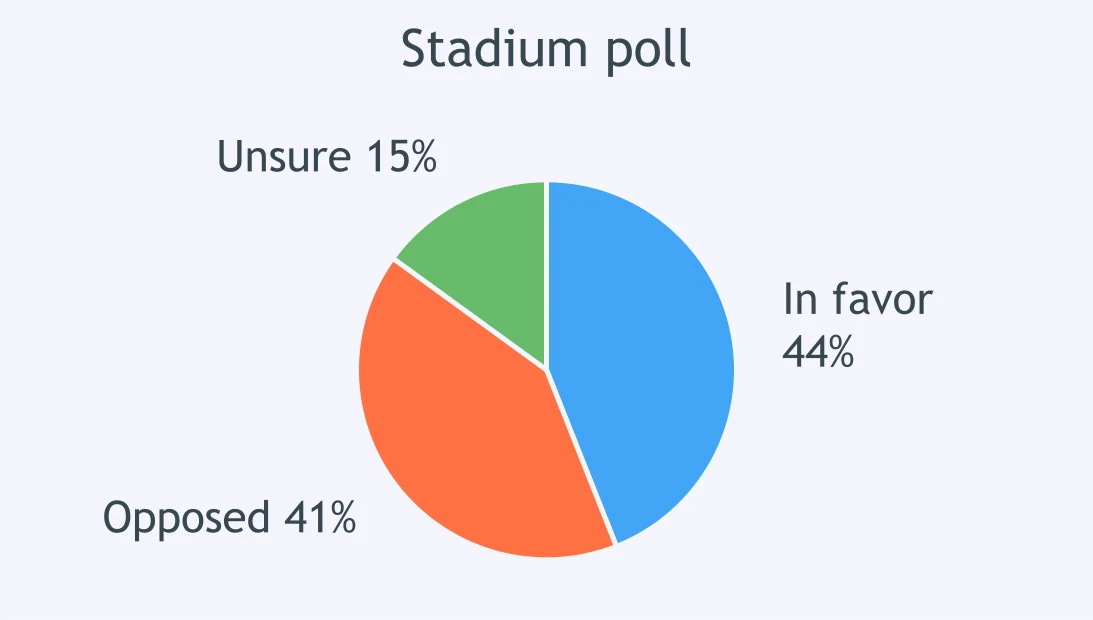
A poll chart beside an article on a proposed stadium reports the results. Which summary adds a judgment the chart itself does not give?

Science and Technical Literacy: Evidence, Central Ideas or Conclusions, and Following a Procedure
40 questions
Science and Technical Literacy: Structure, Purpose, and Fact, Judgment, and Speculation
40 questions
Comparing an Experiment, Simulation, or Multimedia Source with a Written Account
40 questions

Collegial Discussion Rules, Roles, Elaboration, and Modifying One's Own View
40 questions

Crack the passcode before the zombies get in.

Pick a tile, answer, hit bonuses and steals.
Evaluating a Speaker's Argument: Soundness, Relevance, and Sufficiency
40 questions