Loading
by BlastRoom
Read values, trends and comparisons off biology graphs and tables, and judge what the data cannot show.
#biology
20 questions
One question set, multiple game modes. Tap any game to see it in action. Not sure which to pick?
Answer to place stones and capture territory.
Outrun the snow together.
Earn blasts, then hunt the other team.
Answer to earn energy, then climb.

The class blasts through walls together.
Bid on mystery lots. Most money wins.
Sell tours. Nice, standard, or a total scam.

Answer, restock, and serve the rush.
More correct answers pulls the rope your way.
Answer, then shoot down the alien wave.
Answer, then tap to leap the frozen ridge.
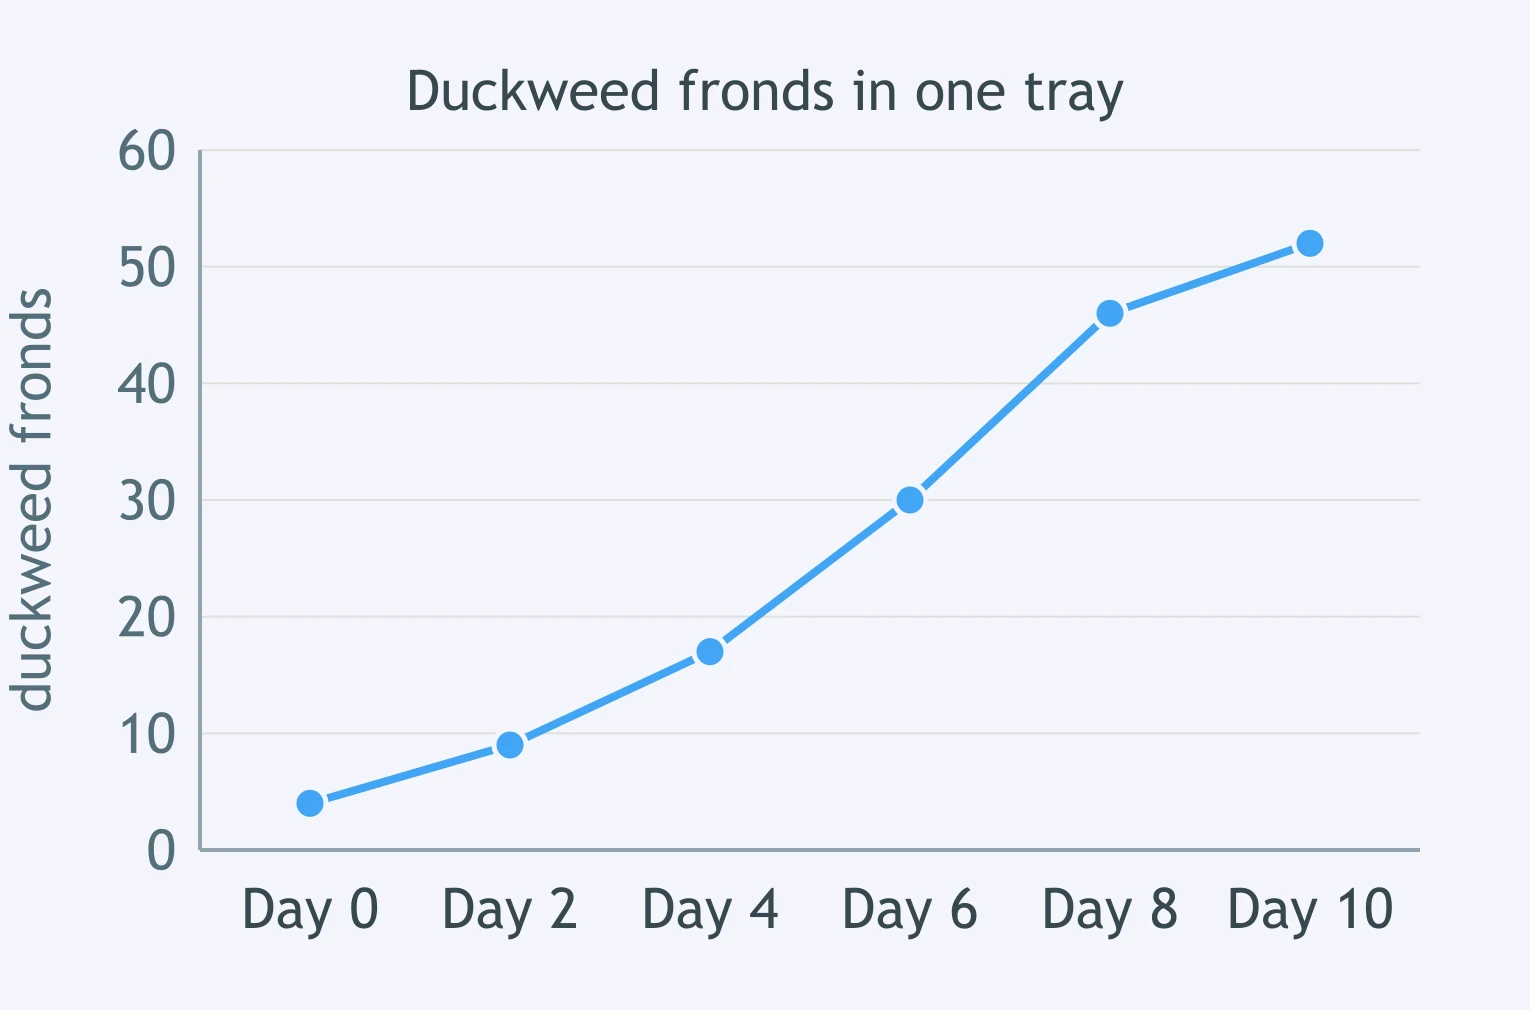
The line graph shows the number of duckweed fronds counted in one tray. About how many fronds were in the tray on day 6?
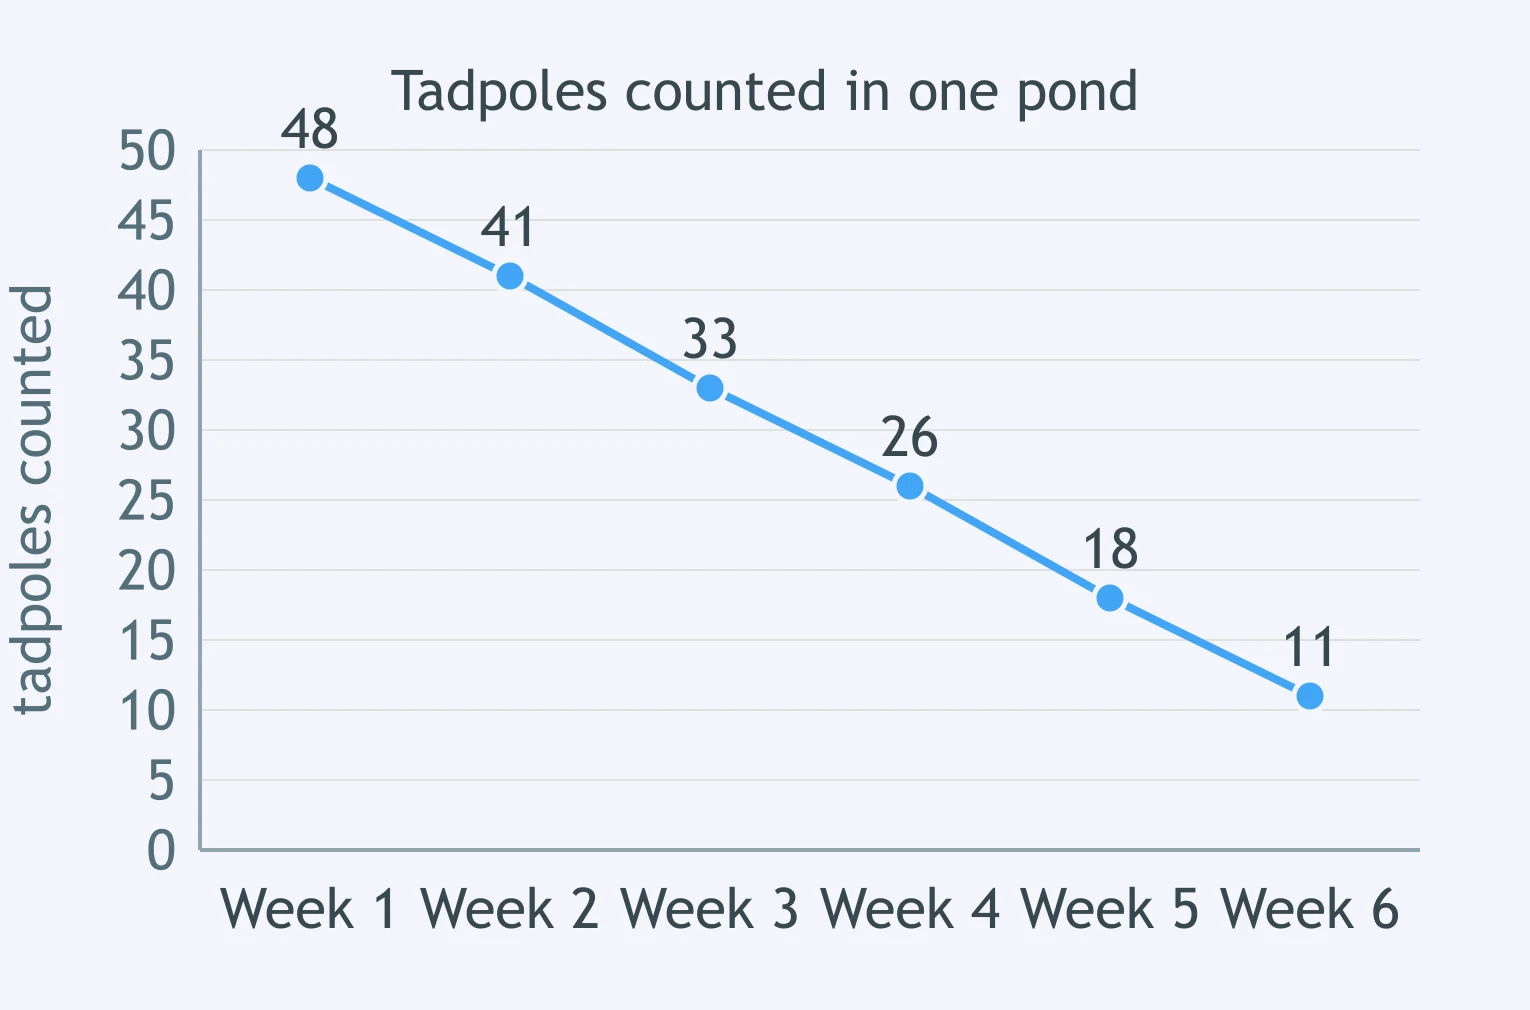
The line graph shows how many tadpoles were counted in one pond each week for six weeks. Which statement best describes the change the graph shows?
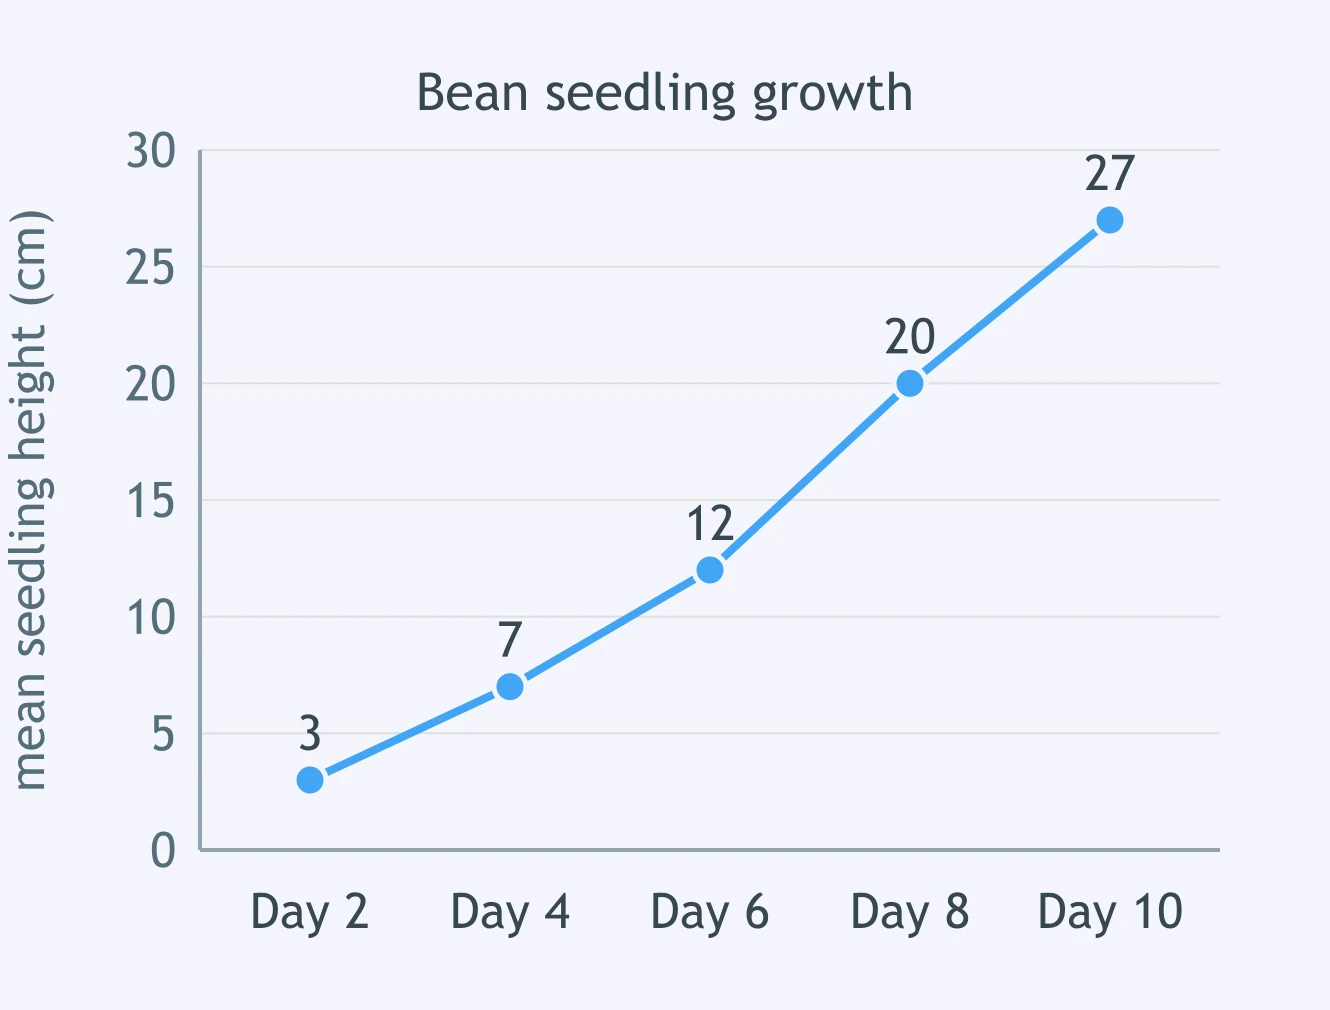
The line graph shows the mean height of bean seedlings measured every two days. How much taller was the mean seedling on day 10 than on day 4?
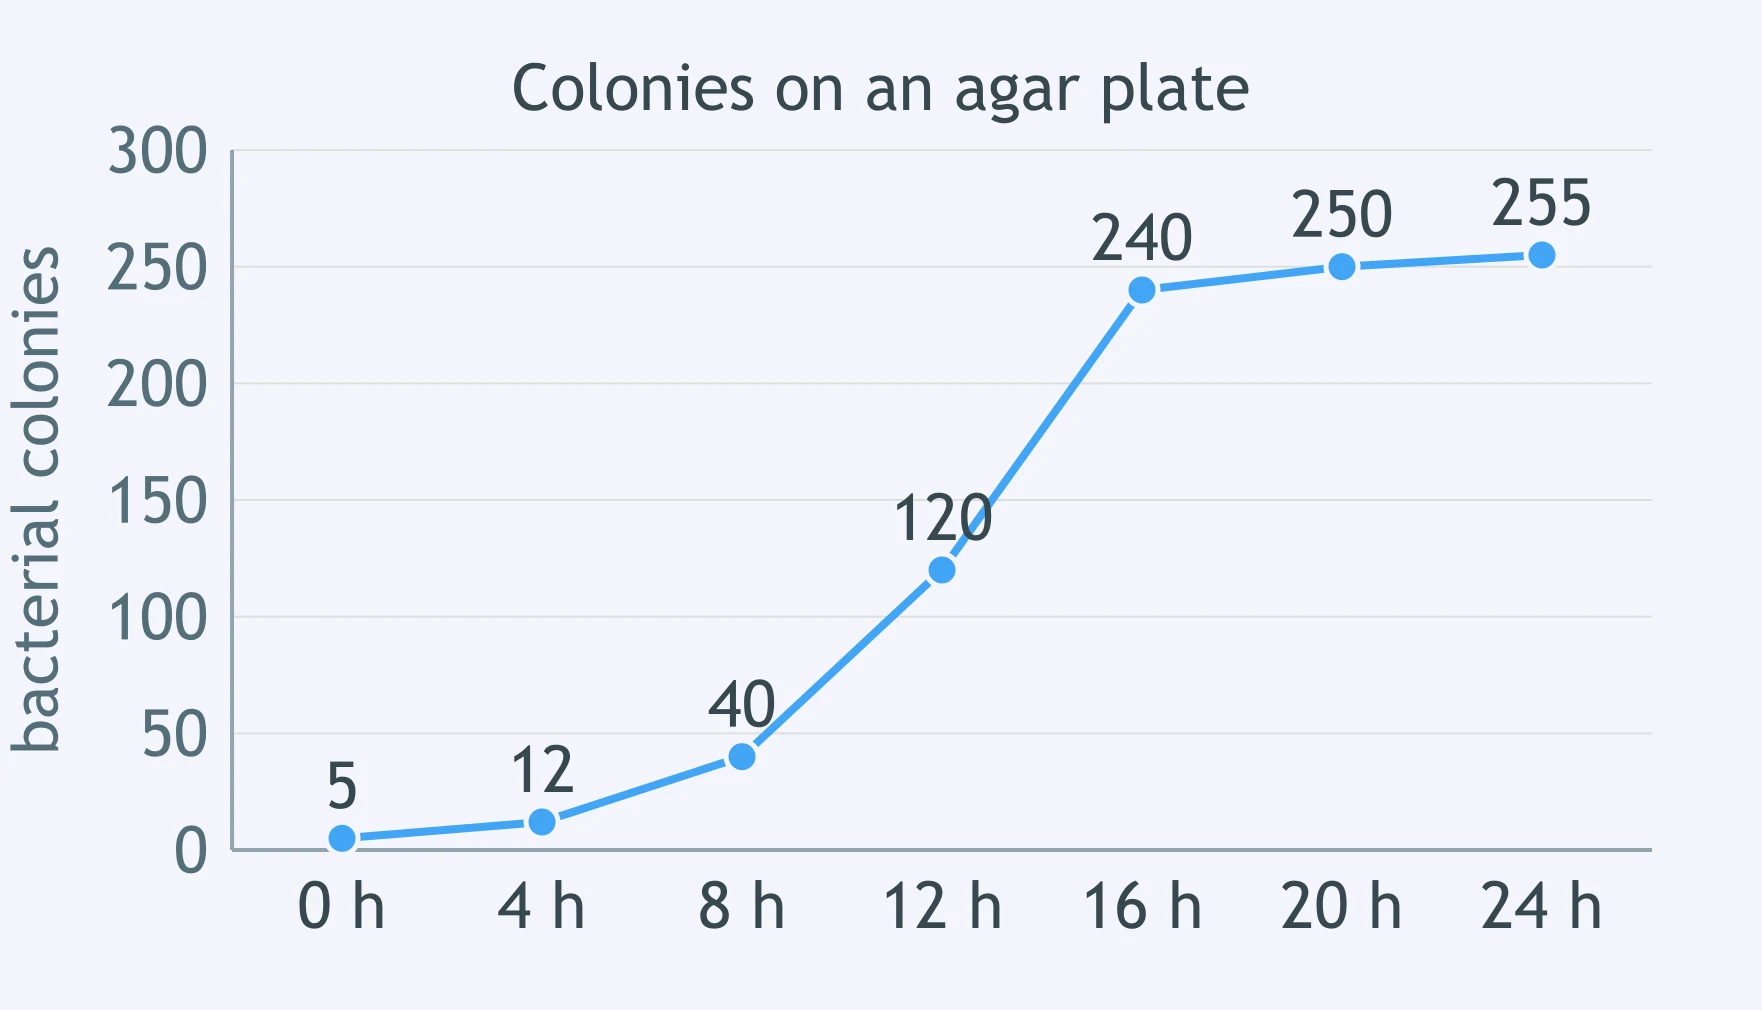
The line graph shows the number of bacterial colonies counted on one agar plate over 24 hours. Which statement best describes the trend?
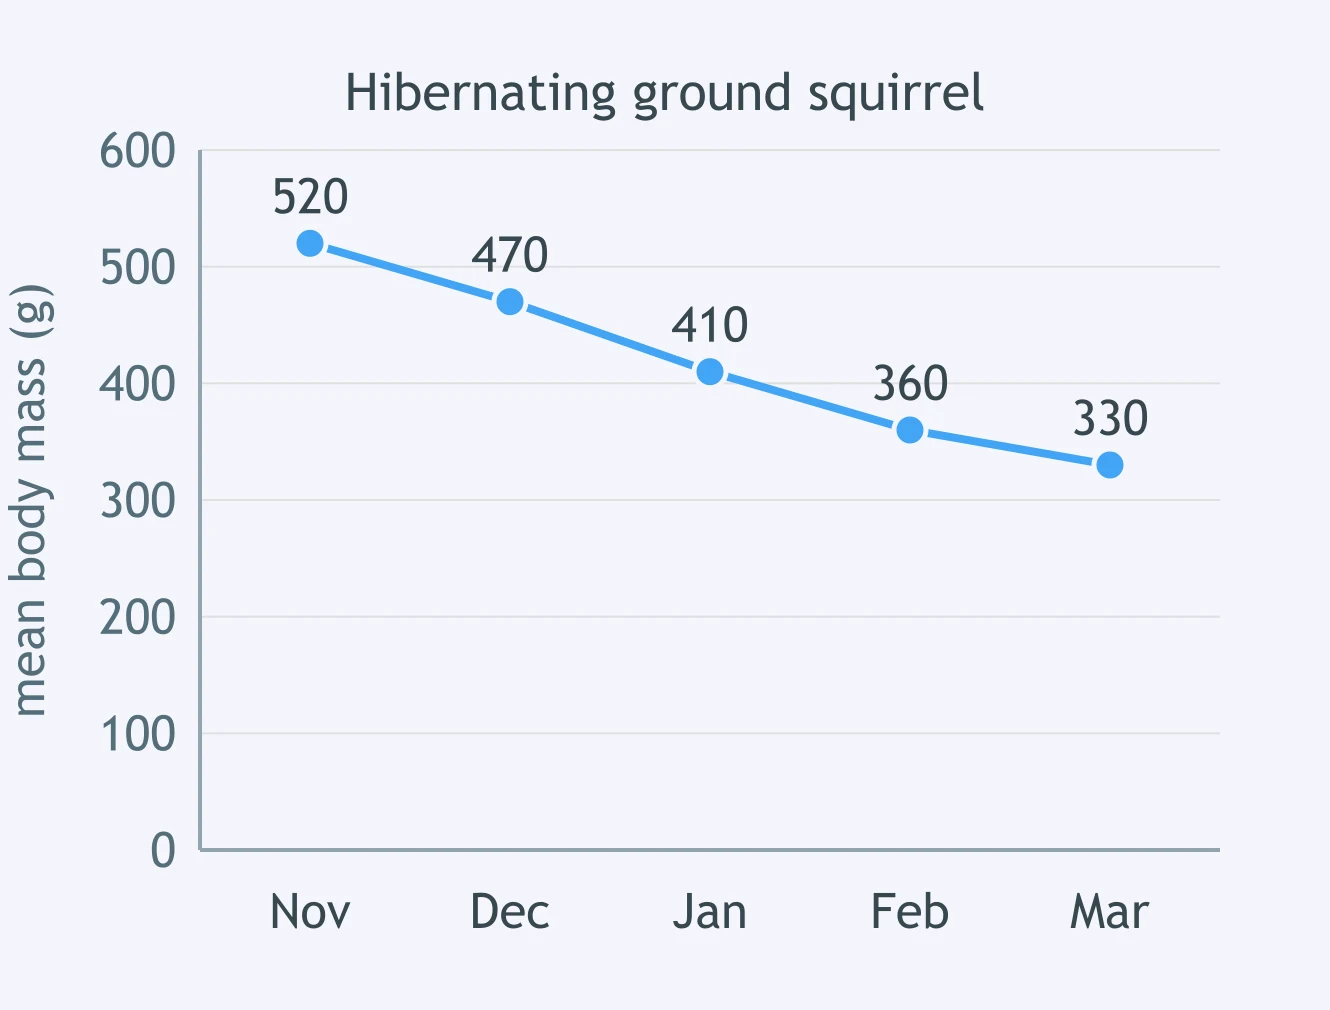
The line graph shows the mean body mass of one hibernating ground squirrel through the winter. Which conclusion is NOT supported by these data?
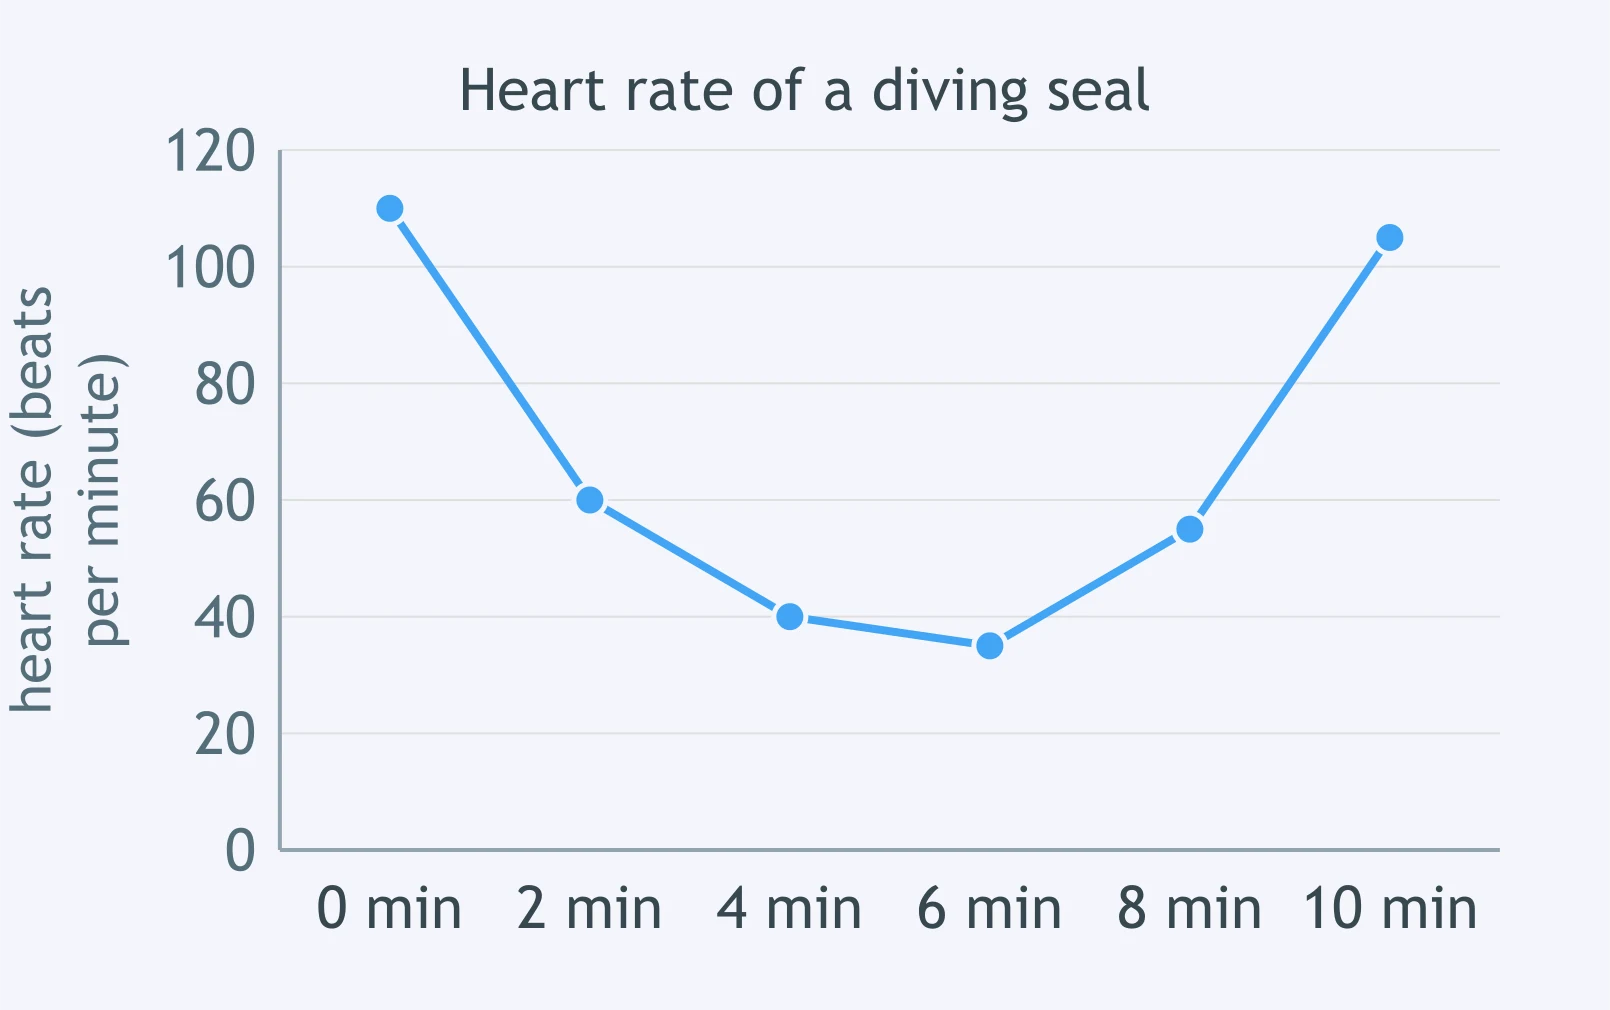
The line graph shows a seal's heart rate before, during and after a dive. At which time was the heart rate lowest?
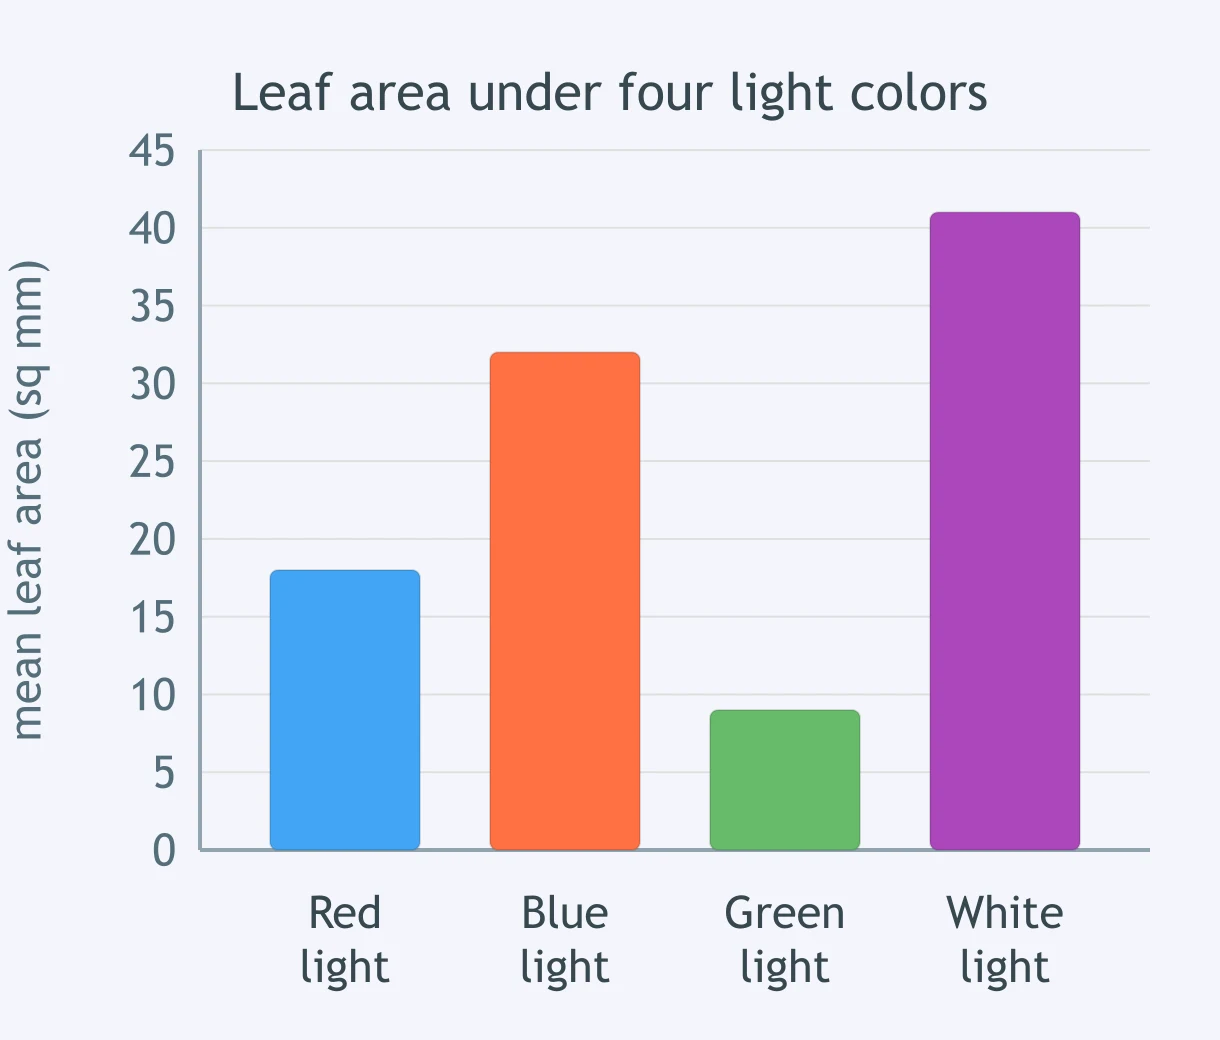
The bar graph shows the mean leaf area of plants grown under four colors of light. What was the mean leaf area of the plants grown under blue light?
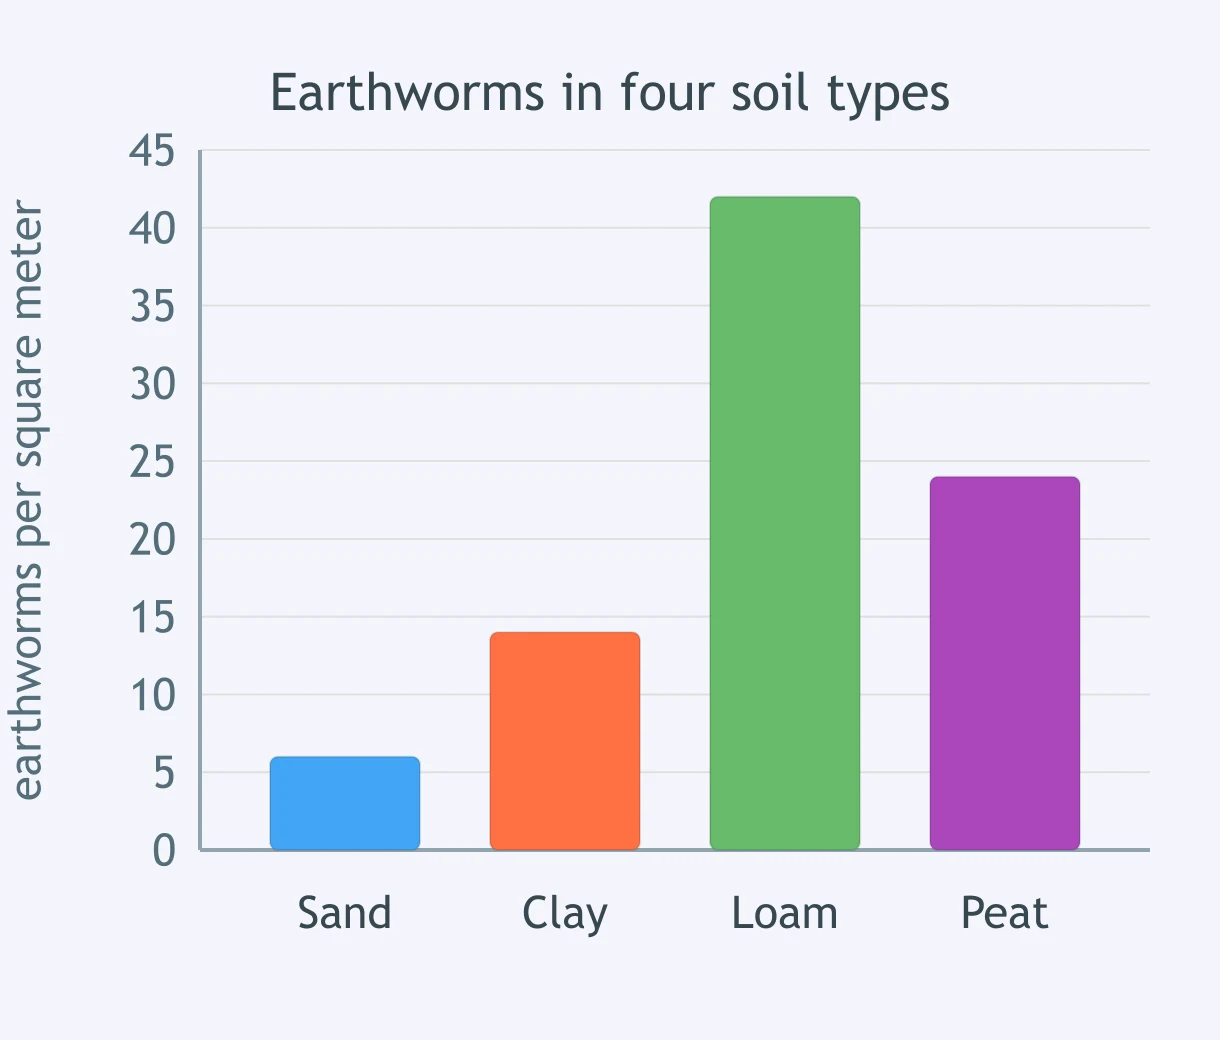
The bar graph shows the mean number of earthworms per square meter in four soil types. How many more earthworms per square meter were counted in loam than in clay?
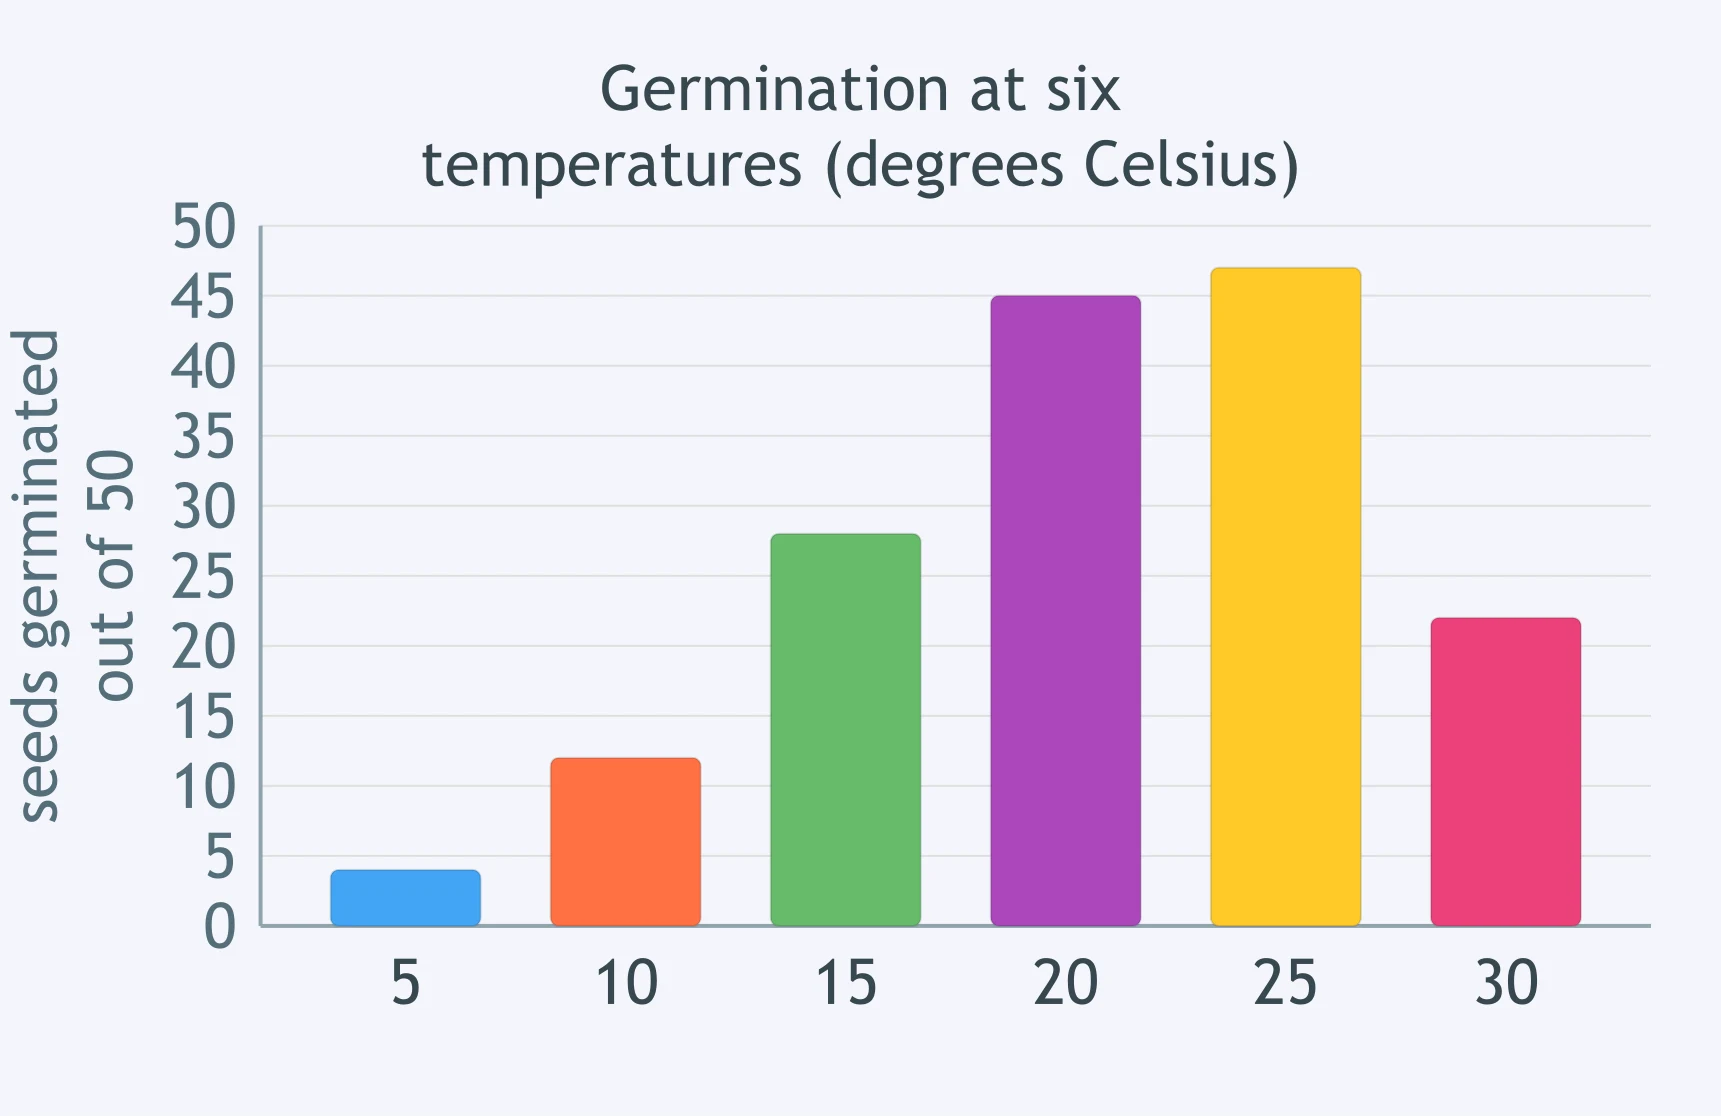
The bar graph shows how many of 50 seeds germinated at each of six temperatures in degrees Celsius. Which statement best describes the pattern?
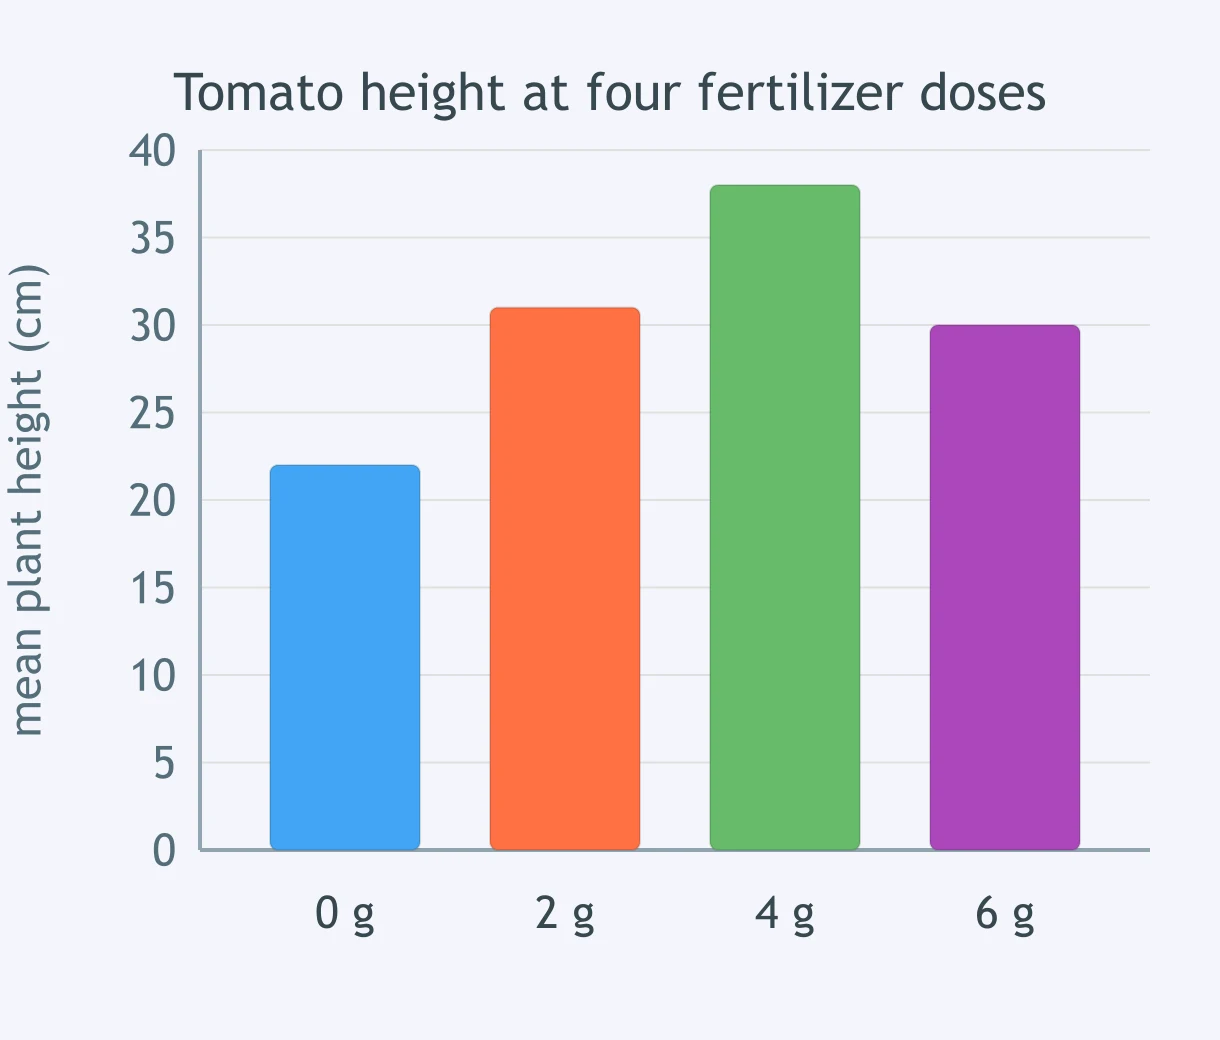
The bar graph shows the mean height of tomato plants given four doses of fertilizer. Which conclusion is NOT supported by these data?
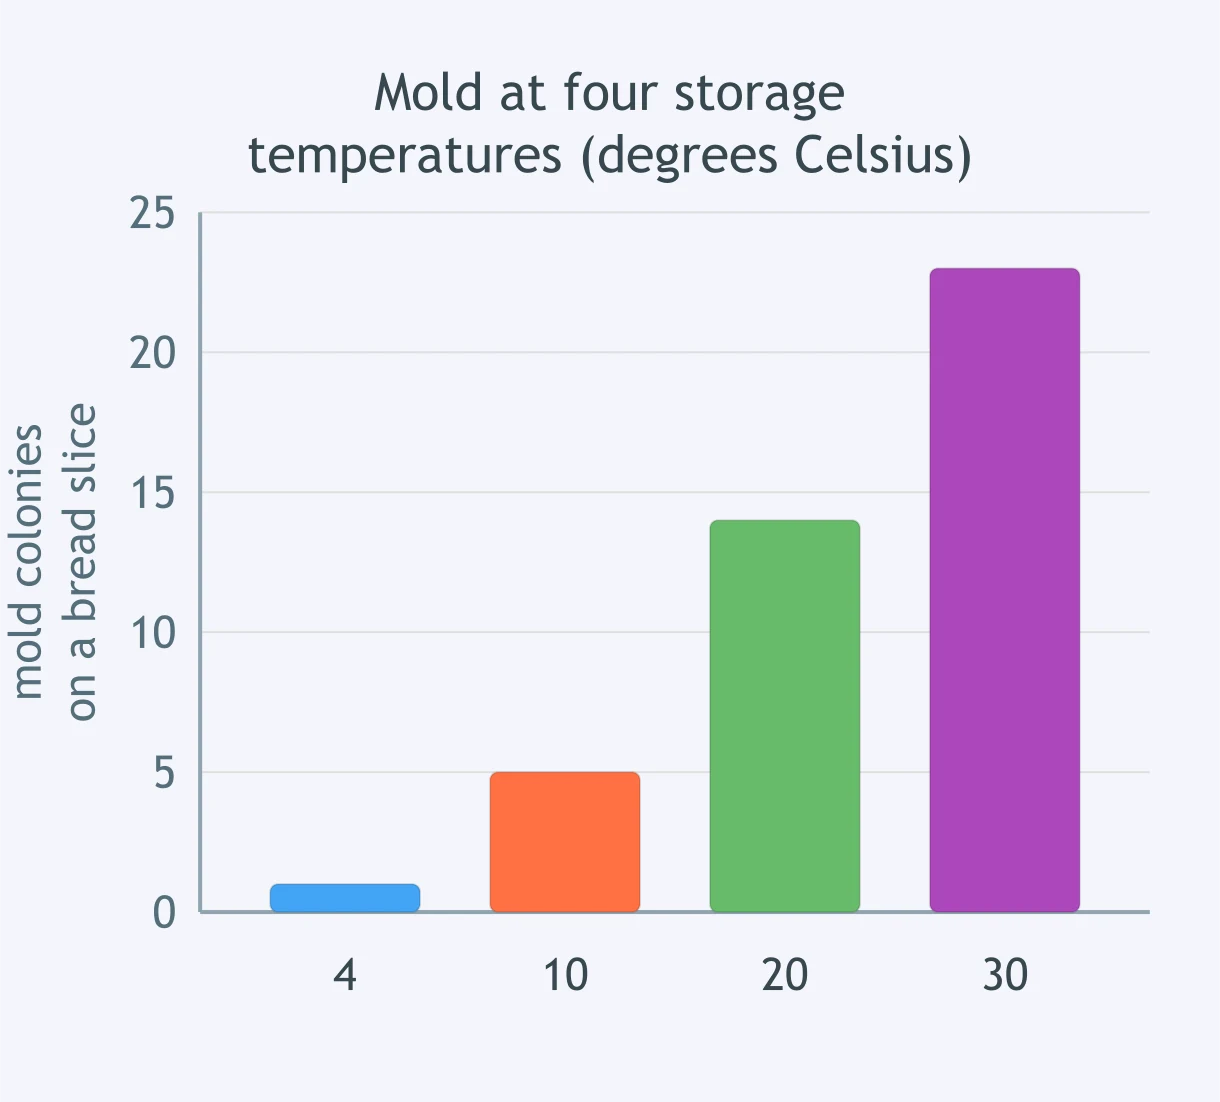
The bar graph shows the number of mold colonies grown on bread slices stored at four temperatures in degrees Celsius. Which table would hold exactly the same data correctly?
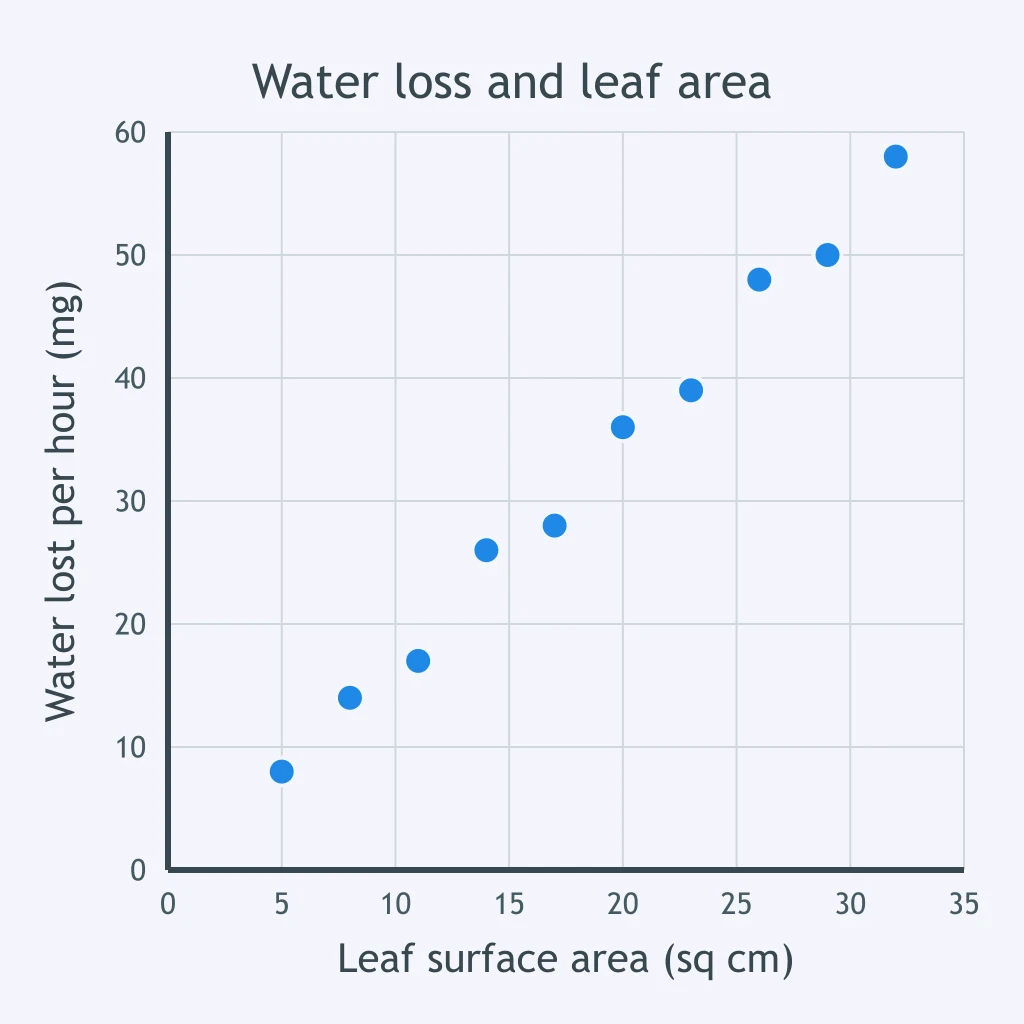
The scatter plot shows water lost per hour against leaf surface area for ten leaves. Which statement best describes the relationship shown?
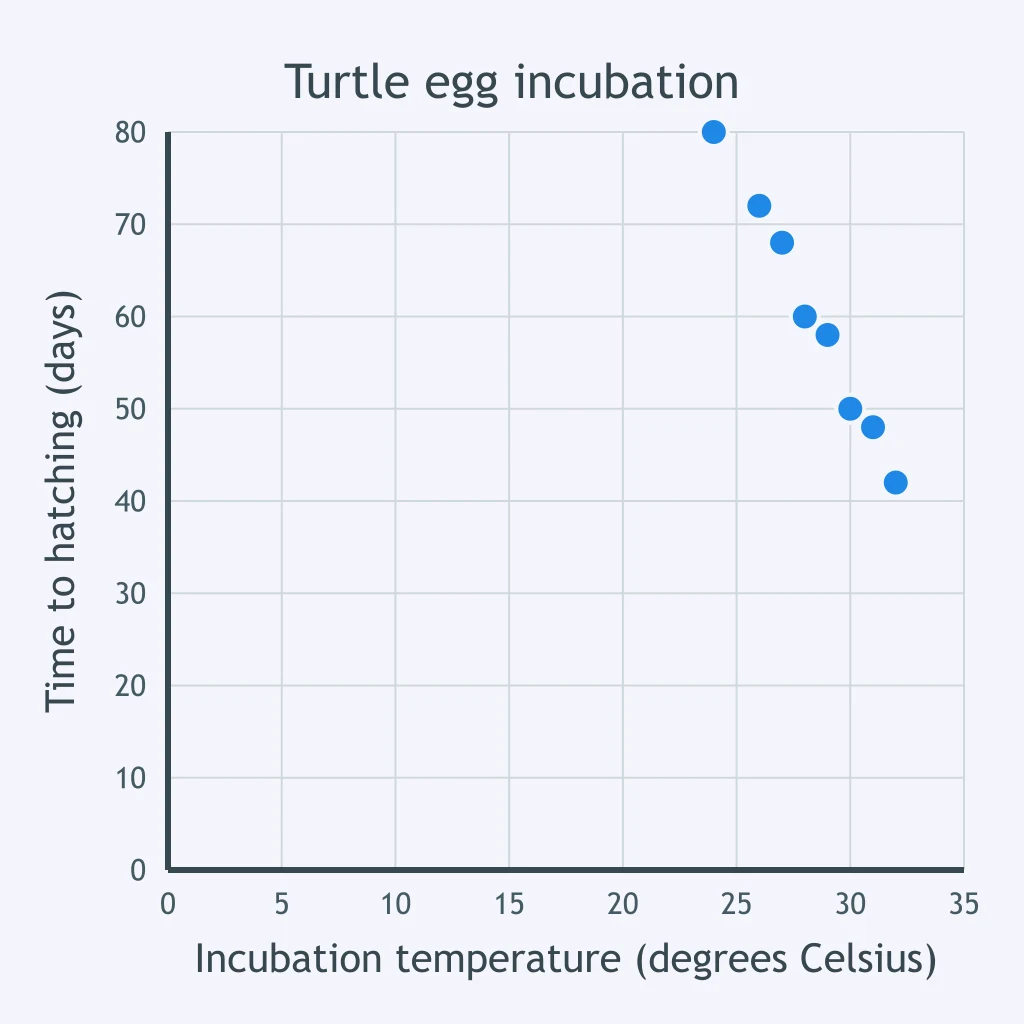
The scatter plot shows time to hatching against incubation temperature for turtle eggs. About how long did the eggs incubated at 28 degrees Celsius take to hatch?
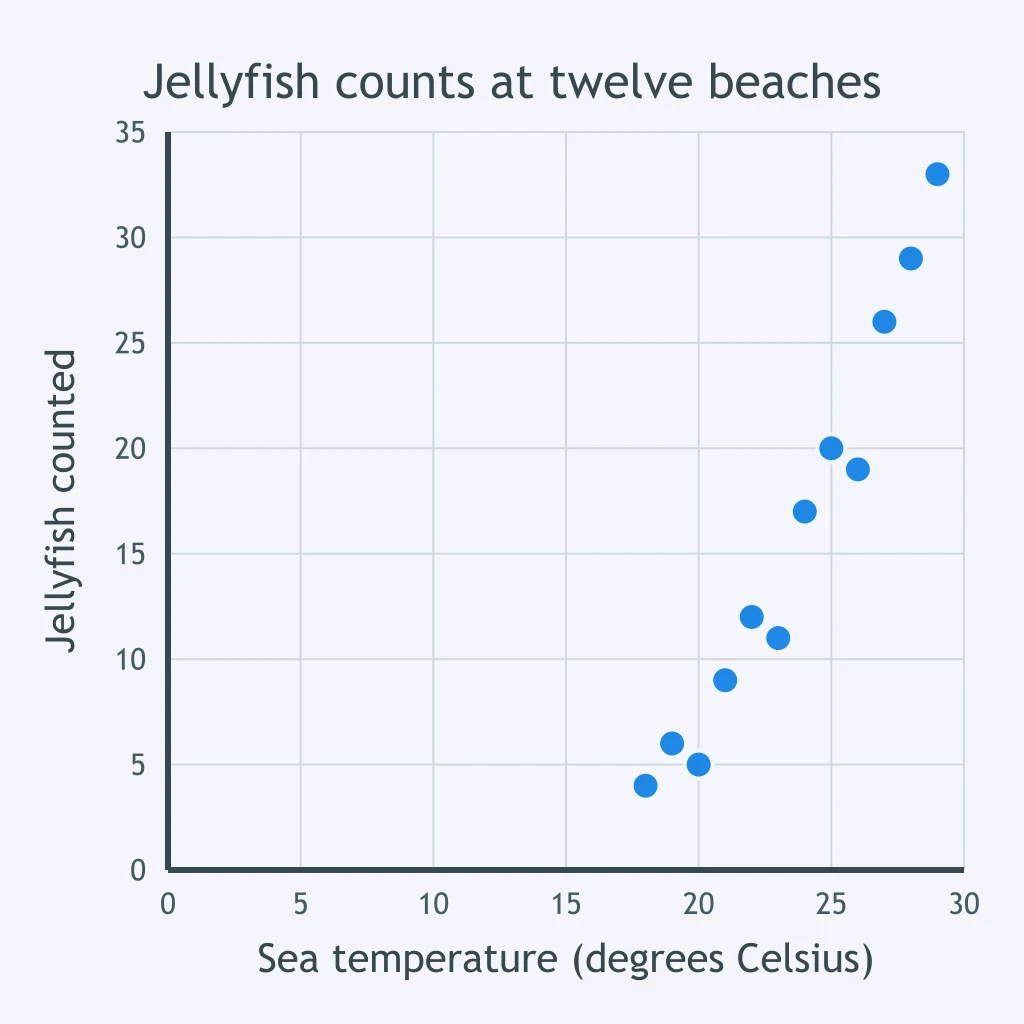
The scatter plot shows jellyfish counts against sea temperature at twelve beaches. Which conclusion is NOT supported by these data?
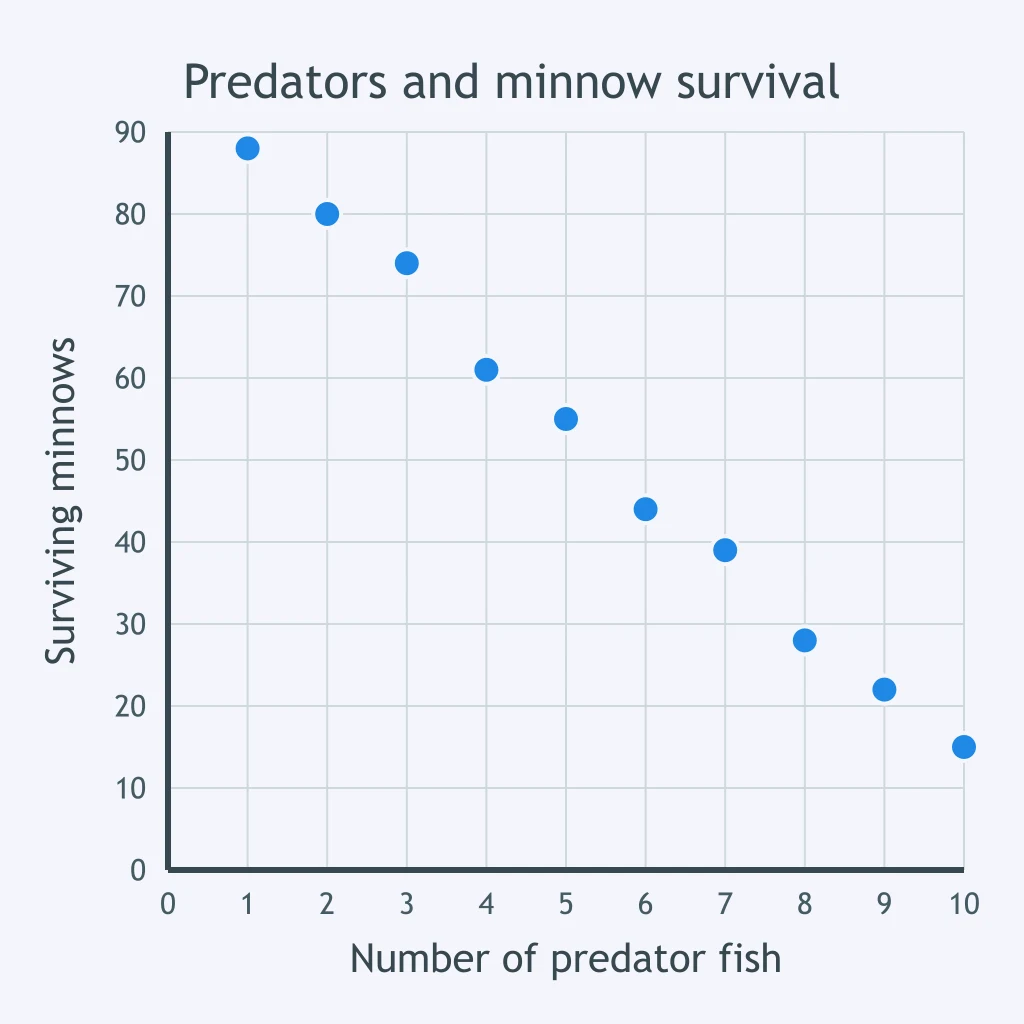
The scatter plot shows the number of surviving minnows against the number of predator fish in each of ten tanks. As the number of predator fish increases, what happens to the number of surviving minnows?
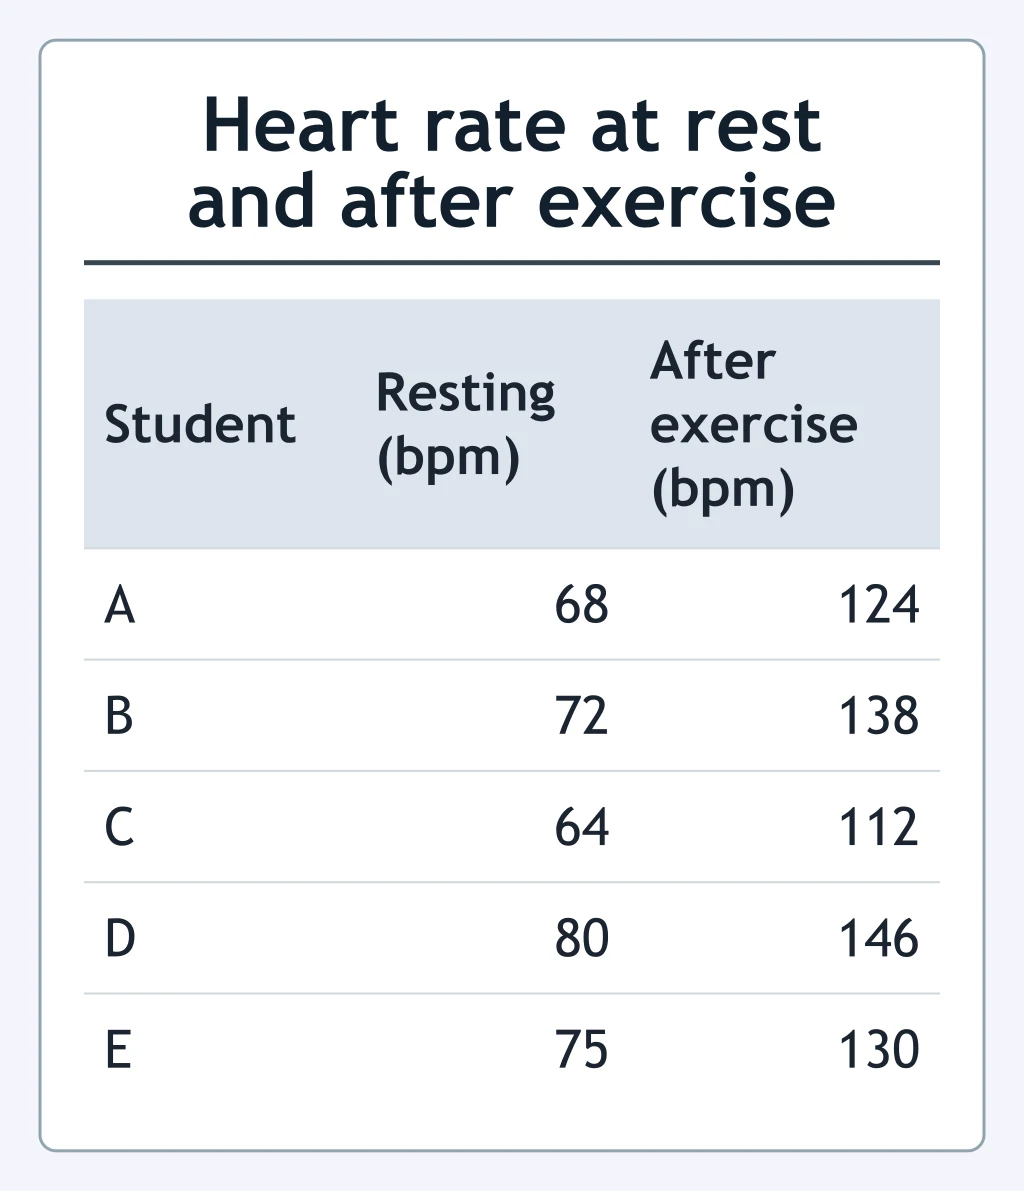
The table shows five students' heart rates at rest and after exercise. What was student C's heart rate after exercise?
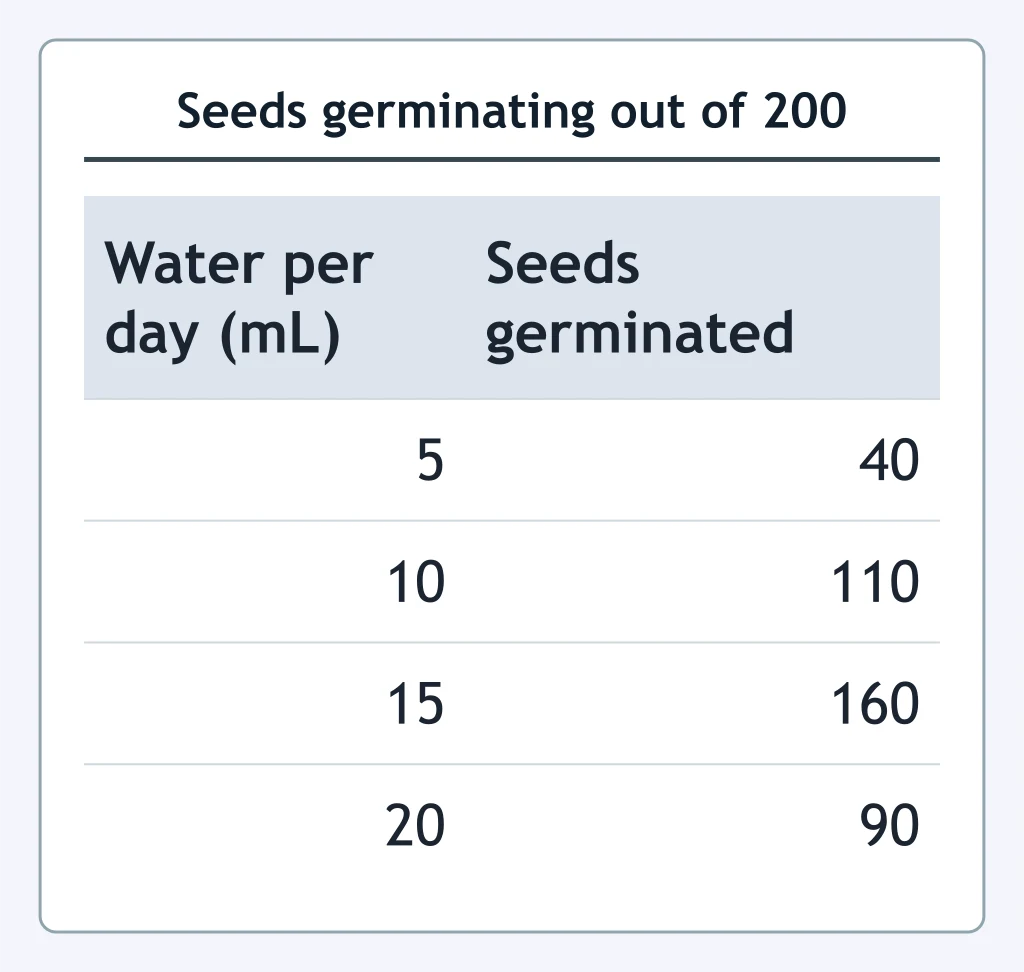
The table shows how many of 200 seeds germinated at each of four daily water volumes. What percentage of the 200 seeds germinated at 15 mL per day?
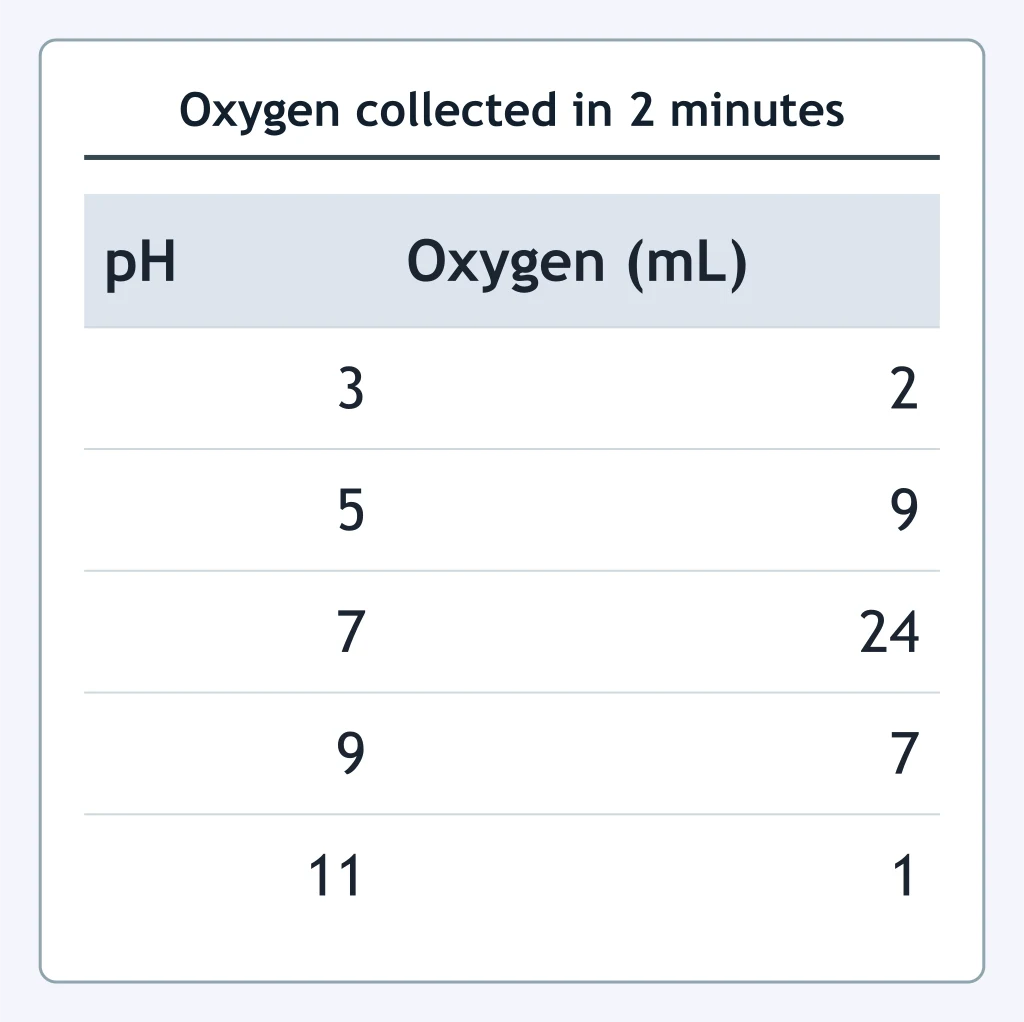
The table shows the volume of oxygen a catalase reaction released in two minutes at five pH values. How many more milliliters of oxygen were collected at pH 7 than at pH 5?
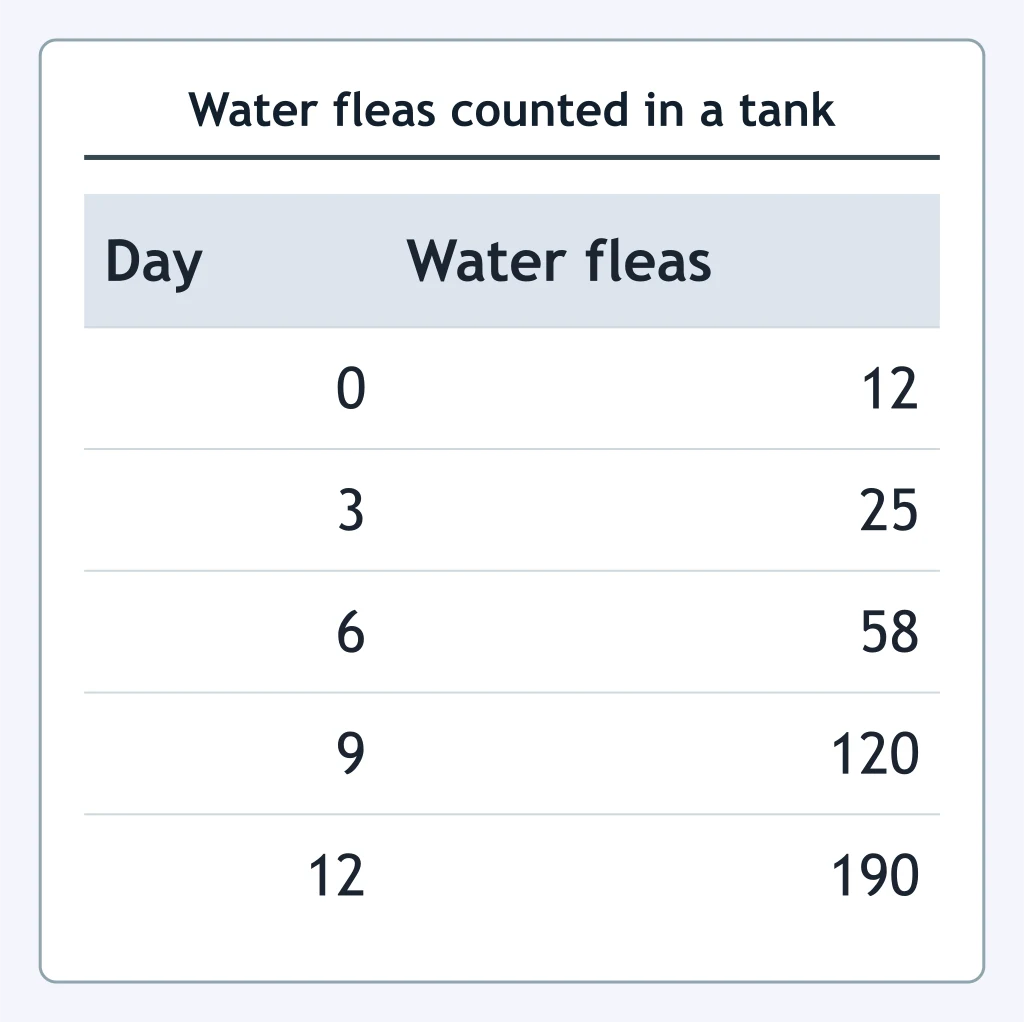
The table shows the number of water fleas counted in one tank every three days. Which display would best show how that number changed over the 12 days?
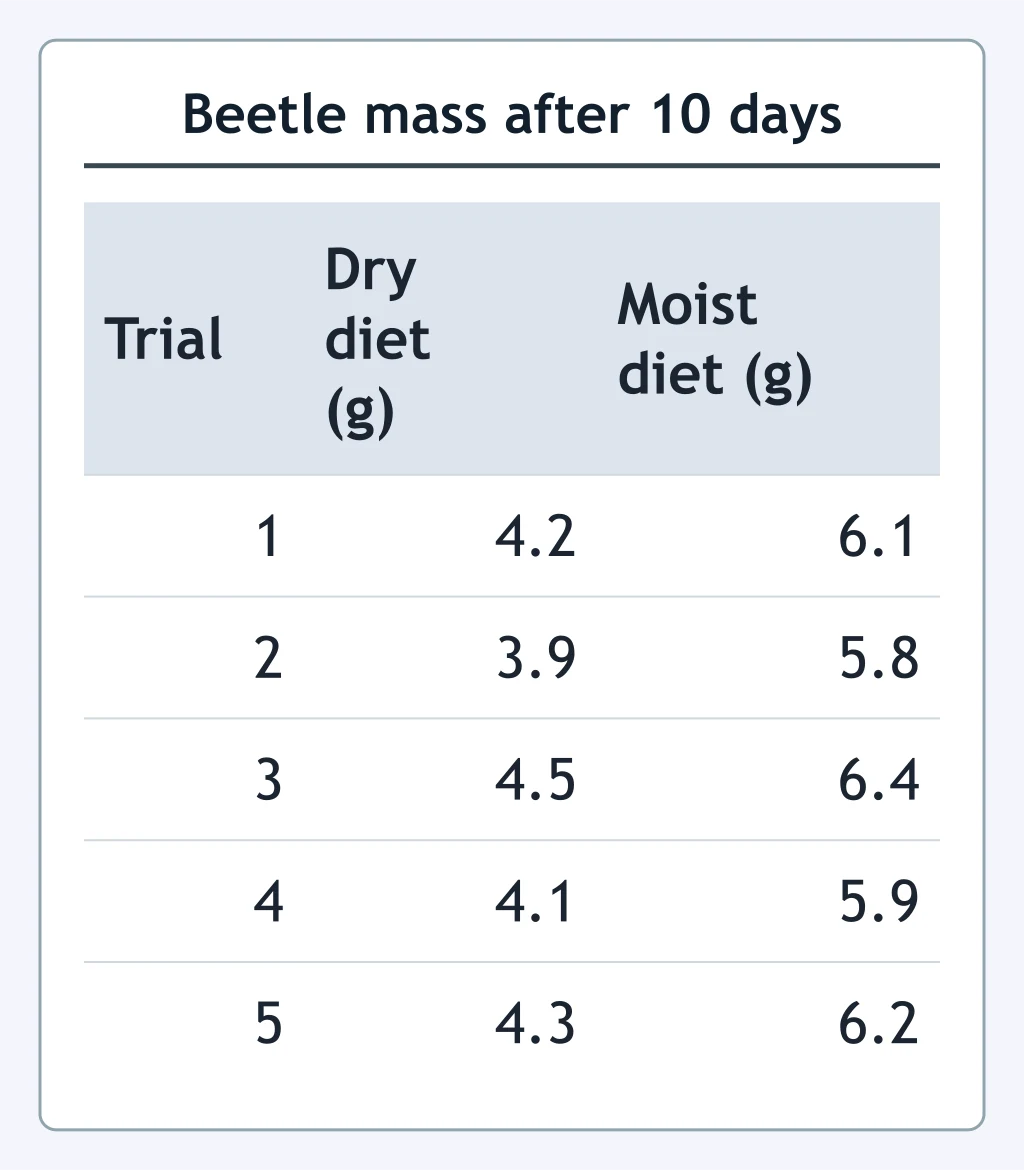
The table shows the mass of beetles after 10 days on two diets, with five trials of each diet. What is the correct way to organize these results so the two diets can be compared?
Crack the passcode before the zombies get in.
Answer, then swat bugs for bonus points.
Race through questions at your own speed.
Same question on every screen. Fastest wins.

Pick a tile, answer, hit bonuses and steals.
Water and Life
20 questions